
Inventory of federal greenhouse gas emissions fiscal year 2019 to 2020
The Government of Canada is committed to delivering a low-carbon, clean growth economy and reducing greenhouse gas emissions. We are sharing the emissions we currently track from our operations. Going forward we are committed to sharing a more comprehensive footprint.
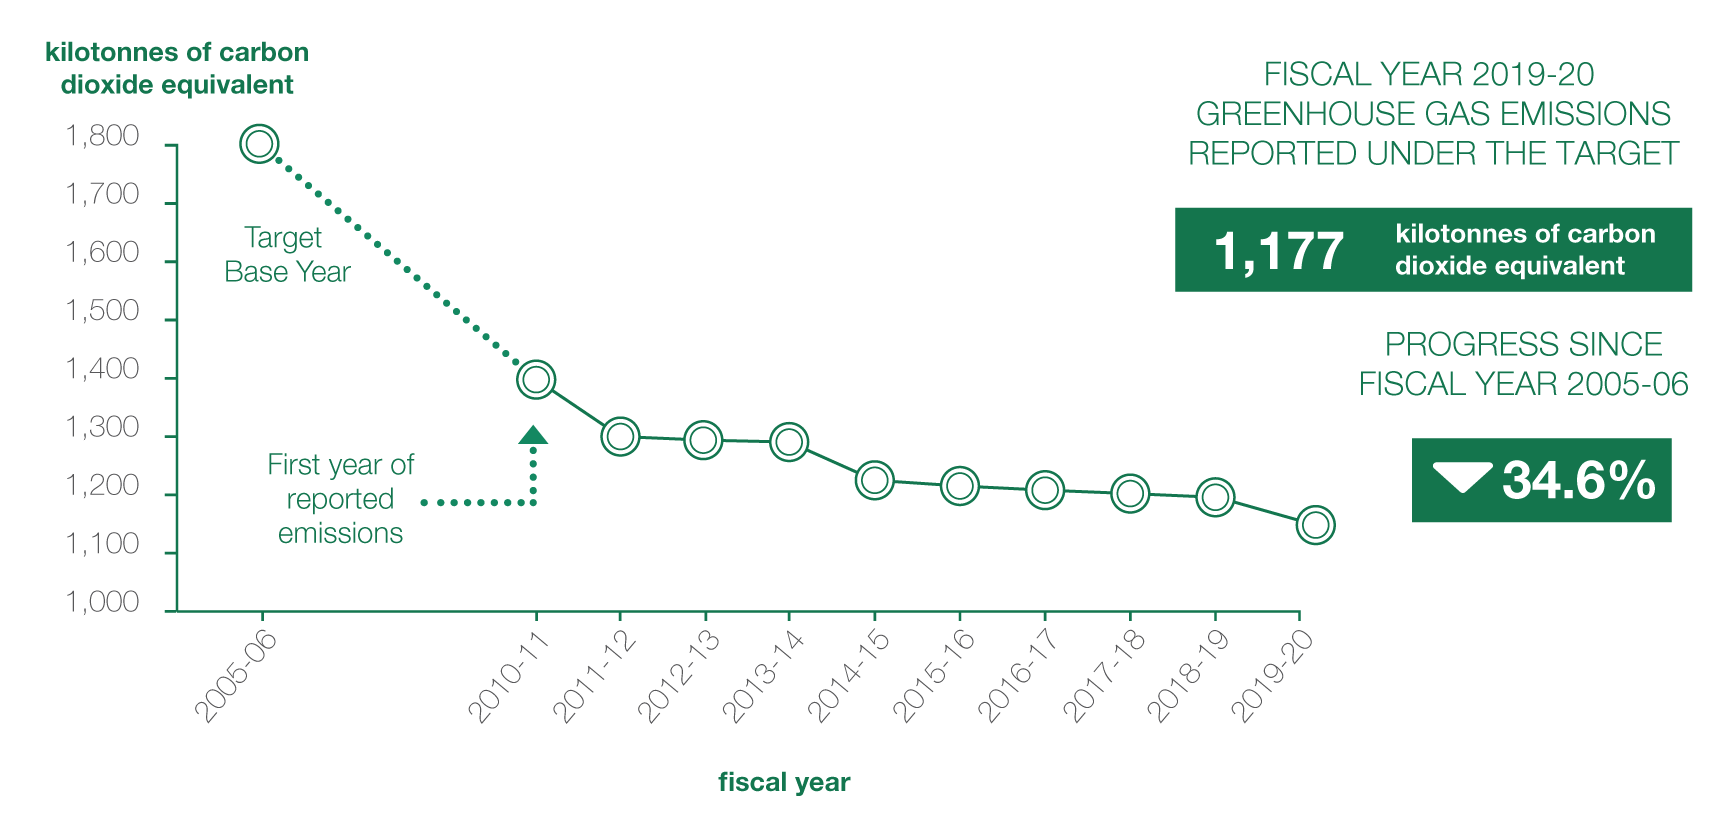
Figure 1. Greenhouse gas emissions reported from real property and administrative fleet operations - Text version
Total federal greenhouse gas (GHG) emissions (in kilotonnes of carbon dioxide equivalent) from real property and administrative fleet operations reported under the target in fiscal year between 2005 to 2006 and 2019 to 2020. In fiscal year 2019 to 2020 the federal government reported 1,177 kilotonnes of carbon dioxide equivalent, which represents a 34.6% reduction since fiscal year 2005 to 2006.
Facilities generated 90% of federal greenhouse gas emissions from real property and administrative fleet operations in the 2019 to 2020 fiscal year
| Fleets | Facilities |
|---|---|
| 10% | 90% |
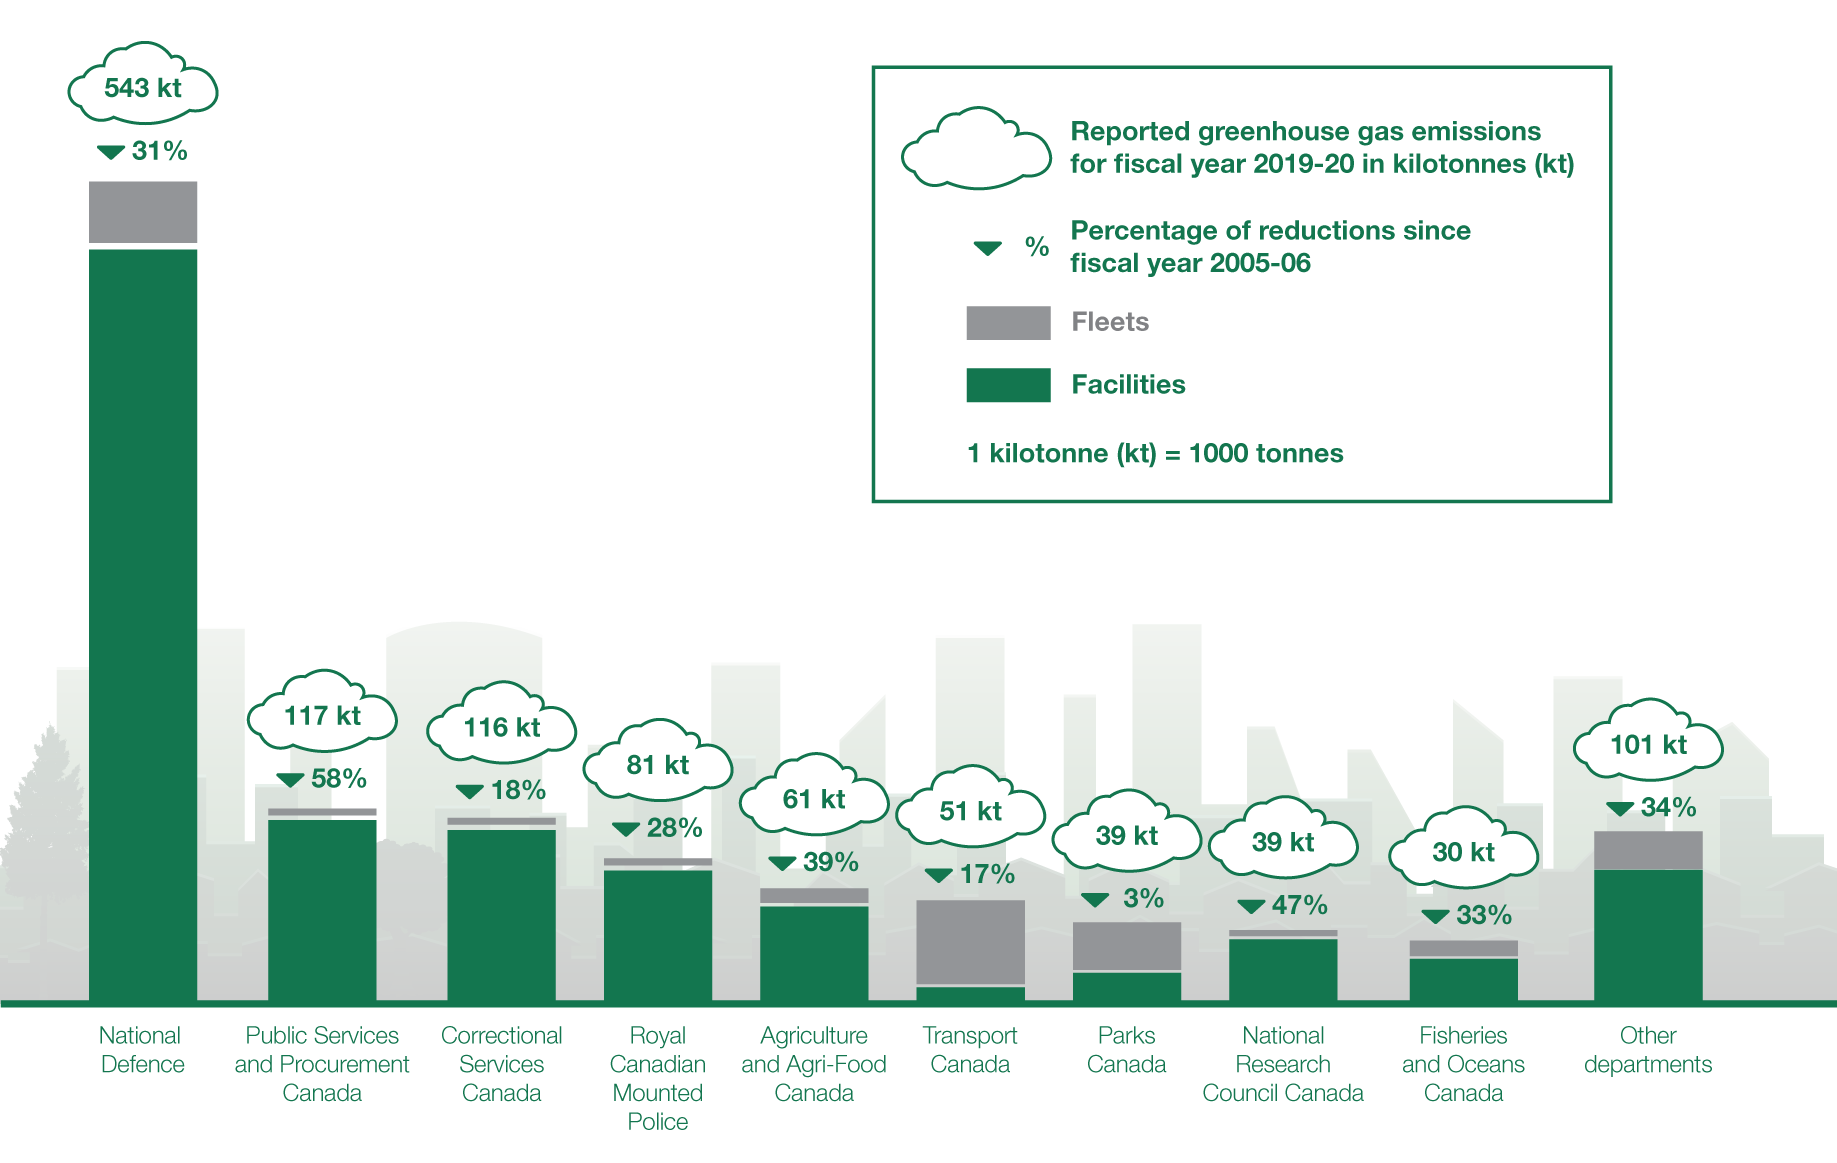
Figure 2. Reported federal greenhouse gas emissions from real property and administrative fleet operations in fiscal year 2019 to 2020 and reductions since 2005 - Text version
Total federal GHG emissions (in kilotonnes of carbon dioxide equivalent) from real property and administrative fleet operations reported under the target in fiscal year 2019 to 2020, by federal organization. GHG emissions are separated by facilities or fleet. The percentage reduction since fiscal year 2005 to 2006 is also shown for each federal organization.
The following table provides an overview of results:
| Federal organization | Emissions from facilities for fiscal year 2019 to 2020 (kt CO2 eq) | Emissions from fleets for fiscal year 2019 to 2020 (kt CO2 eq) | Total emissions for fiscal year 2019 to 2020 (kt CO2 eq) | Percentage change compared with fiscal year 2005 to 2006 |
|---|---|---|---|---|
| National Defence | 515.4 | 27.4 | 542.8 | -31% |
| Public Services and Procurement Canada | 116.1 | 0.8 | 116.8 | -58% |
| Correctional Service Canada | 113.0 | 3.1 | 116.1 | -18% |
| Royal Canadian Mounted Police | 78.8 | 2.4 | 81.2 | -28% |
| Agriculture and Agri-Food Canada | 56.5 | 4.2 | 60.7 | -39% |
| Transport Canada | 5.0 | 46.1 | 51.1 | -17% |
| National Research Council Canada | 37.7 | 1.1 | 38.8 | -47% |
| Parks Canada | 24.5 | 14.4 | 38.9 | -3% |
| Fisheries and Oceans Canada | 22.3 | 7.2 | 29.5 | -33% |
| Canadian Food Inspection Agency | 17.8 | 3.6 | 21.4 | -35% |
| Natural Resources Canada | 19.2 | 0.8 | 20.0 | -42% |
| Environment and Climate Change Canada | 10.7 | 3.2 | 13.9 | -35% |
| Canada Border Services Agency | 7.2 | 4.3 | 11.5 | -10% |
| Health Canada | 10.9 | 0.4 | 11.3 | -50% |
| Public Health Agency of Canada | 6.9 | 0 | 6.9 | -4% |
| Public Safety Canada | 3.9 | 0 | 3.9 | -45% |
| Library and Archives Canada | 2.6 | 0 | 2.6 | -12% |
| Crown-Indigenous Relations and Northern Affairs Canada | 2.2 | 0.1 | 2.3 | 29% |
| Indigenous Services Canada | 0 | 2.0 | 2.0 | -10% |
| Innovation, Science and Economic Development Canada | 0.7 | 0.9 | 1.6 | -50% |
| Canadian Space Agency | 1.2 | 0 | 1.2 | -46% |
| Shared Services Canada | 0.3 | 0.7 | 1.0 | N/A |
| Canadian Forces Morale and Welfare Services | 0.67 | 0 | 0.67 | -73% |
| Employment and Social Development Canada | 0 | 0.3 | 0.3 | -79% |
| Canada Revenue Agency | 0 | 0.2 | 0.2 | -48% |
| National Battlefields Commission | 0.16 | 0 | 0.16 | -18% |
| Immigration, Refugees and Citizenship Canada | 0 | 0.04 | 0.04 | -58% |
| Total | 1,054 | 123 | 1,177 | -34.6% |
Sources of greenhouse gas emissions from real property and administrative fleet operations in the 2019 to 2020 fiscal year
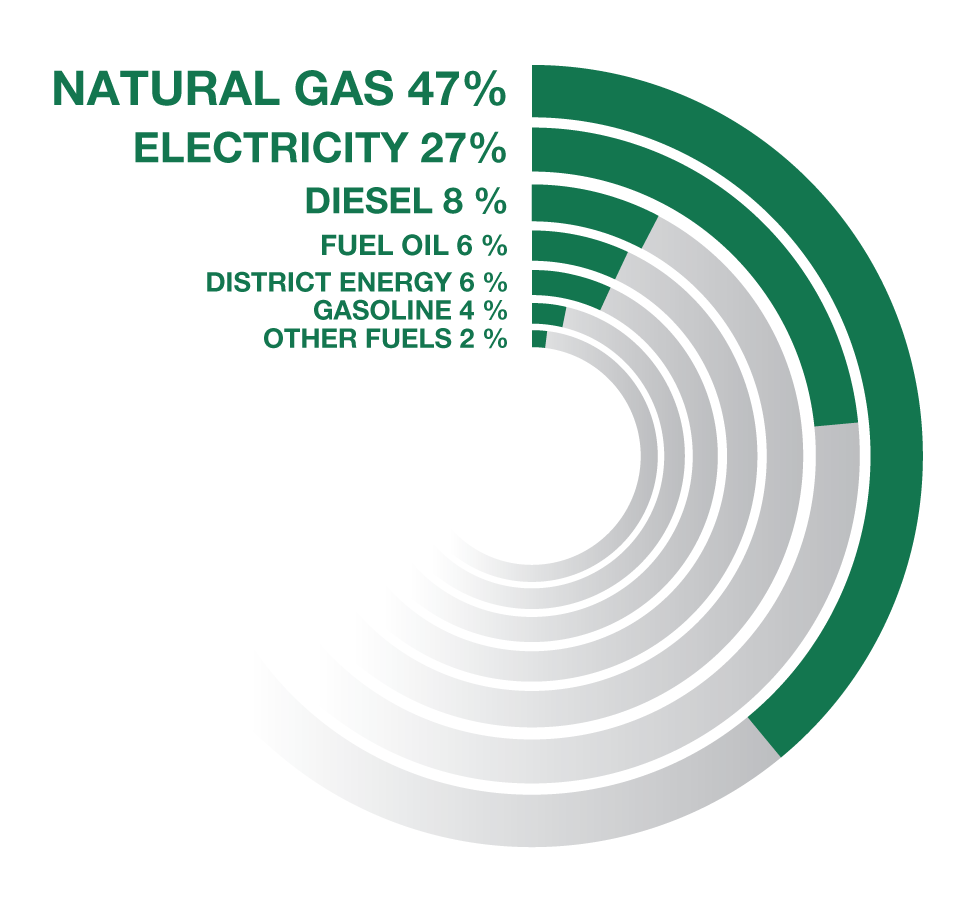
Figure 3. Sources of greenhouse gas emissions from real property and administrative fleet operations reported in the 2019 to 2020 fiscal year
Sources of federal GHG emissions from real property and administrative fleet operations reported under the target in fiscal year 2019 to 2020, by energy category. From highest to lowest; natural gas (47%), electricity (27%), diesel (8%), fuel oil (6%), district energy (6%), gasoline (4%), and other fuels (2%).
Sources of greenhouse gas emissions from federal fleets under the target in the 2019 to 2020 fiscal year
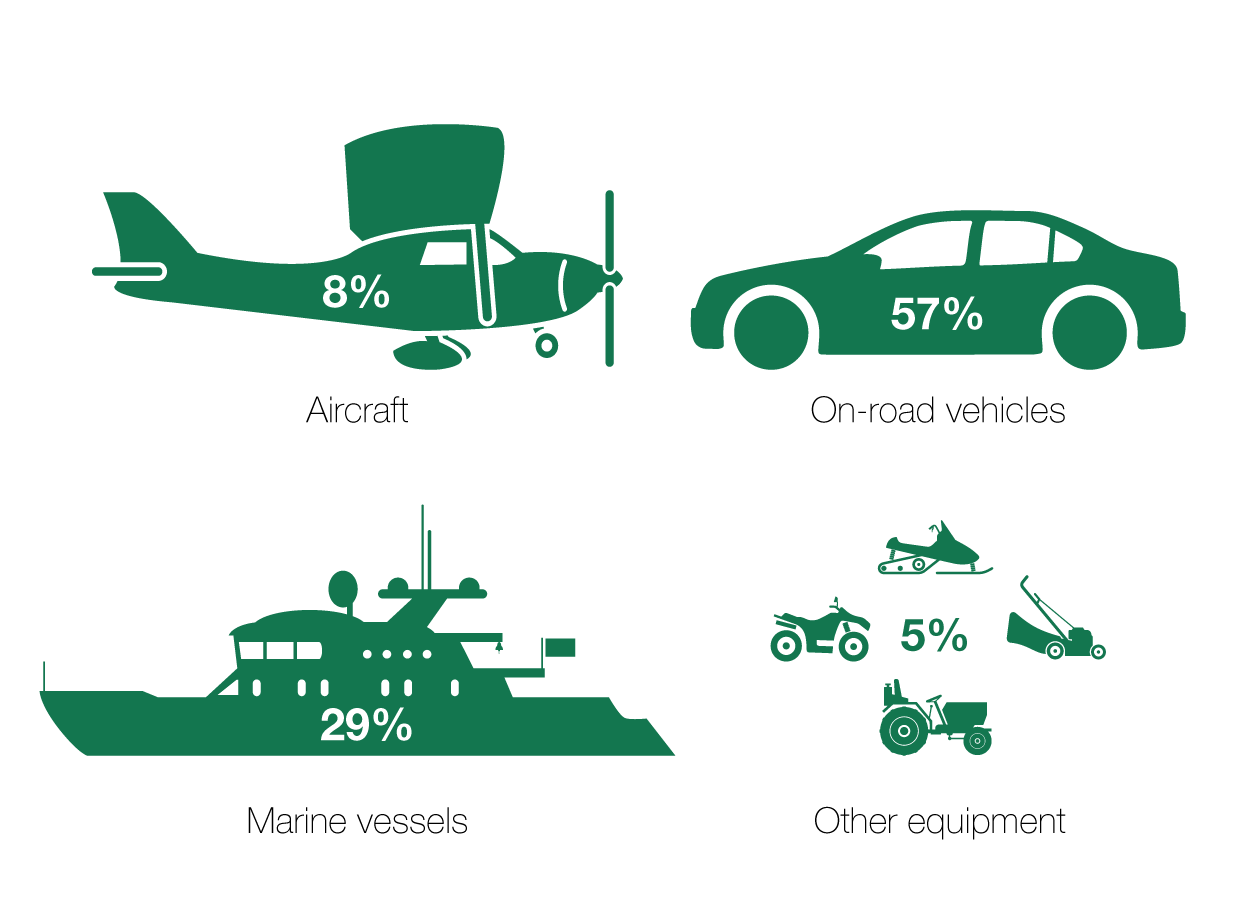
Figure 4. Sources of greenhouse gas emissions from federal fleets reported in the 2019 to 2020 fiscal year - Text version
Sources of GHG emissions from the federal fleet reported under the target in fiscal year 2019 to 2020. From highest to lowest; on-road (57%), marine vessels (29%), aircraft (8%), and other equipment (5%).
Fiscal year 2019 to 2020 greenhouse gas emissions from federal facilities by province/territory
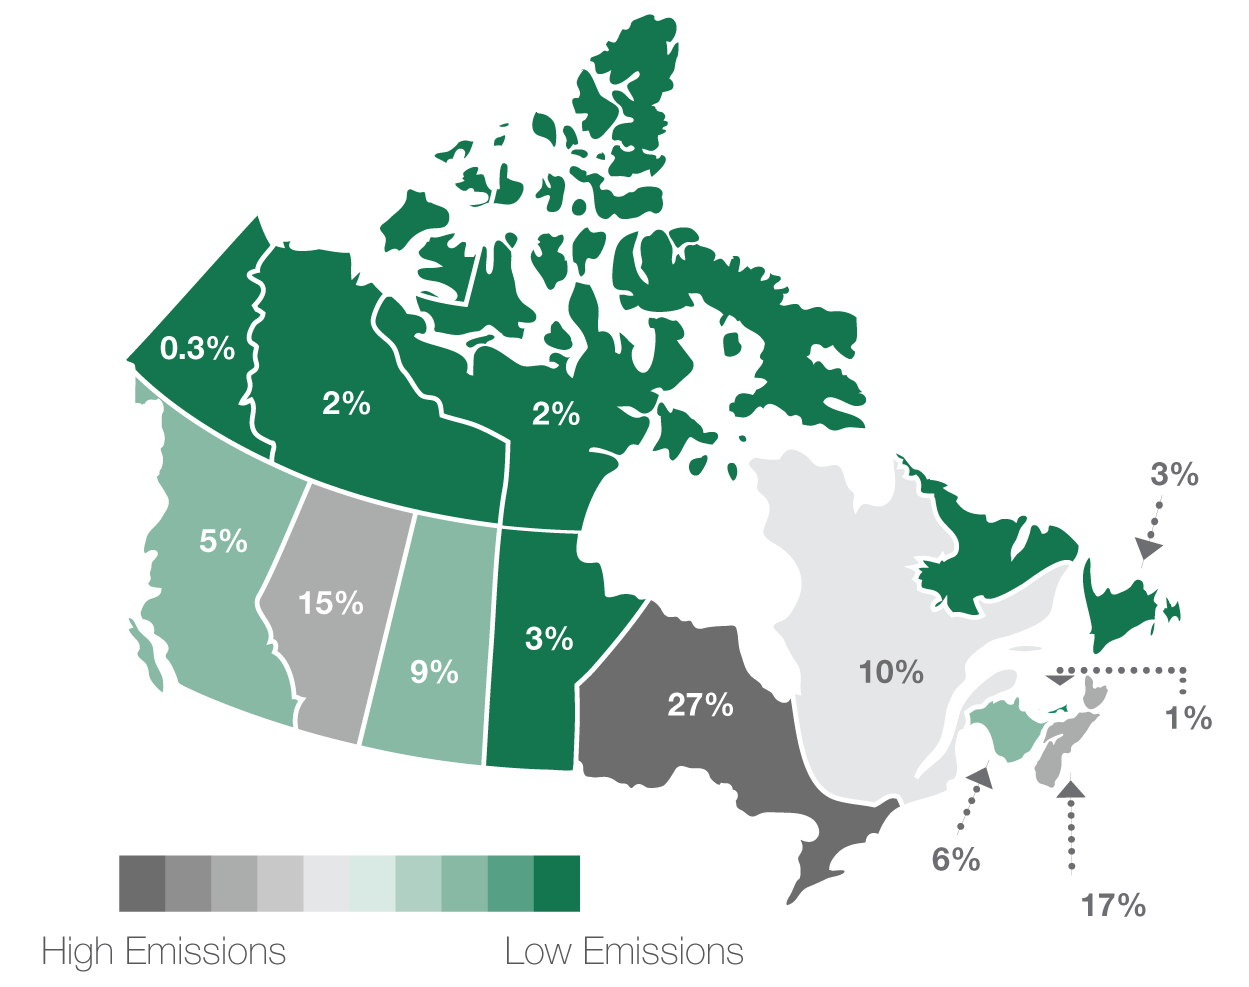
Figure 5. Fiscal year 2019 to 2020 greenhouse gas emissions from federal facilities by province/territory - Text version
A map of Canada displays the significance of GHG emissions from federal facilities in each province/territory, reported in fiscal year 2019 to 2020. These GHG emissions are a result of federal operations located in Ontario (27%), Nova Scotia (17%), Alberta (15%), Quebec (10%), Saskatchewan (9%), New Brunswick (6%), British Columbia (5%), Manitoba (3%), Newfoundland and Labrador (3%), Northwest Territories (2%), Nunavut (2%), Prince Edward Island (1%), and Yukon (0.3%)