
Control of Pollutants in Museums and Archives – Technical Bulletin 37
Jean Tétreault
CCI Technical Bulletins
Technical Bulletins are published at intervals by the Canadian Conservation Institute (CCI) in Ottawa as a means of disseminating information on current techniques and principles of conservation of use to curators and conservators of Canada’s cultural objects and collection care professionals worldwide. The author welcomes comments.
Abstract
This Technical Bulletin proposes guidelines for the optimal control of pollutants in museums, archives and any other heritage institution. It identifies common sources of pollutants and objects at risk. It offers multi-level actions to reduce pollutant levels and to minimize uncertainties when evaluating risks. Special attention is given to highly vulnerable objects, for which tailored preservation specifications are suggested. Two aspects of preventive conservation are covered in detail: the filtration of airborne pollutants at the building level and monitoring. The monitoring section contains various possibilities for collecting data on different scenarios, from the overall building to a narrow investigation on what could have damaged a specific object. Please note that the information provided does not deal with health and safety issues.
Author
Jean Tétreault studied at the University of Montréal, where he received a Master’s degree in Analytical Chemistry in 1989. That same year he joined CCI, where he currently works as a Senior Conservation Scientist in the Preventive Conservation Division. His main research interests focus on pollutants, products used for display and storage, paper degradation and passive environmental controls in collections. Results of his research have been published in various peer-reviewed journals. He has given more than 100 seminars in Canada and Western Europe on preventive conservation issues such as lighting, environmental guidelines, display cases and exhibit and storage materials. Jean is the author of Airborne Pollutants in Museums, Galleries, and Archives: Risk Assessment, Control Strategies, and Preservation Management, a book published by CCI in 2003. He co-authored the “Museums, Galleries, Archives, and Libraries” chapter in the 2019 edition of the ASHRAE Handbook: Heating, Ventilating, and Air-Conditioning Applications. Since 1998, he has also been a board member on the Indoor Air Pollution Working Group, which holds conferences every two years.
Disclaimer: The information in this document is based on the current understanding of the issues presented. It does not necessarily apply in all situations, nor do any represented activities ensure complete protection as described. Although reasonable efforts have been made to ensure that the information is accurate and up to date, the publisher, CCI, does not provide any guarantee with respect to this information, nor does it assume any liability for any loss, claim or demand arising directly or indirectly from any use of or reliance upon the information. CCI does not endorse or make any representations about any products, services or materials detailed in this document or on external websites referenced in this document; these products, services or materials are, therefore, used at your own risk.
Table of contents
- List of abbreviations
- Introduction
- Definitions
- Source of pollutants
- Impact on objects
- Scenarios for objects at risk
- Strategies for the control of airborne pollutants
- Pollutant concentration limits
- High vulnerability objects
- Filtration
- Data collection
- Monitoring
- Mitigation
- Suppliers
- Appendix: Concentration units
- Bibliography
- Endnote
List of abbreviations
- AIC
- American Institute for Conservation
- ANSI
- American National Standards Institute
- ASHRAE
- American Society of Heating, Refrigerating and Air-Conditioning Engineers
- CCI
- Canadian Conservation Institute
- CN
- cellulose nitrate
- EPA
- Environmental Protection Agency
- HVAC
- heating, ventilation and air conditioning
- IAQ
- indoor air quality
- IIC
- International Institute for Conservation of Historic and Artistic Works
- IPI
- Image Permanence Institute
- ISO
- International Organization for Standardization
- IVL
- Swedish Environmental Institute
- LEED
- leadership in energy and environmental design
- LOAED
- lowest observed adverse effect dose
- MERV
- minimum efficiency reporting value
- NFPA
- National Fire Protection Association
- NOAEL
- no observed adverse effect level
- PM1
- particulate matter having an aerodynamic diameter of 1 µm
- PM2.5
- particulate matter having an aerodynamic diameter of 2.5 µm
- PM10
- particulate matter having an aerodynamic diameter of 10 µm
- ppm
- part per million
- ppb
- part per billion
- PVAC
- poly(vinyl acetate)
- PVC
- poly(vinyl chloride)
- RH
- relative humidity
- SMPTE
- Society of Motion Picture and Television Engineers
- VOC
- volatile organic compound
Introduction
Pollutants are among the 10 agents of deterioration, and they can have chemical reactions with any of the components of an object. Several pollutants are generated outside of heritage institutions and can infiltrate the storage and exhibition rooms. Other pollutants are generated inside museums and even in display cases. In some instances, the objects can emit harmful compounds, which can affect the objects themselves or other objects in their surroundings. Different strategies have been devised to control pollutants. However, a recent review of the published guidelines on pollutant control has made clear the need to simplify the message in order to avoid excessive control and to allow more flexibility (Tétreault 2018).
This Technical Bulletin goes a step further than CCI’s 2003 book Airborne Pollutants in Museums, Galleries, and Archives: Risk Assessment, Control Strategies, and Preservation Management. While both the book and this Bulletin give a complete picture of the issues of airborne pollutants and offer advice on minimizing the risk of damage in indoor heritage institutions, the Bulletin includes more detailed information on the filtration system in heating, ventilation and air-conditioning (HVAC) systems. Control strategies are also proposed from basic to advanced levels, which will help the user determine which one to consider. Please note that the information provided does not deal with health and safety issues.
Definitions
It is helpful to define certain terms used in the field of pollutant control in heritage institutions. This is especially true for the terms “pollutant” and “contaminant.” Each one has a specific meaning, which may differ from the meaning in other fields, such as materials science and the health sector. In addition, to avoid confusion in the document, a distinction is made between “materials,” “products” and “objects.”
Contaminant
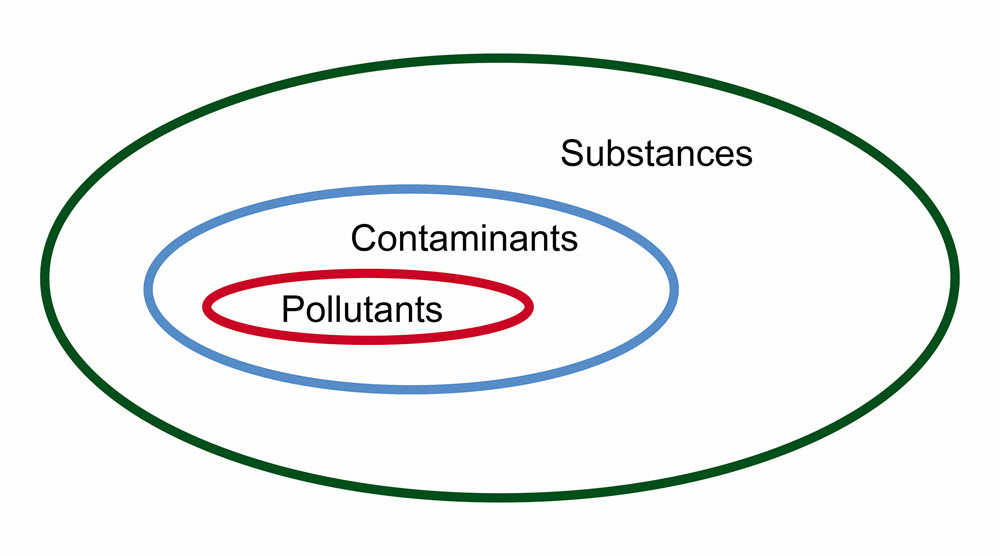
A contaminant can be a gas, an aerosol, a liquid or a solid of either anthropogenic or natural origin that is known to alter the purity of an object. If it can cause damage, it is considered a pollutant. In the preservation field, it is best to have a control strategy that focuses on pollutants, of which there are far fewer than 100 known compounds, rather than on contaminants, which are present in very large numbers.
As an example, a porous object such as an unglazed ceramic or a leather jacket may absorb various volatile compounds emitted by gasket products in enclosures (Schieweck and Salthammer 2009). These compounds are defined as contaminants as long as there is no evidence of damage. Another example is the absorption of formaldehyde in cellulose paper where no damage is observed (Tétreault et al. 2013). Consult Figure 1 for a graphical depiction of the difference between a contaminant and a pollutant.
© Government of Canada, Canadian Conservation Institute. CCI 120668-0001
Figure 1. Relationship between a substance, a contaminant and a pollutant. A contaminant is a substance on or in an object that does not cause damage. A pollutant is a substance on or in an object that has the capacity to cause damage.
Description of Figure 1
Diagram showing the relationship between a substance, a contaminant and a pollutant. The diagram is comprised of a large black circle, representing substances, containing a blue circle, representing contaminants. Within contaminants is a final red circle representing pollutants.
Enclosure
A structure or covering that completely surrounds and encloses a limited volume of space and in which one or several objects may be contained. Examples include plastic bags, display cases, storage cabinets, boxes and transportation crates. Note that an enclosure is constructed or assembled using one or many products.
Material
A substance that makes up an object or a product. Copper, oak and cotton are examples of materials.
Object
In this context, an object is an item that is collected by museums, archives or private individuals because the item is judged by society, or some of its members, to be of historical, artistic, social or scientific importance. Objects can be composed of one or many materials.
Pollutant
A pollutant can be a gas, an aerosol, a liquid or a solid of either anthropogenic or natural origin that is known to cause adverse effects (damage) on objects (Figure 1). A pollutant can acidify, corrode, discolour, disfigure and weaken materials. The following are five main ways that an object can be exposed to pollutants:
- through the air (originating outdoors or indoors);
- by falling debris (loose material falling on objects);
- via spills (intentional or not);
- when substances are transferred by contact (compounds transferred by contact between surfaces, such as degraded compounds from an acidic paper to a less acidic one); and
- by means of intrinsic pollutants (part of the original object or materials added during treatment).
An example of a pollutant is ozone, which can fade organic colourants and weaken the organic material structure. In some instances, water and oxygen behave as pollutants since water can react with cellulose via the hydrolysis reaction (Zou et al. 1996) and oxygen contributes to photooxidation (fading) of many colourants and acts directly on natural rubber (Williams 1997). This Bulletin focuses on airborne pollutants.
Product
A product is composed of one or many materials that can be used alone or assembled with other products into more complex, finished items. For example, plywood is a product made of two materials (wood and adhesive). Plywood can be used on its own as a platform, or it can be assembled with other products to make display cases or packing crates. More information about products and the damage they can cause through contact can be found in Technical Bulletin 32 Products Used in Preventive Conservation.
Volatile organic compound
The United States Environmental Protection Agency (EPA) defines a volatile organic compound (VOC) as “any organic compound which participates in atmospheric photochemical reactions” (U.S. EPA n.d.). Such reactions contribute to the formation of smog. At ground level, photochemical smog is made up of airborne particles and ozone, which are threats to both human health and heritage collections. The VOCs known to be harmful to objects are mainly low molecular weight carboxylic acids such as formic and acetic acid. No generic VOCs have been linked to specific types of damage in conservation. To better preserve collections, the focus should be on the concentration of specific pollutants in the room or inside a display case rather than on the total amount of VOCs.
Source of pollutants
Particles of differing sizes can infiltrate museums from the outside. Gaseous outdoor pollutants such as nitrogen dioxide and ozone can also penetrate all types of buildings, including modern HVAC-equipped facilities, when no gas filtration is present to remove them. Within buildings, there are different sources of airborne pollutants. The sources are related to institutional activities such as food preparation, service vehicles in the loading dock and renovations that occur during the preparation of new exhibitions. Construction products such as wood, paints, adhesives and sealants (especially those formed by chemical curing or solvent release) can be important sources of gaseous pollutants. Collections can themselves be sources of pollutants that can affect other objects nearby. Good examples are archival materials such as cellulose nitrate and acetate films, as well as acidic papers. Collections made of natural organic materials such as leathers, fur and wood elements can also release harmful volatile compounds. The metabolism of staff and visitors also contributes to airborne pollutants, as well as coarse particles from their clothing and the shedding of skin cells. Sources of common airborne pollutants and objects at risk are summarized in Table 1.
| Airborne pollutants | Indoor and outdoor sources | Effects on materials |
|---|---|---|
| Aldehydes |
Note: Low molecular weight aldehydes such as formaldehyde and acetaldehyde can be transformed into their respective carboxylic acids in the presence of strong oxidants such as peroxides released by oil-based paints or paint films formed by oxidative polymerization. |
|
| Amines |
|
|
| Carboxylic acids |
|
|
| Nitrogen oxide compounds |
|
|
| Oxidized sulfur gases |
|
|
| Ozone |
|
|
| Particles (fine and coarse) |
|
|
| Reduced sulfur gases |
|
|
| Water vapour |
|
|
| Oxygen |
|
|
Impact on objects
Dust is a general problem for all collections. More precisely, dust deposits affect an object’s aesthetic appearance as well as conservation considerations (such as cleaning frequency and the risk involved during treatments). Coarse dust is easier to remove from robust surfaces such as flat glass or metal and more difficult to remove from fragile surfaces such as feathers. HVAC filters do not usually remove particles generated by people since their suspension time is too short to reach the return air ducts.
Another challenge is fine particles such as black soot. This is a typical problem for museums near high-volume diesel vehicle traffic. Special conservation skills are needed to remedy this situation, but even in the best circumstances, there are cases where soot cannot be removed. For example, in Figure 2, soot entrenched in the cracks of an ivory sculpture cannot be removed. Also, it may not be possible to remove soot from fragile textiles, as significant physical damage can occur during the cleaning treatment.

© Government of Canada, Canadian Conservation Institute. CCI 100548-0006
Figure 2. Detail of a gothic ivory casket made in the late 1300s. The object has fine black horizontal lines, which are the consequence of encrusted soot.
The impact of gaseous pollutants varies according to the sensitivity of each material. Acetic acid corrodes lead but is harmless to silver, while silver is very sensitive to hydrogen sulfide, but lead is only minimally affected. Ozone attacks most organic objects but has little effect on metals. In other words, the potential damage is very specific to each pollutant-material system. A list of objects sensitive to various pollutants is presented in Table 1. Less common pollutants can also affect collections (Thickett 2018). Damage caused to objects by pollutants is usually cumulative, irreversible and disfiguring.
Water vapour has both an indirect and a direct impact on many types of materials. In the presence of high relative humidity (RH), many processes of deterioration accelerate. An example of an indirect effect that is greatly impacted by RH, especially above 75%, is the increase in corrosion rates of many metals caused by pollutants. For example, formaldehyde does not corrode lead at 75% RH, but corrosion can occur at 100% RH (Thickett 1997). Water vapour can directly affect some materials by hydrolysis. This is the case for cellulose papers, cellulose acetate and cellulose nitrate plastic films. If there is just moisture in the cellulose fibres, deterioration is slow; however, it increases when acids are present. This reaction is called acid-catalyzed hydrolysis. Over time, the acids created as by-products of cellulose degradation speed up the reaction even further (Dupont et al. 2007; Zou et al. 1996). To maximize the preservation of objects affected by pollutants, particularly those made of metal, it is usually best to keep the RH low.
RH and temperature also influence rates of pollutant emission from materials. A hot and humid environment will result in a higher emission rate. Both the selected RH and temperature levels must be compatible with the appropriate environmental control required for the preservation of organic or composite collections. Oxygen in the indoor environment may also react with objects. In particular, natural rubber is known to degrade by oxidation, and many colourants are vulnerable to fading in the presence of oxygen and light.
Some work has been done to quantify the impact of pollutants on various materials, based on the concept of the lowest observed adverse effect dose (LOAED). This dose (yr μg/m3) is derived using the reciprocity principle: if a critical adverse effect is observed on an object after one year at an average of 1000 micrograms per cubic metre (μg/m3) of a pollutant, the same damage could occur after 10 years at an average of 100 μg/m3.
When extensive data exists for a pollutant-material system, a no observed adverse effect level (NOAEL) can be determined with some confidence. For example, in a study of the effect of acetic acid on (untarnished and pure) lead at different concentrations and RH for a year, a NOAEL for the acetic acid-lead system was established at 430 μg/m3 (Tétreault et al. 1998).
The concepts of LOAED and NOAEL are useful tools to assess the risk of damage caused by airborne pollutants. Extensive sets of LOAED data and some NOAEL data have been compiled in Airborne Pollutants in Museums, Galleries, and Archives: Risk Assessment, Control Strategies, and Preservation Management. Still more experiments in mild conditions are needed to determine more accurate LOAED and NOAEL for different pollutant-material systems.
The concentration of gaseous pollutants can be reported either in gravimetric units (μg/m3) or in volumetric units (parts per billion [ppb]). A concentration conversion tool can be found in the Appendix.
Scenarios for objects at risk
In general, there are three scenarios where objects can be at risk in heritage institutions. These are objects exposed to
- outdoor pollutant infiltration,
- pollutants generated in small enclosures and
- indoor-generated pollutants (in rooms).
Outdoor pollutant infiltration
The first scenario is outdoor pollutant infiltration. This is a problem in polluted areas where unprotected objects in rooms are exposed to outdoor pollutants that were not adequately blocked at the building level (the building envelope and the filtration system). Soot deposits on surfaces and the tarnishing of silver and copper by reduced sulfur compounds are common types of damage observed under these conditions. An assessment must be done to decide if better control should be carried out at the building level or if some objects should be placed in enclosures such as display cases, glazed frames or storage containers. For protection against pollution, as well as for security reasons, many small objects are placed in display cases and paintings can be placed in glazed frames. However, not all items on exhibit or in storage can be enclosed.
Pollutants generated in small enclosures
The second risk scenario is when objects are placed in enclosures. Products used to build the enclosure as well as the objects themselves can release volatile compounds (Table 1), which can react with the objects enclosed. The pollutants are usually carboxylic acids (Figure 3) and reduced sulfur gases. Their concentrations can be high and can remain so for a long time if they cannot be exfiltrated or sorbed adequately. The best preventive solution is to select construction products carefully and to evaluate the potential emission of pollutants from the objects on display.
If problematic products or objects cannot be removed from the enclosure, the next best approach is usually to reduce the pollutant concentrations in the enclosure by increasing the air exchange rate. However, an assessment needs to be done to determine what degree of airtightness is the most suitable. The assessment must consider the concentration of pollutants in the room and in the enclosure as well as considering both the nature of the pollutants and the objects in the enclosure.
© Government of Canada, Canadian Conservation Institute. CCI 128118-0002
Figure 3. Brass-plated lead item corroded in a display case made of varnished oak. Note the deposits of white dust, which are assumed to be lead corrosion compounds.
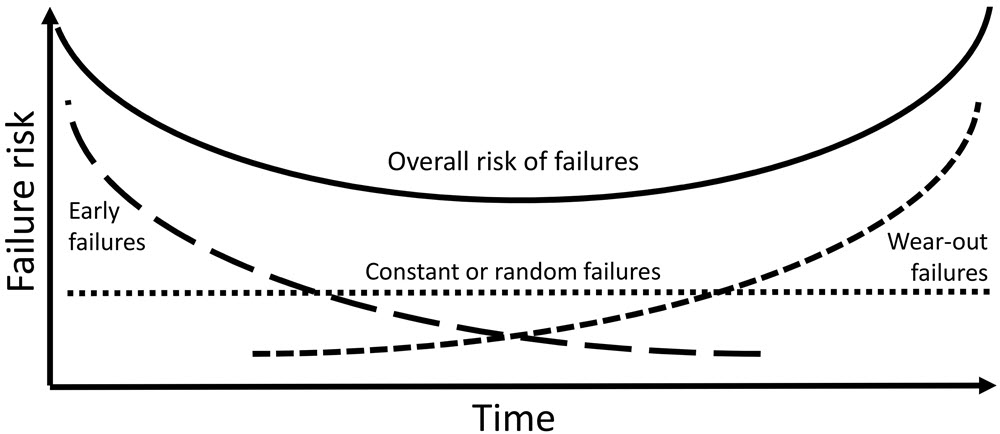
An important consideration in the selection of products used by museums and archives is the change in chemical and physical properties over time. The bathtub curve in Figure 4 summarizes this issue well. Some products are problematic for museums during their early life, especially products formed through solvent evaporation or chemical reactions. This is the case for liquid paints, sealants and adhesives. When they no longer contain free volatile compounds, they are usually safe for objects in enclosures. Over the long term, some organic products may become so deteriorated by hydrolysis, oxidation, radiation, thermal reaction or physical stresses that they can no longer maintain their desired initial properties. Volatile compounds not present in the early life of the product can be released at this stage, which can cause harm to some objects. Another possible scenario is a random, or constant, failure pattern indicated by the horizontal line in Figure 4. The overall risk of failures is characterized by the shape of a bathtub. Further information regarding the risks posed by products at different stages of their useful life can be found in Technical Bulletin 32 Products Used in Preventive Conservation.
© Government of Canada, Canadian Conservation Institute. CCI 120668-0003
Figure 4. This graph illustrates the risk of failure at different stages of a product’s life. A bathtub curve is formed by the summation of three primary failure patterns: early failures that decrease with time, wear-out failures that increase with time and constant or random failures over time.
Description of Figure 4
Bathtub curve schema demonstrating the relationship between a substance, a contaminant and a pollutant. There are four vectors displayed on the graph, which measures the failure risk (on the y-axis) over time (x-axis). The vectors are the following:
- Early failure risk – starts as the highest but comes down exponentially as time passes.
- Constant or random failure risk – is the average value between the wear-out failure risk and early failure risk. Remains steady over time.
- Wear-out failure risk – starts as the lowest and goes up exponentially as time passes.
- The overall risk of failure – the average between the three other values.
Indoor-generated pollutants (in rooms)
The third risk scenario is similar to the issue of off-gassing in enclosures but at the scale of a room. This is the problem of indoor-generated pollutants. Objects displayed in a room with insufficient ventilation and with a high load of emissive materials can be at risk if the concentrations of the emissions become significant. The sources in the room can be products such as wood and paint, collections made of natural organic materials and emissions from human activities such as cooking and renovation. The indoor pollutants can also affect people in the space (ASHRAE 2019a). Possible solutions for minimizing the impact of indoor pollutants are better ventilation, gas filtration systems or enclosures.
The level of intervention for these three scenarios depends on different parameters, which will be covered in the next section.
Strategies for the control of airborne pollutants
In the past, the recommendations for maximum pollutant concentrations permissible in museums and archives were based on levels that only a limited number of major institutions could achieve with their HVAC systems. These levels were measurable with commercial monitors or with sensitive analytical methods (Tétreault 2018). In the 1980s, little information existed on the impact that pollutants such as acetic acid and nitrogen dioxide had on collections. As a precautionary measure, the stated advice for these pollutants was to “use the best available technology.” This expression became popular and, consequently, many institutions requested the specification “Best Available Control Technology,” or they requested very low limits of pollutant concentrations, without justification. Those low limits were often hard to achieve and maintain, resulting in expensive and unsustainable practices. In fact, target concentrations for pollutants were often simply neglected or ignored (consult Pollutant concentration limits).
Table 2 presents control strategies for pollutants based on progressive controls and on the reduction of uncertainties in the risk evaluation. The table has three levels of control, ranging from basic to advanced. The advanced level also includes considerations for special control strategies. Recommendations made at the building and enclosure levels provide additional considerations for each level of control.
| Level of control | Building with an HVAC system | Display cases and storage cabinets or boxes | Considerations |
|---|---|---|---|
| Basic: basic control of fine particles and avoidance of common problems found in enclosures |
|
|
|
| Intermediate: improved control of fine particles, which reduces the risk of damage and reduces uncertainties |
|
|
|
| Advanced and special cases: optimal control of airborne pollutants in the room; better quantification of the preservation performance, which allows optimal strategies for improvement |
|
|
|
Basic control level
At the basic control level, dust filter performance should at least be able to keep fine particles, or particulate matter having an aerodynamic diameter of 2.5 μm (PM2.5), below the maximum limit recommended by national ambient air quality standards for human health. Since 2020, the Canadian average limit has been set at 8.8 μg/m3 (Canadian Council of Ministers of the Environment 2014). This is easily achievable, in general, since most cities have an average concentration of PM2.5 below 10 μg/m3 (Environment and Climate Change Canada 2016).
Minimum efficiency reporting value (MERV) is a scale for assessing the performance of particulate filters. A dust filter with a MERV in the range of 8 to 10 is sufficient to keep the concentrations of fine particles below the Canadian limit with high confidence. The leadership in energy and environmental design (LEED) accreditation program requests a MERV 13 filter (U.S. Green Building Council 2006, pp. 387–389). Consult Filtration for information about filter performance rating systems.
If appropriate, enclosures should be well sealed to prevent the infiltration of pollutants already present in the room. Conservation professionals can provide information on a global strategy for the control of pollutants. Specifically, they can advise which objects in museums are typically at risk and provide guidelines for the proper selection of products for use in building enclosures. The goal of the basic level is to avoid or minimize, at reasonably low cost, most common short- and medium-term damage caused by pollutants in museums and archives. Consult Data collection level 1 (basic) for more information.
Intermediate control level
At the intermediate control level, the dust filtration efficiency should be higher than the recommendation for the basic level. A firm MERV 13 can be mandatory (consult Table 3 for options). Qualitative or semi-quantitative monitoring is suitable for new installations (rooms and enclosures), as well as some testing of the products prior to their use. Some deeper investigation can be done to identify vulnerable objects and to determine if emissions from the collections themselves can be a risk to other objects. This will not necessarily improve the preservation of the collection from pollutants, but it will reduce the uncertainties related to the conservation strategies in place. The strategy can be adjusted, if necessary, in light of the results. Consult Data collection level 2 (intermediate) for more information.
The RH level should be considered since it generally has an important influence on the rate of damage. Active (ASHRAE 2019b) or passive (Tétreault and Bégin 2018) control of RH should be considered.
Advanced control level
At the advanced control level, it is recommended that institutions take quantitative measurements of the airborne pollutants (gases and fine particles) outside the institution as well as in rooms and enclosures that contain very significant and vulnerable objects. This can be done for a new installation, during renovations or as needed. The maximum pollutant concentrations allowed can be based either on the limits shown in Table 2 for a general collection, which typically excludes objects at high or moderate risk, or on the target concentrations set for the general collection and/or for specific objects identified by the institution (consult Pollutant concentration limits). Quantitative measurement of the air exchange rate for enclosures that require high airtightness is also recommended. Knowing the airtightness will help to determine the quantity of moisture sorbent or pollutant sorbent needed for optimal climate control in the enclosure.
Measuring particle and gaseous pollutant concentrations and ensuring the airtightness of enclosures can support the strategy in place. They can also support a proper analysis of the risks to the overall collection or specific objects. Local environmental data, obtained from different levels of government agencies, can provide useful information on the outdoor climate. This analysis can help to decide the filtration performance needed for the rooms as well as the performance required for enclosures containing specific objects or collections. If the room is well controlled, leakage from enclosures may not be an issue. However, if it is hard to achieve adequate control in the room, then the collection can be better protected inside enclosures. Unfortunately, not all objects can be placed in enclosures for various reasons, such as size and access. The length of time allowed for an exhibition, and consequent exposure, can also be adjusted based on the results of the risk analysis. Consult Data collection level 3 (advanced) for more information.
For very vulnerable and/or significant objects, some special features can be considered for optimal preservation, such as positive air pressure enclosures (preventing dust infiltration in leaky cases), enclosures with gas sorbents (to reduce the amount of undesired gases that have been generated inside or have infiltrated the enclosure) and low-oxygen enclosures (to minimize oxidative reactions, including photooxidation). Consult Table 2 for references and High vulnerability objects for more information.
Pollutant concentration limits
Heritage institutions are used to aligning their environmental control standards with globally accepted RH and temperature ranges, which are promoted by leading institutions. Using the ASHRAE approach dating from 1999, there is no longer a single safe range for RH and temperature but rather different levels of control that museums can choose. They range from minimal up to a very tight environmental control (ASHRAE 2019b). Highly RH-sensitive collections will require good control, while an average RH-sensitive collection can be well preserved with moderate RH control. Some museums with an unsatisfactory level of control can target a higher level by retrofitting the building envelope and the HVAC system. A similar approach to the control levels can be applied to airborne pollutants.
For a general collection, the maximum allowable pollutant concentrations can be based on the limits shown in Table 2. The proposed limits, or targets, for key pollutants are
- 1000 µg/m3 (400 ppb) for acetic acid,
- 1 µg/m3 (0.7 ppb) for hydrogen sulfide and
- 10 µg/m3 for nitrogen dioxide (5 ppb), ozone (5 ppb) and fine particles.
These limits, which are also in the 2019 edition of the ASHRAE Handbook (2019b), should prevent low levels of damage to objects for at least one year. The limits are based on dose data collected for many types of materials (Tétreault 2003, p. 33). In practice, these limits are probably safe for many years unless there are significant interferences with other agents of deterioration. If these key pollutants are maintained below their respective limits, it is most likely that the damage other pollutants can cause will be prevented as well. It is important to note that objects at high or moderate risk, such as silver and lead, are excluded from the pollutant concentration limits as they need their own assessment (consult High vulnerability objects).
Other institutional pollutant targets are available and have been reviewed by the author (Tétreault 2018). Heritage institutions can set their own pollutant targets based on various considerations such as their mandate, their resources and the preservation needs of their collection. Targets can be set at the room level or for different types of collections. The institution can decide if it is best to maintain those pollutant control targets on a macro scale (in the exhibition and storage rooms) or micro scale (in enclosures). A conservation professional can help assign pollutant target concentrations that are aligned with the preservation policy of the institution (Tétreault 2003, pp. 65–76).
Before starting on an extensive monitoring campaign, it is best to have in mind some pollutant concentration limits defined by your own institution or proposed by other preservation authorities. This will help to determine which tests or instruments to use or even if some answers can be achieved by consulting different sections of this document or by consulting experts, thereby avoiding measurements.
High vulnerability objects
Some objects tend to be more vulnerable to inadequately controlled environments. The resultant damage caused by pollutants is widely reported in the conservation literature. To avoid or minimize this damage, special preservation controls are proposed for the following 12 types of vulnerable objects.
Silver and copper
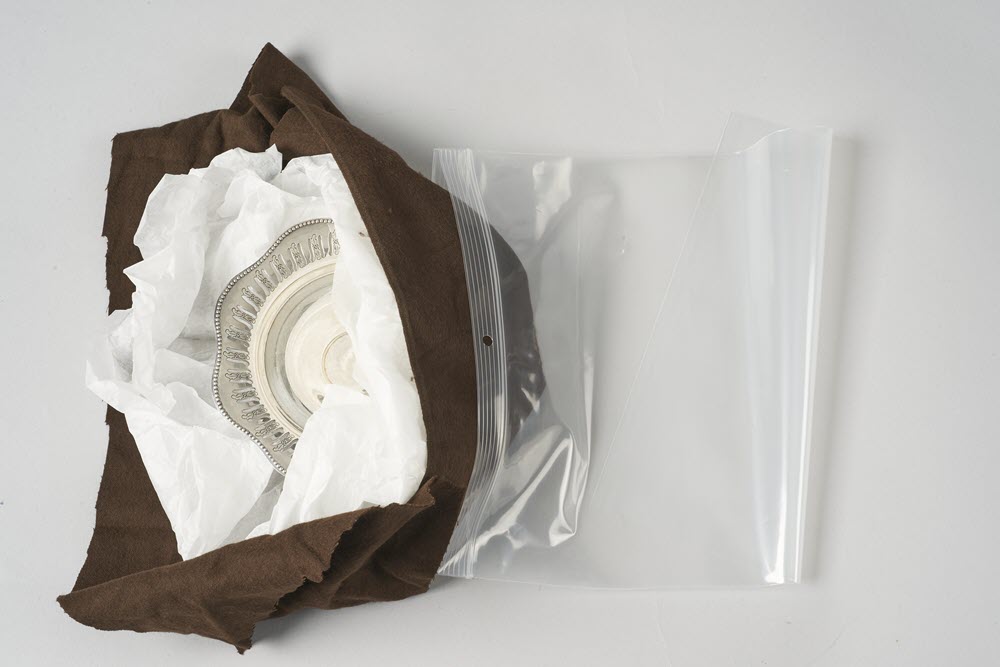
Silver is very sensitive to reduced sulfide compounds, mainly hydrogen sulfide and, to some extent, carbonyl sulfide. The sources of sulfur are many: from the outside, from people in the room (Ankersmit et al. 2005) and from products and collections inside enclosures (Table 1). It is usually best to keep silver objects in well-sealed enclosures with no sulfur-emitting products (Figure 5). The “Fire Fighting Measures” and “Stability and Reactivity” sections in the safety data sheet should be consulted for specific products to determine if they contain sulfur compounds, either hydrogen sulfide (H2S), carbonyl sulfide (COS) or sulfuric acid (H2SO4). If a sulfur compound is confirmed, the product should be avoided. It is also wise to confirm the absence of sulfur compounds in the product by running a spot test, such as the lead acetate test or Oddy test (Table 7). The same strategy can be applied for the preservation of copper, which is the second most vulnerable metal for sulfur compounds. The best monitoring method to quantify the risk of corrosion is with diffusive samplers (Table 6 and consult Suppliers).
© Government of Canada, Canadian Conservation Institute. CCI 125773-0069
Figure 5. A silver plate is wrapped in white tissue paper and a special brown fabric that contains a small amount of fine silver particles (Pacific Silvercloth), then enclosed in a polyethylene zip-lock bag. The fine silver particles in the fabric react with reduced sulfur gases, preventing them from reaching the silver object.
The LOAED for hydrogen sulfide for silver is 0.10 yr µg/m3; for copper the LOAED for hydrogen sulfide is 1.0 yr µg/m3 (10 times less sensitive than silver) (Tétreault 2003, p. 26). Complete dryness will minimize tarnishing but will not stop it. If the silver objects on display must remain shiny and clean, the heritage institution has to decide on an acceptable frequency for the first appearance of tarnish to occur and then establish a strategy to maintain the concentration. If the institution chooses a preservation target of a just noticeable tarnish only after 10 years, the concentration of hydrogen sulfide should be kept below 0.01 µg/m3 (concentration limit = dose/year = 0.10 yr µg m3 / 10 years). Only the diffusive sampler technique will allow a measurement of the H2S as low as 0.01 µg/m3. If it is hard to achieve and maintain a low enough concentration of H2S as defined by the preservation target, either the preservation strategy or the preservation target needs to be revised.
Lead
The vapour most harmful to lead is acetic acid. Lead is not usually at risk of corrosion in a room but may be at risk in enclosures. Any organic acid-emitting products or objects should be avoided in enclosures. Lead, with its NOAEL of 430 µg/m3 (consult Impact on objects), may never be safe in the presence of wood, painted wood products and freshly applied sealants or adhesives. The worst situation would be having lead present in an enclosure with a fresh coat of paint that is formed by oxidative polymerization, such as an oil-based paint. During the polymerization process, aldehydes, organic acids and peroxides are released. The peroxides can convert aldehydes into organic acids (Tétreault 2011; Raychaudhuri and Brimblecombe 2000).
Enclosing lead objects in a display case freshly sealed with acetoxy cure silicone will also put the lead at high risk of corrosion. An RH maintained below 35% will reduce the corrosion when the concentration of organic acids is above the NOAEL (Tétreault et al. 1998). In terms of monitoring, if the acidity detected by the pH strips with glycerol or acid-detector (A-D) strips is similar to the control, it is most likely that the concentration of acetic acid is below 430 µg/m3 (Table 5). The best monitoring method to quantify the risk of lead corroding is to measure acetic acid concentrations with diffusive samplers (Table 6).
Technically, lead is not as sensitive to acetic acid as silver, which can tarnish at a very low concentration of H2S. However, the concentration of acetic acid is commonly much higher than H2S, especially in wooden enclosures. This makes lead a material that is often at risk in museum environments.
Cadmium plating
Cadmium plating is widely used in different applications, such as in the military and in aviation. It offers excellent corrosion resistance in general, even at a relatively low thickness. However, as is the case with lead, cadmium is vulnerable to acetic acid, and the resulting corrosion products are toxic (Figure 6) (Scott and Derrick 2007). Still, there is no well-defined concentration limit. For safety and preservation reasons, cadmium-plated parts should be identified and should not be stored or displayed in enclosures having acetic acid emissions from materials.
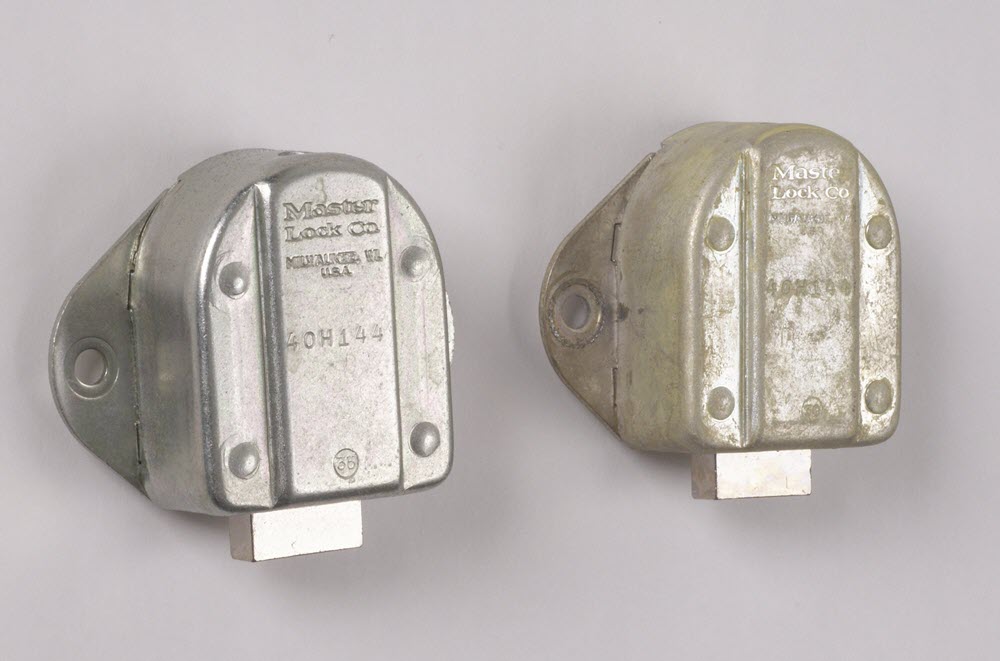
© Government of Canada, Canadian Conservation Institute. CCI 97196-0001
Figure 6. Two pieces of cadmium-plated iron hardware. The one on the right was in a wooden enclosure and was corroded by organic acid vapours. The one on the left has never been used and is in pristine condition.
Calcareous objects
Calcareous objects like limestone, ceramics and shells can react with organic acid vapours, especially when contaminated by chloride or nitrate salts (Halsberghe et al. 2005) in highly humid environments. No data exists to assess the vulnerability of these calcareous objects quantitatively. As a precaution, it is best to minimize the presence of acid-emitting products or objects in the enclosure, but it is also important to minimize RH and temperature fluctuations, and if possible, to lower the RH to prevent salt dissolution, reaction and migration.
Cellulose papers
For many decades, sulfur dioxide was thought to be the most damaging pollutant for paper. As its concentration in the environment decreased over the years, it was found that nitrogen dioxide was the main problem. Fine particles and ozone also affect unprotected paper (Gurnagul and Zou 1994; Bartl et al. 2016). Displaying art on paper without protection, such as glazed framing or display cases, is not recommended. However, it is also known that formic and acetic acids emitted by various organic materials can affect cellulose. In the presence of aldehydes, the damage is found to be reduced (Tétreault et al. 2013). As a precaution, however, acid-emitting products should be avoided.
For paper in books, most damage (yellowing and embrittlement) by outdoor and indoor pollutants tends to remain on the margins of the paper sheets, with very slow diffusion into the book. Many archivists will accept some limited deterioration of the pages’ edges. If a single sheet of paper is framed or a stack of papers is protected in an airtight box, the use of gas filtration in archives and libraries may not be required. Cellulose will be best preserved against acid-catalyzed hydrolysis by keeping the RH and temperature as low as possible.
Cellulose acetate
Cellulose acetate films degrade by acid-catalyzed hydrolysis; acetic acid is the by-product released (Reilly 1993). It is best to preserve films typically produced in the 1950s and 1960s in cool or cold rooms (ASHRAE 2019b). In ambient conditions, degraded films should ideally be stored in special ventilated cabinets to avoid the risk of damage to other collections. Otherwise, consider enclosing the films in airtight enclosures with moisture sorbents to preserve them from the high humidity in the storage area (Nishimura 2015).
Cellulose nitrate
As with any cellulosic material, cellulose nitrate (CN) films degrade when acid-catalyzed hydrolysis releases nitrogen oxides. Old CN films, produced mainly from 1896 to 1952, are unstable and absolutely must be kept below 38°C (100°F), above which there is a high risk of self-ignition. CN films should be removed from the collection and properly stored according to National Fire Protection Association standard 40 (NFPA 2019), which provides detailed information on the ventilation requirements. However, it is best to preserve these films in cold rooms (ASHRAE 2019b).
Other CN objects (such as faux tortoiseshell) do not degrade to the same degree as films, but to avoid the risk of damage to other collections due to nitrogen oxide emissions, CN objects should be either stored in well-ventilated rooms or in special ventilated cabinets (Coughlin and Seeger 2008). A room with a high volume of CN items must also comply with local regulations for explosive and combustible substances.
Colourants
Many colourants (organic pigments and dyes) are known to be sensitive to photooxidation and/or to hydrolysis (Reilly 1998). In addition, some colourants will be affected by gaseous pollutants. The colourants most sensitive to nitrogen dioxide, sulfur dioxide and ozone are curcumin, dragon’s blood, aigami, realgar, iron gall ink, enju, basic fuchsin, brilliant green, pararosaniline, indigo, madder lake, Persian berries lake and saffron (Whitmore and Cass 1989; Williams et al. 1993; Cass et al. 1989). Yellow dyes from photographic prints have been found to be affected by acetic acid (Fenech et al. 2010). Art works with vulnerable colourants should be displayed or stored in protective enclosures made of products that will not release organic acids. In practice, it is often difficult to identify the colourants on objects without analysis. As a precaution, it is often best to limit the exposure of unknown colourants to high RH, high light levels and high pollutant concentrations.
Difficult-to-clean objects
All objects are susceptible to particle deposits, but the removal of fine particles will be difficult or even impossible for some objects. During handling and cleaning, there will also be a risk of physical damage. Objects that are difficult to clean include the following:
- objects with powdery pigments or surfaces, such as some painted Indigenous objects, taxidermy specimens (Figure 7) or butterfly wings;
- physically fragile objects, such as insect collections and filamentous mineral specimens;
- objects in which fine particles could become lodged in microcracks or interstices, such as ivories or painted objects with cracks; and
- objects with sticky surfaces, such as some deteriorated plastics and some polyethylene glycol-treated wooden, waterlogged objects.
It is best to display and store these objects in airtight enclosures (Thickett et al. 2005) or in cases with a positive pressure system (Beecher 1970; Byers and Thorp 1995; Tétreault 2003, p. 55). If isolating the object is not an option, maintaining a minimum distance between visitors and fragile objects is recommended. For example, a distance of 1.5 m to 2 m will reduce dust deposits by 50% to 75% (Lloyd et al. 2007). This distance will prevent the accretion of coarse particles on objects, but it has limited effect on fine particles because of their longer suspension time.
Another threat for objects that are difficult to clean is the possible formation or deposition of amine compounds on their surfaces (Table 1; also consult Damage on an enclosure material). A whitish film or an efflorescence forming on a material’s surface can be difficult to remove if the surface is fragile or porous (Stanek et al. 2016; Poulin et al. 2019).

© Government of Canada, Canadian Conservation Institute. CCI 2005307-0001
Figure 7. This northern bald eagle needs to be protected against dust if the feathers at the head and neck are to remain as white as they are in nature.
Historic glasses
Some historic glasses degrade slowly in the presence of water vapour, resulting in alkali leaching, which can form crystalline corrosion compounds on the surface or modify the structure of the glass (Figure 8). The presence of formic and acetic acids accelerates the leaching (Robinet 2006, pp. 6 and 197). These types of glasses should be displayed or stored in an environment with minimal RH fluctuations. A set point of 40% to 42% RH is recommended for already crizzled glasses (Koob et al. 2018). Enclosures should not contain products that can emit organic acids.

© Government of Canada, Canadian Conservation Institute. CCI 2003656-0006
Figure 8. Detail of crizzled glass beads. Some beads exhibit a colour change, which is due to cracking, that makes them less transparent.
Magnetic recording tapes
Magnetic tape binders are typically made of polyester urethanes. The polymers often degrade by hydrolysis faster than cellulose acetate and cellulose nitrate films. Their useful lifetime (readability) was found to be in the range of 14 to 30 years when they are stored at 21°C and 50% RH (Wheeler 1994; Van Bogart 1995, p. 28; Howarth 1999). However, some tapes that were well over 30 years old have been found in good condition (Rodgers 1999). Guidelines proposed for long-term preservation are to keep them dry and cool but not below 15% RH and 8°C, thereby avoiding static and adverse effects on the lubricant (ISO 2000).
Rubber
Natural and vulcanized rubber (polyisoprene) are vulnerable to oxidation. Ozone is very reactive with rubber, as it is for many organic materials, and it should be avoided. For a high level of preservation, an anoxic (oxygen-free) enclosure is suggested (Shashoua and Thomsen 1993; Williams 1997; Maekawa 1998) (Figure 9). However, this is often difficult to achieve in practice. Keeping the RH, temperature and light levels low is also recommended (Fenn and Williams 2018).
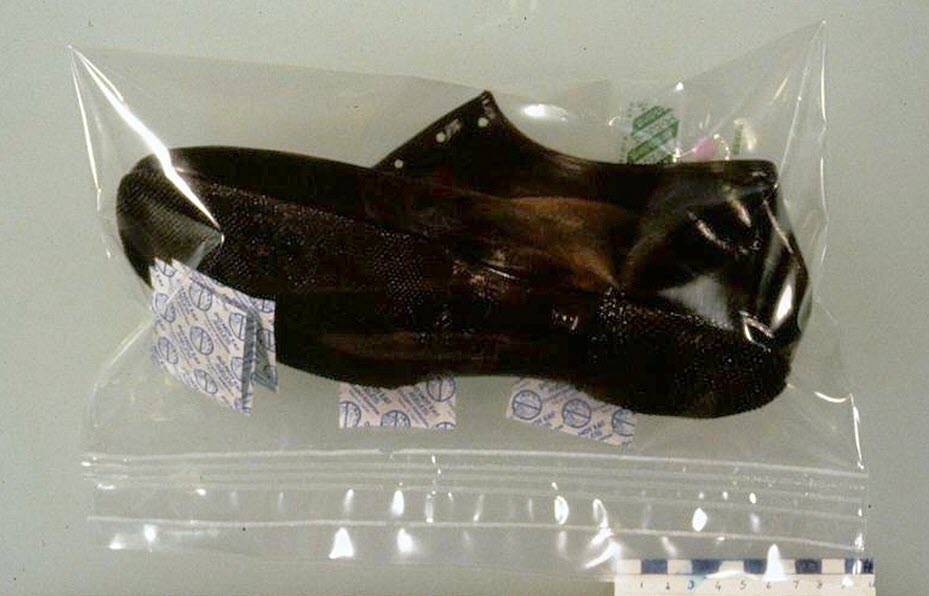
© Government of Canada, Canadian Conservation Institute. 120171-0016
Figure 9. A natural rubber shoe preserved in a special oxygen barrier bag. Some oxygen scavenger packets create and maintain an anoxic environment.
Filtration
HVAC systems are important to maintain an adequate level of RH and temperature and good indoor air quality. Airborne pollutants, which can be in the form of gases, aerosols and particles, can be trapped by the filters. The degree of performance required by the filtration system should be based on the predetermined pollutant concentration limits set for the room or its contents (consult Pollutant concentration limits) and the parameters that will affect these limits, such as infiltration, emission and deposition. If there is a lot of traffic from diesel fuel vehicles or frequent smog events surrounding the museum or archive, a high capacity for filtering fine particles should be considered. Gas filters can be an option if harmful gas emissions from indoor sources, such as building products, indoor activities or the collection itself, are significant or if the outdoor environment is polluted by major industrial activity or heavy traffic.
Particle filtration
Particle filters were initially used to protect the HVAC components and later to prevent the development of biological activities in the HVAC system that can affect human health. In addition to this, museums and archives want the HVAC system to reduce the concentration of pollutants in the building for better protection of their collections. Depending on their performance efficiency, filters can block very small particles, but this comes at a high operating cost. Conversely, visible large indoor-generated particles cannot be easily trapped, even when a high-performance HVAC system is used, since their suspension time is too short. They simply fall quickly to the floor. However, they can also be suspended during large air movements, and some particles may eventually reach objects. Removing dust from objects can be an issue for fragile objects such as feathers and insect collections (consult Difficult-to-clean objects). Fine particles with a diameter less than 1 μm, such as black soot, will also be difficult to remove from objects. Because of its strong adherence to surfaces, soot will have to be removed mechanically (for example, by rubbing). One solution to prevent dust deposition is to enclose objects.
The efficiency of particle filtration is classified according to standards. The two recent standards are the American National Standards Institute – American Society of Heating, Refrigerating and Air-Conditioning Engineers ANSI/ASHRAE standard 52.2 (ASHRAE 2017) and the International Organization for Standardization (ISO) standard 16890-1:2016 (ISO 2016a). The classification of the filter efficiencies of these two standards is presented in Table 3.
| ASHRAE MERV number |
ASHRAE Particle size range 0.3 to 1.0 μm |
ASHRAE Particle size range 1.0 to 3.0 μm |
ASHRAE Particle size range 3.0 to 10.0 μm |
ISO ePM1 |
ISO ePM2.5 |
ISO ePM10 |
ISO coarse |
|---|---|---|---|---|---|---|---|
| 1 | – | – | <20 | – | – | – | <50 |
| 2 | – | – | <20 | – | – | – | <50 |
| 3 | – | – | <20 | – | – | – | <50 |
| 4 | – | – | <20 | – | – | – | <50 |
| 5 | – | – | 20 | – | – | – | 80 |
| 6 | – | – | 35 | – | – | – | 90 |
| 7 | – | – | 50 | – | – | – | 90 |
| 8 | – | 20 | 70 | – | – | – | 90 |
| 9 | – | 35 | 75 | – | – | <50 | – |
| 10 | – | 50 | 80 | – | – | 50 | – |
| 11 | 20 | 65 | 85 | – | <50 | 70 | – |
| 12 | 35 | 80 | 90 | – | 50 | 70 | – |
| 13 | 50 | 85 | 90 | 50 | 65 | 80 | – |
| 14 | 75 | 90 | 95 | 70 | 80 | 90 | – |
| 15 | 85 | 90 | 95 | 80 | – | – | – |
| 16 | 95 | 95 | 95 | 80 | – | – | – |
Note: The table is based on Camfil (2017), Klawitter (2017) and Airepure (2017). The transition from one standard to the other one is approximate. The ePM 1, 2.5 and 10 sizes refer to the optical diameter of particulate matter in μm. “ISO coarse” refers to a specific range of dust distribution according to ISO 12103-1, A2 Fine Test Dust (ISO 2016b).
As shown in Table 3, the two standards quantify the filter performance on slightly different particle distributions. ANSI/ASHRAE compares filter efficiency based on three aerodynamic diameter particle size ranges, while ISO 16890-1:2016 looks at filter efficiency at specific optical particle diameters of 1, 2.5 and 10 μm. A filter having the performance of a MERV 13 or ISO ePM1 50% reduces the fine particles (0.3 to 1.0 μm or PM1) by 50%. The same filter reduces larger particles by more than 85% or 65%, according to the ANSI/ASHRAE and ISO standards respectively.
Note that the filters made of coarse synthetic fibres will lose some efficiency over time. Their performance can be reduced by up to two MERV numbers after a few weeks. This is due to the reduction of the electrostatic charge of the filter, which helps attract dust (U.S. EPA 2018, p. 23).
An HVAC system with a MERV 8 to 10 filter (ISO ePM10) should easily be able to maintain the concentration of PM2.5 below the national ambient air quality standards in the United States and Canada (Stephens et al. 2016). A MERV 13 filter (ISO ePM1 50%) blocks 85% of most mould spores (Camfil 2013). This is probably one of the reasons why a MERV 13 is required in the LEED accreditation program (U.S. Green Building Council 2006, pp. 387–389).
It can be advantageous to assess the performance of the chosen type of filter directly by an independent test laboratory since the performance of some filters could be overestimated (ASHRAE 2011; Stephens and Siegel 2012). The U.S. EPA has reported that 58% of 31 filters tested perform at an average of two MERV numbers below the vendor’s rating (Hecker and Hofacre 2008, pp. E1–E33). The good news is that as filter efficiencies increase, the MERV values reported are more reliable. Only 30% of filters having a MERV 13 and higher perform at one MERV number lower than the vendors’ rating.
In-duct electrostatic precipitator filters or high-voltage electrostatic air cleaners are efficient at trapping fine particles. However, they should be avoided since they generate ozone (Singer et al. 2016, pp. 7 and 21; Poppendieck et al. 2014). Ozone is dangerous to many organic materials, and its reaction with VOCs can produce volatile compounds that are also potentially harmful to collections (Zhang and Lioy 1994; Muller 1994).
Gas filtration
Gas or molecular filters capture various volatile compounds. They can be installed in the main HVAC system or in a portable unit. These filters are made of different types of materials (sorbents) that sorb specific groups of volatile compounds. The most common type of sorbent contains activated charcoal, which can be used alone, blended with another sorbent or impregnated with a chemical compound (Tétreault 2003, pp. 45–47; ASHRAE 2011). The lifetimes of these sorbents depend on various parameters, such as the concentration of key pollutants and harmless volatile compounds, contact time and the sorption/reaction capacity of the filters. The lifetime of the filters used in a specific location should be predicted or measured to ensure their optimal efficiencies (ASHRAE 2011). A common approach to verify the efficiency of a gas filter is to take measurements of a key pollutant or to measure the corrosivity of gases with semi-quantitative methods before and after it passes the filter unit (referred to as “upstream” when it happens before and “downstream” when it happens after) (consult Monitoring).
The performance of the HVAC system, in terms of its ability to control the concentration of gaseous pollutants in the room, can be measured with Equation 1 (Shair and Heitner 1974). Equation 1 shows the resulting pollutant concentration as a function of filter efficiency, airflow and sources of emission and sorption. These parameters are also shown in
Figure 10. Equation 1 assumes a perfect mix of air in the room and pollutant concentrations far below their saturation concentrations. The filter efficiency, emission rate, deposition velocity and undesired air infiltration (such as from building membrane leakage or simply the frequent opening of doors and windows) are assumed to be constant, but they usually change over time.
The deposition velocity may be a less well-known concept. It represents the flux of the pollutant to a surface per a given concentration. The unit of the deposition velocity is m/h [μg/(m2 h) / μg/m3]. In other words, the deposition velocity represents the capacity of a material, which can be a building product or an object, to sorb pollutants present in the room. Note that a room may contain many types of materials with different emission or sorption rates. They should all be considered.
Equation 1. V dCi/dt = Co foi + Co (1 – ηfo) fofi + Ci (1 – ηfr) fr + EA – CiV dA – Ci (foi + fofi + fr)
Where
V = volume (m3)
Ci = indoor concentration (μg/m3)
Co = outdoor concentration (μg/m3)
dCi/dt = variation of Ci in a small time interval [μg/(m3 h)]
foi = rate of airflow from outdoors to indoors (m3/h) (undesired air infiltration)
fofi = rate of filtered airflow from outdoors to indoors (m3/h)
fr = rate of recycle filtered air (m3/h)
ηfo = efficiency of the main filter (no unit)
ηfr = efficiency of the recycled air filter (no unit)
E = emissive material [μg/(m2 h)]
A = area of the emissive or sorbing material (m2)
Vd = deposition velocity on a sorbing material (m/h)
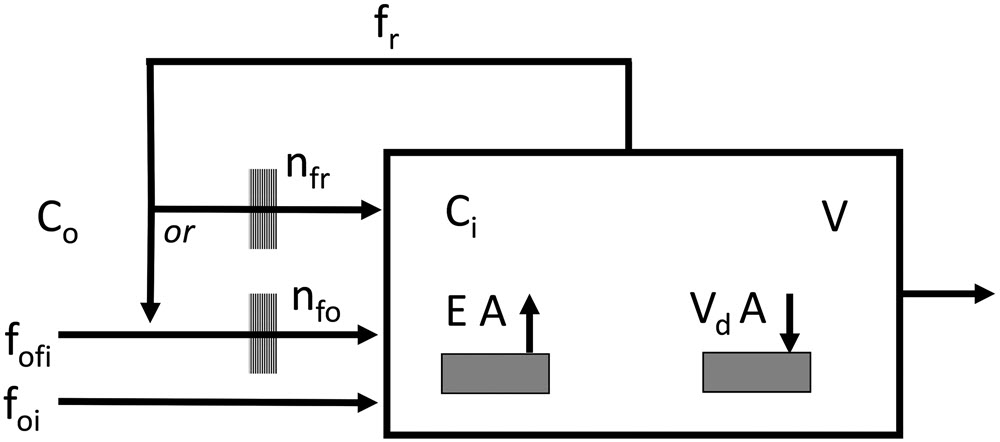
© Government of Canada, Canadian Conservation Institute. CCI 120668-0005
Figure 10. Schematic diagram of a ventilation model based on Equation 1. It shows the dependence of the indoor gas concentration on different parameters such as outdoor concentration, filter efficiency, airflow and sources of emission and sorption. Generally, intake air and recirculated air both pass through the same fan system.
According to Equation 1, gas filtration at the building level could be very efficient in reducing the concentration of outdoor pollutants in a room if the building envelope is well sealed and if the filter efficiency is maintained by a proper maintenance program. The National Gallery in London (Saunders 1993) had a nitrogen dioxide reduction of 38% without a gas filter, compared with the outdoor concentration. The NO2 concentration was cut by 89% when a gas filter was added. The Autry Museum of the American West in California, which was equipped with a gas filter system, had a 75% reduction in NO2 (Hisham and Grosjean 1991). Ozone was reduced by 72% and sulfur dioxide by around 50% to 60% (Saunders 1993; Hisham and Grosjean 1991).
However, in some circumstances, the presence of a gas filter in the HVAC system did not provide a significant improvement (Hisham and Grosjean 1991; Havermans and Steemers 2005Return to Endnote 1 referrer; Ryhl-Svendsen and Clausen 2009). The lack of improvement from an unfiltered to a gas-filtered HVAC system may be due to significant unfiltered air intake, faulty installation or a heavy load of absorbent materials, such as in book storage, which can be the main removal path of outdoor pollutants.
The control of indoor-generated pollutants can be a challenge if there are major sources of emissions, if the filtered air rate is low and if the recycling air rate is low (Ryhl-Svendsen and Clausen 2009). Some HVAC systems have a desiccant dehumidifier based on silica gel. The silica gel will also contribute to removing some particulate matter and gaseous pollutants. The overall performance of the gas filter system should be measured by monitoring (consult Monitoring) the HVAC system before and after air passes through the filter unit as well as in the room. Only the reading of pollutant concentrations at return air ducts or in the middle of the room give an adequate picture of pollutant control in that room.
Design considerations
There are a few considerations to optimize the filtration of airborne pollutants at the HVAC system level. These include location, pressure drop and the filter system.
Location
The location of the museum itself has a great impact on indoor pollutant concentrations. Obviously, a building located close to a major traffic intersection, highway or polluting industrial zone is not the best option. The location of the building’s fresh air intake is critical and should be installed in the least polluted area. The prevailing wind directions should be considered, as should the location of kitchen and workshop exhausts, loading docks or any possible sources of pollutants around the building.
Pressure drop
The air is pushed through the HVAC system by fan pressure. System components such as elbows, heat exchangers, dampers and grilles all contribute to air resistance and the total system pressure drop. This drop in pressure and the airflow requirements for the conditioned spaces determine the fan power required for the HVAC system. Particle filter choices also affect the fan power requirement. In general, for any given filter size and design, the more efficient the filter, the greater the pressure drop and fan power requirement. High efficiency filters (such as MERV 11 and higher) will add more resistance and a higher drop in pressure as the filters accumulate dust. Unlike particle filters, the introduction of gas filters into the HVAC system does not significantly affect the pressure drop.
Filter system
Typically, filters are installed before and after the cooling coils, heating coils and air supply fan, as shown in Figure 11 (upstream and downstream particle filtration). A moderately efficient particle filter (prefilter) is installed upstream, which provides basic protection for the cooling, heating and fan components. The prefilter will also preserve the useful life of the high-efficiency filter downstream. The final particle filter provides protection for the collection as well as the ductwork in case of mechanical failure of any HVAC component.
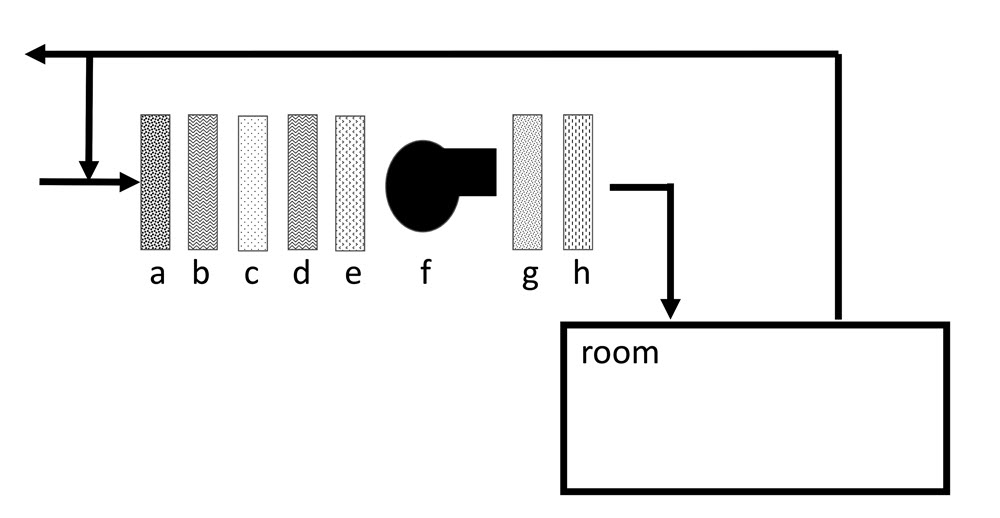
© Government of Canada, Canadian Conservation Institute. CCI 120668-0007
Figure 11. Generic components of an HVAC system. The outside air passes through different components of the HVAC unit from a) a particle prefilter, b) a desiccant dehumidifier, c) a gas filter, d) the cooling coil, e) the heating coil, f) the air supply fan, g) a final particle filter and h) the humidifier. The air then enters the room. A fraction of the return air is exhausted, and the rest is recycled into the HVAC unit. The position of the components may vary from one system to another.
The gas filter is usually located before the final filters because some types of gas filters may lose their sorbent materials. Chemically treated sorbent particles can be corrosive on contact (ASHRAE 2011). The heavy sorbent particles fall down onto the ductwork, while the fine particles are trapped by the final filter.
If an in-duct electrostatic precipitator filter is used, it must be followed by a gas filter. The gas filter should be optimized to deactivate ozone and catch its by-products. Careful in situ monitoring of the ozone concentration should be done since the efficiency range of gas filters is large and their efficiency decreases with time.
During the planning of a new building, consideration should be given to the HVAC unit to ensure that it can support different systems of particle filters as well as include a place for the eventual insertion of one or two gas filters. This will allow flexibility for a filtration upgrade if needed in the future. For example, choosing two different specialized gas filters may be more suitable than having one generic filter. One generic filter can become saturated quickly by harmless gases, while two specialized gas filters may have a longer lifetime without affecting the pressure drop.
Data collection
Three levels of data collection are proposed to help museums with their needs and their capacity to assess the risk of pollutant damage in their facility. These levels of data collection may be considered for different monitoring contexts or scenarios (consult Scenarios for objects at risk).
Data collection level 1 (basic)
The first level does not require monitoring. It focuses on the investigation of published data, specifications and guidelines and expert advice. The goal of the first level is to have an approximation of the pollution concentrations from outside and those generated inside buildings or enclosures by using available resources.
Outdoor pollutants
Outdoor pollutant concentrations published by different authorities are very good sources of information. For example, pollutant concentrations from different Canadian cities can be obtained from federal sources (Environment and Climate Change Canada 2016; Environment and Climate Change Canada n.d.; Environment and Natural Resources n.d.), provincial sources (Government of Quebec n.d.) and municipal sources (Metro Vancouver 2016). Institutions commonly monitor ozone, nitrogen dioxide, sulfur dioxide and fine particles such as PM2.5. Sometimes, data on hydrogen sulfide is also available. Look for the closest weather station to the building of interest. If that is not possible, try to find a weather station in a similar neighbourhood or context (compare by intensity of traffic, distance between the main road and the building and which industries are nearby).
Predicting how much outdoor pollution will infiltrate a building is a more difficult task. A building without an HVAC system could have an indoor concentration that is slightly lower than the outdoor concentration. The concentration of pollutants tends to be much lower when the building has an HVAC system. A building with an HVAC system that contains a high-efficiency particle filter and a gas filter effectively blocks the infiltration of outdoor pollutants and results in a low concentration in the room.
As a rough guide, the 100-10-1 rule of thumb can be considered (Tétreault 2003, pp. 35–38). This rule of thumb can be used to approximate the concentration of outdoor pollutants passing through successive protection envelopes. Through each envelope, the concentration of pollutants may be reduced by one order of magnitude. For example, if the outdoor concentration of nitrogen dioxide is 200 μg/m3, the concentration inside a room in a building will be 20 μg/m3 and the concentration inside an enclosure in the room will be 2 μg/m3. This assumes the absence of indoor-generated pollutants and the presence of good building barrier controls and good airtight enclosures. If a room has windows that are left open a few hours a day, there will be no significant difference between concentrations on the inside and outside. The 100-10-1 rule of thumb for outdoor pollutants is a generalization and may seem simplistic, but it may satisfy the needs of many museums that cannot afford extensive monitoring but still require an estimation of pollutant concentrations.
Consulting published pollutant data from other heritage institutions can also help provide an idea of the concentration of pollutants in the building of interest (Table 4). An expert on indoor air quality (IAQ) may help in the estimation of pollutant concentrations in your building or in setting up a monitoring protocol (consult Global building environment).
Pollutants generated in enclosures
The estimation of pollutant concentrations in an enclosure depends on parameters such as airtightness and emissions from the products and objects inside. Some documents offer general information on products (Hatchfield 2002; Schieweck and Salthammer 2009; Tétreault 2017; AIC n.d.). Pollutants of interest are typically organic acids such as acetic acid. Hydrogen sulfide is a concern if silver and copper are present in the enclosure. Unfortunately, quantitative data on material emission rates are missing. Some published data from different institutions may provide possible ranges of pollutant concentrations in enclosures (Table 4). It is probably easier to assess the magnitude of risk of damage based on the nature of objects and products in an enclosure than to determine the precise concentration of pollutants (Table 1; consult also High vulnerability objects). A low-risk situation will largely rely on the selection of “approved” or “safe” products (consult Testing products).
Indoor-generated pollutants
Sources of indoor-generated pollutants are mainly building products and the collection itself. For information on this topic, consult published data from similar collections and contexts (Table 4).
| Pollutant | Building (µg/m3) | Enclosure (µg/m3) |
|---|---|---|
| Acetic acid |
|
|
| Formic acid |
|
|
| Hydrogen sulfide |
|
|
| Nitrogen dioxide |
|
|
| Nitric acid |
|
|
| Ozone |
|
|
Particulate matter: PM1, PM2.5 and PM10 |
|
|
Data collection level 2 (intermediate)
After collecting published data from different sources, some experimental data generated in situ may be desired for better certainty. The choice of monitors or tests and the quantity of measurements are important, especially when the budget is limited. Low-cost monitoring may detect high levels of pollutants, which can happen in a new enclosure because of the emission of volatile compounds from products or even the objects themselves. On the other hand, detecting nothing with a low-cost monitor may not guarantee the long-term preservation of the collection since the limits of detection for such monitors are usually not low enough.
For fast and low-cost measurements, there are semi-qualitative pH strips with glycerol and A-D strips, which provide an indication of the acidity of the air (Table 5). Both work well to determine acidity in enclosures. The pH strips can also be used to measure the acidity in the room. If time permits, metal coupons (Table 5) such as lead and silver placed in enclosures for a few weeks or months will provide information on the corrosivity of the air in the enclosure. However, those metal coupons cannot be used as early warning monitors to prevent the corrosion of the lead and silver collections since the metal coupons and the collection may degrade at the same rate. Silver and copper coupons can also be used in the room.
If specific gases need to be monitored, colour diffusion tubes can be considered (Figure 12 and Table 6; for more information, consult Suppliers). These tubes absorb the pollutant of interest for 24 or 48 hours, and the concentration can be read directly from the tube. They can be deployed in an enclosure or in the room. The limit of detection should be low enough to detect the targeted concentrations (consult Pollutant concentration limits). Sometimes the exposure duration can be extended to provide extra sensitivity. However, the presence of other gases can interfere with the concentration readings, resulting in a false high response. Consult the manufacturer’s technical data to see if interferences may be an issue.
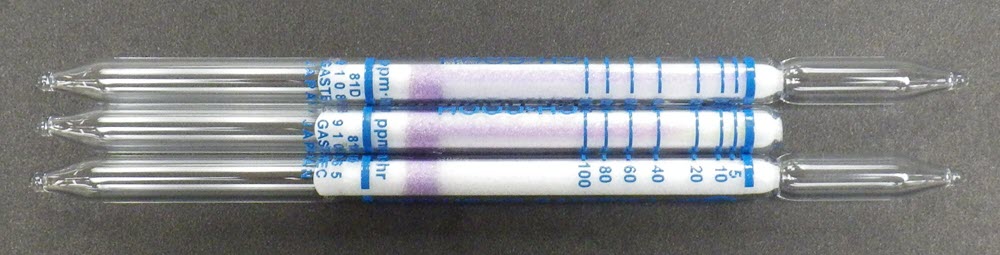
© Government of Canada, Canadian Conservation Institute. CCI 120668-0009
Figure 12. Colour diffusion tubes calibrated for acetic acid. The tube in the centre has been exposed to acetic acid vapour for 10 hours. The indicator in the tube changes from purple to slightly yellow by slow diffusion mode, giving a value of around 30 ppm/h in this case. This means a concentration of 3 ppm. The tubes above and below are shown for reference; they were not exposed to acid vapour.
Usually, there is an interest in measuring concentrations of nitrogen dioxide and ozone in rooms and acetic acid in enclosures. Unfortunately, for a single pollutant concentration, the correlation between the results of qualitative and semi-qualitative methods are such that the methods are not easily interchangeable. More information on monitoring methods can be found in the conservation literature (MEMORI n.d.; Canosa and Norrehed 2019).
| Pollutant | Materials | Results | Distributors | Examples of applications |
|---|---|---|---|---|
| Acid volatile compounds | pH strips with glycerol | Direct result | Various chemical distributors | Tétreault 1992 |
| Acid volatile compounds | A-D strips | Direct result | Image Permanence Institute | Nicholson and O’Loughlin 1996; Hackney 2016 |
| Corrosive volatile compounds | Silver, copper and lead coupons | Direct reading or coupons sent for analysis | Distributors specializing in air quality and corrosion such as Camfil, Purafil and the French Corrosion Institute | Muller 2003; Dubus et al. 2010; Thickett et al. 2013 |
| Dust deposits | Glass slides and reflectometer | Surface reflection of glass slides | Various scientific instrument distributors sell reflectometers | Adams et al. 2003; Wei et al. 2007; Smith et al. 2011 |
| Dust deposits | Sticky (or not) glass slides and microscope | Surface covered by dust | Various scientific instrument distributors sell microscopes | Adams et al. 2001; Knight 2001; Knight 2011 |
| Pollutant | Concentration target | Colour diffusion tubes (direct reading)Table 6 note 1 Cost: ≈ $10/tube |
Diffusive samplersTable 6 note 2 (30-day sampling); laboratory analysis required Cost: ≈ $100/tube and analysis |
Direct reading electronic monitorsTable 6 note 1 |
|---|---|---|---|---|
| Acetic acid | 1000 | 640 (after 24-hour sampling)Table 6 note 3 | 1.5 | N/A |
| Ammonia | –Table 6 note 4 | 59 (after 48-hour sampling)Table 6 note 5 | 0.2 | 0.7Table 6 note 6 |
| Formic acid | –Table 6 note 4 | 1900 (based on 20 strokes)Table 6 note 7 | 1.5 | – |
| Hydrogen sulfide | 1 | 60 (after 48-hour sampling)Table 6 note 5 | 0.1Table 6 note 2 and 0.01Table 6 note 8 | 1.4Table 6 note 6 |
| Nitrogen dioxide | 10 | 190 (after 48-hour sampling)Table 6 note 5 | 0.1 | 0.8Table 6 note 9 |
| Ozone | 10 | 2 (after 48-hour sampling)Table 6 note 5 | 1.0 | 2.0Table 6 note 9 |
Particulate matter (PM1, PM2.5, PM10) |
PM2.5 = 10 | – | – | 1Table 6 note 10 |
| Sulfur dioxide | 10 | 11 (after 48-hour sampling)Table 6 note 5 | 0.1 | 1.3Table 6 note 9 |
Data collection level 3 (advanced)
A more expensive monitoring campaign can be undertaken when low-cost and fast measurements have indicated a potential risk or when sensitive (low limit of detection) and accurate monitoring methods are needed to reduce uncertainty. At this level of data collection, IAQ experts rely on diffusive samplers (Figure 13 and Table 6 ; consult Suppliers). Diffusion tubes are placed outside, in rooms or in enclosures for a period of 30 days typically. After the exposure period, the tubes must be returned to a laboratory for analysis. This will further delay the results. If time is critical, either low-cost measurements will need to be considered [consult Data collection level 2 (intermediate)] or a governmental, academic or private IAQ expert must be found who will use direct reading electronic monitors, which can be expensive.
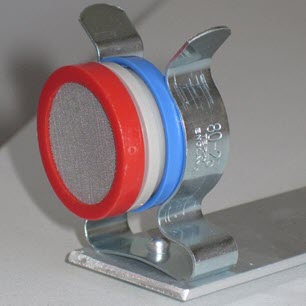
© Government of Canada, Canadian Conservation Institute. CCI 120668-0010
Figure 13. An example of a diffusive sampler design.
For fine particles such as PM1, PM2.5 and PM10, many electronic monitors exist on the market with the sensitivity required for museums. It is recommended that ample measurements be taken when using electronic monitors since they read concentrations over a very short period. Many measurements taken at different times of the day, week and month will help ensure a reliable average concentration with a minimal standard deviation. Many museums are not able to afford this type of precise monitoring campaign because of the high cost. It may be wise to investigate if there are grants available for this type of activity or if the monitoring campaign can be a joint project with a conservation institute or a university program (Krupinska et al. 2013) that may be interested in testing their new analytical methods. ASHRAE (2019c) offers a substantial list of monitoring methods with the limits of detection associated with each pollutant.
Monitoring
Monitoring can be used as a tool for quality control, such as measuring to verify if the concentrations of pollutants from a new building or a new display case are below the maximum concentrations allowed (consult Pollutant concentration limits). Contrary to the measurement of temperature and RH in heritage institutions, the accurate measurement of pollutants can be quite costly. In museums, this often results in large-scale monitoring activities that are part of university or special government-funded projects. Fast, low-cost and sensitive (precise) measurements are not readily achievable. Some data, such as outdoor pollutant concentrations in cities and compiled lists of indoor concentrations, is already available and can be used for preliminary assessments. However, for better reliability, data will need to be generated with the help of qualitative methods or precise instrumentation. Blades (1998) has underlined the issue of the uses and abuses of a monitoring campaign.
Before doing any substantial monitoring, ensure that some pass or fail criteria are predefined and the results will be applicable in a decision-making process.
This section covers the following eight scenarios in which data on pollutants may be useful. For each scenario, different levels of data collection are proposed. The eight scenarios are
- global building environment
- environment in a specific location
- environment in an enclosure
- filter efficiency
- testing products
- environment for a specific object
- damage to an object
- damage to an enclosure material
Global building environment
Determining the global picture of the pollutant concentration in a museum may occur at the completion of a new building. However, it is best to evaluate the pollutant control strategy when the permanent collection has been installed and visitors are present in the museum. Usually, the focus is on HVAC performance, and therefore, each HVAC zone that includes a collection should be tested throughout the different seasons (or at least during summer and winter). Outdoor pollutants of concern are usually NO2, O3 and PM2.5. Consider adding acetic acid and hydrogen sulfide to the monitoring plan if the budget is not too tight. Acetic acid is a typical indoor-generated pollutant that is often generated by the collection itself. Typically, a high concentration of acetic acid can be found along with large book or ethnographic collections. Hydrogen sulfide is generated outside (it comes from volcanic activity, swamps and some industrial activities) and by staff and visitors. This reduced sulfide compound has great potential for damaging silver and copper. Display cases containing highly significant items can be included as part of the global assessment.
A global monitoring campaign helps to determine if the museum is compliant with its own environmental standards. Based on the results, stakeholders can decide if modifications to the preservation strategy are needed or if pollutant targets should be revised. The monitoring campaign done by Krupinska et al. (2013) is a good example. They surveyed nitrogen dioxide, ozone, sulfur dioxide, fine particles, and formic and acetic acids outside and inside the Plantin-Moretus Museum in Antwerp, as well as in a few display cases. This was done over three different seasons.
For a large-scale monitoring campaign, it is best to involve a conservation scientist who specializes in pollutants throughout the survey and not just at the end to interpret the results. This may help keep the focus on the most relevant data needed.
Environment in a specific location
It may be useful to monitor pollutants when renovations are carried out near unprotected collections. The monitoring can be done during and after the work if significant quantities of dust and solvent are expected. Particles should be monitored with electronic devices or glass plates (Adams et al. 2003) (Tables 5 and 6). During the renovation, the presence of solvents will be mainly due to the use of solvent-based products such as sealants, adhesives or paints. Consider monitoring the concentration of acetic acid if solvents might be an issue. Prevention is important, especially when dealing with paint. Consult documents on the use of paint in museums (Tétreault 2011; CCI 2017). Monitoring another room, whether adjacent or not, can be useful for comparison.
Environment in an enclosure
Follow the contract specifications for enclosures, such as display cases, storage cabinets or handling-transportation-storage boxes, to minimize the risk of damage by outdoor pollutants and pollutants generated inside. These specifications may include the products allowed and the expectations for airtightness. Consult the literature for information about potential risks in enclosures and how to prevent them (Hatchfield 2002; Tétreault 2017). Checking the pollutant levels of old enclosures that need to be reused may be of interest. In addition to the direct potential risks related to intrinsic emissions from products used to make the enclosure, some old enclosures made of porous and organic materials may have absorbed pollutants emitted by objects from the previous use of the enclosure (Fenn and Williams 2018). Those pre-absorbed pollutants can be re-emitted, putting the new objects at risk. Monitoring the room and other enclosures can be useful for comparison.
People are sometime suspicious about strange smells when opening enclosures. The nature and origin of the smell are often not obvious. The source may be the objects themselves, products in the enclosure, mould activity, past chemical treatments and so on. Consulting an IAQ expert and a conservator may help to determine which monitoring methods are most relevant.
If there is an interest in determining the level of infiltration of outdoor pollutants into the enclosure, nitrogen dioxide is a good example of an outdoor gas to monitor. A good indoor-generated pollutant to monitor is acetic acid, which is typically found in enclosures. If the enclosure will contain silver objects, verify the absence of sulfur compounds in products by running the lead acetate test (Tétreault 2017). Consult Testing products for other spot tests. If it is suspected that the source of sulfur is the collection, measure the concentration of hydrogen sulfide in the enclosure or measure its concentration from an isolated suspected object in a glass container. Any other gases of concern can also be added to the monitoring plan.
If the volume of the enclosure is small, some monitoring methods, such as diffusion tubes and electronic devices, may have limited performance. They either create a vacuum or absorb pollutants faster than they are generated, causing a non-equilibrated environment. In both cases, this will result in underestimated pollutant concentrations. The issue of the compatibility of the monitoring method with the size of the enclosure should be resolved prior to the measurements.
Another factor to consider is the time needed to re-establish the pollutant equilibrium concentration after the introduction of the monitor in the enclosure. Typically, the time to reach equilibrium will depend on the size of the enclosure and the emission rate of the products inside. Taking a reading or removing the monitor in less than 24 hours may give underestimated results.
Another way to see if the enclosure is safe for its objects is visual observation of the collection, starting with those objects known to be more at risk (consult High vulnerability objects). With the presence of unsuitable products in the enclosure, the damage may occur as fast as a few days up to a few months. A conservator could inspect some vulnerable objects for any sign of adverse effects after one or two days, one or two weeks and two to three months. If no damage to objects occurs after three months, it is unlikely that damage due to pollutants generated in the enclosures will be observed later.
The determination of the leakage rate of the enclosure (Calver et al. 2005) can also aid in predicting the concentration of outdoor pollutants in the case as well as the concentration of pollutants generated inside (Tétreault 2003, pp. 51–54).
Filter efficiency
To ensure that the HVAC system meets expectations, it is important to verify filter efficiency in blocking gaseous pollutants and fine particulates in situ. This tends to be done for new or upgraded systems. Metal coupons, corrosivity sensors (also based on metal coupons) and direct reading electronic monitors can be used for this purpose (Tables 5 and 6). The monitors are installed before and after the filtration system to determine the difference in response. It would also be wise to place a monitor in the room. This will help to evaluate the net performance of the filter with various sources of pollutant emissions and various sources of sorption in the room, including unfiltered infiltration. The same test should be done a year later or at a date prearranged with the filter manufacturer to check the performance decay of the filtration system. Since it is known that the efficiency of the gas filter decreases as it becomes saturated, an HVAC system with a gas filter may need extra monitoring over time to really understand the decrease in its efficiency rate.
Testing products
After consulting the conservation literature on products used in museums [consult Data collection level 1 (basic)] as well as experts, if doubts remain, some easy tests (Table 7) can be done, such as tests with pH strips containing glycerol, the A-D strip test and the lead acetate test. Otherwise, for the intermediate level, the Oddy test and the photographic activity test (PAT) are common tests to consider. The latter two tests need an incubation period of four weeks. If the advanced level is needed, many sensitive analytical measurements can be made on products with the help of a specialized laboratory. One example of services for testing products with specialized equipment is the BEMMA program (Bewertung von Emission aus Materialien für Museums-Ausstattungen [Assessment of emissions from materials for museum equipment]) (Wiegner 2012; Glasbau Hahn n.d.). You will need a budget of a few thousand dollars (CAN) to test a few samples.
It may be wise to ask manufacturers and/or distributors to get their products tested or analyzed. If they supply products frequently to museums and archives, they may be open to this suggestion. Otherwise, the heritage institution will bear the cost of these tests or analysis. When requesting a specific test on products from a contractor or distributor, it is best to provide contact information for at least one firm who can run the test. Make sure a third party undertakes the test. Some organizations that accept requests for materials testing are listed in Material testing laboratories.
Keep in mind that a passing score from a standardized test may not guarantee that the material is completely harmless. As an example, the Oddy test focuses on the potential corrosion of lead, copper and silver. If a product does not affect those metals, it may still interact with other types of materials found in museums or even react with compounds on objects surfaces. For instance, an amine light stabilizer, used as an additive in some polymers, can make a white deposit on different surfaces even if the product passes the Oddy test (Stanek et al. 2016; Newman et al. 2015; Heald 2020).
| Pollutants | Materials | Results | Material distributors | Examples of application |
|---|---|---|---|---|
| Corrosive volatile compounds | Silver, copper and lead coupons | Visual reading after aging 28 days at 60°C | Various chemical distributors | Test commonly known as the Oddy test; AIC n.d. |
| Acid volatile compounds | pH strip with glycerol | Direct result after 1 day | Various chemical distributors | Tétreault 1992 (Figure 14) |
| Acid volatile compounds | A-D strip | Direct result after 1 day | Image Permanence Institute | Nicholson and O’Loughlin 1996; Coughlin 2011 (Figure 15) |
| Reduced sulfur compounds | Lead acetate strip | Direct result after burning the sample | Various chemical distributors | Tétreault 2017 |
| Reduced sulfur compounds and oxidants | Unprocessed colloidal silver film | Samples sent to a laboratory for aging at 70°C and 86% RH; changes are measured with a photographic densitometer | Image Permanence Institute | Known as the photographic activity test (PAT); ISO 2007; Down et al. 2013; National Archives of Australia n.d. |
| Various compounds | N/A | Samples to be tested sent to a laboratory | N/A | Wiegner 2012; Glasbau Hahn n.d. |
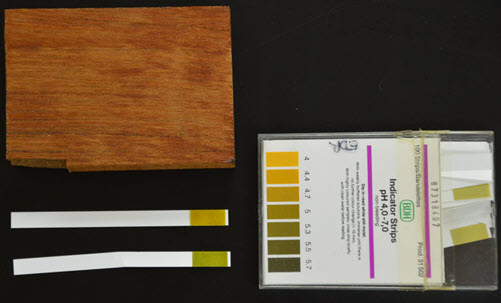
© Government of Canada, Canadian Conservation Institute. CCI 120668-0011
Figure 14. Acidity measurement with pH strips. A piece of varnished wood was in a small sealed glass jar for 24 hours with a pH strip, which was saturated in a water-glycerol solution. Another pH strip was in the room as a control. After 24 hours, the colours on the pH strips were different. The pH strip (top) exposed to emissions from the wood sample in the jar appears medium yellow (indicating more acid) than the control pH strip, which appears light green (bottom). The pH can be quantified by using the colour scale provided with the pH strip kit.
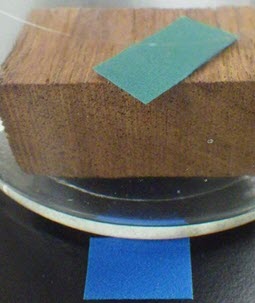
© Government of Canada, Canadian Conservation Institute. CCI 120668-0012
Figure 15. Acidity measurement with A-D strips. In the presence of acidity, the strip colour changes from blue to yellow (from neutral to acid). A piece of varnished wood was in a small, sealed glass jar for 24 hours with an A-D strip. Another strip was in the room as a control. After 24 hours, the colours on the A-D strips were different. The A-D strip exposed to emissions from the wood sample in the jar was green (a sign of acidity), and the control A-D strip outside the jar was blue (original colour). The acidity can be quantified by using the colour scale provided by the manufacturer.
Material testing laboratories
The following organizations provide material testing. The lists are not exclusive, and the protocols and fees vary from institution to institution. Many institutions charge more than CAN$300 for the first sample. Some reduction in fees is possible for larger sample sizes. For both types of tests, the protocol to be followed must be clearly stated. (Inclusion of a heritage institution or a company in this list does not in any way imply endorsement by CCI. Other institutions may exist that offer similar services.)
Oddy test
- Central Institute for Conservation, Belgrade, Serbia
Email: veljko.dzikic@cik.org.rs - Eric Breitung, New York, NY
Email: Eric.Breitung@metmuseum.org - National Center for Metallurgical Research, Spanish National Research Council, Madrid, Spain
Email: ecano@cenim.csic.es - Swedish National Heritage Board, Visby, Sweden
Email: sara.norrehed@raa.se - Testfabrics, Inc., West Pittston, PA
- Vartest Laboratories, Inc., New York, NY
- Wiltshire Conservation and Museums Advisory Service, Chippenham, UK
Photographic Activity Test
- Fibre Based Solutions, Heidenau, Germany
- Image Permanence Institute, Rochester, USA
- National Archives of Australia, Parkes, Australia
Environment for a specific object
To determine if a specific environment is appropriate for an object, it’s important to know the object’s nature first and then to refer to the pre-assigned pollutant targets for the general collection, a specific material or a specific object (consult Pollutant concentration limits ). The effort to collect data on the environment surrounding an object depends on two factors: the sensitivity of materials to pollutants (consult High vulnerability objects) and its significance (Russell and Winkworth 2009). Choose the level of data collection that aligns with those factors and refer to the sections Environment in a specific location or Environment in an enclosure for monitoring suggestions.
Different mitigation procedures should be considered if the concentration of pollutants is not satisfactory (consult Mitigation).
Damage to an object
Zero risk of damage to objects is impossible, even with the best practices. Conservation professionals must be ready for the unexpected. Detecting early signs of changes to objects will help to minimize potential further damage.
As in the section Environment for a specific object, the nature of the object must be known first. If the damage is caused by a pollutant, most likely it will be reported either in Table 1 or in the section High vulnerability objects. However, damage to an object might not have been caused by airborne pollutants. The damage may have resulted from contact with a harmful material or even from one of its own materials (intrinsic damage). It is also possible that other agents of deterioration such as light or incorrect RH were involved. It is important to be aware that the environmental conditions under which the damage formed could be different from those occurring during the investigation. Consult a conservator if the nature of the object is not known or if the damage is not common.
When the nature of the damage is known, it can be easier to find the source. In the short term, it must be decided if the damaged object has to be removed from its “unsafe” location, if special mitigation measures must be applied (consult Mitigation) or if regular close visual monitoring of the damaged object is needed to observe any further damage.
Damage to an enclosure material
Stains on the labels, corrosion of metallic parts (Figure 6), fading of fabrics and fogging on glass panels (Figure 16) are types of damage that can be found in display and storage enclosures. These types of damage can affect the aesthetic of the presentation, but they can also be a warning. The pollutants causing damage to enclosure materials could potentially affect objects in the same environment. For possible actions, consult Damage to an object).
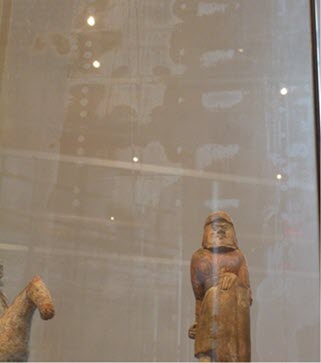
© Government of Canada, Canadian Conservation Institute. CCI 125347-0032
Figure 16. A film formed on the glass panel inside a display case. A pattern of track marks is observed. Residues from the manufacturing process reacted with some airborne compounds in the case (Poulin et al. 2020).
Mitigation
After concluding that inappropriate environmental conditions are present for a specific object, a specific location or the overall collection, one must decide if objects at risk should be removed from the problematic location. If the objects at risk cannot be removed, closer monitoring is needed to determine if the damage is stable or not. A mitigation strategy should be considered or reconsidered (Tétreault 2003, pp. 35–63). The strategies to avoid, block, dilute and filter or sorb pollutants can reduce concentrations in the ambient air. Reducing reactions is a strategy to minimize the adverse effects of the pollutants on objects; reducing exposure is a strategy to inhibit deterioration by limiting the exposure of objects to the harmful environment. Whenever feasible, avoiding the sources of pollutants is often the best option. However, when there are few options available to avoid outdoor pollutants, the most realistic option will be the blocking strategy. For indoor-generated pollutants, the avoid strategy (such as preventing exposure by selecting safe products) is the most efficient choice for enclosures. If this cannot be done, the dilution strategy will provide a partial reduction in pollutant concentrations. Sometimes, it can be useful to do some monitoring to see if mitigation has proven effective.
Control strategies to prevent the adverse effect of airborne pollutants include the following:
- Avoiding outdoor sources
- Select proper locations for new buildings based on surrounding sources of airborne pollutants, such as pollution-emitting industries and high traffic, and prevailing winds.
- Minimize the generation of pollutants by paving the parking lot in the immediate vicinity of the building.
- Support any proposal for reduced coal energy consumption and support environmentally friendly initiatives.
- Avoiding sources in rooms and buildings
- Minimize dust- and gas-generating activities close to the collection or in the same ventilation zone.
- Limit the number of visitors per room, depending on the ventilation capacity.
- Carefully select and use products based on their chemical components.
- Avoiding sources in enclosures
- Carefully select and use products based on their chemical components.
- Blocking the infiltration of pollutants in rooms and buildings
- Consider a judicious distribution of collections in the different air quality zones of the building (including the possibility of using enclosures).
- Improve the airtightness of the building membrane and the compartmentalization of zones and rooms with closed doors.
- Add vestibules for the main entrance and open windows cautiously.
- Select the proper location for the air intake on the HVAC system. Provide different positive pressure zones with a minimum air intake ratio. Insert efficient gas and particle filters.
- Blocking the infiltration of pollutants in enclosures
- Use airtight enclosures or air-filtered positive pressure systems.
- Wrap objects with sorbent tissues, such as acid-free tissues or cotton fabrics.
- Blocking the emission of pollutants from products in rooms and enclosures
- Apply a barrier film on the surface of emissive wood products.
- Blocking the transfer (deposition or sorption) of pollutants to objects
- Apply a barrier film on the surface of objects.
- Diluting and filtering pollutants in rooms and buildings
- Increase the distance between the source of the pollutant and the objects.
- Use local exhaust fans for the most polluting activities (kitchen, workshop, chemical store).
- Use portable fans to push the air out of the room and building (during periods of short-term high emissions, such as when there are freshly painted walls or floors).
- Filter the recirculating air of the HVAC system or use a portable filter unit.
- Diluting and sorbing pollutants in enclosures
- Consider the stack pressure design of the enclosure if the environment of the room is well controlled, or use air-filtered positive pressure systems.
- Dilute (flush) air with a non-reactive gas such as argon, helium or nitrogen.
- Use passive or active sorbent methods (examples include gas, particle, water vapour or oxygen sorbents).
- Reducing reactions on objects
- Decrease RH, temperature or the UV, visible and infrared radiation.
- Neutralize pollutants absorbed into the objects (for example, alkaline compounds in papers inhibit acid deterioration).
- Reducing exposure time
- Limit the exposure of objects to inappropriate environments.
- Monitoring the collection
- Inspect for signs of deterioration on objects, the enclosure and building products periodically.
- Monitoring pollutants in rooms and in enclosures
- Do appropriate in situ monitoring of pollutants.
- Monitoring the performance of control features
- Verify the efficiency of the gas and dust filter systems periodically.
- Measure the leakage rate of the building and enclosures.
- Responding to the detection of pollutants or damage to objects
- Protect objects from harmful environments.
- Re-evaluate avoid, block and reduce strategies and consider the cost-benefit analysis.
- Remove dust accumulation on objects, in the building and on enclosure surfaces periodically. Minimize the resuspension of dust.
- Treating damaged objects
- Clean and treat objects, if necessary, to limit further deterioration.
Suppliers
Note: The following information is provided only to assist the reader. Inclusion of a company in this list does not in any way imply endorsement by CCI. Other companies may exist that offer similar products.
A-D strips
Direct reading diffusion tubes
Diffusion samplers with analysis required
Monitoring systems
- Camfil molecular air filter contamination control
- The French Corrosion Institute atmospheric corrosion loggers
- Purafil monitoring
Appendix: Concentration units
Two different units can be used to quantify the concentration of most airborne pollutants:
- ppb (by volume) is a measure of the volume fraction of pollutants in the ambient air; 1 ppb means there is 1 pollutant present in a group of 1 billion air molecules (equivalent to 1 × 10⁻⁹)
- micrograms per cubic metre (µg/m3) represents the quantity of a pollutant per unit volume
The two units are related in the following way (given a temperature of 21°C and an atmospheric pressure of 101.3 kPa):
ppb = µg/m3 × 24.04 ÷ (molecular weight)
For example, to convert 2.5 µg/m3 acetic acid into ppb, multiply 2.5 by 24.04 (the molar volume of a perfect gas) and divide by 60.05 g/mol (the molecular weight of acetic acid). The result is 1 ppb (or 0.0000001%).
As a rule of thumb, for most pollutants, 1 ppb is roughly equivalent to 2 µg/m3. The exact conversions for some pollutants are provided in Table 8.
| Pollutant | Conversion factor |
|---|---|
| Acetic acid | 1 ppb = 2.50 µg/m3 |
| Ammonia | 1 ppb = 0.71 µg/m3 |
| Formic acid | 1 ppb = 1.91 µg/m3 |
| Hydrogen sulfide | 1 ppb = 1.42 µg/m3 |
| Nitrogen dioxide | 1 ppb = 1.91 µg/m3 |
| Ozone | 1 ppb = 2.00 µg/m3 |
| Sulfur dioxide | 1 ppb = 2.67 µg/m3 |
| Particles and VOCs | The concentration of particles and VOCs cannot easily be converted to ppb due to the different molecular weights of the fine particles. |
A program to convert concentration units can be found on the IAQ in Museums and Archives website.
Note that the Compressed Air & Gas Institute (2012) recommends using a standard temperature and pressure of 20°C and 100.0 kPa to standardize reporting for volumetric units.
Bibliography
Adams, S., P. Brimblecombe and Y.H. Yoon. “Comparison of Two Methods for Measuring the Deposition of Indoor Dust.” The Conservator 25,1 (2001), pp. 90–94.
Adams, S., K. Eremin and J. Tate. “Monitoring of Deposited Particle Levels Within the Royal Museum of Scotland: Distribution Patterns and the Effects of Nearby Construction Work.” In J.H. Townsend, K. Eremin and A. Adriaens, eds., Conservation Science. London, UK: Archetype Publications, 2003, pp. 11–17.
Airepure Australia. “Commercial Building Filtration Standards: Making Sense of Recent Changes.” Hotel Engineer 22,1 (2017), pp. 23–28.
American Institute for Conservation Wiki. Oddy Tests: Materials Databases. [N.p.]: American Institute for Conservation, [n.d.].
American Society of Heating, Refrigerating and Air-Conditioning Engineers. ANSI/ASHRAE 52.2, Method of Testing General Ventilation Air-Cleaning Devices for Removal Efficiency by Particle Size. Atlanta, GA: ASHRAE, 2007.
American Society of Heating, Refrigerating and Air-Conditioning Engineers. “Control of Gaseous Indoor Air Contaminants.” In M.S. Owen, ed., ASHRAE Handbook: Heating, Ventilating, and Air-Conditioning Applications. Atlanta, GA: American Society of Heating, Refrigerating and Air-Conditioning Engineers, 2011, pp. 46.1–46.19.
American Society of Heating, Refrigerating and Air-Conditioning Engineers. ANSI/ASHRAE 62.1, Ventilation for Acceptable Indoor Air Quality. Atlanta, GA: ASHRAE, 2019a.
American Society of Heating, Refrigerating and Air-Conditioning Engineers. “Museums, Galleries, Archives and Libraries.” In M.S. Owen, ed., ASHRAE Handbook: Heating, Ventilating, and Air-Conditioning Applications. Atlanta, GA: ASHRAE, 2019b, pp. 24.1–24.46.
American Society of Heating, Refrigerating and Air-Conditioning Engineers. ASHRAE Guideline 27, Measurement Procedures for Gaseous Contaminants in Commercial Buildings. Atlanta, GA: ASHRAE, 2019c.
Ankersmit, H.A., et al. “The Protection of Silver Collections from Tarnishing.” In A. Roy and P. Smith, eds., Tradition and Innovation: Advances in Conservation. Contributions to the Melbourne Congress, 10–14 October 2000. London, UK: International Institute for Conservation of Historic and Artistic Works, 2000, pp. 7–13.
Ankersmit, H.A., N.H. Tennent and S. Watts. “Hydrogen Sulfide and Carbonyl Sulfide in the Museum Environment – Part 1.” Atmospheric Environment 39 (2005), pp. 695–707.
Arney, J.S., A.J. Jacobs and R. Newman. “The Influence of Oxygen on the Fading of Organic Colorants.” Journal of American Institute for Conservation 18 (1979), pp. 108–117.
Bartl, B., et al. “The Effect of Dust Particles on Cellulose Degradation.” Studies in Conservation 61,4 (2016), pp. 203–208.
Beecher, R. “Apparatus for Keeping a Showcase Free from Dust: An Experiment at the Victoria and Albert Museum.” Museums Journal 70,2 (September 1970), pp. 69–71.
Belcher, M. “Second Design Conference.” Museums Journal 72,2 (1972), pp. 58–62.
Biddle, W. “Art in Cornell Museum Coated by Chemical Used in Steam Lines.” The New York Times (July 29, 1983), pp. B-1–B-2.
Blades, N. “Gaseous Pollution in Museum Environment: The Uses and Abuses of Monitoring Campaigns.” The Conservator 22,1 (1998), pp. 44–48.
Brimblecombe, P., D. Thickett and Y.H. Yoon. “The Cementation of Coarse Dust to Indoor Surfaces.” Journal of Cultural Heritage 10,3 (2009), pp. 410–414.
Brokerhof, A.W., and M. Van Bommel. “Deterioration of Calcareous Materials by Acetic Acid Vapour: A Model Study.” In J. Bridgland, ed., Preprints of the 11th Triennial Meeting, Edinburgh, Scotland, 1–6 September 1996, vol. 2. London, UK: James & James (Science Publishers) Ltd., 1996, pp. 769–775.
Brommelle, N.S. “Bloom in Varnished Paintings.” Museums Journal 55,10 (1956), pp. 263–266.
Burge, D., N. Gordeladze, J.-L. Bigourdan and D. Nishimura. “Effects of Ozone on the Various Digital Print Technologies: Photographs and Documents.” Journal of Physics: Conference Series 231,1 (2010), pp. 1–6.
Burge, D., N. Gordeladze, J.-L. Bigourdan and D. Nishimura. “Effects of Nitrogen Dioxide on the Various Digital Print Technologies: Photographs and Documents.” In Digital Fabrication 2011: NIP 27, 27th International Conference on Digital Printing Technologies; Technical Programs and Proceedings; 2–6 October 2011, Minneapolis, Minnesota [7th International Conference on Digital Fabrication]. Springfield, VA: Imaging Science and Technology, 2011, pp. 205–208.
Byers, R., and V. Thorp. “Positive Pressure Display Cases at the Royal British Columbia Museum.” In Conservationally Correct: Realities and Innovations for Exhibitions, IIC-CG Workshop ‘95. Calgary, AB: International Institute for Conservation of Historic and Artistic Works – Canadian Group, 1995, pp. 81–82.
Calver, A., A. Holbrook, D. Thickett and S. Weintraub. “Simple Methods to Measure Air Exchange Rates and Detect Leaks in Display and Storage Enclosures.” In I. Verger, ed. ICOM-CC 14th Triennial Meeting, The Hague, The Netherlands, 12–16 September 2005: Preprints. London, UK: James & James/Earthscan, 2005, pp. 597–609.
Camfil. “Mold & Air Filtration” (PDF format). Camfil Technical Services Bulletin, Riverdale, NJ: Camfil, 2013.
Camfil. Comparison Chart (PDF format). Riverdale, NJ: Camfil, 2017.
Canadian Conservation Institute. The Use of Commercial Paints in Museums [video]. Ottawa, ON: Canadian Conservation Institute, 2017.
Canadian Council of Ministers of the Environment. Canadian Ambient Air Quality Standards. [N.p.] Canadian Council of Ministers of the Environment, 2021.
Canosa, E., and S. Norrehed. Strategies for Pollutant Monitoring in Museum Environments. Visby, Sweden: Swedish National Heritage Board, 2019.
Carroll, J.F., and J.M. Calhoun. “Effect of Nitrogen Oxide Gases on Processed Acetate Film.” Journal of the SMPTE 64,9 (September 1955), pp. 501–507.
Cass, G.R., et al. “Protection of Works of Art from Atmospheric Ozone.” Research in Conservation 5. Marina del Rey, CA: Getty Conservation Institute, 1989.
Chahine, C. “Acidic Deterioration of Vegetable Tanned Leather.” In C. Calnan and B. Haines, eds., Leather: Its Composition and Changes with Time. Northampton, UK: The Leather Conservation Center, 1991, pp. 75–79.
Clarke, S.G., and E.E. Longhurst. “The Corrosion of Metals by Acid Vapours from Wood.” Journal of Applied Chemistry 11,11 (1961), pp. 435–443.
Compressed Air & Gas Institute. Glossary – Standard Air. Cleveland, OH: Compressed Air & Gas Institute, 2012.
Coughlin, M. Monitoring Acidic Off-Gassing of Plastics [online]. Conserve O Gram 8/5. Washington, D.C.: National Park Service, 2011.
Coughlin, M., and A. M. Seeger. “You Collected What?! The Risks and Rewards of Acquiring Cellulose Nitrate.” In B. Keneghan and L. Betts, eds., Plastics – Looking at the Future and Learning from the Past: Papers from the Conference held at the Victoria and Albert Museum, London, 23–25 May 2007. London, UK: Archetype, 2008, pp. 119–124.
Donovan, P.D., and J. Stringer. “The Corrosion of Metals by Organic Acid Vapours.” In N.E. Hammer ed., Proceedings of the 4th International Congress on Metallic Corrosion. Houston, TX: National Association of Corrosion Engineers, 1972, pp. 537–543.
Down, J., J. Iraci and G. Hill. “Photographic Activity Tests of Various Adhesives Suggested for Use on Water-Sensitive Photographs.” In J. Keister, comp., Topics in Photographic Preservation 15 (2013), pp. 475–483.
Dräger. Dräger-Tubes & CMS-Handbook: Soil, Water, and Air Investigations as well as Technical Gas Analysis (PDF format), 18th ed. Lübeck, Germany: Dräger Safety, 2018.
Dubus, M., et al. “Monitoring Copper and Silver Corrosion in Different Museum Environments by Electrical Resistance Measurement.” Studies in Conservation 55,2 (2010), pp. 121–133.
Dupont, A.–L., C. Egasse, A. Morin and F. Vasseur. “Comprehensive Characterisation of Cellulose and Lignocellulose Degradation Products in Aged Papers: Capillary Zone Electrophoresis of Low-Molar Mass Organic Acids, Carbohydrates, and Aromatic Lignin Derivatives.” Carbohydrate Polymers 68,1 (2007), pp. 1–16.
Environment and Climate Change Canada. National Air Pollution Surveillance (NAPS) Program. [N.p.]: Environment and Climate Change Canada, [n.d.].
Environment and Climate Change Canada. International comparison of urban air quality. Environment and Climate Change Canada, 2016.
Environment and Natural Resources. Interactive indicator maps. [N.p.]: Environment and Natural Resources, [n.d.].
Feliu, S., M. Morcillo and B. Chico. “Effect of Distance from Sea on Atmospheric Corrosion Rate.” Corrosion 55,9 (September 1999), pp. 883–891.
Fenech, A., M. Strlič, I. Degano and M. Cassar. “Stability of Chromogenic Colour Prints in Polluted Indoor Environments.” Polymer Degradation Stability 95,12 (2010), pp. 2481–2485.
Fenn, J., and R.S. Williams. Caring for Plastics and Rubbers. Ottawa, ON: Canadian Conservation Institute, 2018.
Fiaud, C., and J. Guinement. “The Effect of Nitrogen Dioxide and Chlorine on the Tarnishing of Copper and Silver in the Presence of Hydrogen Sulfide.” In F. Mansfield, V. Kucera, S.E. Haagenrud and F.H. Haynie, eds., Proceedings of the Symposia on Corrosion Effects of Acid Deposition and Corrosion of Electronic Materials. Electrochemical Society 86–6 (1986), pp. 280–304.
Glasbau Hahn. Hahn Pure: Conservation at its best. Frankfurt, Germany: Glasbau Hahn, [n.d.].
Gordeladze, N., and D. Burge. “Colorant Fade and Page Yellowing of Bound and Unbound Materials Printed Using Digital Presses and Offset Lithography when Exposed to O3 or NO2.” Digital Fabrication 2012: NIP28, 28th International Conference on Digital Printing Technologies, 9–13 September 2012, Quebec City, Quebec, Technical Program and Proceedings. [N.p.] Society for Imaging Science and Technology, 2012, pp. 387–391.
Gordeladze, N., D. Burge and B.M. Gamm. “Further Observations of Ozone and Nitrogen Dioxide Pre-Dosed Digital Prints Over Time.” Journal of Imaging Science and Technology 56,6 (2012), pp. 1–10.
Government of Quebec. Réseau de surveillance de la qualité de l’air du Québec. (Air Quality Monitoring Network.) [N.p.]: Government of Quebec, ministère de l’Environnement et de la Lutte contre les changements climatiques, [n.d.].
Graedel, T.E. “Copper Patinas Formed in the Atmosphere: II. A Qualitative Assessment of Mechanisms.” Corrosion Science 27 (1987a), pp. 721–740.
Graedel, T.E. “Copper Patinas Formed in the Atmosphere: III. A Semi-Quantitative Assessment of Rates and Constraints in the Greater New York Metropolitan Area.” Corrosion Science 27 (1987b), pp. 741–769.
Grau-Bové, et al. “The Effect of Particulate Matter on Paper.” Heritage Science 4 (2016), pp. 1–8.
Grau-Bové, J., and M. Strlič. “Fine Particulate Matter in Indoor Cultural Heritage: A Literature Review.” Heritage Science 1 (2013), pp. 1–17.
Grosjean, D., E. Grosjean and E.L. Williams II. “Fading of Artists’ Colorants by a Mixture of Photochemical Oxidants.” Atmospheric Environment 27A (1993), pp. 765–772.
Gui-Yang, L., and J.L. Koenig. “A Review of Rubber Oxidation.” Rubber Chemistry and Technology 78,2 (2005), pp. 355–390.
Gurnagul, N., and X. Zou. “The Effect of Atmospheric Pollutants on Paper Permanence: A Literature Review.” Tappi Journal 77 (1994), pp. 199–204.
Hackney, S. “Colour Measurement of Acid-Detector Strips for the Quantification of Volatile Organic Acids in Storage Conditions,” Studies in Conservation 61, Suppl. 1 (2016), pp. 55–69.
Halsberghe, L., L.T. Gibson, and D. Erhardt. “A Collection of Ceramics Damaged by Acetate Salts: Conservation and Investigation into the Causes.” In I. Verger, ed., ICOM-CC 14th Triennial Meeting, The Hague, The Netherlands, 12–16 September 2005: Preprints. London, UK: James & James (Science Publishers) Ltd., 2005, pp. 131–138.
Hatchfield, P. Pollutants in the Museums Environment: Practical Strategies for Problem Solving in Design, Exhibition and Storage. London, UK: Archetype Publications, 2002.
Havermans, J.B.G.A., and T.A.G. Steemers. “Air Pollution and its Preservation.” In M. Strlič and J. Kolar eds., Ageing and Stabilisation of Paper. Ljubljana, Slovenia: National and University Library, 2005, pp. 165–179.
Heald, S. “Case Filtration Methods and Effectiveness to Remediate Crystal Growth Caused by TMP in Adhesive: Approaches to Identification and Mitigation.” Indoor Air Quality in the Museum Environment Workshop, New York, February 13–14, 2020: Abstract. New York, NY: Metropolitan Museum of Art, 2020, pp. 59–60.
Hecker, R., and K.C. Hofacre. Development of Performance Data for Common Building Air Cleaning Devices (PDF format). Research Triangle Park, NC: U.S. Environmental Protection Agency, 2008, pp. E1–E33.
Hisham, M.W.M., and D. Grosjean. “Sulfur Dioxide, Hydrogen Sulfide, Total Reduced Sulfur Chlorinated Hydrocarbons and Photochemical Oxidants in Southern California Museums.” Atmospheric Environment 25A,8 (1991), pp. 1497–1505.
Hoevel, C.L. “A Study of the Discoloration Products Found in White Lead Paint Films.” In J. Abt, ed., The 1985 Book and Paper Group Annual. Washington, D.C.: The Book and Paper Group, 1985, pp. 35–42.
Howarth, K. “Handling and Care of Modern Audio Tape.” In S. Clark, ed., Care of Photographic, Moving Image & Sound Collections, University College of Ripon & York St John, York, England, 20–24 July 1998: Conference Papers. Leigh, UK: Institute of Paper Conservation, 1999, pp. 172–176.
IAQ in Museums and Archives. Concentration Converter. [N.p.]: IAQ in Museums and Archives, [n.d.].
International Organization for Standardization. ISO 18923:2000, Imaging Materials – Polyester-Base Magnetic Tape – Storage Practices. Geneva, Switzerland: International Organization for Standardization, 2000.
International Organization for Standardization. ISO 18916:2007, Imaging Materials – Processed Imaging Materials – Photographic Activity Test for Enclosure Materials. Geneva, Switzerland: International Organization for Standardization, 2007.
International Organization for Standardization. ISO 16890-1:2016, Air Filters for General Ventilation — Part 1: Technical Specifications, Requirements and Classification System Based upon Particulate Matter Efficiency (ePM). Geneva, Switzerland: International Organization for Standardization, 2016a.
International Organization for Standardization. ISO 12103-1:2016, Road Vehicles – Test Contaminants for Filter Evaluation – Part 1: Arizona Test Dust. Geneva, Switzerland: International Organization for Standardization, 2016b.
IVL Swedish Environmental Research Institute. Measuring Range of IVL’s Diffusive Samplers [unpublished]. Stockholm, Sweden: IVL Swedish Environmental Research Institute, 2016.
Jaffe, L.S. “The Effects of Photochemical Oxidants on Materials.” Journal of the Air Pollution Control Association 17,6 (1967), pp. 375–378.
Klawitter, B. MERV/ASHRAE 52.2 Vs ISO 16890 Efficiency Charts. Filtration system Inc. 2017.
Knight, B. “Measuring Particulates in Historic Buildings: A Comparison of Methodologies.” In M. Ryhl-Svendsen, ed., IAP Copenhagen 2001: 4th Meeting of the Indoor Air Pollution Working Group, Presentation Abstracts, Copenhagen, 8–9 November 2001. Copenhagen, Denmark: The National Museum of Denmark, 2001, pp. 53–67.
Knight, B. “Dust Deposition and Measurement in Libraries.” International Preservation News 53 (2011), pp. 16–18.
Koob, S.P., N.A.R van Giffen, J.J. Kunicki-Goldfinger and R.H. Brill. “Caring for Glass Collections: The Importance of Maintaining Environmental Controls.” Studies in Conservation 63, Suppl. 1 (2018), pp. 146–150.
Krupinska, B., R. Van Grieken and K. De Wael. “Air Quality Monitoring in a Museum for Preventive Conservation: Results of a Three-Year Study in the Plantin-Moretus Museum in Antwerp, Belgium.” Microchemical Journal 110 (2013), pp. 350–360.
Larsen, R. “Deterioration and Conservation of Vegetable Tanned Leathers: Effects of the Environment on Indoor Cultural Property.” European Cultural Heritage Review, Special Edition: Awards 10 (1997), pp. 54–61.
Lloyd, H., C. Bendix, P. Brimblecombe and D. Thickett. “Dust in Historic Libraries.” In T. Padfiled and K. Borchersen, eds., Museum Microclimates. Copenhagen, Denmark: The National Museum of Denmark, 2007. pp. 135–144.
Lyth Hudson, F. “Acidity of 17th and 18th Century Books in Two Libraries.” Paper Technology 8,3 (1967), pp. 189–196.
Maekawa, S. Oxygen-free Museum Cases. Research in Conservation. Los Angeles, CA: Getty Conservation Institute, 1998.
Malagodi, M., et al. “Alteration Processes of Pigments Exposed to Acetic and Formic Acid Vapors.” 2017 IEEE International Conference on Environment and Electrical Engineering and 2017 IEEE Industrial and Commercial Power Systems Europe, (EEEIC / I&CPS Europe), Milan, Italy, 6–9 June 2017. Piscataway, NJ: Institute of Electrical and Electronics Engineers, 2017, pp. 1–6.
MEMORI. Mitigation. [N.p.]: Norwegian Institute for Air Research [n.d.].
Menart, E., G. De Bruin and M. Strlič. “Dose-Response Functions for Historic Paper.” Polymer Degradadation and Stability 96 (2011), pp. 2029–2039.
Metro Vancouver. GIS – AirMap. Burnaby, B.C.: Metro Vancouver, 2016.
Muller, C. Practical Applications of Reactivity Monitoring in Museums and Archives – Considerations for Monitoring and Classifications of Gaseous Pollutants (PDF format). Doraville, GA: Purafil, Inc. [n.d.].
Muller, C. “Gaseous Contamination Control Strategies at The Hague.” Papers from the 87th Annual Meeting & Exhibition Proceedings, Cincinnati, Ohio, June 1994. Pittsburgh, PA: Air & Waste Management Association, 1994.
Muller, C. “Practical Applications of Reactivity Monitoring in Museums and Archives.” In J. H. Townsend, K. Eremin and A. Adriaens, eds. Conservation Science 2002: Papers from the Conference held in Edinburgh, Scotland, 22–24 May 2002. London, UK: Archetype Publications, 2003, pp. 50–57.
National Archives of Australia. About the photographic activity test. Canberra, AU: National Archives of Australia, [n.d.].
National Fire Protection Association. NFPA 40, Standard for the Storage and Handling of Cellulose Nitrate Film. Quincy, MA: National Fire Protection Association, 2019.
National Physical Laboratory. Guides to Practice in Corrosion Control: Corrosion of Metals by Wood (PDF format). Teddington, UK: National Physical Laboratory, [n.d.].
Newman, R., M. Derrick, E. Byrne and M. Tan. “Strange Events Inside Display Cases at the Museum of Fine Arts, Boston, and Lessons To Be Learned From Them – Part 1.” In R. Singerman, ed., Conference and Exhibition Planning: Material Testing for Design, Display, and Packing, Washington, D.C., 19–20 November 2015 (PDF format). Washington, D.C.: Smithsonian American Art Museum, p. 11.
Nicholson, C., and E. O’Loughlin. “The Use of A-D Strips for Screening Conservation and Exhibit Materials.” AIC Book and Paper Group Annual 15 (1996), pp. 83–85.
Nishimura, D. “Strategies for the Storage of Cellulose Acetate Film.” AIC News 40,6 (November 2015), pp. 1, 3–5.
Nørgaard, A.W, et al. “Ozone-initiated VOC and Particle Emissions from a Cleaning Agent and an Air Freshener: Risk Assessment of Acute Airway Effects.” Environment International 68 (July 2014), pp. 209–218.
Nguyen T.-P., B. Lavédrine and F. Flieder. “Effets de la pollution atmosphérique sur la dégradation de la gélatine photographique.” (in French only) In J. Bridgland and J. Brown, eds., ICOM-CC 12th Triennial Meeting, Lyon, France, 29 August to 3 September 1999: Preprints, vol. 1. London, UK: James & James (Science Publishers) Ltd., 1999, pp. 567–570.
Ordonez, E., and J. Twilley. “Clarifying the Haze – Efflorescence on Works of Art.” WAAC Newsletter 20,1 (January 1998).
Organ, R.M. “Remarks on Inhibitors Used in Steam Humidification.” Bulletin of the IIC - American Group 7,2 (1967), p. 31.
Ormantine USA Ltd. Technical Data Sheet: TDS 4, DIF 200 RTU – Hydrogen Sulphide (H2S) (PDF format). Palm Bay. FL: Ormantine USA Ltd., 2012.
Oshio, R. “Contamination Control of Alkaline Substance in Newly Built Museums.” Scientific Papers on Japanese Antiques and Art Crafts 37 (1992), pp. 54–59.
Pastorelli, G., et al. “Environmentally Induced Colour Change During Natural Degradation of Selected Polymers.” Polymer Degradation and Stability 107 (2014), pp. 198–209.
Paterakis, A.B. Volatile Organic Compounds and the Conservation of Inorganic Materials. London, UK: Archetype Publications, 2016.
Poppendieck, D.G., D. Rim and A.K. Persily. “Ultrafine Particle Removal and Ozone Generation by In-Duct Electrostatic Precipitators.” Environmental Science and Technology 48,3 (2014), pp. 2067–2074.
Poulin, J., K. Bladek and K. Helwig. “Analysis of Crystals Forming on Objects and Glass Panels in a Display Case, CCI Report CSD 5615” [unpublished]. Ottawa, ON: Canadian Conservation Institute, 2019.
Poulin, J., H. Coxon, J.R. Anema, K. Helwig and M.-C. Corbeil. “Investigation of Fogging on Glass Display Cases at the Royal Ontario Museum.” Studies in Conservation 65,1 (2020), pp. 1–13.
Raychaudhuri, M.R., and P. Brimblecombe. “Formaldehyde Oxidation and Lead Corrosion.” Studies in Conservation 45,4 (2000), pp. 226–232.
Reilly, J.M. IPI Storage Guide for Acetate Film: Instructions for Using the Wheel, Graphs, and Table – Basic Strategy for Film Preservation. Rochester, NY: Image Permanence Institute, 1993.
Reilly, J.M. Storage Guide for Color Photographic Materials: Caring for Color Slides, Prints, Negatives, and Movie Films. Albany, NY: University of the State of New York, 1998.
Reilly, J.M., E. Zinn, and P. Adelstein. Atmospheric Pollutant Aging Test Method Development: Report to American Society for Testing and Materials. Rochester, NY: Image Permanence Institute, 2001.
Robinet, L. The Role of Organic Pollutants in the Alteration of Historic Soda Silicate Glasses (PDF format). PhD Thesis, Edinburgh University, 2006.
Rodgers, J. “Preservation of Modern Media.” In S. Clark, ed., Care of Photographic, Moving Image & Sound Collections, University College of Ripon & York St John, York, England, 20–24 July 1998: Conference Papers. Leigh, UK: The Institute of Paper Conservation, 1999, pp. 6–10.
Russell, R., and K. Winkworth. Significance: A Guide to Assessing the Significance of Collections (PDF format), 2nd ed. Rundle Mall, Australia: Collections Council of Australia Ltd, 2009.
Ryhl-Svendsen, M., and G. Clausen. “The Effect of Ventilation, Filtration and Passive Sorption on Indoor Air Quality in Museum Storage Rooms.” Studies in Conservation 54,1 (2009), pp. 35–48.
Saito, M., S. Goto and M. Kashiwagi. “Effect of the Concentration of NO2 Gas to the Fading of Fabrics Dyed with Natural Dyes.” Scientific Papers on Japanese Antiques and Art Crafts 39 (1994), pp. 67–74.
Saraga, D., et al. “Studying the Indoor Air Quality in Three Non-Residential Environments of Different Use: A Museum, a Printery Industry and an Office.” Building and Environment 46,11 (2011), pp. 2333–2341.
Saunders, D. “The Environment and Lighting in the Sainsbury Wing of the National Gallery.” In J. Bridgland ed., ICOM Committee for Conservation 10th Triennial Meeting, Washington, D.C., 22–27 August 1993: Preprints. Paris, France: ICOM Committee for Conservation, 1993, pp. 630–635.
Schieweck, A. “Adsorbent Media for the Sustainable Removal of Organic Air Pollutants from Museum Display Cases.” Heritage Science 8,12 (2020).
Schieweck, A., and T. Salthammer. “Emissions from Construction and Decoration Materials for Museum Showcases.” Studies in Conservation 54,4 (January 2009), pp. 218–235.
Scott, D.A., and M.R. Derrick. “Deterioration of Cadmium-Coated Instruments in Museum Storage.” Studies in Conservation 52,1 (2007), pp. 59–68.
Seabright, L.H., and J. Trezek. “Notes on the Prevention of White Powder Corrosion of Cadmium Plate.” Plating (1948), pp. 715–718.
Selwyn, L. Metals and Corrosion: A Handbook for the Conservation Professional. Ottawa, ON: Canadian Conservation Institute, 2004.
Shashoua, Y. Conservation of Plastics: Materials Science, Degradation and Preservation. Oxford, UK: Butterworth-Heinemann, 2008.
Shashoua, Y., and S. Thomsen. “A Field Trial for the Use of Ageless in the Preservation of Rubber in Museum Collections.” In D.W. Grattan, ed., Saving the Twentieth Century: The Conservation of Modern Materials, Proceedings of a Conference Symposium 1991 / Sauvegarder le XXe siècle : la conservation des matériaux modernes, Actes d’un congrès symposium 1991. Ottawa, ON: Canadian Conservation Institute, 1993, pp. 363–377.
Shair, F.H., and K.L. Heitner. “Theoretical Model for Relating Indoor Pollutant Concentrations to Those Outside.” Environmental Science & Technology 8,5 (1974), pp. 444–451.
Singer, B.C., W.W. Delp, D.R. Black and I.S. Walker. “Measured Performance of Filtration and Ventilation Systems for Fine and Ultrafine Particles and Ozone in an Unoccupied Modern California House.” Indoor Air 27,4 (December 2016).
Smith, A., R. Goodhue and S. Bioletti. “Monitoring Deposited Dust in the Old Library, Trinity College Dublin.” International Preservation News 53 (2011), pp. 19–23.
Stanek, S., et al. “Preventive Conservation Strategies in the Re-opened Collection of the Kunstkammer of the Kunsthistorisches Museum Vienna: Theory Versus Practice.” (PDF format) Slides presented at the 12th International Conference of Indoor Air Quality in Heritage and Historic Environments. Birmingham, England, March 3–4, 2016.
Stephens, B., and J.A. Siegel. “Comparison of Test Methods for Determining Particle Removal Efficiency of Filters in Residential and Light-Commercial Central HVAC Systems.” Aerosol Science and Technology 46,5 (2012), pp. 504–513.
Stephens, B., T. Brennan and L. Harriman. “Selecting Ventilation Air Filters to Reduce PM2.5 of Outdoor Origin.” ASHRAE Journal (September 2016), pp. 12–20.
Stockman, D. “Treatment Options for Oil Stains on Paper.” The Book and Paper Group Annual 26 (2007), pp. 115–126.
Tétreault, J. Agent of deterioration: pollutants. Ottawa, ON: Canadian Conservation Institute, [n.d.].
Tétreault, J. “Measuring the Acidity of Volatile Products.” Journal of the International Institute for Conservation – Canadian Group 17 (1992).
Tétreault, J. Airborne Pollutants in Museums, Galleries, and Archives: Risk Assessment, Control Strategies, and Preservation Management. Ottawa, ON: Canadian Conservation Institute, 2003.
Tétreault, J. Low-Cost Plastic/Aluminum Barrier Foil. CCI Notes 1/9, Ottawa, ON: Canadian Conservation Institute, 2010.
Tétreault, J. “Sustainable Use of Coatings in Museums and Archives – Some Critical Observations.” e-Preservation Science 8 (2011), pp. 39–48.
Tétreault, J. Products Used in Preventive Conservation. Technical Bulletin 32. Ottawa, ON: Canadian Conservation Institute, 2017.
Tétreault, J. “The Evolution of Specifications for Limiting Pollutants in Museums and Archives.” Journal of the Canadian Association for Conservation of Cultural Property 43 (2018), pp. 21–37.
Tétreault, J., and P. Bégin. Silica Gel: Passive Control of Relative Humidity. Technical Bulletin 33. Ottawa, ON: Canadian Conservation Institute, 2018.
Tétreault, J., and R.S. Williams. “Crystals on Cellulose Nitrate” [unpublished]. Ottawa, ON: Canadian Conservation Institute, 2002.
Tétreault, J., J. Sirois and E. Stamatopoulou. “Studies of Lead Corrosion in Acetic Acid Environments.” Studies in Conservation 43,1 (1998), pp. 17–32.
Tétreault, J., A.-L. Dupont, P. Bégin and S. Paris. “The Impact of Volatile Compounds Released by Paper on Cellulose Degradation in Ambient Hygrothermal Conditions.” Polymer Degradation and Stability 98,9 (2013), pp. 1827–1837.
Tétreault, J., et al. “Corrosion of Copper and Lead by Formaldehyde, Formic and Acetic Acid Vapours.” Studies in Conservation 48,4 (2003), pp. 237–250.
Thickett, D. Relative Effects of Formaldehyde, Formic and Acetic Acids on Lead, Copper and Silver. Report 1997/12. London, UK: British Museum Department of Conservation, 1997.
Thickett, D. “Frontiers of Preventive Conservation.” Studies in Conservation 63, Suppl. 1 (2018), pp. 262–267.
Thickett, D., R. Chisholm, and P. Lankester. “Reactivity Monitoring of Atmospheres.” In E. Hyslop, V. Gonzalez, L. Troalen and L. Wilson, eds., Metal 2013: Proceedings of the Interim Meeting of the ICOM-CC Metal Working Group, Edinburgh, Scotland, 16–20 September 2013. Edinburgh, Scotland: Lulu Enterprises, Inc., 2013, pp. 129–135.
Thickett, D., and V. Costa. “The Effect of Particulate Pollution on the Corrosion of Metals in Heritage Locations.” In J. Bridgland, ed., Building Strong Culture Through Conservation, ICOM-CC 17th Triennial Conference, Melbourne, Australia, 15–19 September 2014: Preprints. Paris, France: The International Council of Museums, 2014, pp. 432–439.
Thickett, D., F. David and N. Luxford. “Air Exchange Rate – The Dominant Parameter for Preventive Conservation?” The Conservator 29,1 (2005), pp. 19–34.
Thomson, G. The Museum Environment, 2nd ed. London, UK: Butterworth-Heinemann, 1986.
U.S. Environmental Protection Agency. What is the definition of VOC? Washington, D.C.: U.S. Environmental Protection Agency, [n.d.].
U.S. Environmental Protection Agency. Residential Air Cleaners: A Technical Summary, 3rd ed. (PDF format) Washington, D.C.: U.S. Environmental Protection Agency, 2018.
U.S. Green Building Council. LEED for Existing Buildings, Version 2.0: Reference Guide, 2nd ed. Washington D.C.: U.S. Green Building Council, 2006.
Van Bogart, J.W.C. Magnetic Tape Storage and Handling: A Guide for Libraries and Archives. Washington, D.C.: The Commission on Preservation and Access, 1995.
Volent, P., and N.S. Baer. “Volatile Amines Used as Corrosion Inhibitors in Museum Humidification Systems.” International Journal of Museum Management and Curatorship 4,4 (1985), pp. 359–364.
Wei, W., et al. “Experience with Dust Measurements in Three Dutch Museums.” ZKK Zeitschrift für Kunsttechnologie und Konservierung 21,2 (2007), pp. 261–269.
Wheeler, J. “Videotape Preservation.” In S. Monod, ed., Environnement et conservation de l’écrit, de l’image et du son : actes des deuxièmes Journées internationales d’études de l’ARSAG, 16 au 20 mai 1994. Paris, France: Association pour la recherche scientifique sur les arts graphiques, 1994, pp. 172–176.
Whitmore, P.M., and G.R. Cass. “The Fading of Artists’ Colorants by Exposure to Atmospheric Nitrogen Dioxide.” Studies in Conservation 34,2 (1989), pp. 85–97.
Whitmore, P.M., G.R. Cass and J.R. Druzik. “The Ozone Fading of Traditional Natural Organic Colorants on Paper.” Journal of the American Institute for Conservation 26,1 (Spring 1987), pp. 45–58.
Wiegner, K., et al. “Den Schadstoffen auf der Spur: Die Bewertung von Emissionen aus Materialien für Museumsausstattungen mithilfe des neuen BEMMA-Schemas” [Tracing pollutants: assessment of emissions from materials for museum equipment]. Restauro 118,3 (2012), pp. 38–44.
Williams E.L., E. Grosjean and D. Grosjean. “Exposure of Artists’ Colorants to Sulfur Dioxide.” Journal of the American Institute for Conservation 32,3 (1993), pp. 291–310.
Williams, R.S. “Blooms, Blushes, Transferred Images and Mouldy Surfaces: What are These Distracting Accretions on Art Works?” In J.G. Wellheiser, ed., Proceedings of the 14th Annual IIC-CG Conference / Actes du 14e Congrès annuel de l’IIC-GC. Ottawa, ON: International Institute for Conservation of Historic and Artistic Works, Canadian Group, 1989, pp. 65–84.
Williams, S. Care of Objects Made from Rubber and Plastic. CCI Notes 15/1. Ottawa, ON: Canadian Conservation Institute, 1997.
Zhang, J., and P.J. Lioy. “Ozone in Residential Air: Concentrations, I/O Ratios, Indoor Chemistry, and Exposures.” Indoor Air 4,2 (1994), pp. 95–105.
Zinn, E., J.M. Reilly, P.Z. Adelstein and D.W. Nishimura. “Air Pollution Effects on Library Microforms.” In A. Roy and P. Smith, eds., Preventive Conservation: Practice, Theory and Research, Preprints of the Contributions to the Ottawa Congress, 12–16 September 1994. London, UK: International Institute for Conservation of Historic and Artistic Works, 1994, pp. 195–201.
Zou, X., T. Uesaka and N. Gurnagul. “Prediction of Paper Permanence by Accelerated Aging Part I. Kinetic Analysis of the Aging Process.” Cellulose 3 (1996), pp. 243–267.
© Government of Canada, Canadian Conservation Institute, 2021
Published by:
Canadian Conservation Institute
Department of Canadian Heritage
1030 Innes Road
Ottawa ON K1B 4S7
Canada
Cat. No.: CH57-3/1-37-2021E-PDF
ISSN 2562-0282
ISBN 978-0-660-38063-6