
ASHRAE types of control
Stefan Michalski
Disclaimer
The information in this document is based on the current understanding of the issues presented. It does not necessarily apply in all situations, nor do any represented activities ensure complete protection as described. Although reasonable efforts have been made to ensure that the information is accurate and up to date, the publisher, Canadian Conservation Institute (CCI), does not provide any guarantee with respect to this information, nor does it assume any liability for any loss, claim or demand arising directly or indirectly from any use of or reliance upon the information. CCI does not endorse or make any representations about any products, services or materials detailed in this document or on external websites referenced in this document; these products, services or materials are, therefore, used at your own risk.
On this page
- List of abbreviations
- Introduction
- Climate specifications
- The meaning of annual average
- Limits to the rate of seasonal adjustments due to the limits on short-term fluctuations
- Sustainability issues
- Integrating HVAC design with microclimate enclosures
- Misuse of the ASHRAE terminology
- ASHRAE climate zones
- ASHRAE AA
- ASHRAE A1 and A2
- ASHRAE B
- ASHRAE C
- ASHRAE D
- Temporary exhibit space and unpacking space for loaned objects
- Cool, cold and frozen storage
- Special climates for unstable metal or glass
- Bibliography
List of abbreviations
- ANSI
- American National Standards Institute
- ASHRAE
- American Society of Heating, Refrigerating and Air-Conditioning Engineers
- CCI
- Canadian Conservation Institute
- HDD
- heating degree days
- HVAC
- heating, ventilating and air conditioning
- IPI
- Image Permanence Institute
- ISO
- International Organization for Standardization
- NECB
- National Energy Code of Canada for Buildings
- RH
- relative humidity
Introduction
Since the first edition of the “Museums, Galleries, Archives, and Libraries” chapter in the ASHRAE Handbook: Heating, Ventilating, and Air-Conditioning Applications was developed in 1999 (hereafter referred to as the “ASHRAE chapter”), the Canadian Conservation Institute (CCI) has contributed extensively to its content and has adopted its framework and nomenclature in providing advice to professionals in Canada on control of the museum climate.
In this resource, each American Society of Heating, Refrigerating, and Air-Conditioning Engineers (ASHRAE) type of control is illustrated within the specified limits in a hygrothermograph chart. For more information on which types of control are recommended for particular objects and collections, consult ClimaSpec in the left-hand menu.
The 1999 to 2015 editions of the ASHRAE chapter included the guidelines for temperature and relative humidity (RH) under Table 3: Temperature and RH Specifications for Collections. In the 2019 edition, this became Table 13: Temperature and Relative Humidity Specifications for Collections in Buildings or Special Rooms. While the overall structure and categories used in the two tables remain very similar, the 2019 revision reflects a general shift seen in the entire chapter towards a greater emphasis on local and sustainable targets rather than on universal fixed specifications.
The 1999 to 2015 editions used the phrase “levels of control.” In the 2019 edition, this was changed to “types of control” to minimize the false assumption that types AA, A, B, C and D or the subtypes cool, cold and frozen represent hierarchies of quality. Although system complexity and energy costs range between types, each has its use for particular collections in particular circumstances.
Climate specifications
Climate specifications for the preservation of collections have four parameters:
- long-term outer limits or danger boundaries,
- annual averages or baselines,
- seasonal adjustments from the annual average and
- short-term fluctuations plus space gradients.
The 1999 to 2015 editions of the ASHRAE chapter specified only the last three parameters. The first was added in 2019. For an explanation of why these four parameters were created, consult Climate guidelines overview – Appendix A: The four parameters of a climate specification. This resource focuses on the numeric specifications of these four parameters for each type of control.
The meaning of annual average
The term “annual average” in the ASHRAE chapter (1999 to 2023 editions) has caused some confusion. (A previous term, “set point,” had also proved problematic.) Take, for example, a user who selects 20°C as the annual average and an increase of 5°C in summer and a decrease of 10°C in winter as the maximum permissible seasonal adjustments. Implementing both these seasonal adjustments will result in a temperature of 25°C in summer and 10°C in winter, and it will make the annual average 17.5°C. This prompts the user to question whether they have applied a summer increase of 7.5°C to an average of 17.5°C. For clarity in the detailed examples of hygrothermographs in this resource, CCI uses the term “annual baseline” where the 2019 and 2023 ASHRAE chapters have used “annual average.”
Limits to the rate of seasonal adjustments due to the limits on short-term fluctuations
In the 2019 and 2023 editions of the ASHRAE Handbook, “short-term fluctuations” (not defined in previous editions) were defined as “…any fluctuation shorter than the times specified…for rate of seasonal adjustment (i.e., 30 days for relative humidity fluctuations, 7 days for temperature fluctuations).” With the new emphasis placed on sustainability, and the recognition that energy savings increase when seasonal adjustments are increased, the interpretation of “short-term fluctuations” becomes important when implementing large seasonal shifts over short periods of time.
The committee that wrote the 2019 edition had extensive discussions on whether the short-term fluctuation limits for temperature in types of control AA, A1, A2 and B had been set too narrowly. These discussions centred on the need to encourage sustainability and the lack of any evidence in the literature that mechanical risk from temperature fluctuations would occur until fluctuations were much larger than those that had been specified.
The justification for these narrow temperature tolerances is not based on the temperature effects per se but, rather, on the RH fluctuations that they cause near the objects. If temperature changes occur quicker than the thermal response time of an object, or quicker than the response time of the heating, ventilating and air-conditioning (HVAC) system in adjusting the moisture content (dew point) of the air, then the RH at the surface of the object can fluctuate by up to 3% for each 1°C fluctuation. An example would be a 6% RH fluctuation for a 2°C change in temperature. This means that you must limit temperature changes capable of creating these RH effects to ±2°C so as to be consistent with the ±5% RH short-term limit.
To establish a safe rate of temperature adjustment, begin with the following premise: the thermal response time of most objects ranges from hours to a few days, and the thermal response time of most buildings is similar. Over the course of a week, therefore, the objects and the building fabric can reach equilibrium with any sudden adjustment in temperature of the HVAC system. If you keep weekly adjustments of temperature within ±2°C, then the RH discrepancy at the surface of the objects (and the surfaces of the building fabric) will not exceed ±5%RH.
Sustainability issues
The climate control issue of most concern to conservators is RH, unless they are working with archival collections (in which case, temperature is the primary concern.). However, for engineers looking for energy savings, the reverse is true: temperature and ventilation requirements are their primary concerns. To balance the needs of both groups, there are two new ASHRAE 2019 guidelines: selecting an annual baseline that is in keeping with the local climate and making seasonal adjustments in temperature. The traditional belief that mixed collections require year-round stable temperatures for preservation has been proven false. To implement temperature baselines that are very different from human comfort conditions, together with large seasonal adjustments, will require separation of storage rooms from occupied rooms. (You can reduce the risk due to the transition between storage areas and display areas, whereby objects, in effect, traverse a large space gradient. This is done by wrapping and insulating objects during transit, which is the procedure for external transit and for retrieval from cool or cold storage.)
A major cause of energy inefficiency in traditional HVAC systems in museums was the cycling of the heating and cooling systems (and their humidifying and dehumidifying processes), especially during the shoulder seasons of spring and fall. Energy-efficient designs use a deadband, which is a narrow range of temperature and humidity separating the settings of the two systems. Each system can overshoot its setting slightly without triggering the opposing system. This approach is even more successful if the building is well insulated and airtight and contains a large mass of collections that are hygroscopic; that is, they can act as a large reservoir for heat and humidity. For these kinds of efficient design, where each system operating alone causes very little fluctuation, the ASHRAE guideline for short-term fluctuations can be used to set the permissible deadband. For more information on savings with suitable deadbands, consult the ASHRAE Standard 90.1-2019, Energy Standard for Buildings Except Low-Rise Residential Buildings.
A final sustainability issue is the building itself, not simply in terms of heritage but in terms of global building stock. In the past, a stringent approach to temperature and RH controls for collections caused many heritage institutions (much more often than other institutions) to damage their buildings inadvertently due to condensation in the walls. In cold climates, winter humidification caused condensation in the walls; in hot and humid climates, summer air conditioning also caused condensation in the walls. Seasonal adjustments in temperature make it possible to save not only energy but also the buildings themselves. It’s important to take full advantage of the seasonal adjustments permitted and the relative humidities suggested in the ASHRAE chapter.
CCI has made an initial survey of energy consumption by museums in Canada. The survey suggests that institutions with the highest level of climate control use about two to three times more energy than those with basic control for human comfort. Several factors probably contribute to the increased energy consumption and variability, so it’s impossible to say, definitively, that climate control targets alone are the driving factor.
The energy intensity of Canadian heritage facilities will become clearer as relevant data is collected through the Survey of Commercial and Institutional Energy Use and incorporated into Energy Star’s Portfolio Manager software for energy tracking and benchmarking. But here is what is already certain. Museums that are still using a traditional specification for the highest level of climate control (rather than a specification adapted to the local climate) are not making use of seasonal adjustments and are not re-examining their systems for improvements in efficiency. These museums are energy wasteful and unsustainable. Large museums can benefit from adopting the same performance analysis tools, such as RETScreen (developed by the Government of Canada), that other institutions are using to achieve energy-efficiency targets. Contact CCI for more information.
Integrating HVAC design with microclimate enclosures
Trying to control both temperature and RH through a building’s HVAC system is always complicated and will inevitably fail from time to time. The most reliable means of reducing RH fluctuations, especially the very large spikes resulting from a system failure, is the incorporation of microclimate enclosures (display cases, cabinets, sealed picture frames, plastic bags, etc.). An abundance of literature in the conservation field explains the techniques and pitfalls of using microclimate enclosures. Technical Bulletin 33 Silica Gel: Passive Control of Relative Humidity explains the use of extra buffering material.
Microclimate enclosures are not only recommended for institutions unable to control RH in their building. They are also recommended for institutions with precious objects that could be damaged when the state-of-the-art system eventually fails; for institutions that maintain 50% RH for their mixed collection and also store corroded metals or weeping glass objects that could be damaged at this level; and for large institutions who want to lend objects to smaller institutions that lack the required level of RH control in their building.
Misuse of the ASHRAE terminology
It has become conventional to use the ASHRAE type of control specifications as a shorthand for describing the performance of a system. But a statement such as “My system is AA most of the time” can be misleading. Any mechanical damage a collection suffers is a result of the worst hours and days it faces each year and not the better conditions it is under for the other 99% of the year. Each ASHRAE type of control applies 24/7, 365 days of the year, year after year. Any building, even an uncontrolled historic house, can have days or even weeks when the climate conforms to a specific type of control. This does not mean that the building (and its systems) meets that specific type of control. This is very different from the usual assumption in HVAC design for human comfort, where conditions outside specifications for 1% (or 3%) of the year (conventional design tolerances) are acceptable.
It is, however, permissible and logical to state either that “My institution always remains within AA conditions during the summer months, the time period for which we have requested the loan” or that “The interior of this airtight display case maintains A1 conditions throughout the year by the combination of the temperature control provided by the room systems and of the RH control provided by the enclosure.”
Precisely what is meant by “most of the time,” be it 99% or 97% of the time, during each year or each decade has not yet been formalized in the ASHRAE chapter, and it remains a complex question. What is certain, again, from a risk management perspective is that microclimate enclosures are essential for any valuable objects that are highly sensitive to RH fluctuations.
ASHRAE climate zones
In the 2019 and 2023 ASHRAE chapters, climate zones are used to provide advice on the type of control that is feasible in different locations and the building envelope performance necessary to achieve such control. For significant capital projects and whenever an engineer or architect is involved, the current ASHRAE chapter as well as local and national building codes must be consulted. The following is a brief summary for non-experts.
There are many different climate zone maps. Probably the most widely known are those for gardeners, where higher numbers are warmer climates. For HVAC design purposes, ASHRAE created its own system (Figure 1) with higher numbers for colder climates. It is based on four climate factors, one of which is the amount of heating required over the cold season (heating degree days [HDD] below 18°C). ASHRAE has published zone maps and tables for locations worldwide, including hundreds of locations in Canada (ASHRAE 2021). Canada’s building code as well as many provincial codes refer to the data of the National Energy Code of Canada for Buildings (NECB), which defines zones solely on HDD. For the ASHRAE zones of interest to Canada (Figure 1), the NECB zones are very similar but without the separation into A, B, C due to precipitation differences. HDD data for Canada that also accounts for the effects of climate change is readily available online, for example in the climate data portal called ClimateData.ca.
Table 1 summarizes the strategies to adopt, by climate zone, to meet the requirements of each ASHRAE type of control. It contains abridged information from ASHRAE (2023) as well as strategies other than building envelope design. The table can be simplified even further: ASHRAE AA and A types of control need a special building envelope. ASHRAE C and D are the realistic (and very sustainable) options for historic buildings everywhere. ASHRAE B is feasible in older buildings in warmer zones (4 and 5), but out of reach for most of Canada (zones 6 to 8).
| Type of control | Climate zones | Strategies |
|---|---|---|
| AA | All of Canada: 4C, 5A, 5C, 6A, 6B, 7 and 8 | Build a purpose-built building with a special envelope design, for example, unusual airtightness and unusual insulation. The need for a purpose-built building increases as the zone number increases. For retrofitting historic structures, use a box-in-a-box approach that is, separately controlled interior rooms (van Schijndel 2010) or a dynamic buffer zone solution (Pasqualini 1999). Use microenvironments for reliable RH control over the long term (for example, decades) or for materials with special RH requirements such as corroded metals. |
A1 and A2 |
5A, 5C, 6A, 6B, 7 and 8 | As AA. |
| A1 and A2 | 4C (only near Victoria, BC) | As AA, but it may be possible to relax the envelope design a little. |
| B | 4C, 5A and 5C | If the temperature is controlled to human comfort in winter, historic buildings may survive without a retrofit, but careful envelope analysis and some retrofitting may be required. If heating is controlled by a humidistat, average envelope performance may suffice. Use microenvironments to reduce RH fluctuations or for materials with special RH requirements such as corroded metals. |
| B | 6A, 6B, 7 and 8 | If temperature is controlled to human comfort in winter, follow AA advice. If heating is controlled by a humidistat, average envelope performance may suffice. Use microenvironments to reduce RH fluctuations or for materials with special RH requirements such as corroded metals. |
| C | All of Canada: 4C, 5A, 5C, 6A, 6B, 7 and 8 | An envelope design equivalent to successful residential buildings in that climate zone is sufficient, as humans and objects both require an RH above 25% and below 75%. Some retrofitting of historic buildings may be necessary at higher zone numbers. Use microenvironments to reduce RH fluctuations or for materials with special RH requirements such as corroded metals. |
| D | All of Canada: 4C, 5A, 5C, 6A, 6B, 7 and 8 | If the temperature is allowed to follow the external daily average of temperature (for example, uninsulated buildings), then only good airtightness is required to allow dehumidification systems to function. In zones with a B suffix (dry), smart ventilation alone may be sufficient. Use microenvironments to reduce RH fluctuations or for materials with special RH requirements such as corroded metals. |
Cool Cold Frozen RH control |
All of Canada: 4C, 5A, 5C, 6A, 6B, 7 and 8 | A special envelope design is essential, for example, unusual airtightness and unusual insulation. Using a box-in-a-box approach (that is, separately controlled and insulated interior rooms) is a common solution. If heated human comfort zones are not needed, cool or cold storage may be achieved at low cost simply by following average outdoor temperatures in zones 7 and 8. Use microenvironments to reduce RH fluctuations and to prevent extreme RH when systems fail. |
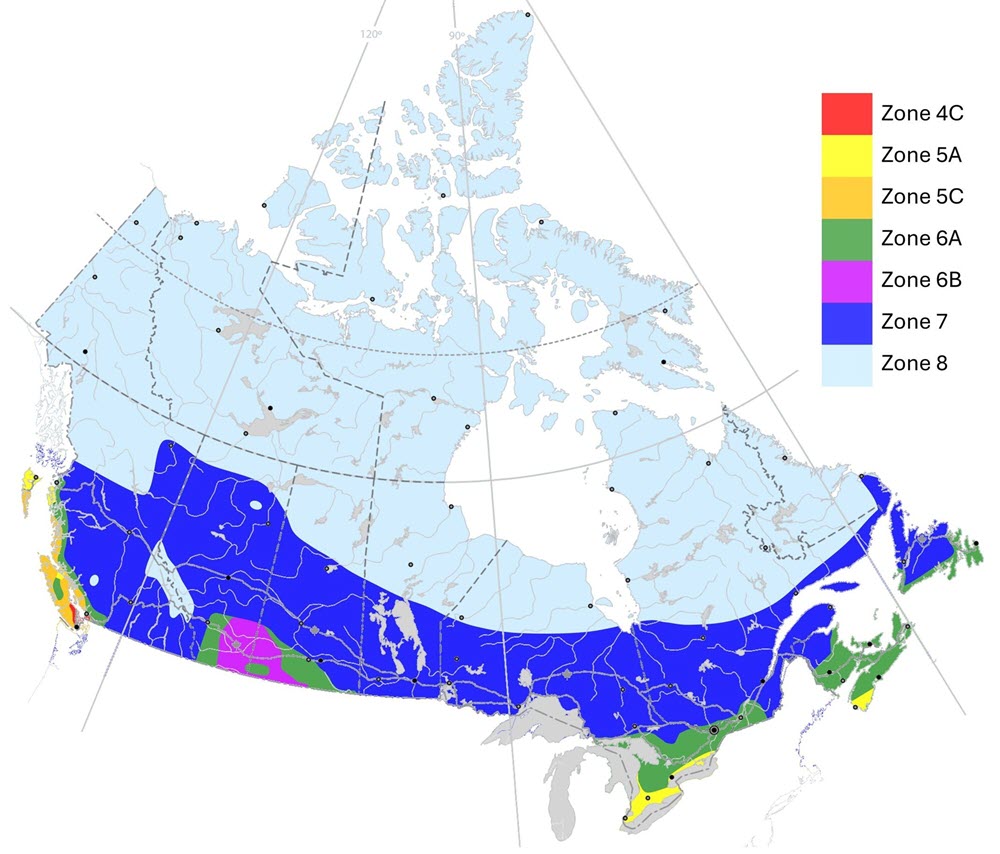
© Government of Canada, Canadian Conservation Institute. 132715-0037
Figure 1. Climate zones of Canada based on ASHRAE (2021).
Description for Figure 1
Figure 1 contains a map of Canada with the various ASHRAE climate zones shown in different colours.
ASHRAE AA
Definition of ASHRAE AA
All parameters and statements of benefits and risks are as given in ASHRAE (2023).
Type of collection and building: museums, galleries, archives and libraries in modern purpose-built buildings or purpose-built rooms. Temperature is at or near human comfort level.
Type of control: precision control with no seasonal changes to RH.
| Long-term outer limits | Annual averages (baseline) | Seasonal adjustments from annual average (baseline) | Short-term fluctuations plus space gradients |
|---|---|---|---|
| 10°C to 25°C |
|
|
±2°C |
| 35% to 65% RH |
|
No change to RH | ±5% RH |
Collection benefits and risks of ASHRAE AA
Benefits to the collection include the prevention of mould germination and growth as well as the prevention of rapid corrosion. There is no risk of mechanical damage to most objects and paintings. However, some metals, glasses and minerals may degrade if RH exceeds a critical value. At 20°C, chemically unstable objects deteriorate significantly within decades. For each increase of 5°C in temperature, the rate of deterioration doubles. For more specific benefits and risks of various temperature and RH conditions for particular objects, consult ClimaSpec.
Comments on ASHRAE AA
In the 1999 to 2015 editions of the ASHRAE chapter, the definitions of “seasonal adjustments” and “short-term fluctuations” remained the same. Changes to the 2019 edition included the introduction of long-term outer limits and a greater emphasis on the historic annual averages as an appropriate setting, rather than a default to 50% RH and 15°C to 25°C.
The AA type of control is the traditional, very narrow guideline of decades past, with a modest amount of seasonal temperature adjustment added. It should not be interpreted as the perfect guideline. It ignores the considerable problem of chemically unstable materials in 20th-century collections (which benefit from cooler and dryer conditions), and there is no evidence that it decreases mechanical risks for actual collections, as compared to type A1 or A2. In addition, there are no records of any institution worldwide that has demonstrated meeting AA conditions throughout a room over the course of many years. Even systems that keep fluctuations within the AA range 97% of the time will fall outside its boundaries several days per year and several weeks per decade. This is an aspirational target for institutions with a purpose-made building located in a moderate climate zone.
From a risk management perspective, this target should not be pursued if
- resources allocated to the system and its operation could be used more effectively in addressing much greater risks to the collection;
- its implementation could result in damage to a historic building that may have a value similar to or greater than that of the collections; or
- its implementation could call for large energy expenditures due to an inadequate building envelope.
For recommendations on making statements on the use of AA (or any ASHRAE guideline), such as “My system is AA most of the time,” consult the section Misuse of the ASHRAE terminology.
Hygrothermograph examples of ASHRAE AA
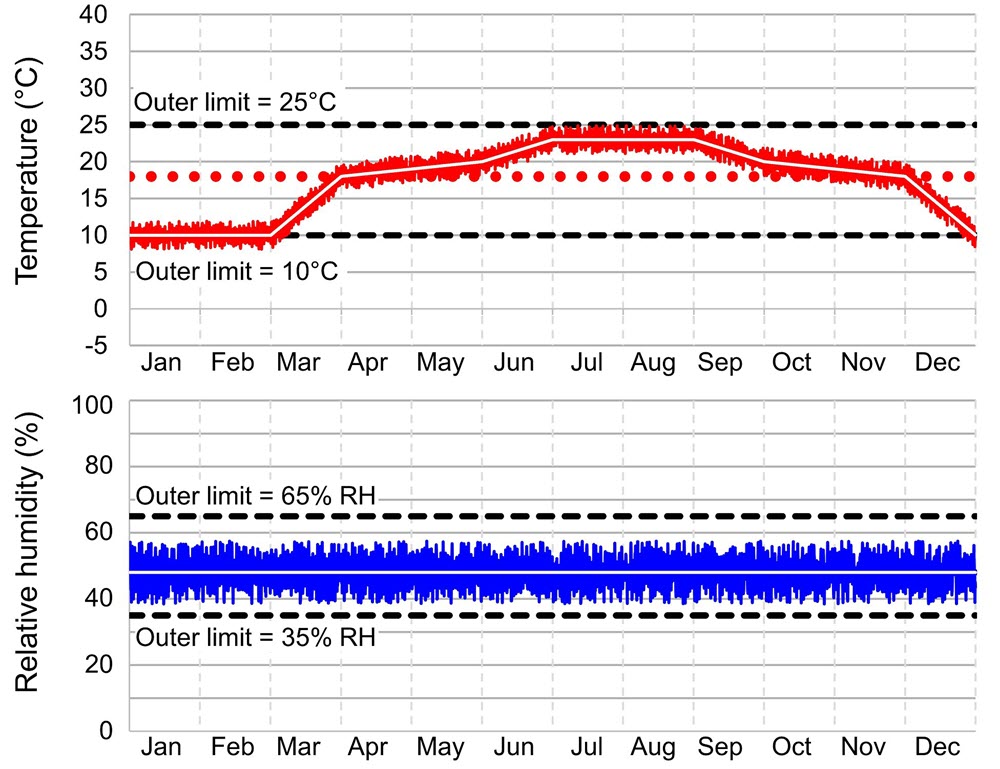
Example 1
In Figure 2, the annual baseline of temperature is 20°C (red dotted line), and the seasonal adjustments were set to the maximum increase and decrease of 5°C. These temperature settings could be used for collection storage: a winter setting of 15°C for January and February and a summer setting of 25°C for July and August. Spring and fall months are set at 21°C. Because the seasonal adjustments are not symmetric, the actual annual average is 20.5°C. The system in this example has fully programmable settings so that the temperature setting (smooth white line within the red oscillations) can be adjusted in small steps, perhaps two or three times a week during the months of March, June, September and December. Note that the long-term outer limit of 25°C applies to the temperature setting (white line) and not to the peaks of the short-term fluctuations that cross the limit.
(Please note that the charts in this resource are all idealized in order to illustrate the specification more clearly, and they apply to a typically Canadian climate.)
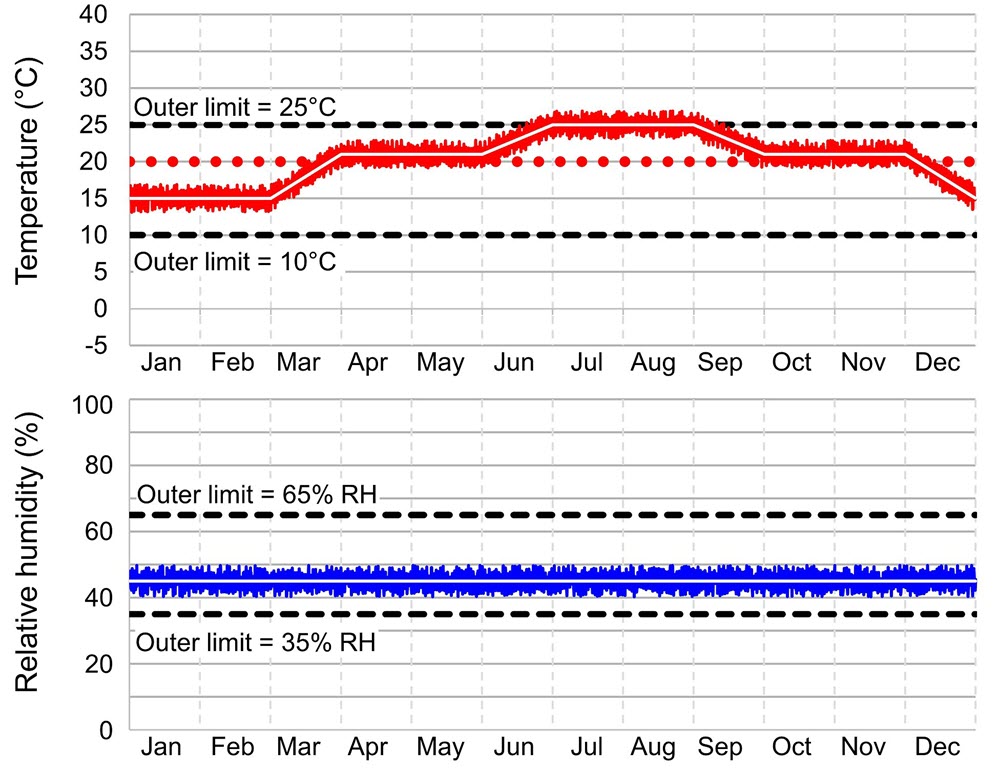
© Government of Canada, Canadian Conservation Institute. 132715-0001
Figure 2. An example of a chart showing temperature and RH over one year in a building where staff selected the maximum permissible seasonal adjustments and short-term fluctuations that conform to ASHRAE AA type of control, using a few large but slow adjustments in temperature.
Description for Figure 2
Figure 2 contains two graphs, one above the other. The top one shows temperature; the bottom one shows RH. The horizontal axis is time, showing all 12 months of the year. The temperature graph shows a main plot that changes gradually from month to month but has many short-term fluctuations superimposed. There are two flat dashed lines for upper and lower outer limits. The RH graph shows a similar group of plots, but the main plot is completely flat.
The adjustments in seasonal temperature settings of Figure 2 (a gradual 6°C increase over the course of March, and a 6°C decrease over the course of December) may appear to violate the short-term fluctuation limit of ±2°C for AA. This 6°C adjustment would certainly not be permitted if it was made in a single step on March 1 and December 1. As discussed in the section Limits to the rate of seasonal adjustments due to the limits on short-term fluctuations, CCI considers a gradual implementation that does not exceed the short-term fluctuation limit of ±2°C each week to be consistent with the intent of the ASHRAE guidelines.
In Figure 2, the annual baseline of RH and the actual annual average are the same: 45% RH. There are no seasonal adjustments (flat white line within the blue oscillations).
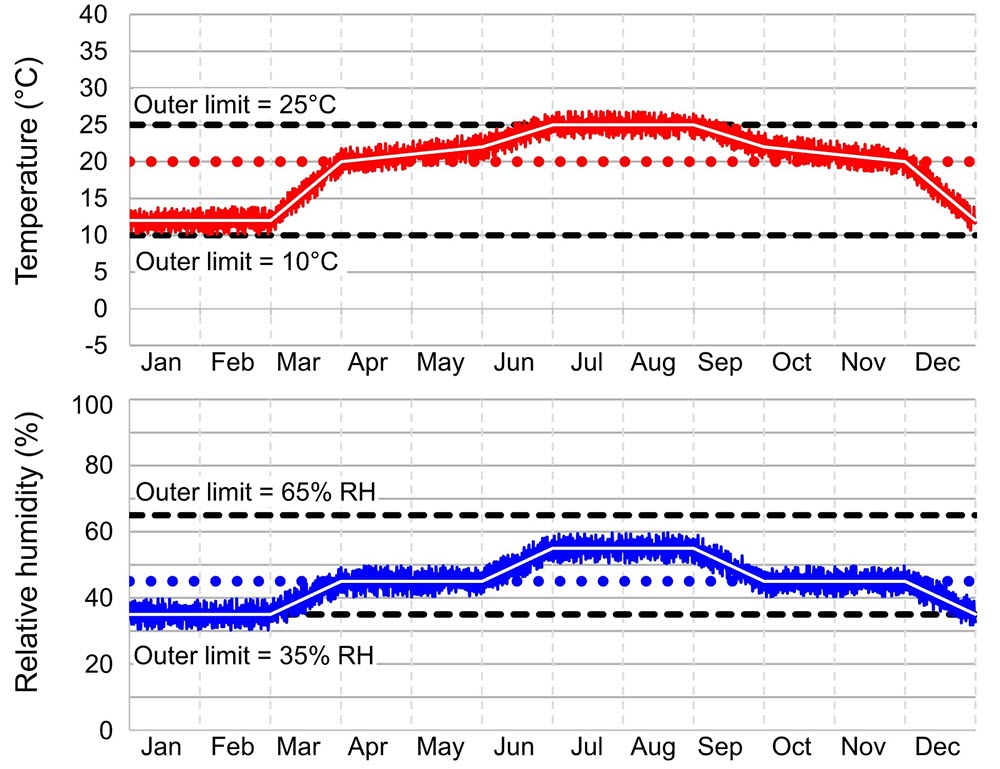
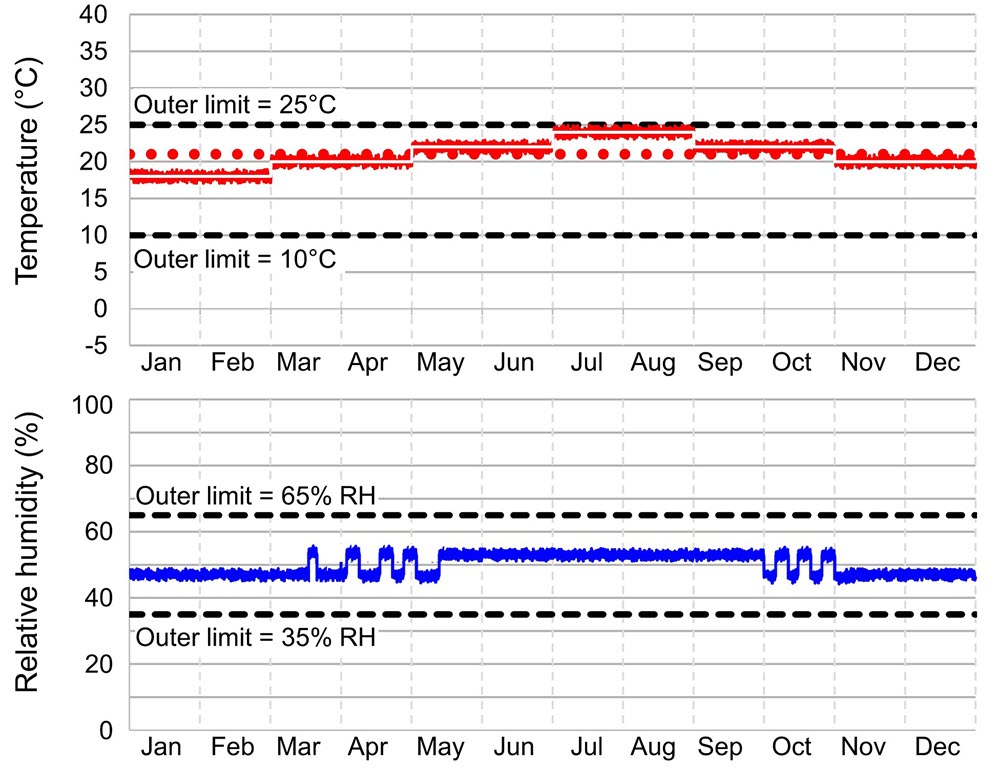
Example 2
In Figure 3, the annual baseline of temperature is 20°C (red dotted line). The winter and summer plateaus are the same as in Figure 2 and could be used for collection storage, but here the seasonal adjustments are made once each month, in steps of 2°C. This is within the permissible short-term fluctuation of ±2°C. Because the monthly adjustments are symmetric, the actual annual average is also 20°C. Note that the long-term outer limit of 25°C applies to the temperature setting (white line) and not to the peaks of the short-term fluctuations that cross the limit.
Such a slow pattern of temperature adjustments will not be very energy efficient if the local climate changes more abruptly between winter and summer. The advantage of a larger temperature adjustment made gradually over the course of one month, as seen in Figure 2, is that it follows more closely a climate with rapid changes in seasonal temperatures (or with abrupt seasonal changes in occupancy and access).

© Government of Canada, Canadian Conservation Institute. 132715-0003
Figure 3. An example of a chart showing temperature and RH over one year in a building where staff selected the maximum permissible seasonal adjustments and short-term fluctuations that conform to ASHRAE AA type of control, using many abrupt but small adjustments in temperature.
Description for Figure 3
Figure 3 contains two graphs, one above the other. The top one shows temperature; the bottom one shows RH. The horizontal axis is time, showing all 12 months of the year. The temperature graph shows a main plot that changes in steps from month to month, with short-term fluctuations superimposed. There are two flat dashed lines for upper and lower outer limits. The RH graph shows a similar group of plots, but the main plot is completely flat.
In Figure 3, the annual baseline of RH was set at 47% all year (white line). The actual annual average is the same. The RH setting of 47% will not cause condensation problems during the winter in this building only because the temperature is allowed to drop to 15°C. In summer, 47% RH is within the capacity of the dehumidification system only because the temperature is allowed to rise to 25°C.
ASHRAE A1 and A2
A1 and A2 come with the same collection benefits and risks but differ slightly in their combination of seasonal and short-term RH fluctuations. Prior to the 2019 edition of the ASHRAE chapter, these alternative combinations were both labelled A, which could have led to confusion.
Definition of ASHRAE A1
Type of collection and building: museums, galleries, archives and libraries in modern purpose-built buildings or purpose-built rooms. Temperature is at or near human comfort level.
Type of control: precision control with seasonal changes in temperature and RH.
| Long-term outer limits | Annual averages (baseline) | Seasonal adjustments from annual average (baseline) | Short-term fluctuations plus space gradients |
|---|---|---|---|
| 10°C to 25°C |
|
|
±2°C |
| 35% to 65% RH |
|
|
±5% RH |
Definition of ASHRAE A2
Type of collection and building: museums, galleries, archives and libraries in modern purpose-built buildings or purpose-built rooms. Temperature is at or near human comfort level.
Type of control: precision control with seasonal changes in temperature only.
| Long-term outer limits | Annual averages (baseline) | Seasonal adjustments from annual average (baseline) | Short-term fluctuations plus space gradients |
|---|---|---|---|
| 10°C to 25°C |
|
|
±2°C |
| 35% to 65% RH |
|
No change to RH | ±10% RH |
Collection benefits and risks of ASHRAE A1 and A2
Benefits to the collection include the prevention of mould germination and growth as well as the prevention of rapid corrosion. There is no risk of mechanical damage to most objects, paintings, photographs and books. However, a small risk of mechanical damage exists for high-sensitivity objects. (In the current understanding, the guidelines A1 and A2 cause the same low risk of mechanical damage to vulnerable collections. Namely, a slow seasonal adjustment of 10% RH is estimated to cause the same mechanical risk as a rapid fluctuation of 5% RH. This is due to significant stress relaxation that occurs within three months of a slow transition.) At 20°C, chemically unstable objects deteriorate significantly within decades. For each increase of 5°C in temperature, the rate of deterioration doubles. For more specific benefits and risks of various temperature and RH conditions for particular objects, consult ClimaSpec.
Comments on ASHRAE A1 and A2
In the 2019 edition of the ASHRAE chapter, the two subcategories were given distinct names: type A1 and type A2. The seasonal adjustments and short-term fluctuations under type A remained unchanged from the 1999 to 2015 editions. However, the 2019 edition included the introduction of long-term outer limits and a greater emphasis on the historic annual averages as an appropriate annual baseline, rather than a default to 50% RH and 15°C to 25°C.
The letter “A” was chosen as the designation in the 1999 edition because this level was felt to be sufficient for major institutions that maintain mixed collections in a purpose-built building and that have a mandate to maximize preservation. This remains the opinion of the ASHRAE chapter committee and of CCI.
The mechanical risk outlined in Collection benefits and risks of ASHRAE A1 and A2 applies only to objects which have never been exposed to fluctuations since manufacture or since they were repaired. An object that has been exposed to a significant fluctuation will have fractured as much as is possible due to a single cycle of that size of fluctuation. For more information, consult Climate guidelines overview – Appendix B: Sensitivity to fluctuations and the application of proofed fluctuations.
The larger seasonal adjustments of A1 and A2 (as compared to AA specifications) are a recognition that even major museums must face energy and sustainability constraints and that these temperature adjustments are not a significant risk to most collections. That said, maintaining a collection within A1 or A2 specifications is still a resource-intensive task in most Canadian climates. Given the phenomena of proofed fluctuations, control type B is sufficient for many permanent collections.
Hygrothermograph examples of ASHRAE A1
Example 1
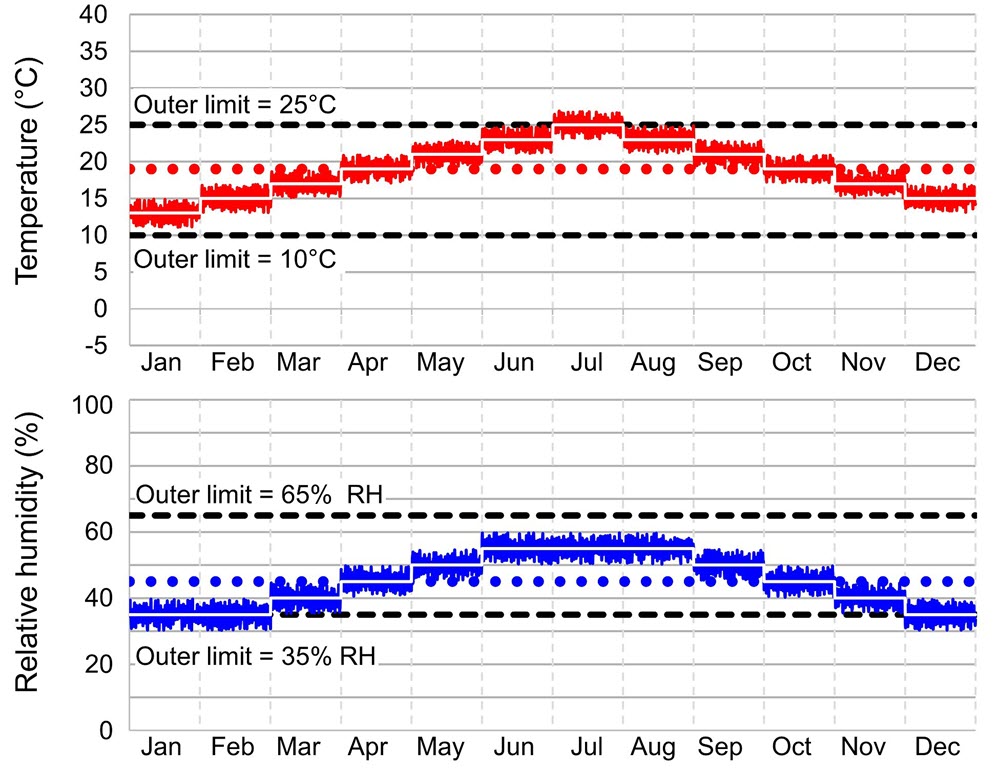
In Figure 4, the annual temperature baseline is set at 20°C (red dotted line). The seasonal adjustments follow a typical pattern used in a collection storage context: a winter setting of 12°C for January and February and a summer setting of 25°C for July and August. Temperatures in the spring and fall months change gradually up to the summer high of 25°C before falling again. The system is fully programmable, so the temperature can be adjusted in small steps, perhaps twice a week (white line). The largest transitions, an increase of 8°C in March and a decrease of 8°C in December, are just within the CCI suggestion that seasonal adjustments should not exceed a rate of 2°C per week. The actual annual average that results from these settings,19.8°C, is close to the annual baseline. Note that the long-term outer limit of 25°C applies to the temperature setting (white line) and not to the peaks of the short-term fluctuations that cross the limit.
© Government of Canada, Canadian Conservation Institute. 132715-0005
Figure 4. An example of a chart showing temperature and RH over a whole year in a building where staff selected the maximum permissible seasonal adjustments and short-term fluctuations that conform to ASHRAE A1 type of control, using a few large but slow adjustments in temperature and RH.
Description for Figure 4
Figure 4 contains two graphs, one above the other. The top one shows temperature; the bottom shows RH. The horizontal axis is time, showing all 12 months of the year. The temperature graph shows a main plot that changes gradually from month to month, with short-term fluctuations superimposed. There are two flat dashed lines that indicate the upper and lower outer limits. The RH graph shows a similar group of plots and a similar gradual change from month to month.
In Figure 4, the annual baseline for RH is set at 45% RH (blue dotted line). The settings (white line) change smoothly during the months of temperature adjustment (March, June, September and December). The summer plateau is set at 55% RH, and the winter plateau is set at 35% RH. With symmetrical seasonal adjustments, the actual annual average RH is the same as the annual baseline: 45% RH. Note that the long-term outer limit of winter, 35% RH, applies to the RH setting (white line) and not to the lowest trough of the short-term fluctuations (blue spikes).
Example 2
In Figure 5, the annual baseline of temperature is 19°C (red dotted line). The temperature settings of the HVAC system can only be changed monthly (white line), so this is done at the beginning of each month. The total range available, with six monthly changes limited to two degrees each, is only 12°C, so the range goes from 25°C in July to 13°C in January. Since the changes are symmetric, the actual annual average is also 19°C. Note that the long-term outer limit of 25°C applies to the temperature setting (white line) and not to the peaks of the short-term fluctuations that cross the limit.
Such a pattern of temperature adjustments will not be energy efficient if the local climate is very different. The advantage of a larger temperature adjustment made over the course of a month, as in Figure 4, is that it is easier to follow more closely a climate with rapid changes between winter and summer conditions (or with abrupt seasonal changes in occupancy and access).
© Government of Canada, Canadian Conservation Institute. 132715-0007
Figure 5. An example of a chart showing temperature and RH over a whole year in a building where staff selected the maximum permissible seasonal adjustments and short-term fluctuations that conform to ASHRAE A1 type of control, using many abrupt but small adjustments in temperature and RH.
Description for Figure 5
Figure 5 contains two graphs, one above the other. The top one shows temperature; the bottom one shows RH. The horizontal axis is time, showing all 12 months of the year. The temperature graph shows a main plot that changes in steps from month to month, with many short-term fluctuations superimposed. There are two flat dashed lines for upper and lower outer limits. The RH graph shows a similar group of plots, and the main plot changes in steps from month to month.
In Figure 5, the annual baseline for RH is set at 45% RH (blue dotted line). The setting (white line) is changed monthly by 5% RH, which is within the permissible short-term fluctuations of ±5% RH. The seasonal adjustments are the maximum permissible (an increase or decrease by 10% RH): summer RH is set at 55%, and winter RH is set at 35%.
Hygrothermograph examples of ASHRAE A2
Example 1
In Figure 6, the pattern of seasonal adjustments in temperature is the same as in Figure 5, except that the annual baseline is two degrees lower, at 18°C (red dotted line). The seasonal adjustments follow a typical pattern used in a collection storage context: a winter setting of 10°C for January and February and a summer setting of 23°C for July and August. Spring and fall months are set at 20°C. Spring and fall months change gradually up to the summer high of 23°C before falling again. The system is fully programmable, so the temperature can be adjusted in small steps, perhaps twice a week (white line). The largest transitions, an increase of 8°C in March and a decrease of 8°C in December, are just within the CCI suggestion that seasonal adjustments should not exceed a rate of 2°C per week. The actual annual average that results from these settings is 17.8°C. Note that the long-term outer limit of 10°C applies to the temperature setting (white line) and not to the lowest troughs of the short-term fluctuations that cross the 10°C limit.
© Government of Canada, Canadian Conservation Institute. 132715-0009
Figure 6. An example of a chart showing temperature and RH over a whole year in a building where staff selected the maximum permissible seasonal adjustments and short-term fluctuations that conform to ASHRAE A2 type of control.
Description for Figure 6
Figure 6 contains two graphs, one above the other. The top one shows temperature; the bottom one shows RH. The horizontal axis is time, showing all 12 months of the year. The temperature graph shows a main plot that changes gradually from month to month, with many short-term fluctuations superimposed. There are two flat dashed lines for upper and lower outer limits. The RH graph shows a similar group of plots, but the main plot is flat with larger rapid fluctuations superimposed than in previous figures.
In Figure 6, the annual baseline of RH is set at 48% RH (flat white line).
Example 2
In Figure 7, the pattern of seasonal adjustments in temperature is a typical one, as used in a display area: an annual baseline of 21°C (red dotted line). The summer high is set at 24°C in July and August, and winter drops to 18°C in January and February. Seasonal adjustments are made in monthly steps that remain within the permissible short-term fluctuation of ±2°C. The short-term fluctuations in temperature are only half of the maximum permissible. The actual annual average that results from these symmetric adjustments is the same as the nominal average, 21°C.
© Government of Canada, Canadian Conservation Institute. 132715-0011
Figure 7. An example of a chart showing temperature and RH over a whole year in a building where the HVAC system operates with a deadband but still remains within the short-term fluctuation specifications of ASHRAE A2 type of control.
Description for Figure 7
Figure 7 contains two graphs, one above the other. The top one shows temperature; the bottom one shows RH. The horizontal axis is time, showing all 12 months of the year. The temperature graph shows a main plot that changes in steps from month to month, with many short-term fluctuations superimposed. There are two flat dashed lines for upper and lower outer limits. The RH graph shows a similar group of plots, but the main plot changes more erratically during spring and fall months.
In Figure 7, the RH is set at an annual baseline of 50% RH (for clarity, the blue dotted line is not shown). The humidification and dehumidification systems are each capable of control within ±2% RH, so the permissible range of short-term fluctuations, ±10% RH, is used to accommodate a deadband of 6% RH between the operation of the humidification system (47% ± 2% RH) and the dehumidification system (53% ± 2% RH). The RH has to change by 8 percentage points (for example, 47% RH to 55% RH) before it triggers the opposing system. The frequent switching between the opposing systems only occurs in the spring and fall seasons. The RH plot of these swing seasons in Figure 7 is simplified for clarity. Sometimes, you can expect the alternation between humidification and dehumidification to occur more often than the weekly events shown, but it would still be much less frequently than when no deadband exists.
ASHRAE B
Definition of ASHRAE B
Type of collection and building: museums, galleries, archives and libraries needing to reduce stress on their building (for example, historic house museums), depending on the climate zone.
Type of control: limited control with seasonal changes in RH and large seasonal changes in temperature.
| Long-term outer limits | Annual averages (baseline) | Seasonal adjustments from annual average (baseline) | Short-term fluctuations plus space gradients |
|---|---|---|---|
| Less than or equal to 30°C |
|
|
±5°C |
| 30% to 70% RH |
|
|
±10% RH |
Collection benefits and risks of ASHRAE B
Benefits to the collection include the prevention of mould germination and growth as well as the prevention of rapid corrosion. In addition, chemical deterioration slows during cool winter periods (as long as the RH is kept at moderate levels). There is no risk of mechanical damage for many objects and most books. However, there is a tiny risk to most paintings and photographs and to some objects and books. A moderate risk exists for high-sensitivity objects. Objects made with flexible paints and plastics that become brittle when cold, such as paintings on canvas, need special care when being handled in cold temperatures. At 20°C, chemically unstable objects deteriorate significantly within decades. For each increase in temperature of 5°C, deterioration happens twice as fast. For more specific benefits and risks of various temperature and RH conditions for particular objects, consult ClimaSpec.
Comments on ASHRAE B
The short-term fluctuations in the 2019 edition remain unchanged from previous editions, and the seasonal adjustment for summer also remains the same. However, the 2019 edition included the introduction of long-term outer limits (although an upper limit on temperature of 30°C was already stated in the 1999 to 2015 editions) and a greater emphasis on the historic annual averages as an appropriate annual baseline, rather than a default to 50% RH and 15°C to 25°C.
The mechanical risk outlined in Collection benefits and risks of ASHRAE B applies only to objects which have never been exposed to fluctuations since manufacture or since they were repaired. An object that has been exposed to a significant fluctuation will have fractured as much as is possible due to a single cycle of that size of fluctuation. For more information, consult Climate guidelines overview – Appendix B: Sensitivity to fluctuations and the application of proofed fluctuations.
The B type of control differs from A1 primarily in its extended range of permissible lower temperatures. Seasonal adjustments in RH are no greater than A1, but short-term fluctuations are double (±10% compared to ±5%). In warmer parts of Canada, that is zones 4 and 5 (Figure 1), ASHRAE B is a reasonable target for collections in historic buildings that can tolerate the intervention of climate control systems. However, care must be taken to ensure that these systems do not cause damage to the building either because of condensation due to excessive humidity during cold winters or excessive air conditioning in humid summers. In colder parts of Canada, ASHRAE B is feasible in historic buildings if one abandons human comfort temperatures and takes full advantage of winter setback, or if heating is controlled by a humidistat. If parts of the collection are still at risk from the range of RH permitted by ASHRAE B, then you can mitigate these risks by providing microclimate enclosures such as airtight display cases, cabinets and packaging in storage.
Hygrothermograph example of ASHRAE B
In Figure 8, the facility has no air-conditioning system, only a heating system. Given the known temperature history of summers that approaches 30°C during the afternoon, the annual baseline of temperature is set as 21°C (red dotted line). The thermostat (white line with black lines on each side for clarity) is set manually to an energy saving 10°C when the museum is closed to the public, from November 1 to March 1, and then set to 19°C when the museum is open. Sometime in April, the temperature begins to climb, and the museum can only use natural ventilation, window shutters and tree shading to limit the rise in temperature. Given the steep drop in temperature during winter, the actual annual average in Figure 8 is about 19°C.
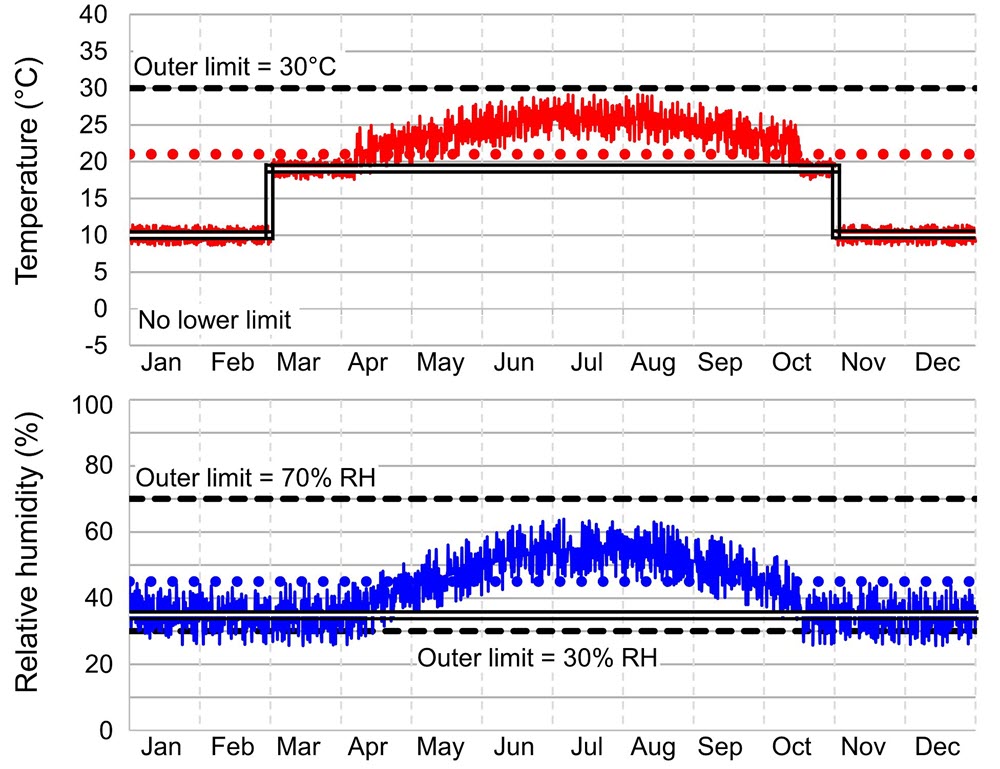
© Government of Canada, Canadian Conservation Institute. 132715-0013
Figure 8. An example of a chart showing temperature and RH over a whole year in a building where staff selected the maximum permissible seasonal adjustments and short-term fluctuations that conform to ASHRAE B type of control.
Description for Figure 8
Figure 8 contains two graphs, one above the other. The top one shows temperature; the bottom one shows RH. The horizontal axis is time, showing all 12 months of the year. The temperature graph shows a main plot that is a constant cool value during the winter months, that jumps abruptly in spring by several degrees and that climbs to a summer peak and then drops until fall, when it suddenly drops to the steady cool winter temperature. There are many short-term fluctuations superimposed throughout. There is one flat dashed line for the upper outer limit but no lower limit. The RH graph shows a similar group of plots and a similar gradual shift upwards in summer. There are larger rapid fluctuations superimposed than in previous figures. There are two flat dashed lines for upper and lower outer limits.
In Figure 8, the facility has a humidification system but no dehumidification system. The RH is set at an annual baseline of 45% (blue dotted line), since this will allow the permitted seasonal adjustment for summer (increase by 10% RH) to cover the known monthly averages of July and August, which are 55%. The setting of the winter humidification system must therefore be of at least 35% RH (white line with black lines on each side for clarity). Since the winter temperature is set to 10°C, the risk of wall condensation due to 35% RH ± 10% is low. The actual annual average in Figure 8 is about 19°C.
ASHRAE C
Definition of ASHRAE C
Type of collection and building: museums, galleries, archives and libraries needing to reduce stress on their building (for example, historic house museums), depending on the climate zone.
Type of control: prevent RH extremes (damp or desiccation) and high temperature extremes.
| Long-term outer limits | Annual averages (baseline) | Seasonal adjustments from annual average (baseline) | Short-term fluctuations plus space gradients |
|---|---|---|---|
| Less than or equal to 40°C | Temperature usually below 25°C | Temperature not specified | Temperature rarely over 30°C |
| 25% to 75% RH | Within 25% to 75% RH year-round | RH not specified | Not continually above 65% RH for longer than X daysTable 6 note 1 |
Table 6 notes
- Table 6 note 1
-
The ASHRAE chapter points the reader to a mould growth graph (ASHRAE 2023, Figure 3) to determine the number of days required for visible mould at an RH between 65% and 75%. This graph is the same as the red line of the graph provided on the Explanation of the mould and lifetime calculators page. The results of this graph, the time for visible mycelium, are provided by the Mould Calculator in ClimaSpec.
Collection benefits and risks of ASHRAE C
Benefits to the collection include the prevention of mould germination and growth as well as the prevention of rapid corrosion. In addition, chemical deterioration slows during cool winter periods (as long as the RH is kept at moderate levels). There is a tiny risk of mechanical damage to many objects and most books and a moderate risk to most paintings, most photographs, some objects and some books. There is a high risk to high-vulnerability objects. Even greater care than what is provided in ASHRAE B is needed when handling objects made with flexible paints and plastics that become brittle when cold, such as paintings on canvas. At 20°C, chemically unstable objects deteriorate significantly within decades. For each increase of 5°C in temperature, the rate of deterioration doubles.
The mechanical risk outlined in Collection benefits and risks of ASHRAE C applies only to objects which have never been exposed to fluctuations since manufacture or since they were repaired. An object that has been exposed to a significant fluctuation will have fractured as much as is possible due to that size of fluctuation. Subsequent fluctuations must match or exceed this prior fluctuation, the proofed fluctuation, in order to cause new fractures.
For more information, consult Climate guidelines overview – Appendix B: Sensitivity to fluctuations and the application of proofed fluctuations. For more specific benefits and risks of various temperature and RH conditions for particular objects, consult ClimaSpec.
Comments on ASHRAE C
The core of the ASHRAE C definition in the 1999 to 2015 editions was that RH remains within 25% to 75% year-round. In the 2019 and 2023 editions, this range is still the core definition, but it is also used to specify the outer limits of RH. Temperature guidelines remain almost the same in 2019 and 2023 compared to 1999, that is, rarely over 30°C and usually below 25°C. However, an outer limit of 40°C was added. This was in recognition of the fact that although chemical deterioration greatly accelerated as the temperature climbed from 25°C to 30°C and then to 40°C, the deterioration that was feasible with brief exposure to high temperature (which defines the outer limits) was physical. In this case, it was the softening of many waxes and adhesives above 40°C (consult Table 2 in the Agent of deterioration: incorrect temperature).
Short-term fluctuations of temperature and RH were not specified in the 1999 to 2015 editions, but in the 2019 and 2023 editions, the short-term fluctuations for RH were defined as not continually above 65% for longer than X days. The reader was directed to a graph to estimate X, the time for mould growth in the RH range of 65% to 75%. This was in recognition of the fact that although mould growth accelerates greatly above 75% RH, there was still the smaller risk of slow mould growth in the range of 65% to 75%. The Explanation of the mould and lifetime calculators page contains a graph of the time for mould growth, and the Mould Calculator in ClimaSpec provides estimates of the times for growth at various relative humidities.
As with all previous types of control, the 2019 and 2023 editions also place a greater emphasis on the historic annual averages as an appropriate setting, rather than a default to 50% RH and 15°C to 25°C. Below 25% RH and above 75% RH, the rate of hygroscopic response to each change in RH is as much as double or triple that seen within this range. Hygroscopic materials under stress are more brittle below 25% RH. Many types of furniture and cabinetry were designed to tolerate moderately low RH but not the desiccation occurring below 25% RH. At the other extreme, mould and rapid corrosion increase rapidly above 75% RH.
Thus, ASHRAE C must be recognized as providing the great majority of the benefits of climate control at a fraction of the costs of more narrowly defined controls. ASHRAE C is a reasonable target for collections in historic buildings that use basic HVAC systems because these collections are already proofed to this pattern of RH fluctuations and the building would be damaged by condensation due to excessive humidity during cold winters. If parts of the collection are still at risk from these conditions, such as some new objects that have been acquired from locations with better conditions, then provide climate control for these objects through the use of microclimate enclosures such as airtight cases in display areas or cabinets and packaging in storage.
Hygrothermograph example of ASHRAE C
In Figure 9, the graph represents the behaviour of a building with winter heating where the heating is controlled by a humidistat (Lafontaine and Michalski 1984) to prevent RH from dropping below 25% RH. This keeps the building within the RH guideline for ASHRAE C. In this particular climate, the result is a winter temperature hovering around 4°C, with sizable spikes in temperature as the system attempts to stabilize RH during variable weather patterns. During the summer, the local climate together with the building behaviour and some natural ventilation result in conditions within the upper limits of temperature for ASHRAE C. (There is no annual baseline in this situation, nor any seasonal adjustments; there is simply the actual range and actual annual average, which is about 15°C.) This would be typical of a historic building with some heating due to sun exposure and some thermal inertia that smooths out very large weekly changes in weather.
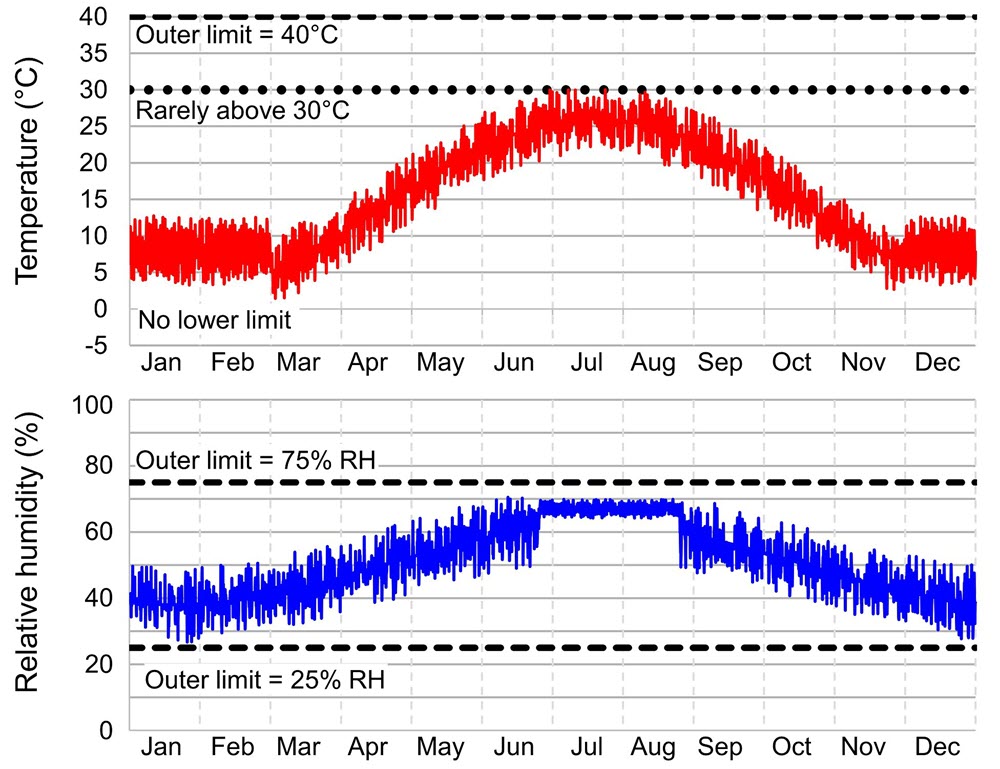
© Government of Canada, Canadian Conservation Institute. 132715-0015
Figure 9. An example of a chart showing temperature and RH over a whole year in a building that conforms to ASHRAE C type of control.
Description for Figure 9
Figure 9 contains two graphs, one above the other. The top one shows temperature; the bottom one shows RH. The horizontal axis is time, showing all 12 months of the year. The temperature graph shows a main plot that changes gradually from a winter low to a summer high with many short-term fluctuations superimposed. There are two flat dashed lines for upper and lower outer limits. The RH graph shows a similar group of plots and a similarly shaped main plot that oscillates around 40% in winter and 70% in summer. The oscillations during July and August are much smaller than those in the remainder of the year.
In Figure 9, the RH plot shows that the RH did not exceed 70% in the summer, which was due to the installation of a dehumidifier. The setting of 70% RH is based on an estimate of the lowest RH that could cause mould growth to start if it was continuous for three months.
There were times when the institution considered heating this space in winter, which would have resulted in RH well below the 25% limit (as will be seen in ASHRAE D type of control). The thoughtful decision not to heat this space was an active intervention that achieved a C type of control rather than a D type of control. (There is no baseline in this situation, nor any seasonal adjustments; there is simply the actual range and actual annual average, which is 51% RH.)
ASHRAE D
Definition of ASHRAE D
Type of collection and building: collections in open structured buildings and historic houses.
Type of control: prevent very high RH (dampness).
| Long-term outer limits | Annual averages (baseline) | Seasonal adjustments from annual average (baseline) | Short-term fluctuations plus space gradients |
|---|---|---|---|
| Temperature not specified | Temperature not specified | Temperature not specified | Temperature not specified |
| Less than or equal to 75% RH | RH reliably below 75% | RH not specified | Not continually above 65% RH for longer than X daysTable 7 note 1 |
Table 7 notes
- Table 7 note 1
-
The ASHRAE chapter points the reader to a mould growth graph (ASHRAE 2023, Figure 3) to determine the number of days required for visible mould at an RH between 65% and 75%. This graph is the same as the double red line in Figure 1 on the Explanation of the mould and lifetime calculators page. The results of this graph, the time for visible mycelium, are provided by the Mould Calculator in ClimaSpec.
Collection benefits and risks of ASHRAE D
At 20°C, chemically unstable objects deteriorate significantly within decades. For each increase of 5°C in temperature, the rate of deterioration doubles. Conversely, a cool winter season can extend the lifetime of such objects. Benefits of ASHRAE D include the prevention of mould germination and growth as well as the prevention of rapid corrosion. There is a high risk of sudden or cumulative mechanical damage to most objects and paintings because of low-humidity fractures, but this type of control prevents high-humidity delamination and deformations, especially in veneers, paintings, paper and photographs. For more specific benefits and risks of various temperature and RH conditions for particular objects, consult ClimaSpec.
Comments on ASHRAE D
The core of the ASHRAE D definition is simply that RH remains below 75%. This core definition also becomes the specification of the outer limits (that is, the outer limits do not extend beyond the core definition). Short-term fluctuations were not previously specified for ASHRAE D, and they are not specified in the 2019 and 2023 editions. No temperature guidelines were provided in previous editions, and that also remains the same.
Damp (over 75% RH) causes the following deterioration processes: rapid mould, rapid corrosion, delamination and tenting of paintings on canvas, detachment of veneers held by glues and adhesion of the image layer of photographic materials to anything that comes in contact with them. Reliably avoiding damp is probably the single most beneficial goal of any climate control system. Although such a basic target is not normally considered an engineering design condition, it does become a legitimate goal for any buildings, historic or otherwise, with poor-quality envelopes. It is also a legitimate target for intelligent, if unorthodox, mechanical systems in a simple building located in a humid or marine climate zone. Of course, sources of damp are often the result of water leaks from above or ground water from below, and these should be addressed at the source before using an HVAC solution.
Hygrothermograph example of ASHRAE D
In Figure 10, the building only has winter heating and no summer cooling. The heating is set for 18°C, and the system maintains it within ±2°C. Heating is switched off at the end of May and switched back on mid-October (not earlier, even if occupants complain). Since ASHRAE D has no temperature specifications, these variations are all within the guideline. (There is no annual baseline in this situation, nor any seasonal adjustments; there is simply the actual range and actual annual average, which is about 20°C.)
© Government of Canada, Canadian Conservation Institute. 132715-0017
Figure 10. An example of a chart showing temperature and RH over a whole year in a building that conforms to ASHRAE D type of control.
Description for Figure 10
Figure 10 contains two graphs, one above the other. The top one shows temperature; the bottom one shows RH. The horizontal axis is time, showing all 12 months of the year. The temperature graph shows a main plot that changes gradually from a winter low to a summer high, with many short-term fluctuations superimposed. The RH graph shows a similar group of plots and a similarly shaped main plot that oscillates around 20% in winter and around 70% in summer. The oscillations in July and August are much smaller than during the remainder of the year.
In Figure 10, the RH plot shows that the RH did not exceed 70% in the summer. This was due to the installation of a dehumidifier during two to three months in the year (the only active intervention taken in this otherwise uncontrolled facility to meet the ASHRAE D type of control). (There is no annual baseline in this situation, nor any seasonal adjustments; there is simply the actual range and actual annual average, which is 43% RH.) The limit of 70% RH is based on an estimate of the lowest RH required, if exceeded for three months, to cause mould growth to start.
Temporary exhibit space and unpacking space for loaned objects
Definition of a temporary exhibit space and of an unpacking space for loaned objects
Type of collection and building: temporary exhibit space and unpacking space for loaned objects.
Type of control: conditions will be stipulated in loan agreements.
In current practice, the most probable guideline used for loans will be the one adopted by many museums and conservation organizations, commonly called the Bizot guideline. Consult Michalski (2016) for a historical summary of the Bizot guideline and the organizations that have ratified it: the International Council of Museums Committee for Conservation (ICOM-CC), the International Institute for Conservation of Historic and Artistic Works (IIC), the Association of Art Museum Directors (AAMD) and the British Museum. The Bizot guideline is defined primarily in terms of outer limits for the duration of the loan. These are shown in Table 8.
The Bizot guidelines also stipulate that
- a conservator for the lending institution will make judgments about which objects are safe to travel in these conditions, and
- microclimate enclosures (they refer to them as “microenvironments”) will be used to provide more stable RH whenever necessary.
| Long-term outer limits | Annual averages (baseline) | Seasonal adjustments from annual average (baseline) | Short-term fluctuations plus space gradients |
|---|---|---|---|
| 16°C to 25°C | Temperature not specified | Temperature not specified | Temperature not specified |
| 40% to 60% RH | RH not specified | RH not specified | Maximum ±10% RH in 24 hours |
Collection benefits and risks of the use of a temporary exhibit space and an unpacking space for loaned objects
The lender will assess the benefits and risks to its objects and base its contractual specifications on this assessment. Often, the assessment will be highly risk averse and precautionary.
The organizations that have adopted the Bizot guideline do not state the expected benefits and risks. However, since a loan of a few months following the Bizot guidelines is the same as an ASHRAE A2 type of control with average RH set to 50%, you can assume, conservatively, that you will achieve the benefits and risks described for ASHRAE A2 (with the benefits being slightly better). For more specific benefits and risks of various temperature and RH conditions for particular objects, consult ClimaSpec.
Comments on the use of a temporary exhibit space and an unpacking space for loaned objects
Not all loan agreements will use the Bizot guidelines. Some organizations do add further stipulations to the short-term fluctuations, and these are often the same as those in ASHRAE AA. Some lenders will simply ask for ASHRAE AA with a fixed average of 50% RH and 21°C (very traditional narrow guidelines).
Cool, cold and frozen storage
Definition of cool, cold and frozen storage
Type of collection and building: chemically unstable organic materials in modern purpose-built buildings or purpose-built rooms.
Type of control: cool, cold and frozen.
There are three types of low-temperature control specified in the ASHRAE chapter. These were adapted from the two primary sources of climate control advice for archival materials requiring a low temperature to survive longer than a couple of decades: ISO 18934:2011, Imaging Materials – Multiple Media Archives – Storage Environment and the IPI Media Storage Quick Reference from the Image Permanence Institute, authored by Adelstein.
| Long-term outer limits | Annual averages (baseline) | Seasonal adjustments from annual average (baseline) | Short-term fluctuations plus space gradients |
|---|---|---|---|
| Temperature not specified | In the range of 8°C to 16°C | Temperature not specified | Temperature not specified |
| RH not specified | In the range of 30% to 50% RH | RH not specified | RH not specified |
| Long-term outer limits | Annual averages (baseline) | Seasonal adjustments from annual average (baseline) | Short-term fluctuations plus space gradients |
|---|---|---|---|
| Temperature not specified | In the range of 0°C to 8°C | Temperature not specified | Temperature not specified |
| RH not specified | In the range of 30% to 50% RH | RH not specified | RH not specified |
| Long-term outer limits | Annual averages (baseline) | Seasonal adjustments from annual average (baseline) | Short-term fluctuations plus space gradients |
|---|---|---|---|
| Temperature not specified | In the range of -20°C to 0°C | Temperature not specified | Temperature not specified |
| RH not specified | In the range of 30% to 50% RH | RH not specified | RH not specified |
Collection benefits and risks of cool, cold and frozen storage
The benefits of low-temperature storage include the extended lifetime of objects that would be lost within a generation or two if kept at room temperature. (Consult Explanation of the mould and lifetime calculators – Explanation of the Lifetime Calculator for details on quantifying the benefits.) In addition, biological damage is much reduced. The risks include the many side effects of such systems, such as high humidity or condensation in cases of malfunctions and water exposure. Objects must be packaged appropriately to reduce the risk of condensation during retrieval, and the institution may require a transition space with an intermediate climate. Hourly and daily (or even longer) humidity fluctuations will not affect most properly packaged objects at low temperatures. For more specific estimates of chemical lifetimes of all types of materials at a selected temperature and RH, consult the Lifetime Calculator in ClimaSpec.
Comments on cool, cold and frozen storage
Within the ASHRAE chapter, detailed guidelines about short-term fluctuations are not provided for cool, cold and frozen. Readers expecting to design low-temperature storage should consult the various ISO standards for specific forms of media. Low-temperature storage is also a possibility for modern art collections that contain not only media objects typical of archives (videotape and colour photographs), but also artworks and decorative arts made with unstable plastics from the 20th century.
Although the short-term fluctuations are not specified in ASHRAE cool, cold and frozen, almost all practical applications can assume that the objects (such as film, photographs, videotapes, furs and items made of rubber or plastics) will be packaged in moistureproof and airtight containers or bags. Packaging will block all RH fluctuations that occur externally for less than a few days or sometimes months. Inside, the object will remain at the average RH. Consult ClimaSpec for estimates of the passive RH control of a packaged object (its humidity half-time) or Table 4 in Climate guidelines overview – Appendix C: The response times of objects and the multiple benefits of enclosures.
Moderate temperature fluctuations, such as ±5°C, that are not exceeded during the normal operation of even basic low-temperature systems, whether special vaults or domestic freezers, are not a risk to properly packaged objects. Very large temperature fluctuations that occur during retrieval are not so easily ignored.
The discussion in the ASHRAE chapter covers the issue well. It begins by noting that retrieval from cold storage raises the question of what procedures to use for acclimatization, including whether to build a transition space. A transition space mitigates two risks: condensation during retrieval, which is the major risk; and direct mechanical effects of the temperature change, which is a minor one. However, a transition space adds complexity to the construction of cold storage and its operation. It also represents a large fraction of lost storage space in smaller institutions.
The greatest risk of condensation happens during the re-entry process to warm conditions or in case of a cooling system failure. Therefore, it is essential that objects in cold storage remain inside moistureproof packaging or bags and that these packages remain closed until the object has reached room temperature. “This packaging reduces the need for tight control of relative humidity fluctuations in cold storage, because response times are many days or weeks.” (ASHRAE 2023)
When moving objects from extreme cold storage (−20°C), small amounts of condensation can still form inside packages, such as film cans (Padfield 2002) and larger wrapped plastic objects, causing irreversible blanching of some plastics (Shashoua 2004, 2005, 2008). Despite these side effects, cold storage remains the only option for preserving materials with low chemical stability (Shashoua 2014).
Special climates for unstable metal or glass
Definition of special climates for unstable metal or glass
Type of collection and building: unstable metal or glass in modern purpose-built buildings or purpose-built rooms.
Type of control: RH-controlled to avoid a critical RH of a salt or hydrate.
No detailed guidelines are provided in the ASHRAE chapter; institutions would need to specify the critical RH based on their collections and the literature. Some guidelines are provided in ClimaSpec.
Collection benefits and risks of the use of special climates for unstable metal or glass
There are no specified benefits and risks in the ASHRAE chapter for this type of control. The assumed benefits are the prevention of any deterioration mechanisms driven by hydration or dehydration of compounds in objects, such as contaminated metals. The risks are the effects of this special RH on other materials in a complex object (for example, the possible fracture of the wooden or bone handle of a metal tool kept at a very low RH to reduce corrosion). For some benefits and risks of specific temperatures and RH conditions for particular objects, consult ClimaSpec.
Bibliography
Adelstein, P.Z. IPI Media Storage: Quick Reference (PDF format), 2nd ed. Rochester, NY: Image Permanence Institute, 2011.
American Society of Heating, Refrigerating and Air-Conditioning Engineers. “Museums, Galleries, Archives, and Libraries.” In M.S. Owen, ed., ASHRAE Handbook: Heating, Ventilating, and Air-Conditioning Applications. Atlanta, GA: ASHRAE, 2019, pp. 24.1–24.46.
American Society of Heating, Refrigerating and Air-Conditioning Engineers. ANSI/ASHRAE Standard 169-2020, Climatic Data for Building Design Standards (PDF Format). Addendum a. [N.p.]: ASHRAE, 2021.
American Society of Heating, Refrigerating and Air-Conditioning Engineers. “Museums, Galleries, Archives, and Libraries.” In M.S. Owen, ed., ASHRAE Handbook: Heating, Ventilating, and Air-Conditioning Applications. Atlanta, GA: ASHRAE, 2023, pp. 24.1–24.47.
BIZOT Group. The Bizot Green Protocol (PDF Format). N.p.: International Committee for Museums and Collections of Modern Art, 2023.
International Organization for Standardization. ISO 18934:2011, Imaging Materials – Multiple Media Archives – Storage Environment. Geneva, Switzerland: International Organization for Standardization, 2011.
Padfield, T. “Condensation in Film Containers During Cooling and Warming” (PDF format). In D. Niseen et al., eds., Preserve Then Show. Copenhagen, Denmark: Danish Film Institute, 2002.
Pasqualini, P. The Control of Moisture Movement in Buildings Using the Dynamic Buffer Zone. PhD Thesis, University of Toronto, 1999.
Shashoua, Y. “Modern Plastics: Do They Suffer from the Cold?” Studies in Conservation 49, Suppl. 2 (2004), pp. 91–95.
Shashoua, Y. “Storing Plastics in the Cold: More Harm than Good?” In I. Verger, ed., ICOM-CC 14th Triennial Meeting, The Hague, The Netherlands, 12–16 September 2005: Preprints. London, UK: James & James/Earthscan, 2005, pp. 358–364.
Shashoua, Y. Conservation of Plastics: Materials Science, Degradation and Preservation. Oxford, UK: Butterworth-Heinemann Elsevier, 2008.
Shashoua, Y. “A Safe Place: Storage Strategies for Plastics.” Conservation Perspectives (Spring 2014), pp. 13–15.
van Schijndel, A.W.M., H.L. Schellen and W.J. Timmermans. “Simulation of the Climate System Performance of a Museum in Case of Failure Events.” Energy and Buildings 42,10 (October 2010), pp. 1790–1796.
© Government of Canada, Canadian Conservation Institute, 2025
Published by:
Canadian Conservation Institute
Department of Canadian Heritage
1030 Innes Road
Ottawa ON K1B 4S7
Canada
Cat. No.: CH57-4/83-2025E-PDF
ISBN 978-0-660-75636-3