Annex B – Additional figures on Canadian and Defence Team demographics
Additional figures
This annex provides further graphics that illustrate differences between Employment Equity (EE) representation in Canada and the Defence Team.
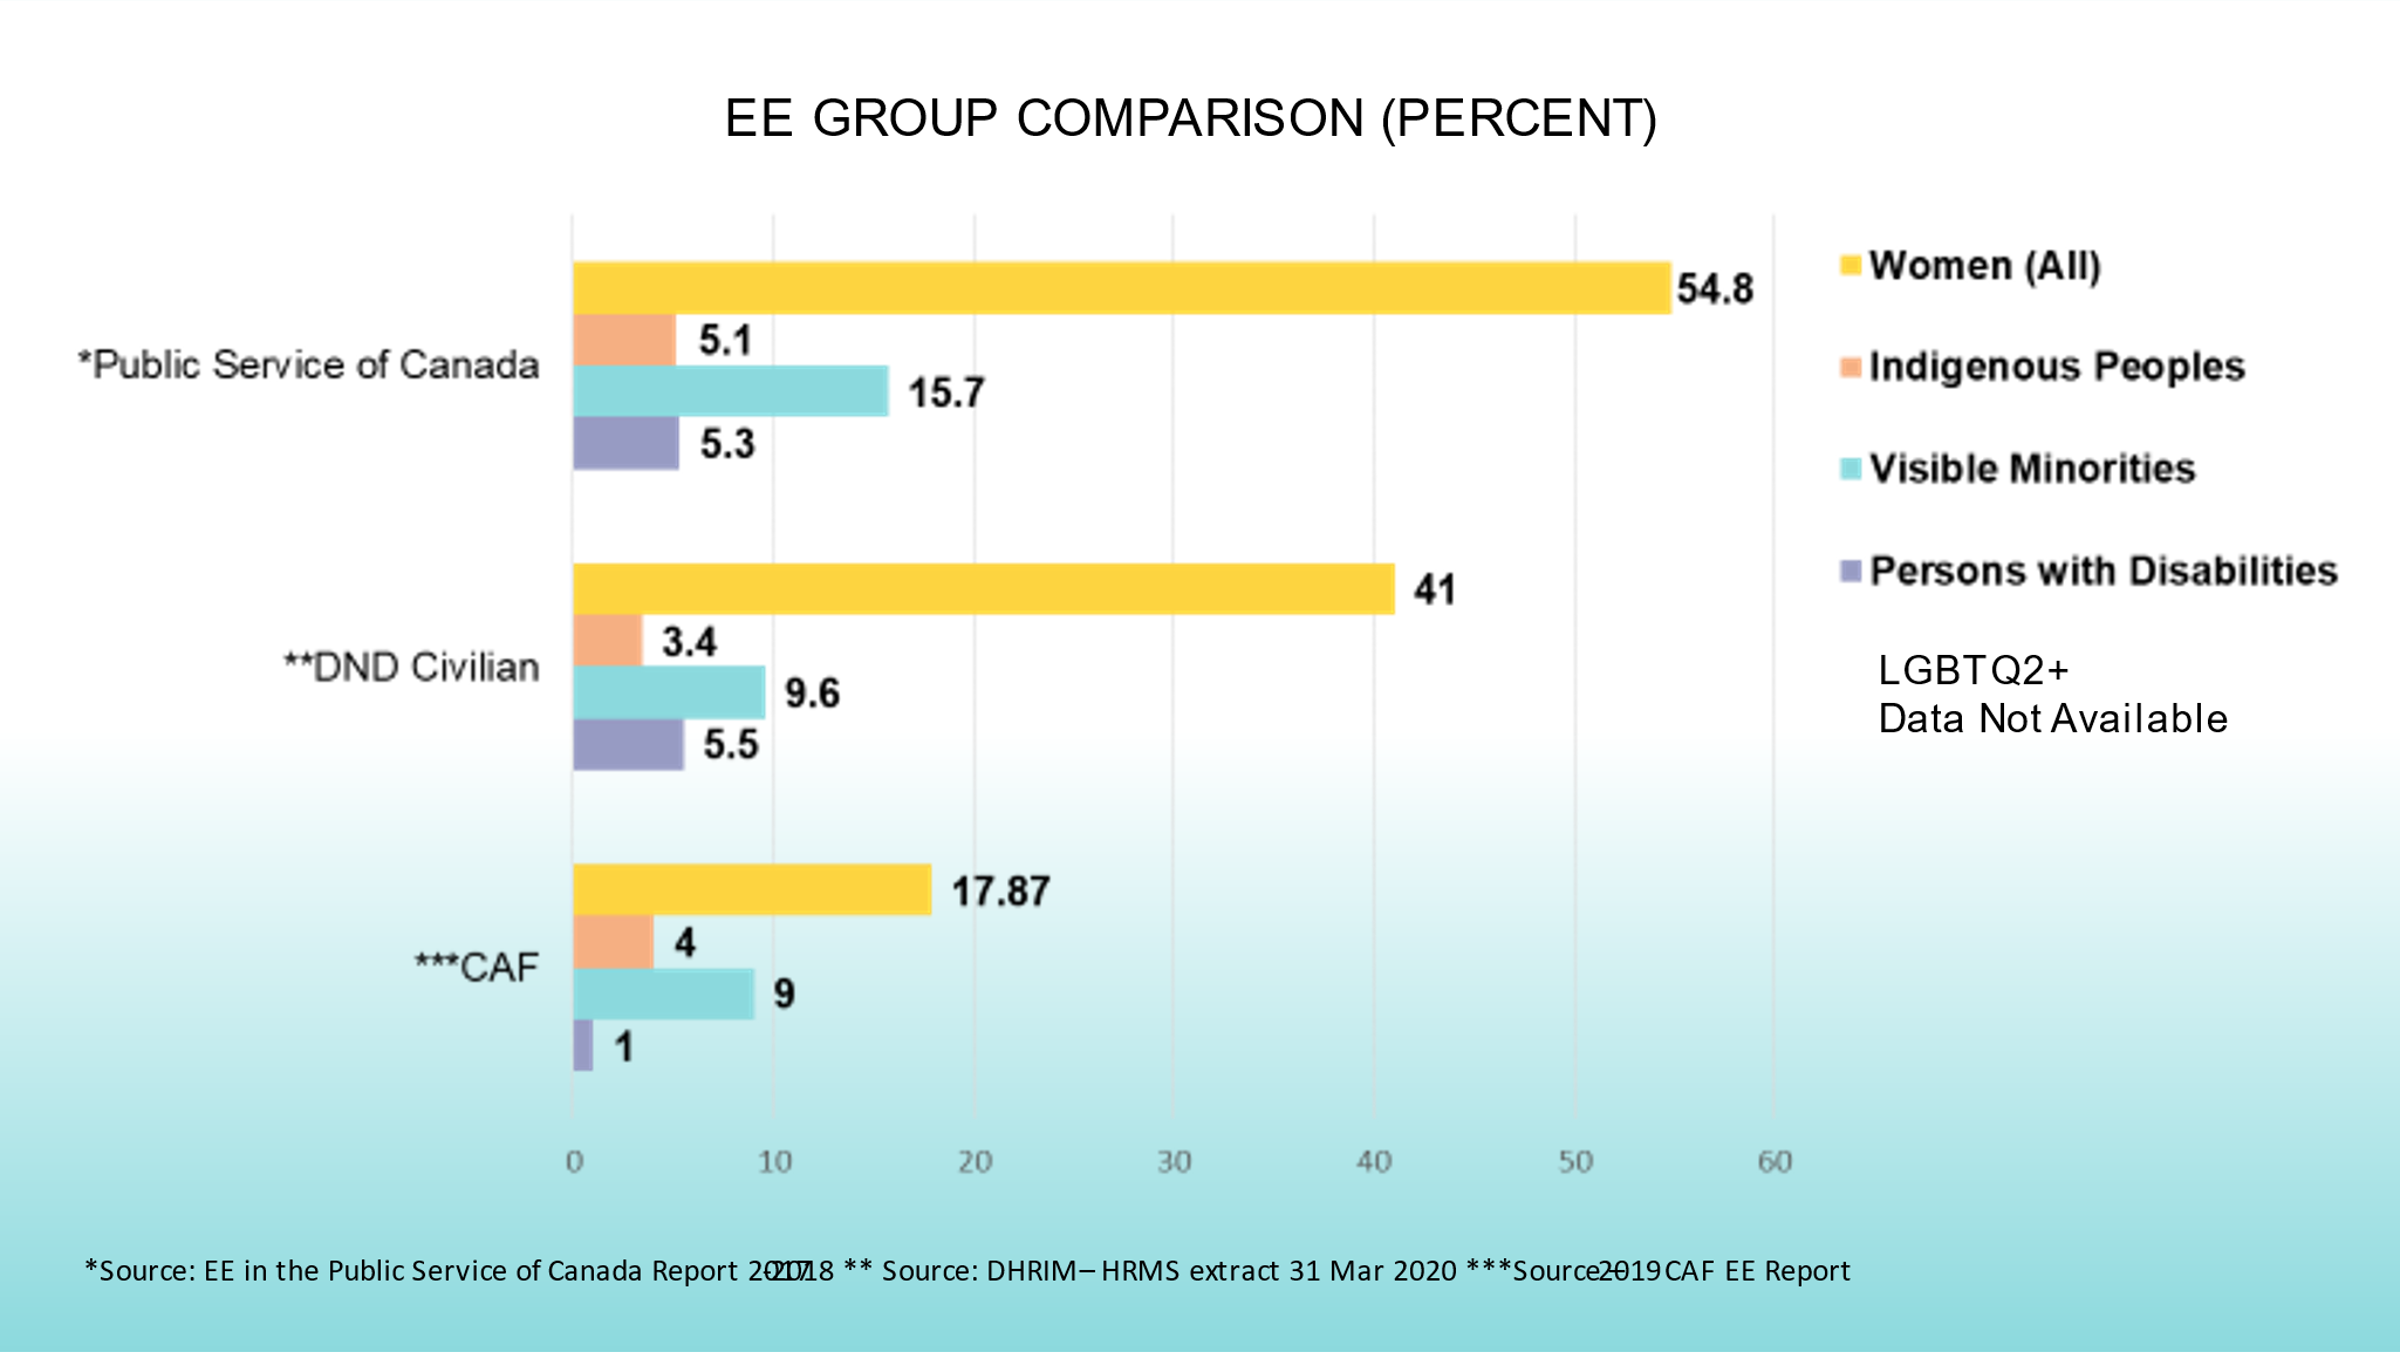
Figure 8: Employment Equity Group Comparison (Percent)

Long description of Figure 8
Footnote *Public Service of Canada
| Women (All) | 54.8% |
| Indigenous Peoples | 5.1% |
| Visible Minorities | 15.7% |
| Persons with Disabilities | 5.3% |
Footnote *DND Civilian
| Women (All) | 41% |
| Indigenous Peoples | 3.4% |
| Visible Minorities | 9.6% |
| Persons with Disabilities | 5.5% |
Footnote *CAF
| Women (All) | 17.87% |
| Indigenous Peoples | 4% |
| Visible Minorities | 9% |
| Persons with Disabilities | 1% |
LGBTQ2+ Data not Available
Overall, the Public Service of Canada (all government departments) has greater Employment Equity group representation than the Department of National Defence.
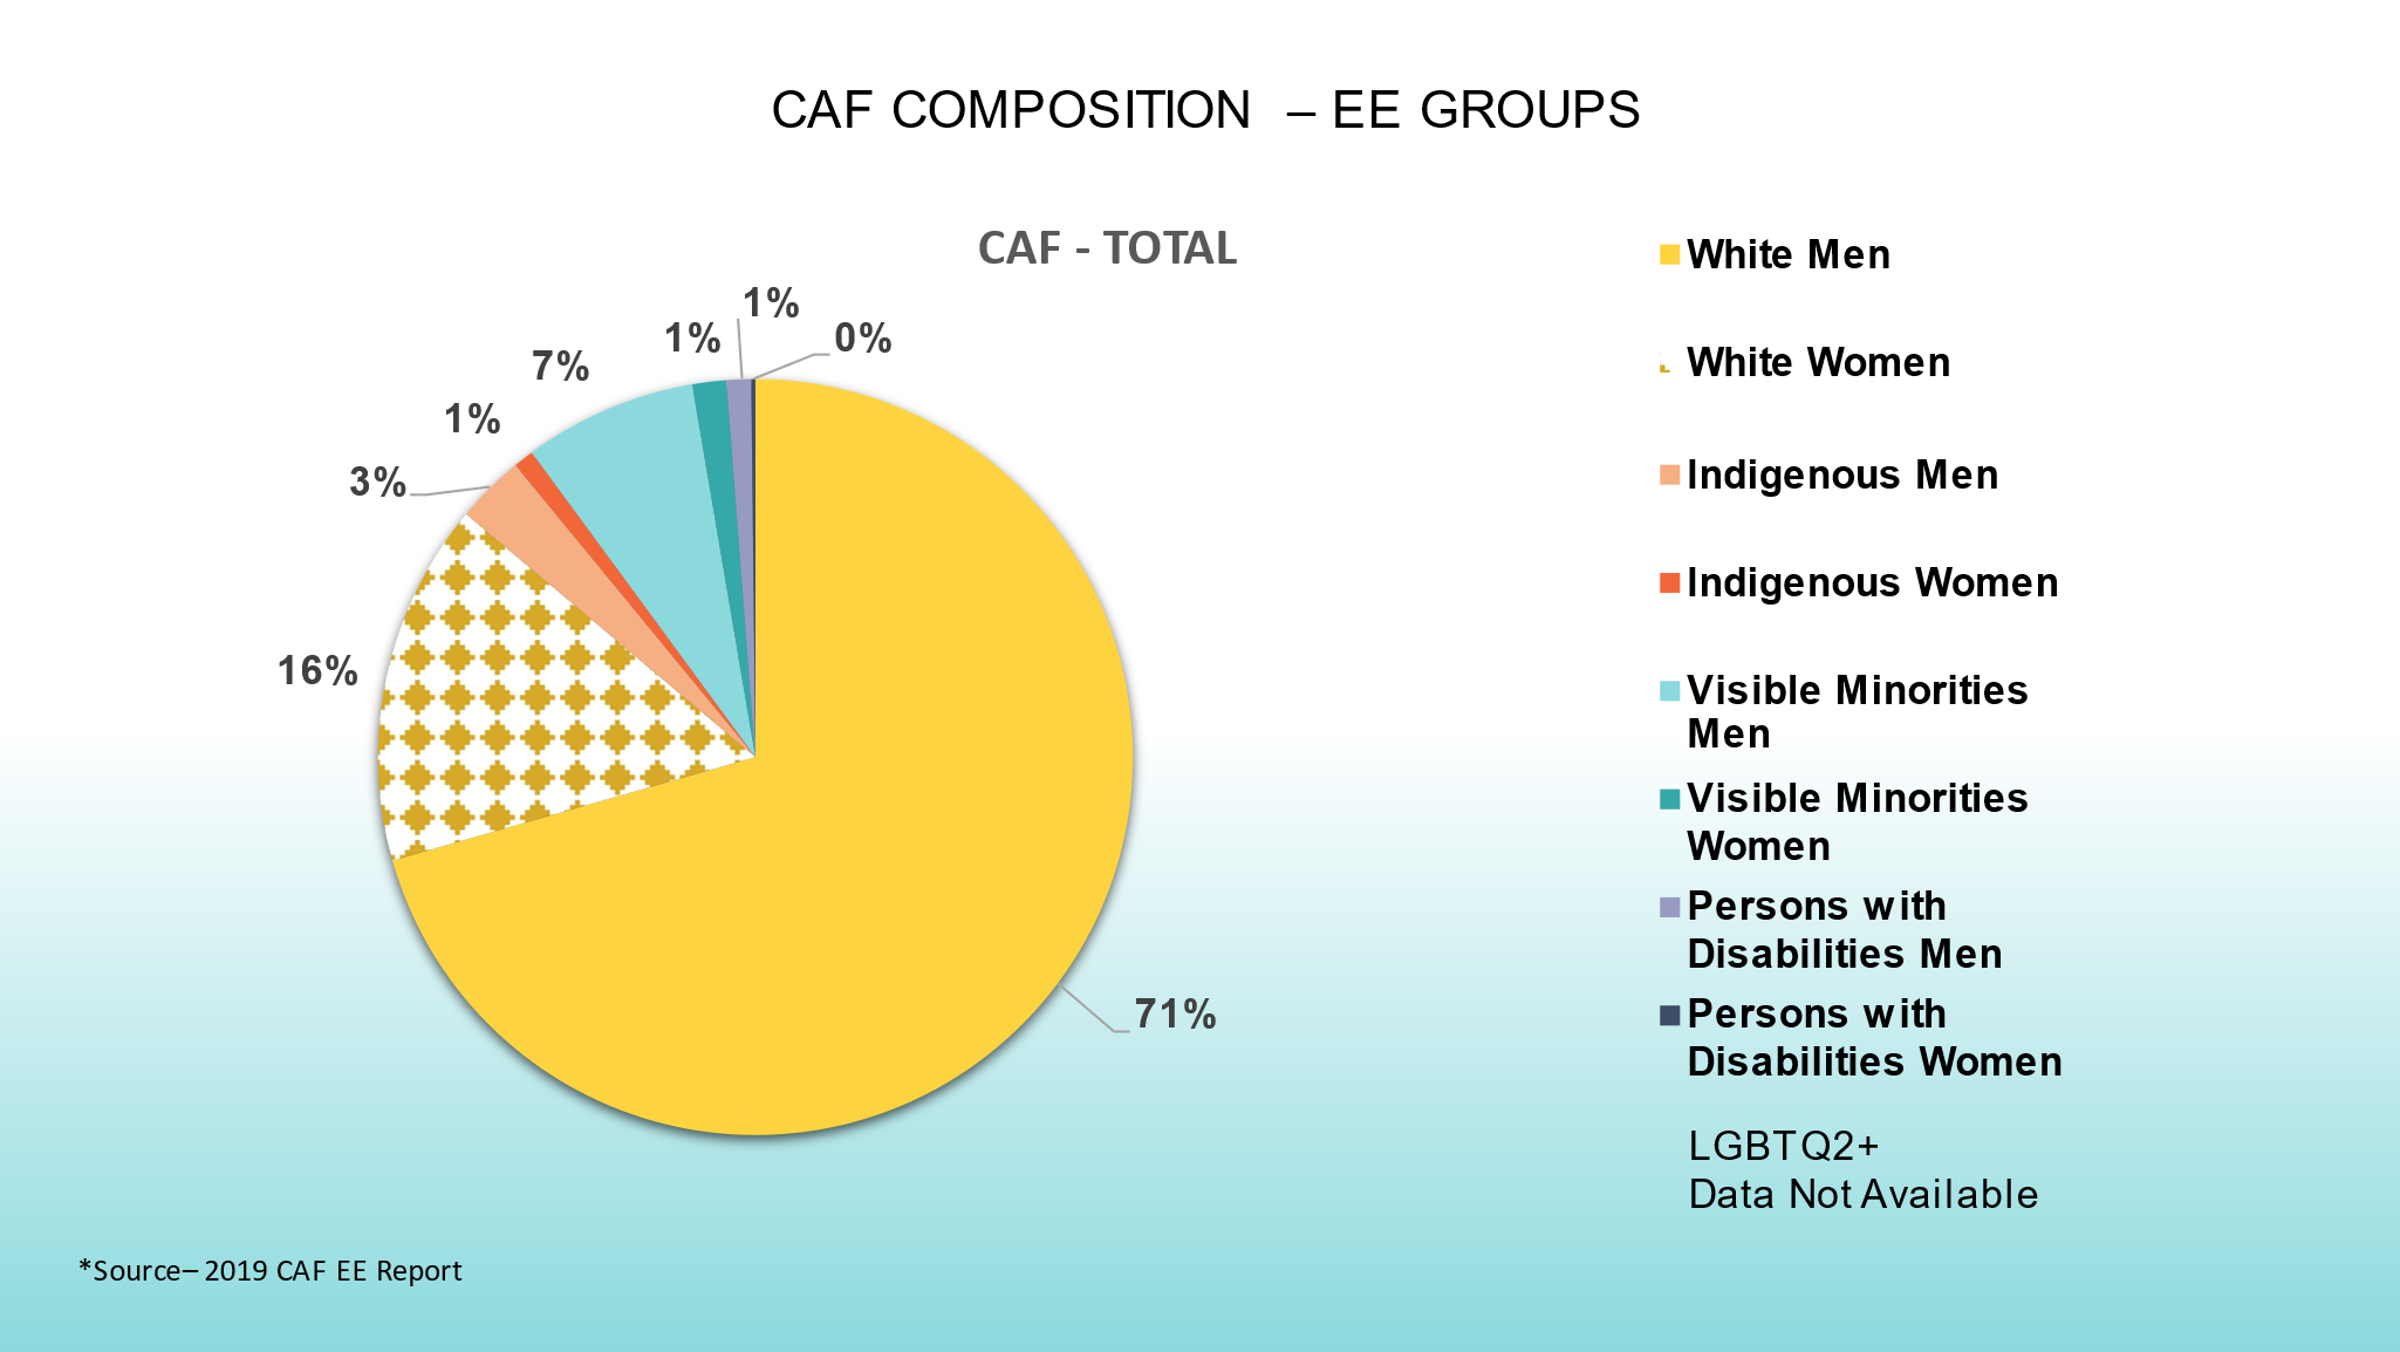
Figure 9: CAF Composition – Employment Equity (EE) Groups

Long description of Figure 9
CAF Composition – EE Groups
CAF – TOTALFootnote *
| Population | Percentage |
|---|---|
| White Men | 71% |
| White Women | 16% |
| Indigenous Men | 3% |
| Indigenous Women | 1% |
| Visible Minorities Men | 7% |
| Visible Minorities Women | 1% |
| Persons with Disabilities Men | 1% |
| Persons with Disabilities Women | 0% |
LGBTQ2+ Data not Available
Figure 9 shows the composition of the CAF according to the four EE groups.
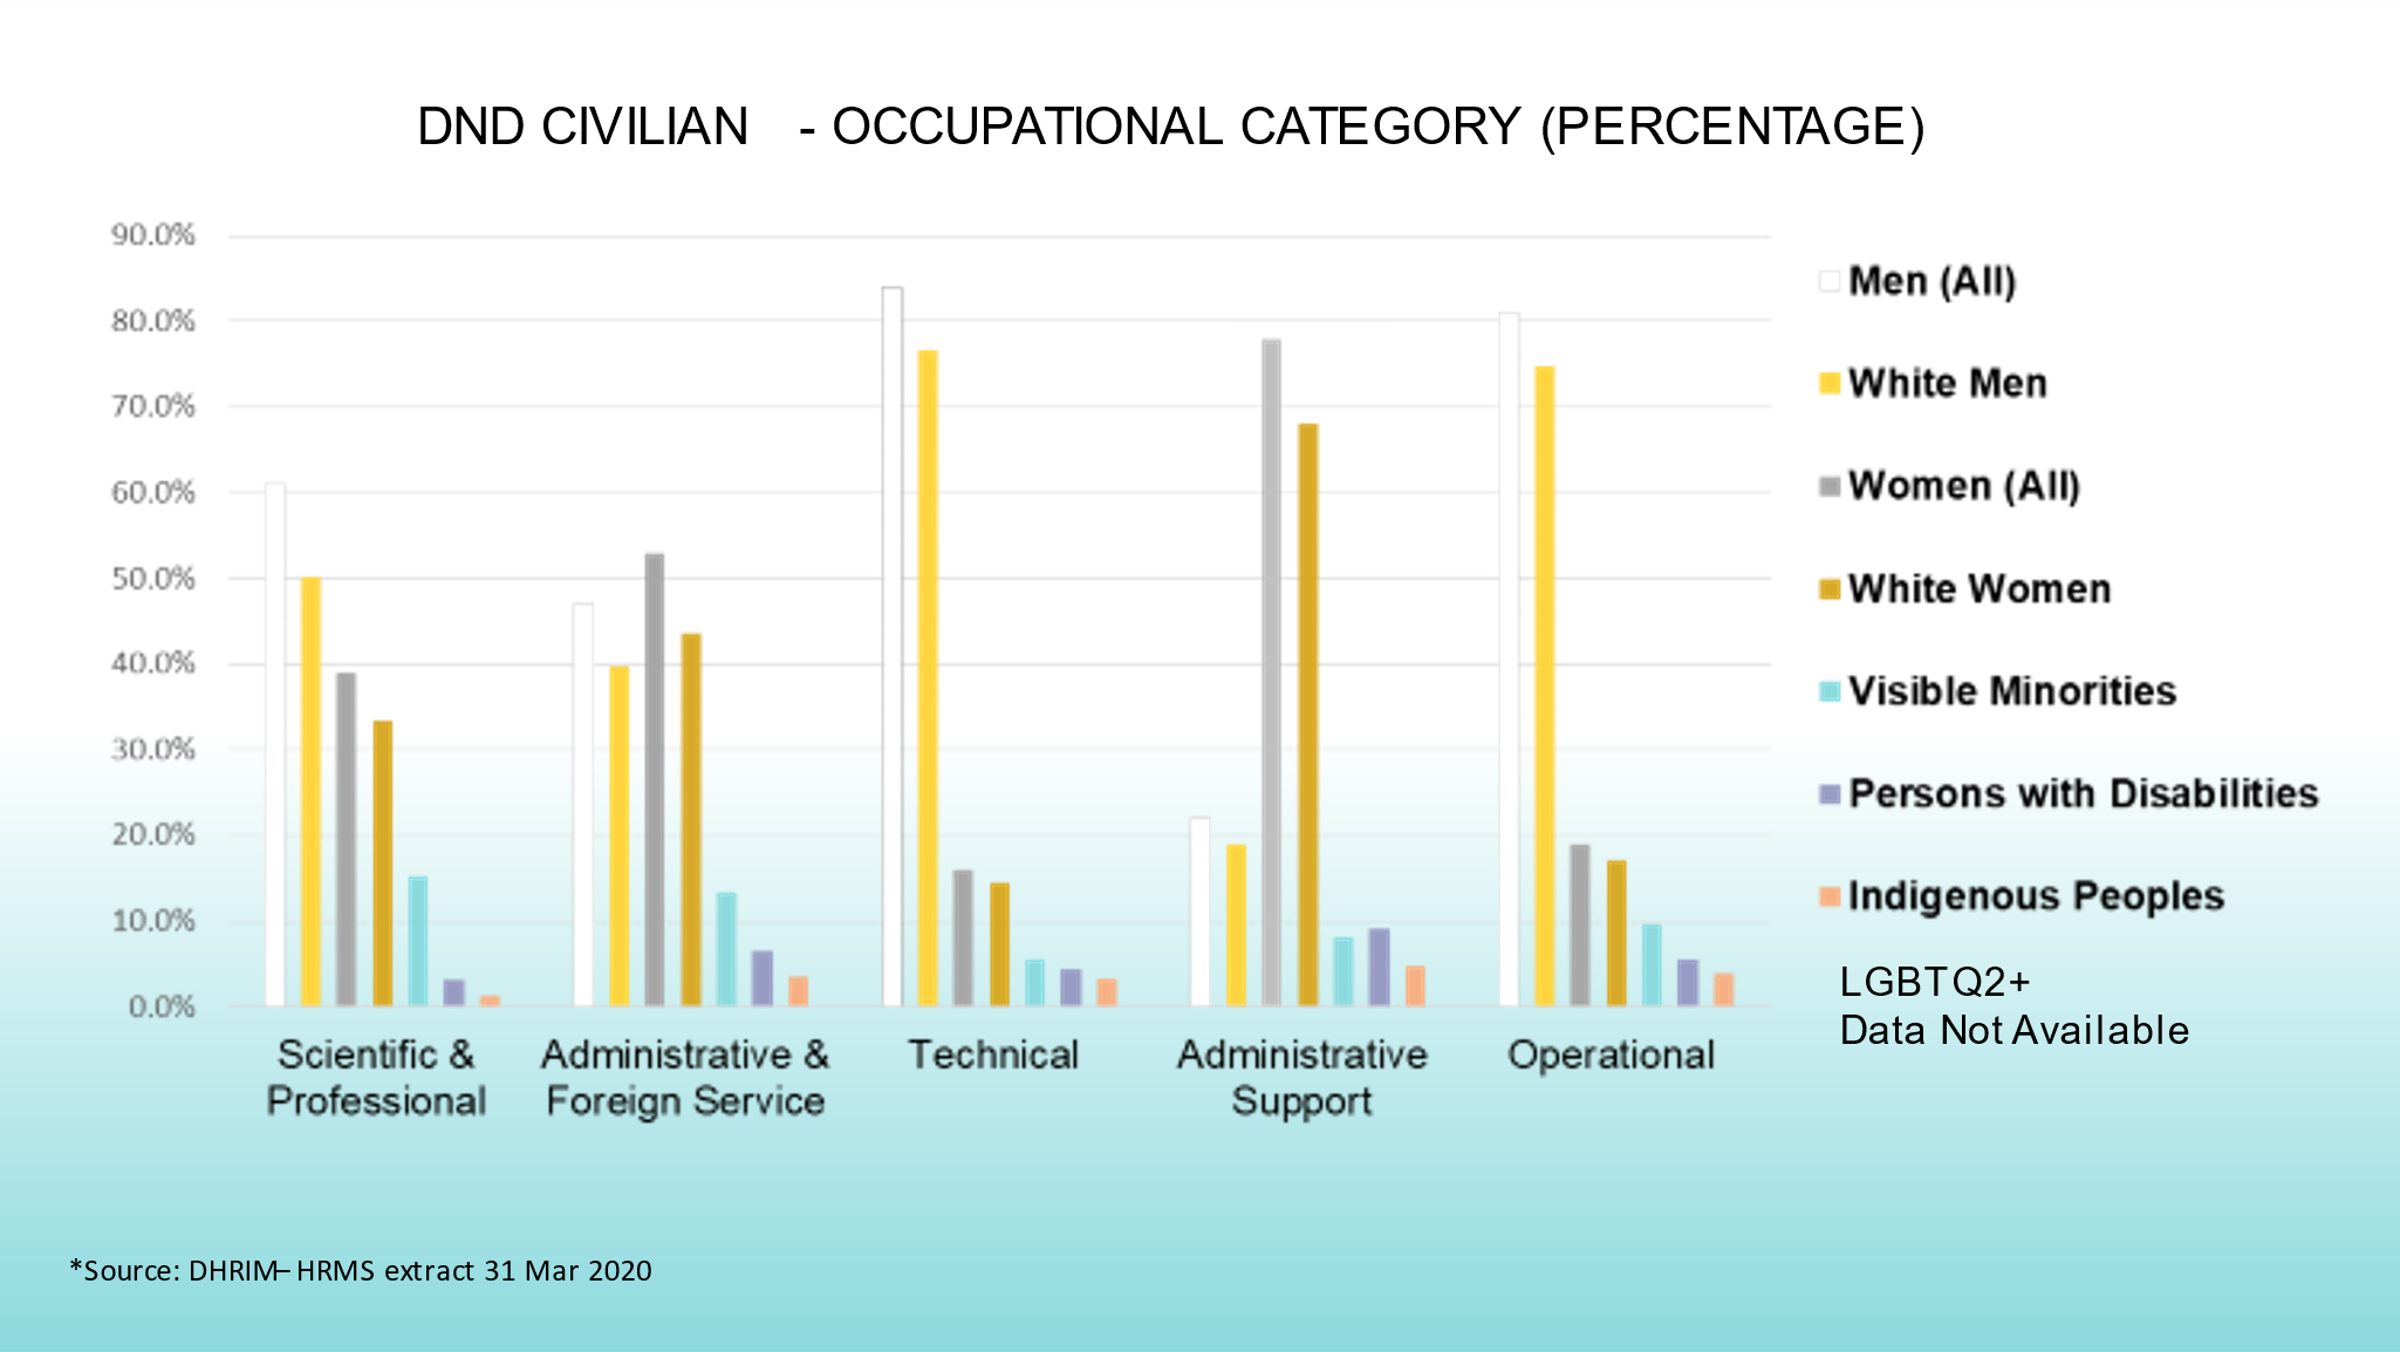
Figure 10: DND Civilian – Occupational Category (Percentage)

Long description for Figure 10
DND Civilian – Occupational Category (Percentage)Footnote *
Scientific & Professional
| Men (all) | 61% |
| White Men | 50.10% |
| Women (all) | 39% |
| White Women | 33.30% |
| Visible Minorities | 15.30% |
| Persons with Disabilities | 3.10% |
| Indigenous Peoples | 1.30% |
Administrative & Foreign Service
| Men (all) | 47% |
| White Men | 39.60% |
| Women (all) | 53% |
| White Women | 43.6% |
| Visible Minorities | 13.30% |
| Persons with Disabilities | 6.40% |
| Indigenous Peoples | 3.50% |
Technical
| Men (all) | 84% |
| White Men | 76.70% |
| Women (all) | 16% |
| White Women | 14.50% |
| Visible Minorities | 5.50% |
| Persons with Disabilities | 4.50% |
| Indigenous Peoples | 3.30% |
Administrative Support
| Men (all) | 22% |
| White Men | 19.10% |
| Women (all) | 78% |
| White Women | 68% |
| Visible Minorities | 8.10% |
| Persons with Disabilities | 9% |
| Indigenous Peoples | 4.80% |
Operational
| Men (all) | 81% |
| White Men | 74.70% |
| Women (all) | 19% |
| White Women | 17.10% |
| Visible Minorities | 9.60% |
| Persons with Disabilities | 5.50% |
| Indigenous Peoples | 3.80% |
Source: DHRIM–HRMS extract 31 Mar 2020
DND’s civilian component is made up of five occupational categories (excluding the Executive, or “EX” levels). With the exception of the Administrative Support and Administrative and Foreign Service categories, the occupations are predominantly made up of men, of whom most are white.
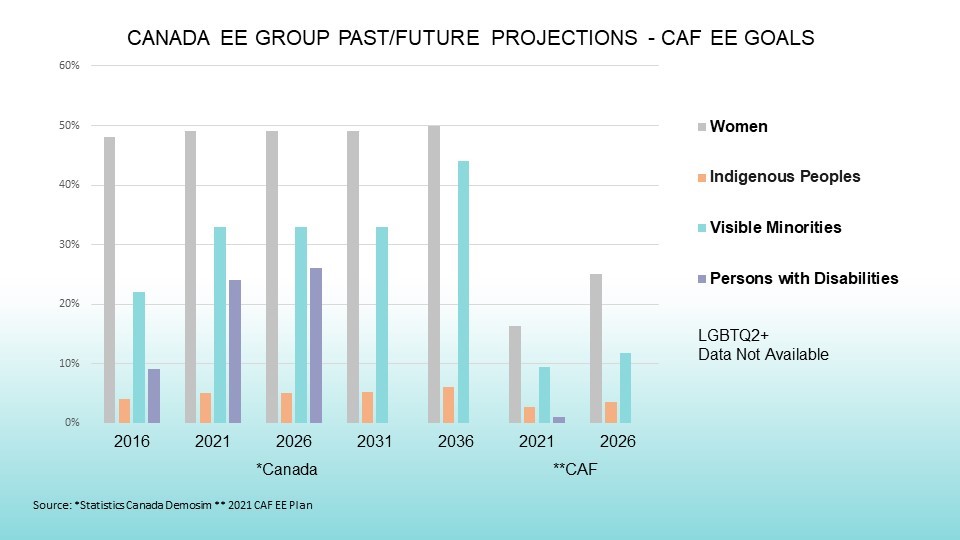
Figure 11: Canada Employment Equity Group Past/Future Projections - CAF EE Goals (Percentage)

Long description of Figure 11
Figure 11: Canada Employment Equity Group Past/Future Projections - CAF EE Goals (Percentage):
2016 – 2036 EE Projections – CanadaFootnote *
2016
| - | - | Women | Indigenous Peoples | Visible Minorities | Persons with Disabilities |
|---|---|---|---|---|---|
| Canada | 2016 | 48% | 4% | 22% | 9% |
| 2021 | 49% | 5% | 33% | 24% | |
| 2026 | 49% | 5% | 33% | 26% | |
| 2031 | 49% | 5% | 33% | - | |
| 2036 | 49% | 6% | 44% | - | |
| CAF | 2021 | 16% | 3% | 10% | - |
| 2026 | 25% | 4% | 12% | - |
LGBTQ2+ Data not Available
The CAF has set goals for EE representation, but it has failed to meet its own goals for 2006, 2011, and 2016. In addition, the CAF has admitted that meeting its modest objectives for 2021 or 2026 is very unlikely.Footnote 143 Even if those goals are achieved, projections indicate that the gap between representation of EE members in the CAF and Canadian demographics will widen
Summary
The data tell us that systemic barriers prevent many women, visible minorities and other racialized groups, and persons with disabilities, from joining, staying and thriving in the Defence Team (there are no data available for LGBTQ2+ persons). However, the available data is inadequate to support the goal of accurately tracking the progress of EE representation. As such, more rigorous and timely data is an urgent requirement if the Defence Team is to measure its performance and identify areas where systemic barriers are hindering diversity and inclusion within its workplaces.