
2025-26 Departmental Plan
On this page
- From the Minister
- Plans to deliver on core responsibilities and internal services
- Planned spending and human resources
- Corporate information
- Supplementary information tables
- Federal tax expenditures
- Definitions
Copyright information
©His Majesty the King in Right of Canada, as represented by
the Minister of Industry and Minister responsible for Canada Economic Development for Quebec Regions, 2025
ISSN: 2371-8277
Catalogue: Iu90-1/15E-PDF
From the Minister

Minister of Industry and Minister responsible for Canada Economic Development for Quebec Regions
I am pleased to present the Canada Economic Development for Quebec Regions (CED) 2025-2026 Departmental Plan. This plan reflects CED's ongoing commitment to growing the economies of all regions of Quebec, and to provide the levers needed to forge inclusive and sustainable economic prosperity.
In an uncertain global environment and a transforming economy, CED supports the economic resilience of Quebec's regions, notably by strengthening their competitiveness and positioning in supply chains and on foreign and domestic markets. We will prioritize strategic investments that promote sustainable growth and improve the business environment. This will be achieved through both regular programming and targeted initiatives that respond to emerging challenges and new market realities.
CED's investments will focus notably on strengthening the productivity, stimulating innovation and diversifying markets for small and medium-sized enterprises, which are the backbone of the regional economy and the main drivers of local economic opportunities. In this way, CED will support the growth of Quebec businesses, whether locally or in new markets.
CED will also continue to focus on an inclusive economy by supporting businesses run by people from under-represented groups, and by supporting projects that have a positive impact on the entire population, including aboriginal communities.
Thanks to its network of 12 business offices firmly rooted in the regions, CED will continue to listen to needs on the ground and adapt its programs and services to help communities seize new opportunities and capitalize on the Canadian advantage in strategic sectors such as the defence industry, quantum technologies, artificial intelligence and aerospace.
In this way, CED will continue to pave the way for a strong, diversified, innovative and successful regional economy for all Quebec communities.
I invite you to read the entire Departmental Plan to learn more about the Agency's commitments for 2025-2026.
Plans to deliver on core responsibilities and internal services
Core responsibilities and internal services
Core responsibility 1: Developing Quebec's economy
In this section
Description
Support economic growth and prosperity and job creation in Quebec by means of inclusive clean growth; help small and medium-sized businesses (SMEs) grow through trade and innovation; and build on competitive regional strengths.
Quality of life impacts
CED's core responsibility mainly contributes to the “Prosperity” domain of the Quality of Life Framework for Canada, and in particular to the following indicators: firm growth, employment, productivity, GDP per capita, and investment in in-house research and development. The benefits generated by CED's activities over the coming year will foster sustainable economic growth in all regions of Quebec and help improve the prosperity of Canadians.
This core responsibility also contributes to some extent to the “Environment” domain, since CED supports the enhancement of the environmental performance of businesses and communities from a sustainable economic development perspective.
Finally, we are contributing to the cross-cutting “equity and inclusion” perspective by pursuing our efforts to create an inclusive economy and increase the participation of various under-represented groups.
Indicators, results and targets
This section presents details on the department's indicators, the actual results from the three most recently reported fiscal years, the targets and target dates approved in 2025-26 for Developing Quebec's economy. Details are presented by departmental result.
Note that targets are established based on available results from recent years and the current and projected economic context for the year in question.
| Departmental result indicators | Actual results | Target | Date to achieve target |
|---|---|---|---|
| Number of high growth firms in Quebec | 2021-2022: 2,840* (2020) 2022-2023: 4,020* (2021) 2023-2024: 4,700* (2022) |
3,420 | March 31, 2026 |
| Value of exports of good (in dollars) from Quebec | 2021-2022: $97.2B (2021) 2022-2023: $107.5B (2022) 2023-2024: $111.9B (2023) |
$100B | March 31, 2026 |
| Value of exports of clean technologies (in dollars) from Quebec | 2021-2022: $2.7B* (2020) 2022-2023: $2.6B* (2021) 2023-2024: $2.3B* (2022) |
$2.3B | March 31, 2026 |
| Revenue growth rate of firms supported by CED programs | 2021-2022: 4.4%* (2018) 2022-2023: 11.8% (2022) 2023-2024: Not updated** |
4.0% | March 31, 2026 |
| * The data in the table corresponds to the most recent results published by Statistics Canada. The figures for previous years are those available and can be updated in current or future fiscal years. ** “Not updated” means that the data has not been updated since the previous results presented in the table. |
|||
| Departmental result indicators | Actual results | Target | Date to achieve target |
|---|---|---|---|
| Percentage of SMEs that are majority-owned by women, Indigenous Peoples, youth, visible minorities and persons with disabilities in Quebec | Women: Indigenous Peoples: Youth: Visible minorities: Persons with disabilities: |
Women: 16.0% Indigenous Peoples: 1.1% Youth: 14.4% Visible minorities: 4.3% Persons with disabilities: 0.4% |
March 31, 2026 |
| Percentage of professional, science and technology-related jobs in Quebec’s economy | 2021-2022: 37.1% (2021) 2022-2023:37.9% (2022) 2023-2024: 36.8% (2023) |
36.0% | March 31, 2026 |
| Amount leveraged per dollar invested by CED in community projects | 2021-2022: $2.23 (2022) 2022-2023: $2.91 (2023) 2023-2024: $3.01 (2024) |
$2.20 | March 31, 2026 |
| * The data in the table corresponds to the most recent results published by Statistics Canada. The figures for previous years are those available and can be updated in current or future fiscal years. ** “Not updated” means that the data has not been updated since the previous results presented in the table. |
|||
| Departmental result indicators | Actual results | Target | Date to achieve target |
|---|---|---|---|
| Value of Business Expenditure in Research and Development (BERD) by firms receiving CED program funding (in dollars) | 2021-2022: $256M* (2019) 2022-2023: $290M* (2020) 2023-2024: $227M (2021) |
$225M | March 31, 2026 |
| Percentage of businesses engaged in collaboration with higher education institutions in Quebec | 2021-2022: 23.1%* (2017 2019) 2022-2023: 17.3%* (2020 2022) 2023-2024: Not updated** |
22.0% | March 31, 2026 |
| * The data in the table corresponds to the most recent results published by Statistics Canada. The figures for previous years are those available and can be updated in current or future fiscal years. ** “Not updated” means that the data has not been updated since the previous results presented in the table. |
|||
In addition to the information presented in the above-mentioned Departmental Results Framework, CED monitors and evaluates several performance indicators for its programs, while aiming for continuous improvement in its performance measurement practices, to support evidence-based decision-making and guide programs and services. In particular, CED is currently revising its Departmental Results Framework so that indicators better reflect the results generated by its interventions.
Additional information on the detailed results and performance information for CED’s program inventory is available on GC InfoBase.
Plans to achieve results
The following section describes the planned results for Developing Quebec’s Economy in 2025-26.
Working within their respective mandates, CED and the six other regional development agencies (RDAs) aim to grow Canada’s economy by developing and implementing their own specific measures to promote economic growth and equal opportunity based on the specific realities of their various regions.
To fulfill its core responsibility, CED seeks to contribute to and achieve the three departmental results set out below, which remain nonetheless dependent on the economic context. In 2025-2026, the organization’s priority will be to pursue strategic interventions tailored to the realities of SMEs and communities in all regions of Quebec, with a view to fostering long-term, sustainable growth.
In addition to financing and supporting its customers in the realization of their projects, CED will continue to act as a facilitator, providing companies with the guidance and market information they need to grow. CED will also act as a business networking catalyst, bringing the right partners together around projects.
In parallel, CED will continue to ensure the sound management of its portfolio of active projects, worth a total investment of almost $3B.
Departmental result 1: Quebec businesses are innovative and growing
In 2025-2026, CED will work to foster innovation, productivity and business growth in Quebec through the national Regional Economic Growth through Innovation (REGI) program—the department’s primary source of funding for innovative SMEs and the organizations that support them.
The results we expect to achieve through this program are as follows:
- Support the acceleration of efforts by businesses to go digital and adopt cutting-edge technologies such as robotization and the automation of production activities, particularly businesses in the manufacturing sector. The support provided for businesses in the various manufacturing subsectors represents a lever for growth, productivity and competitiveness for many regions and economic sectors of Quebec.
- Pursue the implementation of the Regional Artificial Intelligence Initiative (RAII). CED has a five year (2024-2029) $38.2M financial assistance budget to support the development and commercialization of new technologies and solutions and accelerate the adoption of AI by SMEs. AI represents a lever for growth, productivity and market competitiveness, especially for the manufacturing sector.
- Foster innovation, productivity and the growth of innovative manufacturing businesses in the residential construction industry by pursuing the implementation of the Regional Homebuilding Innovation Initiative (RHII). CED has a financial assistance budget of $10.45M over two years (2024-2026) to support projects by manufacturing SMEs and non-profit organizations (NPOs) that operate in the multi-unit modular housing construction sector or develop new multi-unit housing construction processes or materials.
- Maintain support for the green and inclusive transition of Quebec’s businesses and regions by supporting inclusive entrepreneurship and projects involving the development or adoption of clean technologies or changes to business practices from a sustainable growth perspective.
CED will pursue its effort to promote the capabilities of Quebec SMEs and research centres among major contractors and raise awareness about the opportunities generated by the Industrial and Technological Benefits (ITB) Policy, which represent a lever for growth, diversification and exports for the Quebec economy.
Departmental result 2: Communities are economically diversified in Quebec
In 2025-2026, CED will support the economic diversification of communities through the Quebec Economic Development Program (QEDP) and the Community Futures Program (CFP).
Under the QEDP, CED will primarily support local business projects, social economy projects, and northern isolated community food security projects, as well as the development of regional tourism and the promotion of tourist attractions both nationally and internationally. The expected results are as follows:
Initiatives for which CED has received additional temporary funding:
- Tourism Growth Program - Quebec (TGP): The goal of this program, which has a financial assistance budget of $21.1M over three years (2023-2026), is to help SMEs, NPOs and communities enhance their tourism products and experiences, particularly in rural and remote areas. In 2025-2026, CED will continue to support projects that have already been approved and which aim to develop regional tourism and promote local tourist attractions.
- Northern Isolated Community Initiatives (NICI) Fund: The NICI Fund has a financial assistance budget of $3.8M over three years (2024-2027) and is part of the Food Policy for Canada It is designed to support current and new food initiatives that strengthen and diversify economic activity in Canada's North. In Quebec, the targeted territory is Nunavik. The initiative will be delivered in collaboration with other federal, provincial and regional partners to provide solutions to local and regional food security challenges.
Initiatives funded from CED budgets:
- Initiative to Support Economic Development in Montréal's East End: Drawing on a financial assistance budget of $30M over three years, this initiative aims to support the east end of Montréal, an area that has been facing major challenges to its economic development for a number of years. CED will support SME and NPO projects that will generate positive economic benefits for east-end Montréal and foster the area's revitalization, attractiveness and sustainable reindustrialization.
- Support for Social Economy Mutualization Projects: This initiative aims to support the sharing of equipment and technologies between social economy enterprises seeking to increase their sustainability, productivity, growth and capacity for commercialization or innovation, thereby contributing to the economic vitality of Quebec communities.
Through the CFP and the renewed agreement for the period from 2024 to 2029, CED will support the operations of the Community Futures Development Corporations (CFDCs) and Business Development Centres (BDCs), which offer financing and technical assistance to small businesses, and support various local economic development initiatives. This assistance also helps organizations build their intervention capacity and invest in the green transition, the digital shift, business transfers in rural areas, and young entrepreneurs. Through the CFP, CED will continue to support SMEs and communities in rural Quebec.
Highlights: Inclusive Economy
CED is committed to promoting more inclusive economic growth by supporting businesses led by members of various under-represented groups, as well as projects that have a positive impact on the population as a whole, including Indigenous communities (First Nations, Inuit and Métis).
- The Economic Development Initiative- Official Languages (EDI-OL) is a national program that was launched in 2008. Delivered by the RDAs and Innovation, Science and Economic Development Canada (ISEDC), it supports the economic development of official-language minority communities (OLMCs). This program contributes to the Action Plan for Official Languages 2023-2028: Protection Promotion-Collaboration. Among the projects supported, CED will continue to support two well-established NPOs in Quebec: Youth employment Services (YES) and the Corporation d'employabilité et de développement économique communautaire (CEDEC).
- The Tourism Growth Program (TGP) sets a target of allocating 15% of its budget envelope to Indigenous-led tourism projects.
- CED will pursue the implementation of the Inuit Nunangat Policy, in place since April 2022, to ensure that the Agency's interventions are based on an understanding of the specific needs and circumstances of the Inuit, and that this understanding is reflected in its services, programs and initiatives.
- CED will pay particular attention to the realities of Indigenous communities by establishing partnerships with them and, if necessary, tailoring the interventions it provides under its regular initiatives and programs with a view to addressing barriers to the economic participation of this client group.
- CED will continue to offer specific flexible conditions and targeted support to Quebec's most economically vulnerable RCMs via the Targeted support for Quebec's economically vulnerable RCMs initiative.
Departmental result 3: Businesses invest in the development and commercialization of innovative technologies in Quebec
The expected results for 2025-2026 are as follows:
- Pursuit of assistance for innovative businesses and the ecosystem that supports them. Through the REGI program, CED will help SMEs build their capacity to commercialize innovative products. More specifically, under the Regional Artificial Intelligence Initiative (RAII) and the Regional Homebuilding Innovation Initiative (RHII), CED will contribute to the development of innovative products, the adoption and scaling-up of new methods and technologies by Quebec SMEs, and the commercialization of innovative technologies.
- Continued support for regional quantum innovation (RQI) through a financial assistance budget of $22.2M over seven years (2021-2028) to assist SMEs and NPOs looking to get ahead in the quantum field by adopting, developing and commercializing this type of innovative technology.
Key risks
CED updates its corporate risk profile annually in order to better anticipate, prioritize and mitigate issues that could affect the accomplishment of its mission. The following two risks related to the core responsibility were identified for fiscal 2025-2026:
Programs and services:
Given the current context—and the global economic situation and changes to federal and provincial programs targeting SMEs in particular—the challenges facing CED's clientele are intensifying. This situation could result in CED being overwhelmed in terms of its ability to effectively intervene across the entire project continuum.
To meet these challenges, CED will continue to adopt strategies tailored to regional realities, while maintaining an agile implementation of its regular programs to meet emerging needs. CED will also continue to work closely with its partners and other levels of government to build their capacity to identify and implement strategic projects. With the help of its 12 regional business offices and its integrated approach to information, assistance and investment monitoring, CED will support businesses and communities in the development and diversification of Quebec's regional economies.
IT security:
As the number and sophistication of cyberthreats continues to rise in Canada, public organizations remain prime targets. Consequently, there is a risk that an IT security incident could disrupt CED's operations and damage its reputation.
To mitigate these risks, CED will continue to implement active cybersecurity measures, such as improving training and education for staff to equip them and prepare them to adopt the right reflexes when faced with situations presenting cybersecurity challenges, and deploying technical controls to prevent and detect incidents.
Planned resources to achieve results
Table 1: Planned resources to achieve results for Developing Quebec’s Economy| Resource | Planned |
|---|---|
| Spending | 307,850,857 |
| Full-time equivalents | 206 |
Complete financial and human resources information for CED’s program inventory is available on GC InfoBase.
Related government priorities
Gender-based analysis plus
In 2025-2026, CED pursued the implementation of its gender-based analysis plus (GBA+) policy and organizational governance framework to increase the consideration of gender and diversity in policy development, program design, internal practices and client services. We will continue to include GBA+ in the design and implementation of all new policies, programs and initiatives.
CED will also continue to refine the department's equity, diversity and inclusion (EDI) approach launched in 2022-2023. This approach applies to all CED clients and programs.
In addition, CED will implement the national GBA+ recommendations in the Regional Economic Growth through Innovation - National Evaluation conducted in 2024.
Finally, in 2024-2025, CED undertook a GBA+ analysis of our regular programs (the QEDP and the REGI) to fully understand their impact on various populations in the regions and communities of Quebec. This analysis takes into account a range of overlapping identity factors, such as sex and gender, as well as age, language, geographic location, ethnicity and sexual orientation. In 2025-2026, CED will take the findings of this analysis into consideration when developing and implementing its programs and initiatives.
United Nations 2030 Agenda for Sustainable Development and the UN Sustainable Development Goals
United Nations 2030 Agenda for Sustainable Development and the UN Sustainable Development Goals CED invests in projects that support the transition of Quebec's regions to a cleaner, more sustainable and more inclusive economy. Specifically, we are contributing to the achievement of the four following sustainable development goals:
- Goal 8: Encourage inclusive and sustainable economic growth in Canada
- Goal 10: Advance reconciliation with Indigenous Peoples and take action to reduce inequality
- Goal 12: Reduce waste and switch to zero-emission vehicles
- Goal 13: Take action on climate change and its impacts
Certain temporary initiatives, such as support for regional quantum innovation (RQI) and the Regional Artificial Intelligence Initiative (RAII), contribute to the following goals:
- Goal 9: Foster innovation and green infrastructure in Canada
- Goal 11: Improve access to affordable housing, clean air, transportation, parks, and green spaces, as well as cultural heritage in Canada
In addition, in line with its action plan to accelerate the green transition, CED plans to invest at least $50M in 2025-2026 to support projects involving the development, adoption and commercialization of new sustainable technologies in order to help accelerate the shift towards a green economy in the regions of Quebec.
More information on CED's contributions to Canada's Federal Implementation Plan on the 2030 Agenda and the Federal Sustainable Development Strategy can be found in our Departmental Sustainable Development Strategy.
Program inventory
The core responsibility Developing Quebec's economy is supported by the following programs:
- Program: Regional Innovation
- Program: Community Vitality
- Program: Targeted or Temporary Support
Additional information related to the program inventory for Developing Quebec's Economy is available on the Results page on GC InfoBase .
Internal services
Description
Internal services are the services that are provided within a department so that it can meet its corporate obligations and deliver its programs. There are 10 categories of internal services:
- management and oversight services
- communications services
- legal services
- human resources management services
- financial management services
- information management services
- information technology services
- real property management services
- material management services
- acquisition management services
Plans to achieve results
In 2024-2025, CED carried out a strategic review for the purpose of renewing its internal management framework. 2025-2026 will mark the second year of implementation of our three-year management plan, CED 2027, which targets the achievement of concrete organizational results in support of CED's mission.
Along the same lines, the 2024-2025 internal management priorities will be renewed; however, the scope, intensity and pace of delivery will be adjusted to the organization's capabilities and the refocusing of spending exercise
CED will pursue its actions aimed at providing a healthy, accessible and inclusive work environment, and will put in place measures to foster the excellence of our programs and services and ensure that they are client-focused, with an emphasis on digital integration.
This section presents the measures planned by the department to achieve the expected results and targets for internal services.
- Pursuit of efforts to create a work environment conducive to collaboration, communication and inclusion, specifically by supporting the creation of networks and safe spaces for equity-seeking groups, and by promoting a culture of collaboration.
- Continued strengthening of the digital enablement of staff to ensure that they are well equipped to contribute to service excellence.
- Optimization of our operational processes and tools to ensure the continuous improvement of client service.
Optimizing its processes, continuously improving the way it does business and using its digital strategy as a cross-functional lever will allow CED to fulfill its mission even more effectively.
Planned resources to achieve results
Table 2: Planned resources to achieve results for internal services this year| Resource | Planned |
|---|---|
| Spending | 23,378,466 |
| Full-time equivalents | 164 |
Complete financial and human resources information for CED's program inventory is available on GC InfoBase.
Planning for contracts awarded to Indigenous businesses
Government of Canada departments are to meet a target of awarding at least 5% of the total value of contracts to Indigenous businesses each year.
CED is part of Phase 2 of the requirement for departments to ensure that a minimum of 5% of the total value of contracts are awarded to Indigenous businesses as of 2023-2024. As a result of actions deployed since 2022-2023, which are now part of the organization's way of doing business, the 5% annual target has already been exceeded.
Methodology:
- Awareness-raising and in-house training: Organization of in-house sessions to foster understanding and commitment to the use of Indigenous businesses in procurement processes.
- Inclusion in the strategic plan: Addition of concrete measures to CED’s strategic procurement plan, including the proactive identification of opportunities, the use of Indigenous supplier directories, and the application of set-aside mechanisms.
- Monitoring and accountability: Implementation of monitoring, reporting and justification/rationale tools to ensure that Indigenous considerations are systematically included in procurement decision-making processes.
| 5% Reporting Field | 2023-24 Actual Result | 2024-25 Forecasted Result | 2025-26 Planned Result |
|---|---|---|---|
| Total percentage of contracts with Indigenous businesses | 9,45% | 5% | 5% |
Planned spending and human resources
This section provides an overview of CED’s planned spending and human resources for the next three fiscal years and compares planned spending for 2025-26 with actual spending from previous years.
Spending
This section presents an overview of the department’s planned expenditures from 2022-23 to 2027-28.
Budgetary performance summary
Table 4 Three-year spending summary for core responsibilities and internal services (dollars)| Core responsibilities and Internal services | 2022-2023 Actual Expenditures | 2023-24 Actual Expenditures | 2024-2025 Forecast Spending |
|---|---|---|---|
| Developing Quebec’s economy | 519,573,605 | 536,169,207 | 307,821,524 |
| Internal services | 24,541,115 | 27,013,595 | 23,593,741 |
| Total (s) | 544,114,720 | 563,182,802 | 331,415,265 |
More financial information from previous years is available on the Finances section of GC Infobase.
Table 5 Planned three-year spending on core responsibilities and internal services (dollars)| Core responsibilities and Internal services | 2025-26 Planned Spending | 2026-27 Planned Spending | 2027-28 Planned Spending |
|---|---|---|---|
| Developing Quebec’s economy | 307,850,857 | 203,194,650 | 200,256,348 |
| Internal services | 23,378,466 | 21,148,480 | 21,063,857 |
| Total | 331,229,323 | 224,343,130 | 221,320,205 |
More detailed financial information on planned spending is available on the Finances section of GC Infobase.
Funding
This section provides an overview of the department’s voted and statutory funding for its core responsibilities and for internal services. For further information on funding authorities, consult the the Government of Canada budgets and expenditures.
Graph 1: Approved funding (statutory and voted) over a six-year period
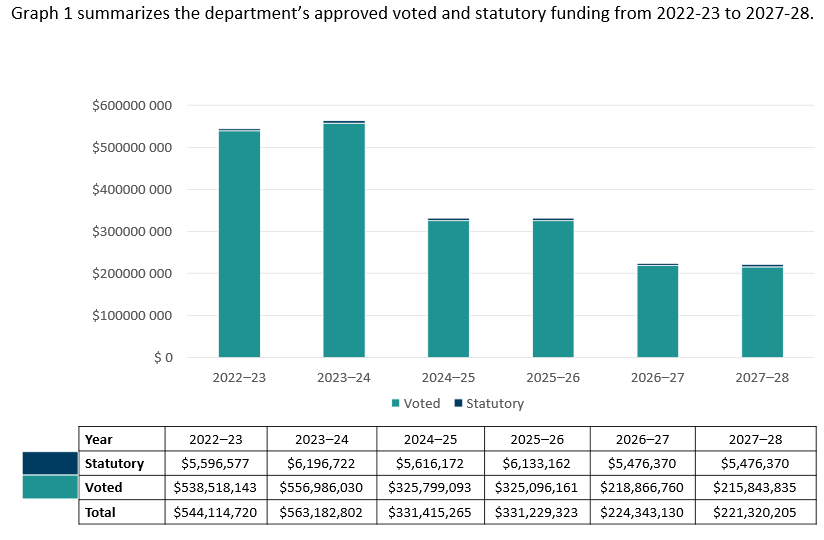
Text description of graph 1
The graph provides a visual depiction of planned spending by fiscal year for the period from 2022-2023 to 2027-2028. Spending is divided into two categories: statutory items and voted appropriations.
Stacked bars show statutory items in dark blue, voted appropriations in turquoise, and the total amounts. Voted appropriations make up the bulk of spending, with total amounts gradually declining as of 2023-2024.
The table beneath the graph details the various amounts, as follows:
- 2022-2023: total of $544,114,720, made up of $5,596,577 for statutory items and $538,518,143 for voted appropriations
- 2023-2024: total of $563,182,802, made up of $6,196,722 for statutory items and $556,986,030 for voted appropriations
- 2024-2025: start of the decline, with a total of $331,415,265, made up of $5,616,172 for statutory items and $325,799,093 for voted appropriations
- 2025-2026: total of $331,229,323 , made up of $6,133,162 for statutory items and $325,096,161 for voted appropriations
- 2026-2027: total of $224,343,130 , made up of $5,476,370 for statutory items and $218,866,760 for voted appropriations
- 2027-2028: total of $221,320,205 , made up of $5,476,370 for statutory items and $215,843,835 for voted appropriations
| Fiscal year | Total | Voted | Statutory |
|---|---|---|---|
| 2022-23 | 544,114,720 | 538,518,143 | 5,596,577 |
| 2023-24 | 563,182,802 | 556,986,030 | 6,196,722 |
| 2024-25 | 331,415,265 | 325,799,093 | 5,616,172 |
| 2025-26 | 331,229,323 | 325,096,161 | 6,133,162 |
| 2026-27 | 224,343,130 | 218,866,760 | 5,476,370 |
| 2027-28 | 221,320,205 | 215,843,835 | 5,476,370 |
Analysis of statutory and voted funding over a six-year period
CED’s spending varies over time, primarily as a result of temporary and targeted funding received. The increase in spending between 2022-2023 and 2023-2024 is mainly attributable to funding allocated to the new economic recovery initiatives launched in 2021-2022 to support the economy in the wake of the pandemic. These initiatives were extended for an additional year to better meet recipients’ needs.
The economic stimulus initiatives ended on March 31, 2024, which explains the marked reduction in spending forecasts for 2024-2025. Planned funding went back to pre-pandemic levels.
Projected funding for 2025-2026 remains stable despite the end of the funding for the International Sustainability Reporting Standards Board and the Hurricane Fiona Recovery Fund notably because of the extension of the Black Entrepreneurship Program.
The reduction in planned spending for 2026-2027 can be partially attributed to the review of the mechanism for reinvesting reimbursements of repayable contributions awarded under regular programs. Up to 2023-2024, these reimbursements made up a sizable proportion of recurring funding. A transitional measure will maintain funding for 2024-2025 and 2025-2026. At the time this report was written, measures had yet to be confirmed for subsequent years. Spending forecasts for 2026-2027 and 2027-2028 could therefore be adjusted based on future budgetary decisions.
For further information on CED’s departmental appropriations, consult the 2025-26 Main Estimates.
Future-oriented condensed statement of operations
The future-oriented condensed statement of operations provides an overview of CED’s operations for 2024-25 to 2025-26.
Table 6: Future-oriented condensed statement of operations for the year ended March 31, 2026 (dollars)| Financial information | 2024-25 Forecast results | 2025-26 Planned results | Difference (Planned results minus forecasted) |
|---|---|---|---|
| Total expenses | 200,293,872 | 234,283,486 | 33,989,614 |
| Total revenues | 0 | 0 | 0 |
| Net cost of operations before government funding and transfers | 200,293,872 | 234,283,486 | 33,989,614 |
Analysis of forecasted and planned results
CED’s total net spending in 2025-2026 is projected to be $234,3M, up 16.97% year-over-year. This increase in planned spending is mainly attributable to funding for transfer payments.
CED’s planned spending consists of transfer payments, i.e., expenditures associated with non-repayable and conditionally repayable contributions, and salary and non-salary expenditures (professional and special services). Non-repayable and conditionally repayable contributions account for the bulk of our spending and are projected to total $179,4M in 2025-2026, which represents a 21% increase over 2024-2025.
Our revenue, returned to the Consolidated Revenue Fund, is declared in our financial statements as having been earned on behalf of the government. Hence, the organization’s total net revenue is zero. It should be noted that CED’s total gross revenues are forecast to amount to $1.8M in 2025-2026, up $0.5M from 2024-2025.
A more detailed Future-Oriented Statement of Operations and associated Notes for 2025-26, including a reconciliation of the net cost of operations with the requested authorities, is available on CED’s website.
Human resources
This section presents an overview of the department’s actual and planned human resources from 2022-23 to 2027-28.
Table 7: Actual human resources for core responsibilities and internal services| Core responsibilities and internal services | 2022-23 Actual full-time equivalents | 2023-24 Actual full-time equivalents | 2024-25 Forecasted full-time equivalents |
|---|---|---|---|
| Developing Quebec’s Economy | 212 | 215 | 214 |
| Internal services | 168 | 164 | 168 |
| Total | 380 | 379 | 382 |
Analysis of human resources over the last three years
Human resources remain stable despite the end of funding for economic recovery initiatives on March 31, 2024. From 2023-2024 through to 2025-2026, grant and contribution funds have been reallocated to the operating budget to stabilize the workforce. The aim of this measure is to cover monitoring and other essential activities required for the completion of the emergency and recovery initiatives put in place in response to the COVID-19 pandemic, and to ensure the effective management of CED’s almost $3B investment portfolio (active projects).
| Core responsibilities and internal services | 2025-26 Planned full-time equivalents | 2026-27 Planned full-time equivalents | 2027-28 Planned full-time equivalents |
|---|---|---|---|
| Developing Quebec’s Economy | 206 | 177 | 177 |
| Internal services | 164 | 141 | 141 |
| Total | 370 | 318 | 318 |
Analysis of human resources for the next three years
The second phase of the Responsible Government Spending initiative takes effect in 2025–2026, and the size of department’s workforce will be gradually reduced (notably through attrition). The reduction will be larger in 2026-2027 and will be maintained in subsequent years.
The reallocation of grant and contribution funds to the operating budget ends on March 31, 2026, which explains, for the most part, the sharp drop in the size of the workforce as of 2026-2027.
Corporate information
Departmental profile
Appropriate minister(s):
The Honourable Mélanie Joly
Institutional head:
Sony Perron
Ministerial portfolio:
Canada Economic Development for Quebec Regions
Enabling instrument(s):
Economic Development Agency of Canada for the Regions of Quebec Act
Year of incorporation / commencement:
2005
Supplementary information tables
The following supplementary information tables are available on the CED website.
Information on CED’s departmental sustainable development strategy can be found on CED’s website.
Federal tax expenditures
CED’s Departmental Plan does not include information on tax expenditures. The tax system can be used to achieve public policy objectives through the application of special measures such as low tax rates, exemptions, deductions, deferrals and credits. The Department of Finance Canada publishes cost estimates and projections for these measures each year in the Report on Federal Tax Expenditures.
This report also provides detailed background information on tax expenditures, including descriptions, objectives, historical information and references to related federal spending programs as well as evaluations and GBA Plus of tax expenditures.
Definitions
List of terms
Appropriation (crédit)
Any authority of Parliament to pay money out of the Consolidated Revenue Fund.
Budgetary expenditures (dépenses budgétaires)
Operating and capital expenditures; transfer payments to other levels of government, departments or individuals; and payments to Crown corporations.
Core responsibility (responsabilité essentielle)
An enduring function or role performed by a department. The intentions of the department with respect to a core responsibility are reflected in one or more related departmental results that the department seeks to contribute to or influence.
Departmental Plan (plan ministériel)
A report on the plans and expected performance of an appropriated department over a 3year period. Departmental Plans are usually tabled in Parliament each spring.
Departmental result (résultat ministériel)
A consequence or outcome that a department seeks to achieve. A departmental result is often outside departments’ immediate control, but it should be influenced by program-level outcomes.
Departmental result indicator (indicateur de résultat ministériel)
A quantitative measure of progress on a departmental result.
Departmental results framework (cadre ministériel des résultats)
A framework that connects the department’s core responsibilities to its departmental results and departmental result indicators.
Departmental Results Report (rapport sur les résultats ministériels)
A report on a department’s actual accomplishments against the plans, priorities and expected results set out in the corresponding Departmental Plan.
Full-time equivalent (équivalent temps plein)
A measure of the extent to which an employee represents a full person-year charge against a departmental budget. For a particular position, the full-time equivalent figure is the ratio of number of hours the person actually works divided by the standard number of hours set out in the person’s collective agreement.
Gender-based analysis plus (GBA Plus) (analyse comparative entre les sexes plus [ACS Plus])
Is an analytical tool used to support the development of responsive and inclusive policies, programs, and other initiatives. GBA Plus is a process for understanding who is impacted by the issue or opportunity being addressed by the initiative; identifying how the initiative could be tailored to meet diverse needs of the people most impacted; and anticipating and mitigating any barriers to accessing or benefitting from the initiative. GBA Plus is an intersectional analysis that goes beyond biological (sex) and socio-cultural (gender) differences to consider other factors, such as age, disability, education, ethnicity, economic status, geography (including rurality), language, race, religion, and sexual orientation.
Using GBA Plus involves taking a gender- and diversity-sensitive approach to our work. Considering all intersecting identity factors as part of GBA Plus, not only sex and gender, is a Government of Canada commitment.
Government priorities (priorités gouvernementales)
For the purpose of the 2025-26 Departmental Plan, government priorities are the high-level themes outlining the government’s agenda in the November 23, 2021, Speech from the Throne: building a healthier today and tomorrow; growing a more resilient economy; bolder climate action; fight harder for safer communities; standing up for diversity and inclusion; moving faster on the path to reconciliation; and fighting for a secure, just and equitable world.
Horizontal initiative (initiative horizontale)
An initiative where two or more federal departments are given funding to pursue a shared outcome, often linked to a government priority.
Indigenous business (entreprise autochtones)
For the purpose of the Directive on the Management of Procurement Appendix E: Mandatory Procedures for Contracts Awarded to Indigenous Businesses and the Government of Canada’s commitment that a mandatory minimum target of 5% of the total value of contracts is awarded to Indigenous businesses, a department that meets the definition and requirements as defined by the Indigenous Business Directory.
Non budgetary expenditures (dépenses non budgétaires)
Non-budgetary authorities that comprise assets and liabilities transactions for loans, investments and advances, or specified purpose accounts, that have been established under specific statutes or under non-statutory authorities in the Estimates and elsewhere. Non-budgetary transactions are those expenditures and receipts related to the government's financial claims on, and obligations to, outside parties. These consist of transactions in loans, investments and advances; in cash and accounts receivable; in public money received or collected for specified purposes; and in all other assets and liabilities. Other assets and liabilities, not specifically defined in G to P authority codes are to be recorded to an R authority code, which is the residual authority code for all other assets and liabilities.
Performance (rendement)
What a department did with its resources to achieve its results, how well those results compare to what the department intended to achieve, and how well lessons learned have been identified.
Performance indicator (indicateur de rendement)
A qualitative or quantitative means of measuring an output or outcome, with the intention of gauging the performance of an department, program, policy or initiative respecting expected results.
Plan (plan)
The articulation of strategic choices, which provides information on how a department intends to achieve its priorities and associated results. Generally, a plan will explain the logic behind the strategies chosen and tend to focus on actions that lead to the expected result.
Planned spending (dépenses prévues)
For Departmental Plans and Departmental Results Reports, planned spending refers to those amounts presented in Main Estimates.
A department is expected to be aware of the authorities that it has sought and received. The determination of planned spending is a departmental responsibility, and departments must be able to defend the expenditure and accrual numbers presented in their Departmental Plans and Departmental Results Reports.
Program (programme)
Individual or groups of services, activities or combinations thereof that are managed together within the department and focus on a specific set of outputs, outcomes or service levels.
Program inventory (répertoire des programmes)
Identifies all the department’s programs and describes how resources are organized to contribute to the department’s core responsibilities and results.
Result (résultat)
A consequence attributed, in part, to a department, policy, program or initiative. Results are not within the control of a single department, policy, program or initiative; instead they are within the area of the department’s influence.
Statutory expenditures (dépenses législatives)
Expenditures that Parliament has approved through legislation other than appropriation acts. The legislation sets out the purpose of the expenditures and the terms and conditions under which they may be made.
Target (cible)
A measurable performance or success level that a department, program or initiative plans to achieve within a specified time period. Targets can be either quantitative or qualitative.
Voted expenditures (dépenses votées)
Expenditures that Parliament approves annually through an appropriation act. The vote wording becomes the governing conditions under which these expenditures may be made.