
2016 Employment Equity Data Report
On this page
- Executive summary
- 1. Introduction
- 2. Data highlights and analysis
- 3. Technical notes
- 4. Data considerations
- 5. Questions and answers
- Appendix A: Recent trends in workplace practices
- Appendix B: Incompletely enumerated Indian Reserves and Indian Settlements in the 2016 population
- Appendix C: Employment Equity Occupational Groups and their corresponding unit groups (2016 NOC)
- Appendix D: Employment Equity Occupational group definitions
- Appendix E: Census Metropolitan Areas (CMAs) and their Census Subdivision Components
- Appendix F: Data variables
- Appendix G: References
Alternate formats

2016 Employment Equity Data Report [PDF – 2.08 MB]
Large print, braille, MP3 (audio), e-text and DAISY formats are available on demand by ordering online or calling 1 800 O-Canada (1-800-622-6232). If you use a teletypewriter (TTY), call 1-800-926-9105.
Executive summary
The Employment Equity Act (the Act) requires the Minister of Labour to give employers who report under the Legislated Employment Equity Program or the Federal Contractors Program the information they need to meet the Act’s requirements. In January 2019, the Labour Program released the labour market availability benchmarks for measuring firm equity performance in the Workplace Equity Information Management System (WEIMS). These benchmarks were derived from the 2016 Census and 2017 Canadian Survey on Disability.
This 2016 Employment Equity Data Report (EEDR) informs employers on the changes in the employment equity environment, traces the main trends in the new availability data and details other data and research relevant to employment equity for groups that the Act designates: women, Aboriginal peoples, members of visible minorities and persons with disabilities.
| Census cycle | 1996 | 2001 | 2006 | 2011 | 2016 |
|---|---|---|---|---|---|
| Women | 46.4 | 47.3 | 47.9 | 48.2 | 48.2 |
| Aboriginal peoples | 2.1 | 2.6 | 3.1 | 3.5 | 4.0 |
| Members of visible minorities | 10.3 | 12.6 | 15.3 | 17.8 | 21.3 |
| Persons with disabilities | n/a | 5.3 | 4.9 | 4.9 | 9.1 |
Women’s availability
Women’s availability was unchanged at 48.2% from 2011 to 2016. Their strong increase in business-related educational attainment suggests that higher availability should emerge in managerial occupations.
Aboriginal peoples’ availability
- Availability of Aboriginal peoples has been growing rapidly - from 3.1% in 2006 to 4.0% in 2016. Their workforce is younger than the non-Aboriginal workforce.
- While Ontario had the largest Aboriginal population, workers tend to be concentrated in Western Canada and the Territories, where they form a large share of the workforce.
- Aboriginal workforce growth will be above average for the conceivable future and successful outreach programs could have long-term payoffs for employers.Footnote 1
Members of visible minorities’ availability
- The visible minority workforce grew rapidly from 2011 to 2016. Their availability rose from 17.8% to 21.3%.
- A higher birth rate and continued flows of immigrants will push their availability higher beyond the 2021 Census.
- Availability for members of visible minorities varies less across employment equity occupational groups than in the past. It is lower than average in management and trades-related occupations and higher than average in sales- and services-related occupations.
Persons with disabilities availability
- The availability of persons with disabilities rose to 9.1% at the national level in the 2016 Census cycle versus 4.9% in the 2011 Census cycle.
- Population ageing and changes to questions in the Canadian Survey on Disability accounted for most of the increase.
- All Employment Equity Occupational Groups (EEOGs) except the managerial-related groups had notable increases in their availability of persons with disabilities. The largest increase was among supervisory employees.
1. Introduction
The economic and social environment for employment equity in Canada shifted since the publication of the last Employment Equity Data Report in 2013. Research overwhelmingly identified diversity as a key generator of income for all Canadians. Labour markets tightened significantly, which made finding candidates more difficult.
The 2016 EEDR begins with a description of the trends affecting employment equity, followed by sections on each of the 4 designated groups. Appendix A contains sections on 2 of the important trends in employment equity: the large body of literature on the value of diversity and on teleworking to bridge geographical gaps between employers and workers.
1.1 The employment equity environment
The sustained annual retirement of some 400,000 Canadian workers from the post-war “baby boom” generation brought the national unemployment rate to a decades-old low of 5.8% in mid-2018 (versus 7.2% at the same point in the 2011 Census cycle). At the same time, fewer workers are entering the labour markets than in the past. It is anticipated that this combination will keep labour markets tight through the 2016 to 2021 census cycle.Footnote 2
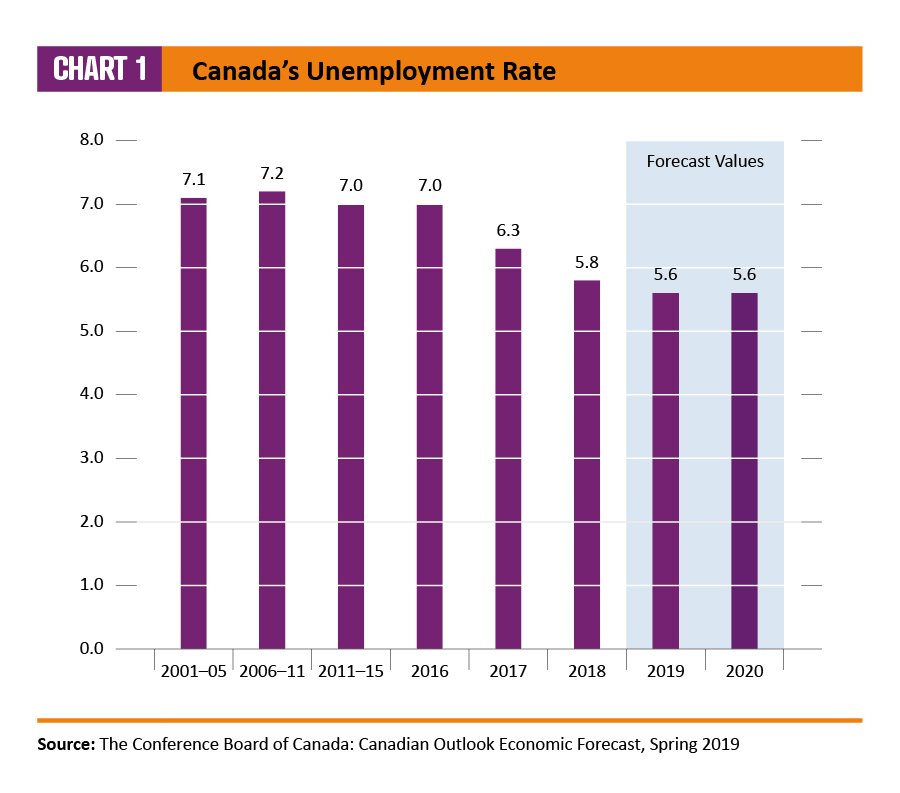
Chart 1: Canada's unemployment rate – Text version
| Year | Rate |
|---|---|
| 2001-05 | 7.1 |
| 2006-11 | 7.2 |
| 2011-15 | 7.0 |
| 2016 | 7.0 |
| 2017 | 6.3 |
| 2018 | 5.8 |
| 2019 | 5.6 |
| 2020 | 5.6 |
Source: The Conference Board of Canada: Canadian Outlook Economic Forecast, Spring 2019
The low unemployment ratesFootnote 3 reflected a widespread and growing shortage of workers at all skill levels. Nearly half of the Canadian Federation for Independent Business members found that labour market shortages were one of their largest production problems in 2017 and 2018. Private and public employment agencies dealt with widespread shortages at most skill levels across the country.
These conditions forced North American employers to recruit in new ways. Many reduced their job requirements to find new hires from other similarly skilled occupations.Footnote 4 Large firms with well-defined career ladders and strong support for learning partnered with educational facilities to attract new recruits and develop the skills needed for success in those firms.
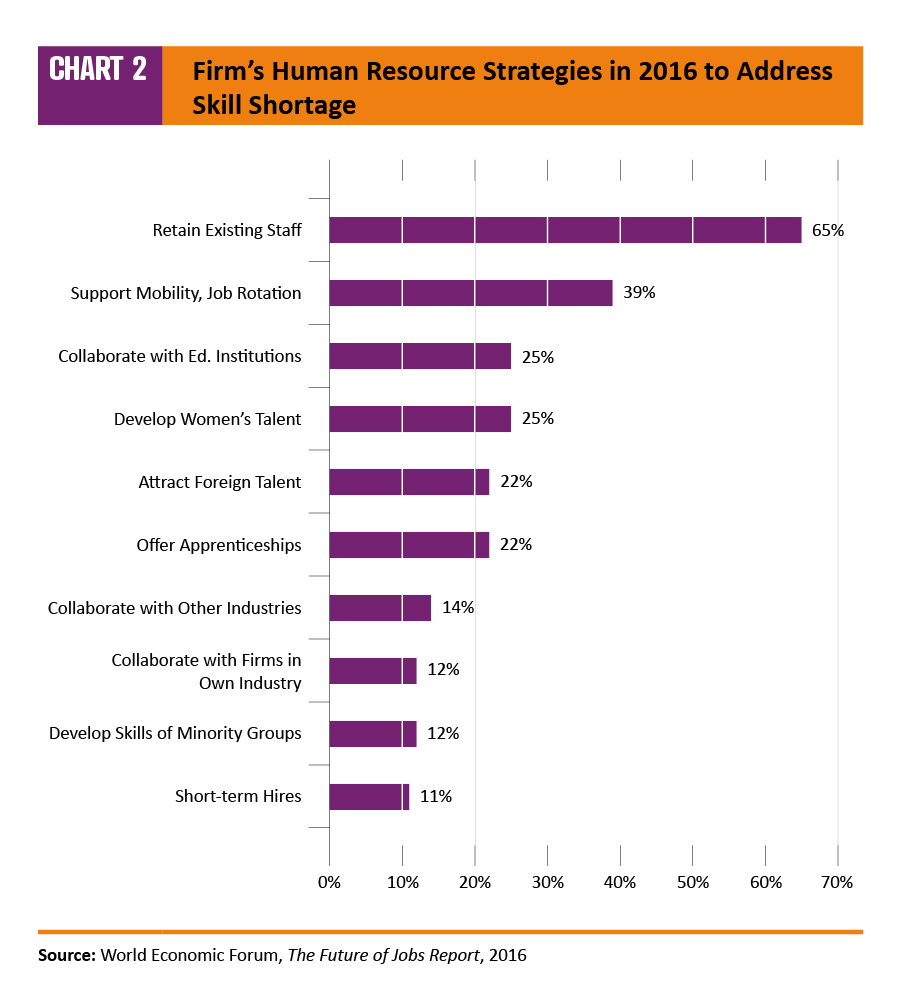
Chart 2: Firms' human resource strategies in 2016 to address skill shortages – Text version
| Strategies | Percent |
|---|---|
| Short-term hires | 11% |
| Develop skills of minority groups | 12% |
| Collaborate with firms in own industry | 12% |
| Collaborate with other industries | 14% |
| Offer apprenticeships | 22% |
| Attract foreign talent | 22% |
| Develop women's talent | 25% |
| Collaborate with education institutions | 25% |
| Support mobility, job rotation | 39% |
| Retain existing staff | 65% |
Source: World Economic Forum, The Future of Jobs Report, 2016
1.2 Changes in workplace practices
Data and research demonstrate how workplace practices also changed to accommodate workers. For the flexibility that many workers needed, more employers implemented teleworking for workers with mobility issues, in remote locations or having family care duties.Footnote 5 By mid-2018, there were nearly as many people teleworking in the United States as there were unemployed. (See Appendix G for further readings.)
1.3 The value of diversity
The Employment Equity Act specifies that employers should hire or promote only employees who meet the essential qualifications for the work to be performed, and that employment equity plans should address systematically unfair treatment of designated groups. Research almost universally shows that diversity in employment results in stronger and more productive work places. International studies now include diversity measures in their set of economic indicators, for example, the World Economic Forum ranks Canada as the best in the world for its treatment of women and of the LGBT+ community. (See Appendix G for further readings.)
2. Data highlights and analysis
International agencies, such as the Organisation for Economic Co-operation and Development (OECD)Footnote 6 and the International Monetary Fund (IMF)Footnote 7 released studies showing that labour market tightness would persist throughout the 2016-2021 period. As a result, Canada’s economic growth could hinge on policies to increase labour market presence of women, Aboriginal peoples, members of visible minoritiesFootnote 8 and persons with disabilities.
2.1 Women
In 2011, the OECD began its Gender Initiative to focus on women’s issues and develop proposals for improving equality for women in the workplace. Since then, the program’s analysis and outreach has encouraged government and private-sector organizations from around the world to advance equality for women.Footnote 9 Since 2013, roughly two-thirds of the OECD’s 35 member countries have instituted new measures to promote equity for women.Footnote 10
Canada renewed its commitment to workplace equity for women in two ways since the release of the 2011 Employment Equity Data Report. First, the Canada-United States Council for Advancement of Women and Business Leaders released a series of publications on women’s place in the labour market. This work showed that only half of the firms in Canada’s private sector report data on women’s careers and even fewer of them use these data to set employment equity targets and to follow up.
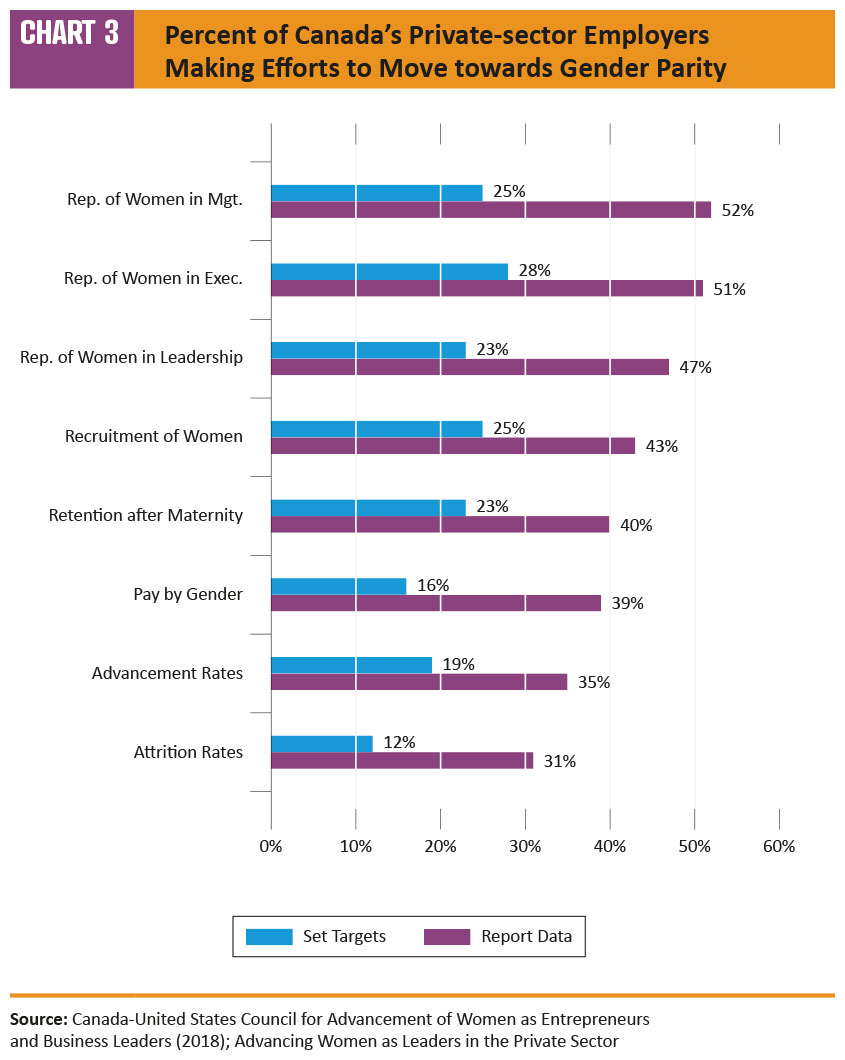
Chart 3: Percent of Canada's private-sector employers making efforts to move towards gender parity – Text version
| Efforts | Set targets | Report data |
|---|---|---|
| Attrition rates | 12% | 31% |
| Advancement rates | 19% | 35% |
| Pay by gender | 16% | 39% |
| Retention after maternity | 23% | 40% |
| Recruitment of women | 25% | 43% |
| Representation of women in leadership | 23% | 47% |
| Representation of women in executive | 28% | 51% |
| Representation of women in management | 25% | 52% |
Source: Canada-United States Council for Advancement of Women as Entrepreneurs and Business Leaders (2018); advancing women as Leaders in the private sector
Second, Budget 2018 announced a five-year commitment to introduce pay transparency for federally-regulated employers in the private sector, including the provision of accessible online information on comparative wage gaps across all four designated groups on the Government of Canada Website. The federal government will also support research for discussion among private or public-sector leaders on issues that women face in the workplace. This will help develop tools that employers can use to narrow the wage gaps of women in the workplace.
2.1.1 Developments in women’s availability
Women’s availability changed little from 2006 to 2016 – rising from 47.9% in 2006 to 48.2% in both 2011 and 2016. While their share of the workforce was unchanged, women had large gains in their ability to compete for jobs.
2.1.2 Educational Attainment
Education matters. Women around the world raised their educational attainment dramatically over the 1996 to 2016 period, but not as much as Canadian women. The number of Canadian women with a Bachelor’s degree rose 147% from 1996 to 2016. The number with more advanced degrees was up more than 200%. By 2017, nearly 70% of all Canadian women between the ages of 25-34 held post-secondary credentials (including university degrees and college/CEGEP graduates) – the highest share in the world.Footnote 11
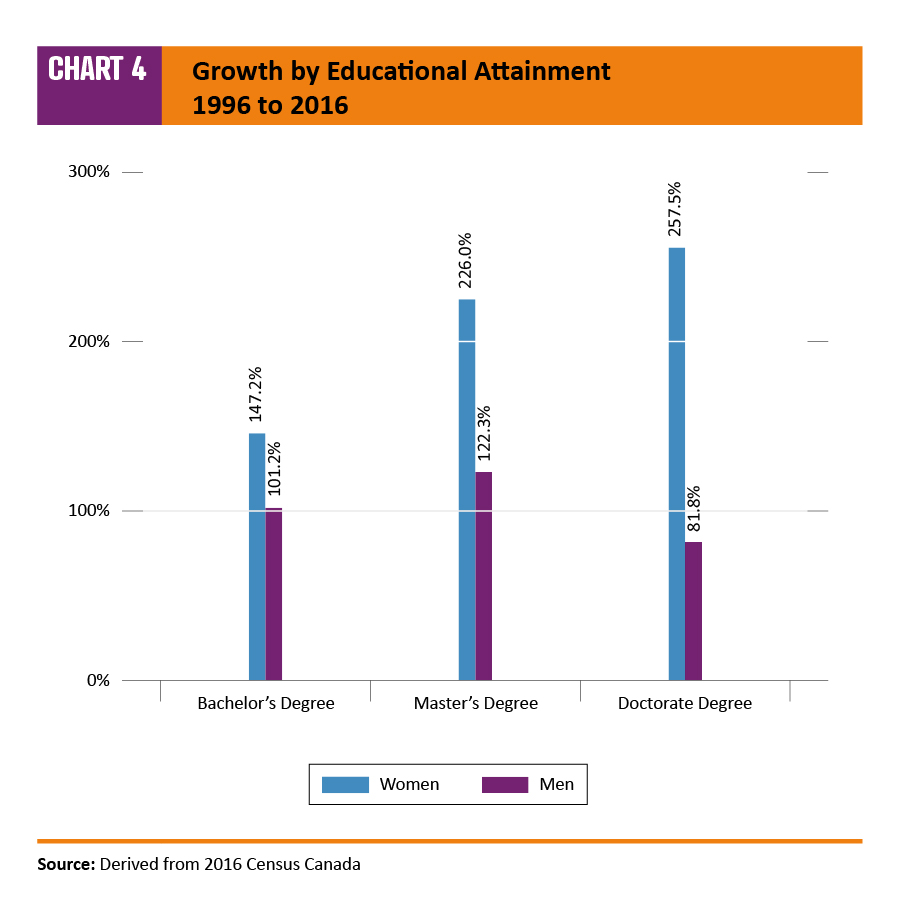
Chart 4: Growth by educational attainment (1996 to 2016) – Text version
| Degrees | Women | Men |
|---|---|---|
| Bachelor's degree | 147.2% | 101.2% |
| Master's degree | 226.0% | 122.3% |
| Doctorate degree | 257.5% | 81.8% |
Source: Derived from 2016 Census Canada
Women choose different fields of study than men. They accounted for more than half of all graduates, and 70% of the graduates in education and health-related studies in 2016. In mathematics, computer and information sciences (35%), personal, protective and transportation services (28%) architecture, engineering, and related technologies (20%), women accounted for many fewer graduates than men. Notably, the women’s share in business studies at the Bachelor’s level had increased to the point where more women than men were graduating in 2016. Women accounted for roughly half of all students taking business at the Master’s level.
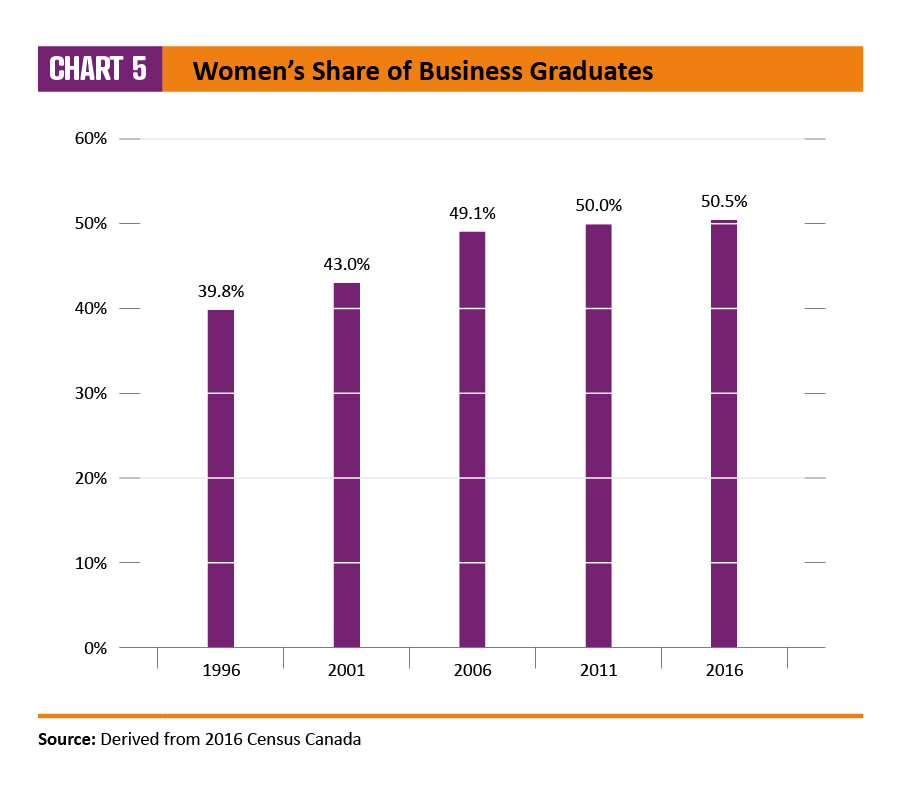
Chart 5: Women's share of business graduates – Text version
| Year | Percent |
|---|---|
| 1996 | 39.8% |
| 2001 | 43.0% |
| 2006 | 49.1% |
| 2011 | 50.0% |
| 2016 | 50.5% |
Source: Derived from 2016 Census Canada
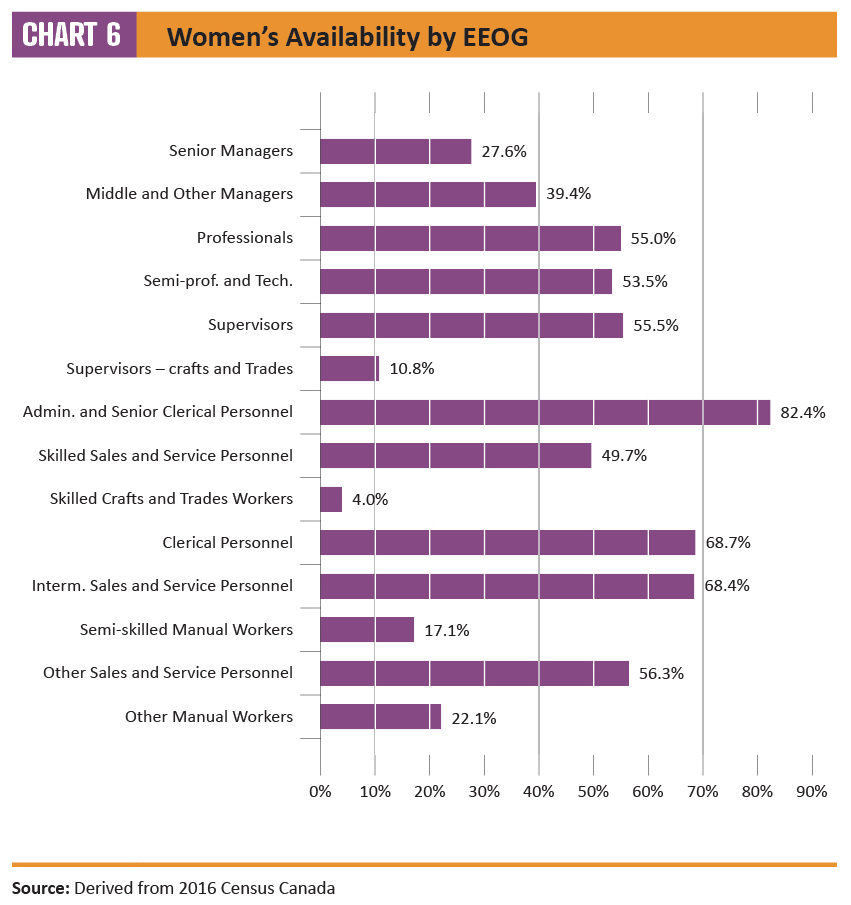
Chart 6: Women's availability by EEOG – Text version
| Occupational group | Women |
|---|---|
| Other manual workers | 22.1% |
| Other sales and service personnel | 56.3% |
| Semi-skilled manual workers | 17.1% |
| Intermediate sales and service personnel | 68.4% |
| Clerical personnel | 68.7% |
| Skilled crafts and trades workers | 4.0% |
| Skilled sales and service personnel | 49.7% |
| Administrative and senior clerical personnel | 82.4% |
| Supervisors - crafts and trades | 10.8% |
| Supervisors | 55.5% |
| Semi-professionals and technicians | 53.5% |
| Professionals | 55.0% |
| Middle and other managers | 39.4% |
| Senior managers | 27.6% |
Source: Derived from 2016 Census Canada
Despite these improved qualifications for the work, women had not had significant recent experience in Canada’s middle and upper management by 2016. Their availability averages 27.6% in senior management and 39.4% in middle management – both are occupational groups where new entrants are likely to come from post-graduate business schools.
In contrast, women form the majority in most of the remaining employment equity occupational groups (EEOGs). The exceptions were primarily male EEOGs related to the trades and manual labour.
Availability of women in the least-skilled manual labour occupations remains high – largely due to an inflow of women, particularly visible minority women, in response to the labour shortages in the Greater Toronto area and in Vancouver.
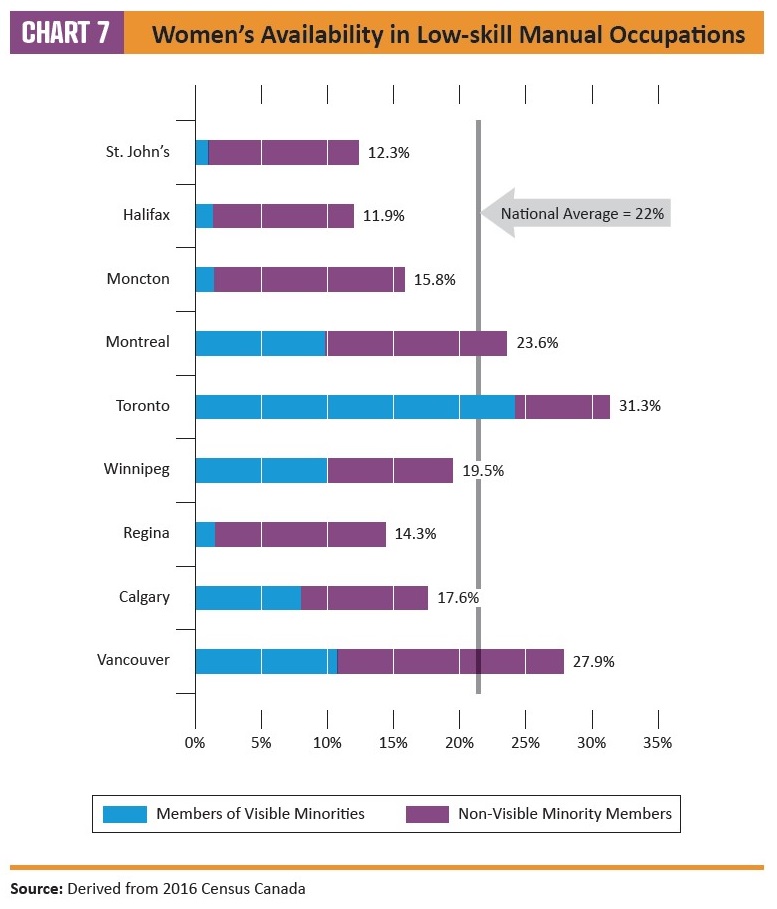
Chart 7: Women's availability in low-skill manual occupations – Text version
| City | Members of visible minorities | Non-visible minority members | Total |
|---|---|---|---|
| Vancouver | 19.7% | 8.2% | 27.9% |
| Calgary | 8.1% | 9.5% | 17.6% |
| Regina | 1.5% | 12.8% | 17.6% |
| Winnipeg | 10.0% | 9.4% | 14.3% |
| Toronto | 24.2% | 7.1% | 19.5% |
| Montreal | 9.9% | 13.7% | 31.3% |
| Moncton | 1.5% | 14.4% | 15.8% |
| Halifax | 1.3% | 10.6% | 12.0% |
| St. John's | 1.0% | 11.3% | 12.4% |
Source: Derived from 2016 Census Canada
2.2 Aboriginal peoples
Canada’s Aboriginal peoples fill a small but dynamic role in the national labour market. They form 4.0% of Canada’s workforce (about 800,000 workers), but their availability has been growing rapidly – from 3.1% in 2006 to 3.5% in 2011. Their distribution across Canada, their age and their educational profile provide other keys to recruit Aboriginal candidates.
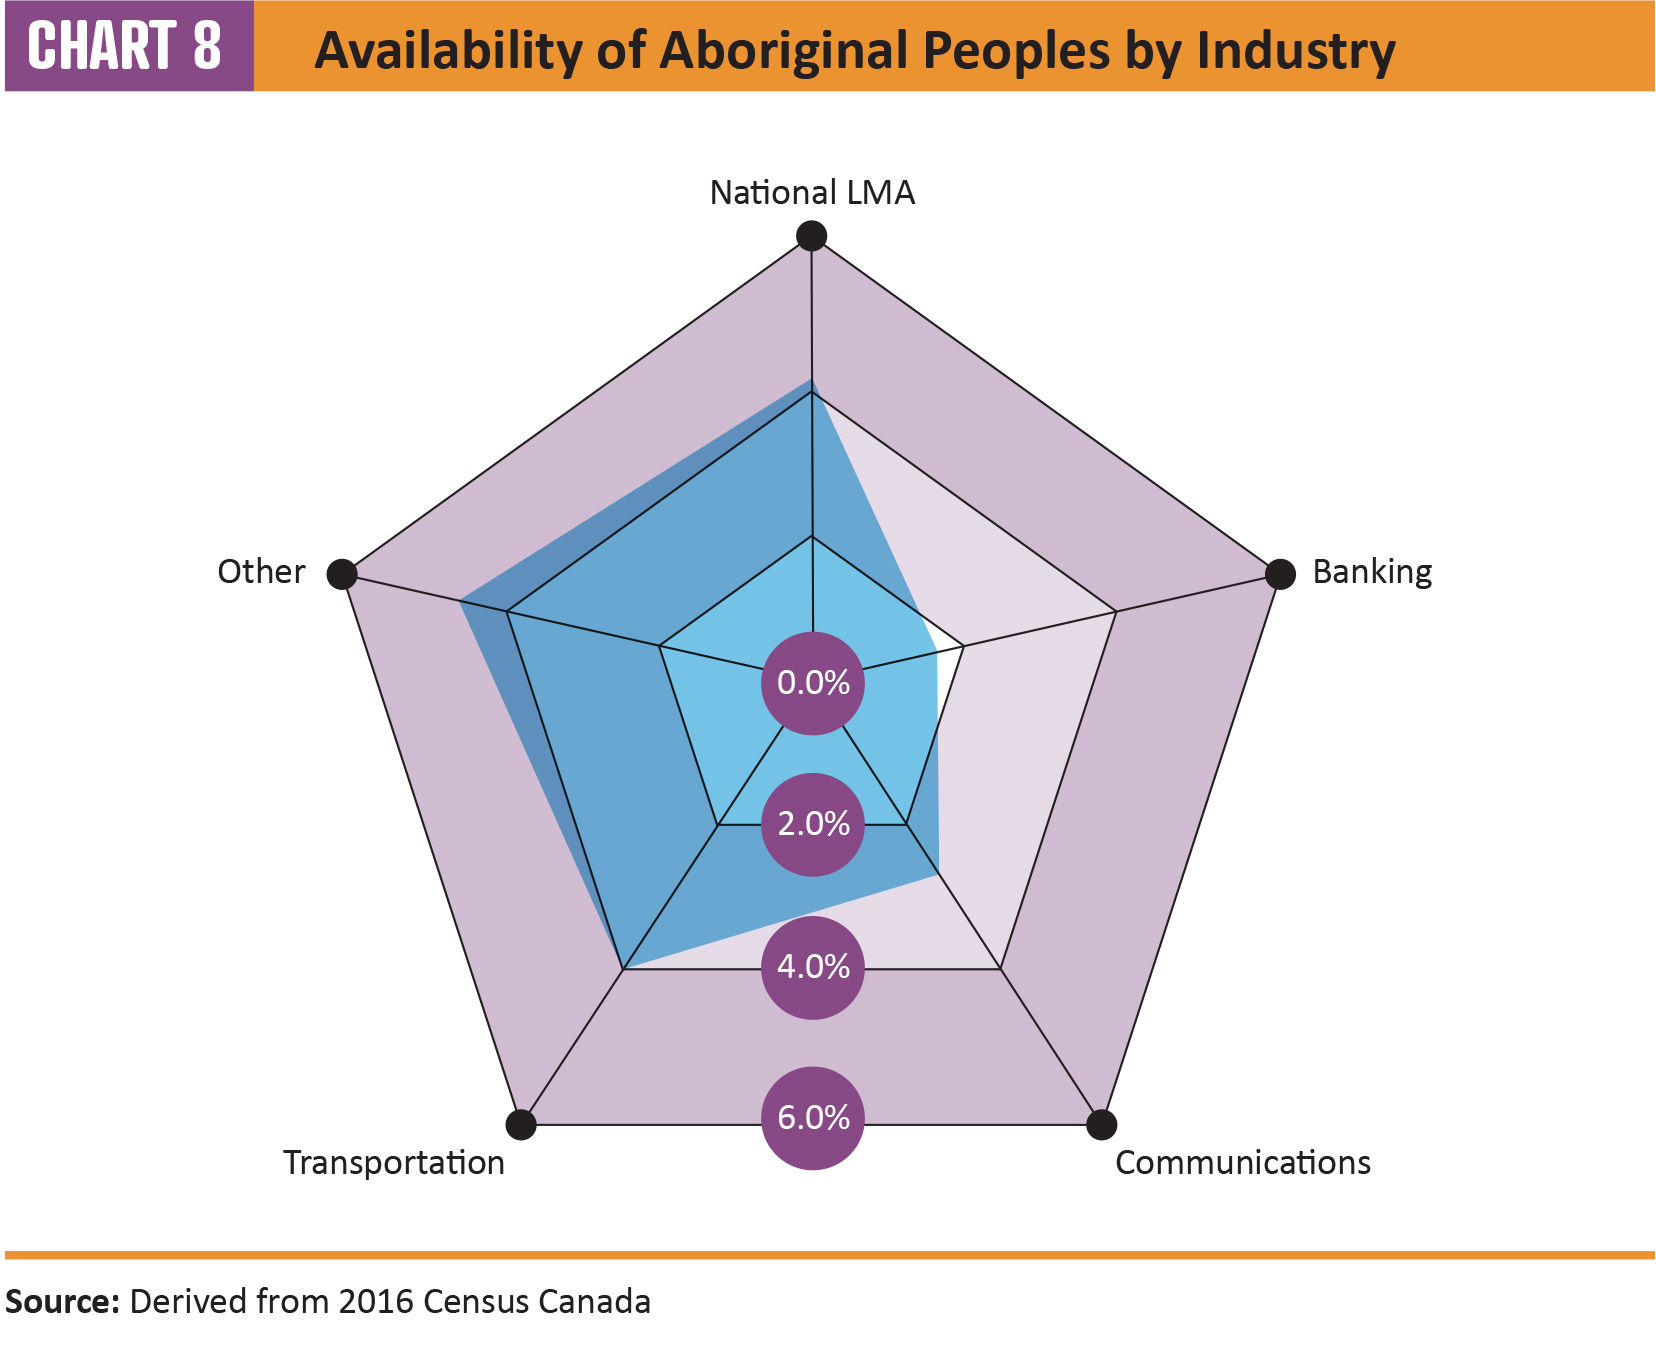
Chart 8: Availability of Aboriginal peoples by industry – Text version
| Industry | Percent |
|---|---|
| National LMA | 4.0% |
| Banking | 1.7% |
| Communications | 2.5% |
| Transportation | 3.9% |
| Other | 4.6% |
Source: Derived from 2016 Census Canada
Aboriginal peoples’ availability is below the 4.0% national average in banking and communications. It is about the average in transportation, and above the average in the other industries.
While Ontario had the most Aboriginal workers, their availability in Ontario is 2.8%. Their workforce is proportionally larger in western Canada and the territories. As a result, their availability is 13.2% in Manitoba, 11.1% in Saskatchewan and 20% or more throughout the territories.

Chart 9: National workforce shares – Text version
| Locations | Aboriginal peoples | Non-aboriginal peoples |
|---|---|---|
| Montreal | 2.4% | 12.0% |
| Toronto | 3.2% | 17.6% |
| Vancouver | 4.2% | 7.4% |
| Edmonton | 5.0% | 4.0% |
| Winnipeg | 5.5% | 2.1% |
| Other CMAs | 23.3% | 30.2% |
| Non CMA | 56.4% | 26.6% |
Source: Derived from 2016 Census Canada
More precisely, the majority (56.4%) of the Aboriginal workforce lived outside the major population centres (Census Metropolitan Areas or CMAs) – compared with 26.6% of other workers. Since the vast majority in either the CMAs or more rural areas have daily internet access, finding strategies for contacting and interviewing Aboriginal candidates was not a serious issue.
The Aboriginal workforce continued to be younger than other workers. While more than one in five non-Aboriginal workers is 55 or older, 43.3% of the Aboriginal workforce is younger than 35.
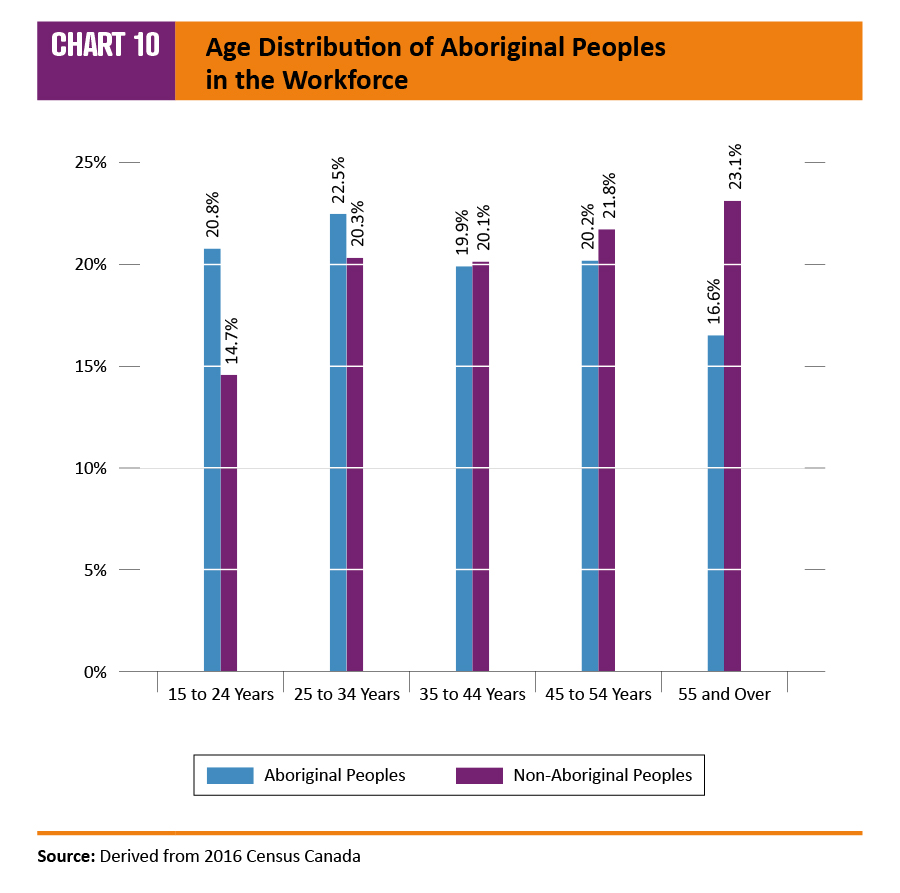
Chart 10: Age distribution of Aboriginal peoples in the workforce – Text version
| Age group | Aboriginal peoples | Non-Aboriginal peoples |
|---|---|---|
| 15 to 24 years | 20.8% | 14.7% |
| 25 to 34 years | 22.5% | 20.3% |
| 35 to 44 years | 19.9% | 20.1% |
| 45 to 54 years | 20.2% | 21.8% |
| 55 and over | 16.6% | 23.1% |
Source: Derived from 2016 Census Canada
The Aboriginal share of Canada’s children under 14 was 7.7% -- nearly twice their 4.0% labour market availability. More than one in four children was Aboriginal in the territories, Manitoba and Saskatchewan. This pattern shows that Aboriginal workforce growth will be above average in the future and that successful outreach programs could have long-term payoffs for employers.Footnote 12
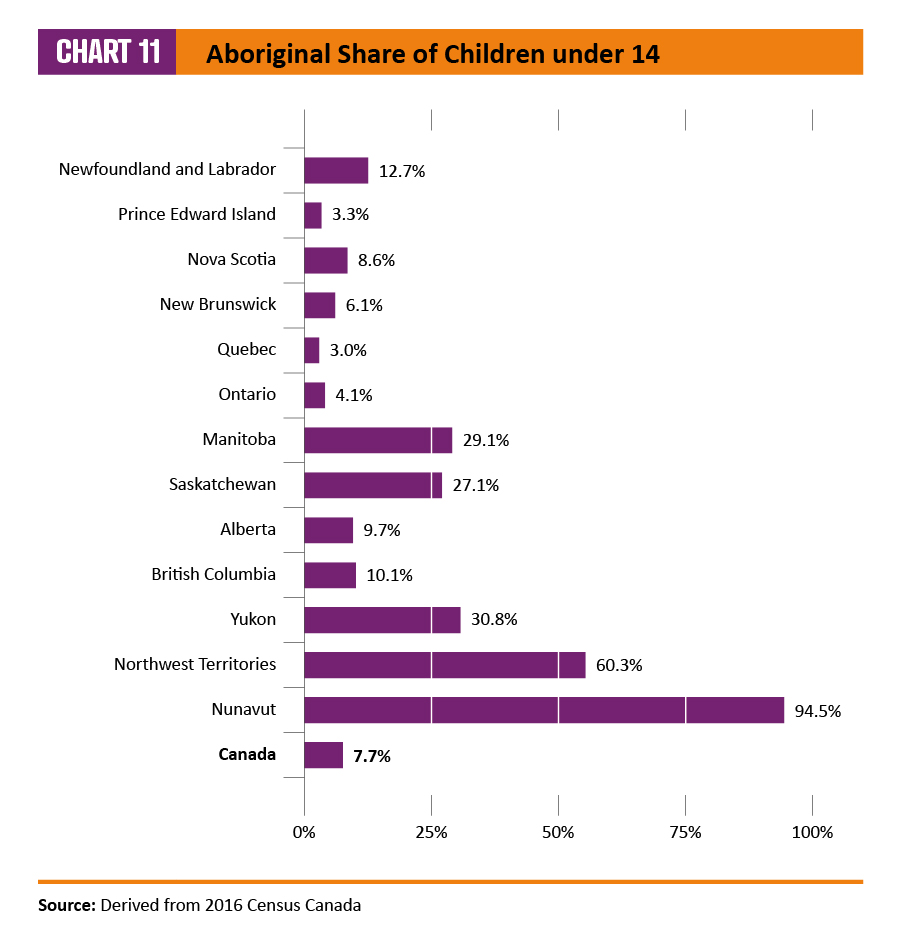
Chart 11: Aboriginal share of children under 14 – Text version
| Province and territories | Percent |
|---|---|
| Canada | 7.7% |
| Nunavut | 94.5% |
| Northwest Territories | 60.3% |
| Yukon | 30.8% |
| British Columbia | 10.1% |
| Alberta | 9.7% |
| Saskatchewan | 27.1% |
| Manitoba | 29.1% |
| Ontario | 4.1% |
| Quebec | 3.0% |
| New Brunswick | 6.1% |
| Nova Scotia | 8.6% |
| Prince Edward Island | 3.3% |
| Newfoundland and Labrador | 12.7% |
Source: Derived from 2016 Census Canada
The Aboriginal workforce has less educational attainment than the national average. Nearly a quarter of them (22.3%) have less than high school graduation, which is twice that of others (10.9%). In addition, proportionally more Aboriginal workers hold high school graduation or an apprenticeship. In contrast, nearly one-third of all other workers hold university degrees – versus 14.0% among the Aboriginal workforce.
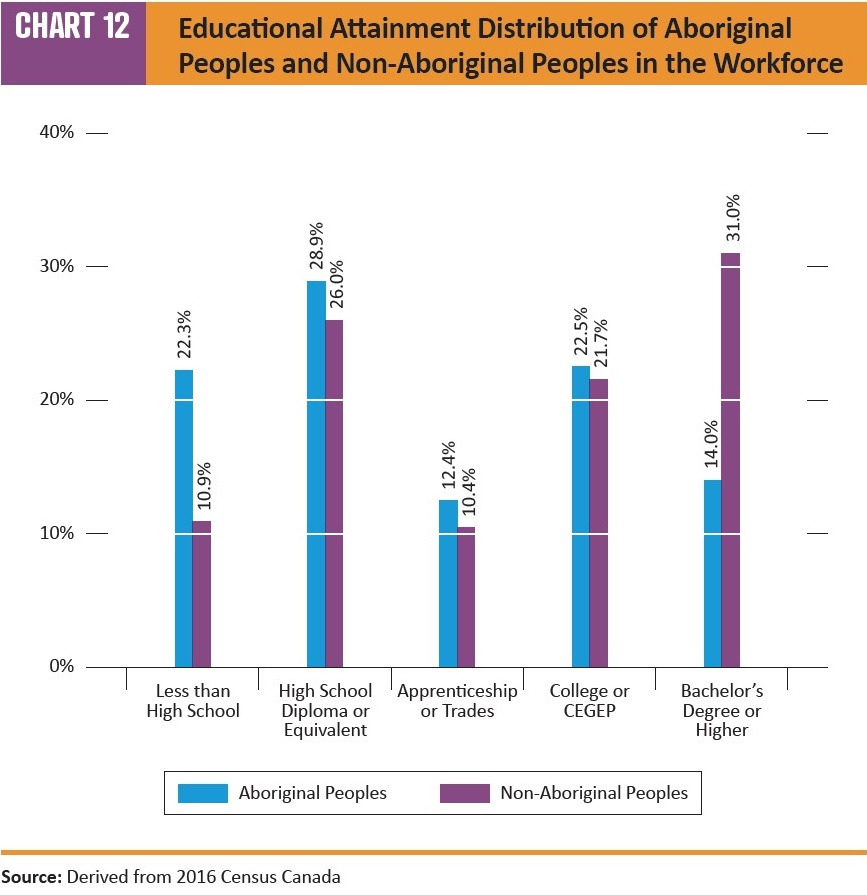
Chart 12: Educational attainment distribution of Aboriginal peoples and non-Aboriginal peoples in the workforce – Text version
| Level of educational attainment | Aboriginal peoples | Non-Aboriginal peoples |
|---|---|---|
| Less than high school | 22.3% | 10.9% |
| High school diploma or equivalent | 28.9% | 26.0% |
| Apprenticeship or trades | 12.4% | 10.4% |
| College or CEGEP | 22.5% | 21.7% |
| Bachelor's degree or higher | 14.0% | 31.0% |
Source: Derived from 2016 Census Canada
Evidence suggests that this gap in educational attainment deters full participation by Aboriginal peoples in the Canadian labour market, but that the gap can be closed. First, the Census shows that Aboriginal peoples educational attainment was more like that of others in the more-rural places where they live. Second, the General Social Survey of 2016 reveals that the proportion of Aboriginal workers who believe they need more education or training to perform their duties is similar to the Canadian average. Importantly, the share of Aboriginal workers who believe they are equipped to take on more responsibility in their organizations is higher than among other workers. The Metis Nation Skills and Employment Training Accord, signed in mid-2018, will help close the credentials gap for the nearly one-third of Aboriginal peoples who are Metis.
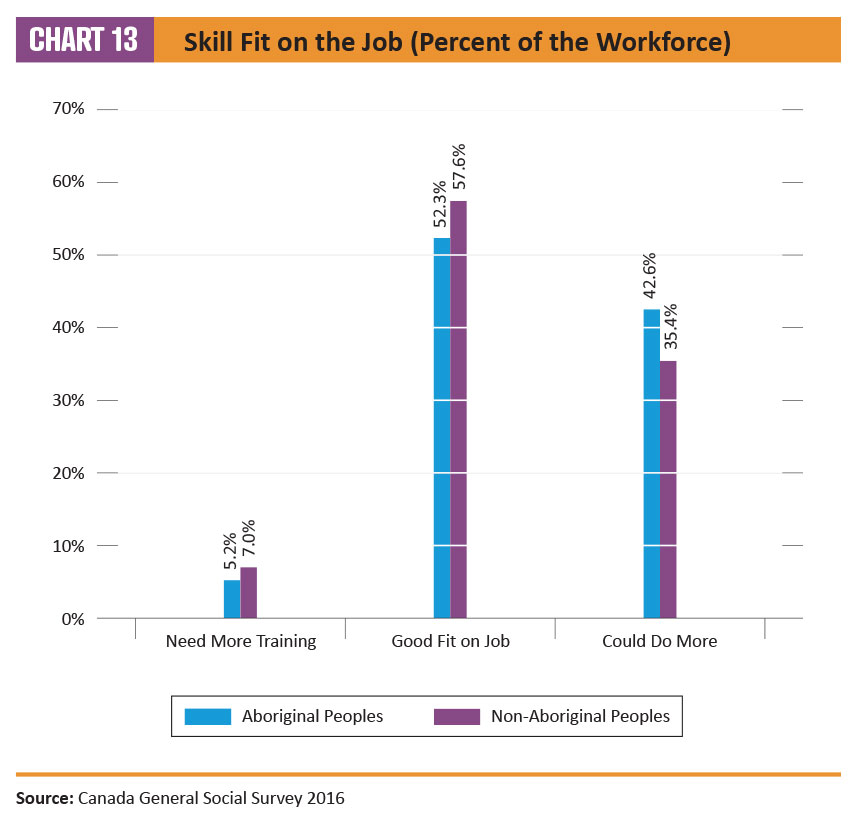
Chart 13: Skill fit on the job (percent of the workforce) – Text version
| Skills for job | Aboriginal peoples | Non-aboriginal peoples |
|---|---|---|
| Need More Training | 5.2% | 7.0% |
| Good Fit on Job | 52.3% | 57.6% |
| Could Do More | 42.6% | 35.4% |
Source: Derived from 2016 Census Canada
Consistent with the rapid rise in the number of Aboriginal workers, the availability of Aboriginal peoples rose for all 14 Employment Equity Occupational Groups (EEOGs) between 2011 and 2016. The present availability is well above the national average in lower-skill occupations, such as the trades, intermediate sales and services, semi-skilled manual workers, other sales and services and other manual workers. Given the growth trends in the Aboriginal population, the availability in these EEOGs likely will climb rapidly in the next Census cycle.
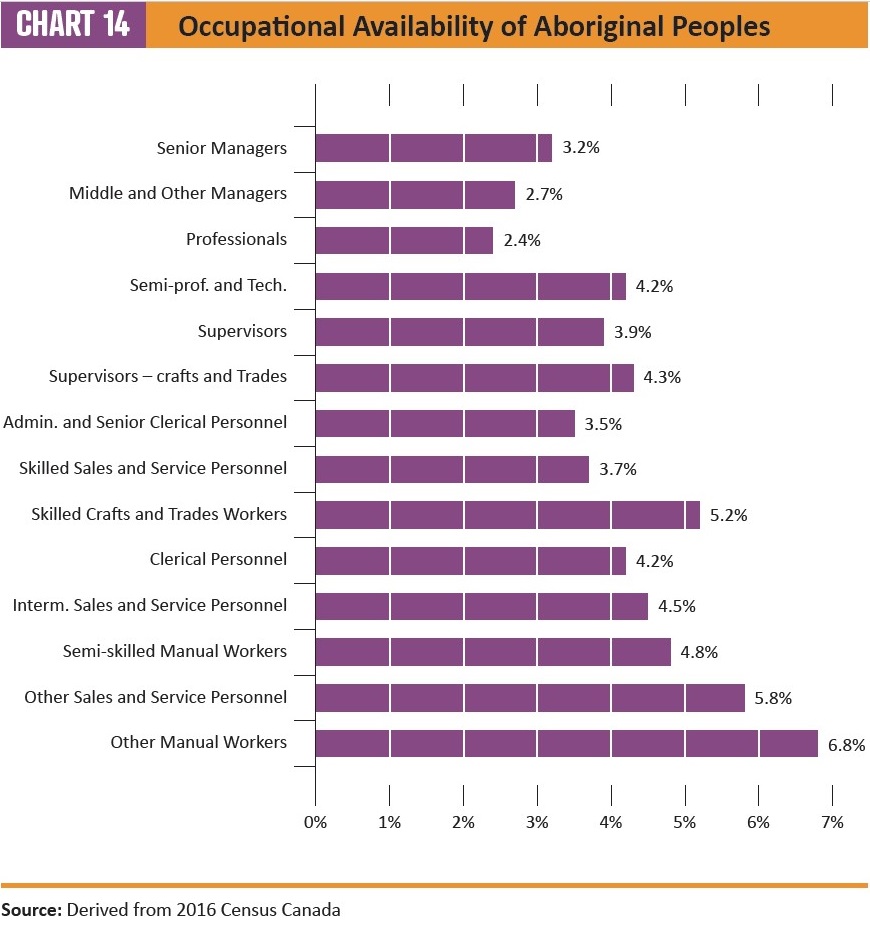
Chart 14: Occupational availability of Aboriginal peoples – Text version
| Occupational group | Percent |
|---|---|
| Other manual workers | 6.8 |
| Other sales and service personnel | 5.8 |
| Semi-skilled manual workers | 4.8 |
| Intermediate sales and service personnel | 4.5 |
| Clerical personnel | 4.2 |
| Skilled crafts and trades workers | 5.2 |
| Skilled sales and service personnel | 3.7 |
| Administrative and senior clerical personnel | 3.5 |
| Supervisors – crafts and trades | 4.3 |
| Supervisors | 3.9 |
| Semi-professionals and technicians | 4.2 |
| Professionals | 2.4 |
| Middle and other managers | 2.7 |
| Senior managers | 3.2 |
Source: Derived from 2016 Census Canada
| Percent | Montreal | Toronto | Vancouver | Edmonton | Winnipeg | Other CMAs | Non CMA |
|---|---|---|---|---|---|---|---|
| Availability | 0.8 | 0.8 | 2.3 | 5.0 | 9.8 | 3.2 | 8.2 |
| Total Aboriginal workforce share | 2.4 | 3.2 | 4.2 | 5.0 | 5.5 | 23.3 | 56.4 |
2.3 Members of visible minorities
The members of the visible minorities workforce grew rapidly from 2011 to 2016, and evidence suggests that the gains will continue to the 2021 Census. Their availability rose to 21.3% in 2016, up from 17.8% in 2011.
The increase occurred across the country, but it was most apparent in Toronto (where members of visible minorities form nearly half of the workforce), and to a lesser extent in Montreal and Vancouver. Excluding Toronto, their national availability started from a much-lower level and reached 16% in 2016.
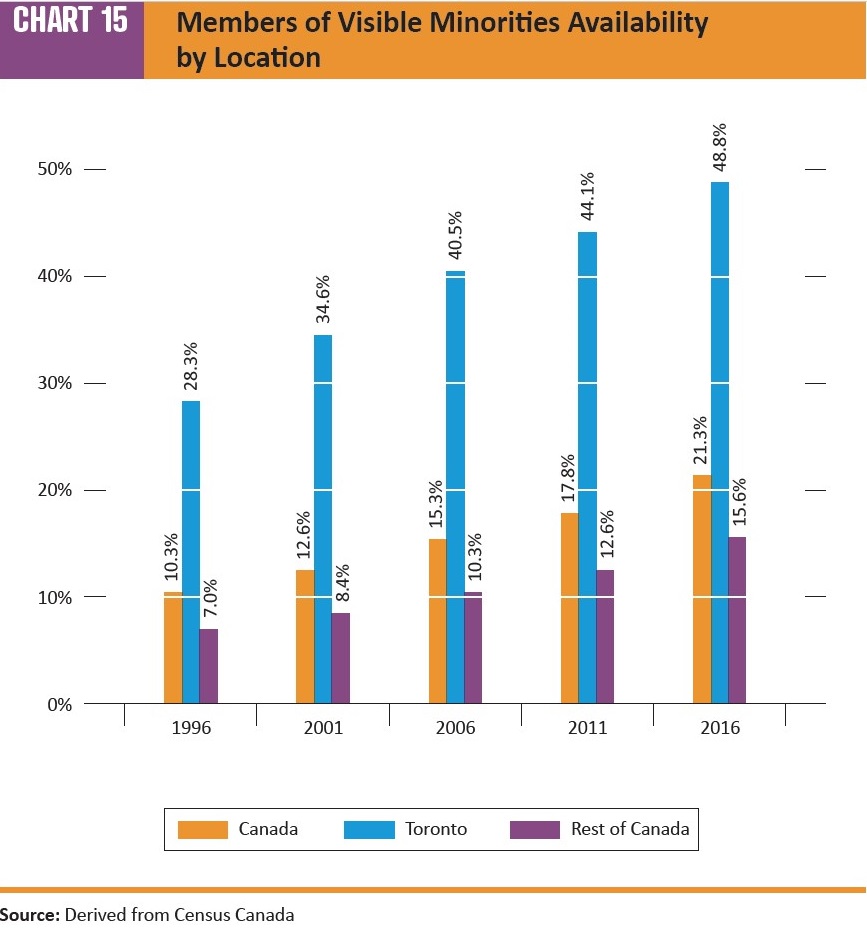
Chart 15: Member of visible minorities availability by location – Text version
| Location | 1996 | 2001 | 2006 | 2011 | 2016 |
|---|---|---|---|---|---|
| Canada | 10.3% | 12.6% | 15.3% | 17.8% | 21.3% |
| Toronto | 28.3% | 34.6% | 40.5% | 44.1% | 48.8% |
| Rest of Canada | 7.0% | 8.4% | 10.3% | 12.6% | 15.6% |
Source: Derived from 2016 Census Canada
Canada has relied on immigrants – the majority of whom arrive for work in Canada – to replace retiring “baby boomers” and maintain economic growth. Since 2001, Canada’s immigrants came more often from non-white Asia and Africa and so were more likely to self-identify as members of a visible minority. Notably, the annual number of immigrants to enter Canada, including refugees, is not much above the level of the early 1990s.
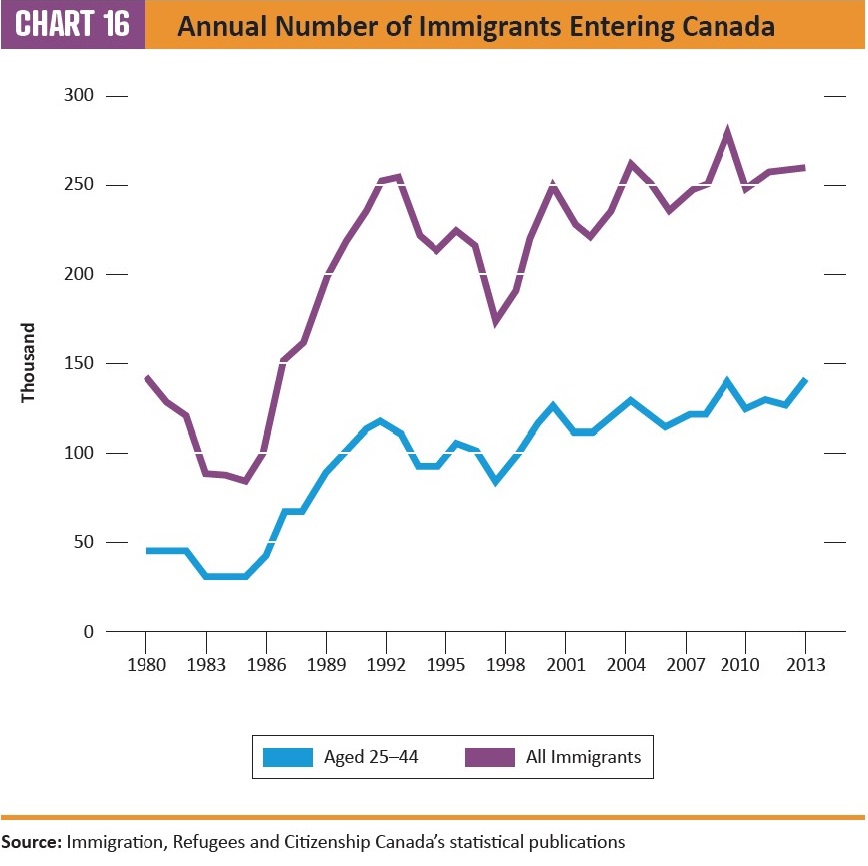
Chart 16: Annual number of immigrants entering Canada – Text version
| Year | Aged 25 to 44 | All immigrants |
|---|---|---|
| 1980 | 46,222 | 143,117 |
| 1981 | 46,305 | 128,618 |
| 1982 | 46,017 | 121,147 |
| 1983 | 30,374 | 89,157 |
| 1984 | 31,704 | 88,239 |
| 1985 | 31,497 | 84,302 |
| 1986 | 40,373 | 99,219 |
| 1987 | 66,370 | 152,098 |
| 1988 | 67,617 | 161,929 |
| 1989 | 85,998 | 192,001 |
| 1990 | 99,294 | 214,230 |
| 1991 | 110,160 | 230,781 |
| 1992 | 118,096 | 252,842 |
| 1993 | 112,044 | 255,819 |
| 1994 | 93,271 | 223,875 |
| 1995 | 93,609 | 212,504 |
| 1996 | 105,010 | 226,071 |
| 1997 | 102,542 | 216,036 |
| 1998 | 84,826 | 174,195 |
| 1999 | 96,229 | 189,950 |
| 2000 | 115,004 | 227,455 |
| 2001 | 126,136 | 250,636 |
| 2002 | 113,450 | 229,049 |
| 2003 | 110,567 | 221,349 |
| 2004 | 119,746 | 235,822 |
| 2005 | 131,226 | 262,242 |
| 2006 | 120,453 | 251,640 |
| 2007 | 114,699 | 236,753 |
| 2008 | 120,802 | 247,244 |
| 2009 | 124,048 | 252,170 |
| 2010 | 141,145 | 280,687 |
| 2011 | 125,505 | 248,747 |
| 2012 | 129,840 | 257,903 |
| 2013 | 127,024 | 259,023 |
| 2014 | 140,946 | 260,404 |
Source: Immigration, Refugees and Citizenship Canada’s statistical publications
Immigrants tend to be younger than the population or the workforce in their destination countries. It follows that Canada’s visible minority workforce is younger on average than the non-visible minority workers. More than 63% of the members of the visible minorities workforce is younger than 45, while the share among other Canadians is around half.
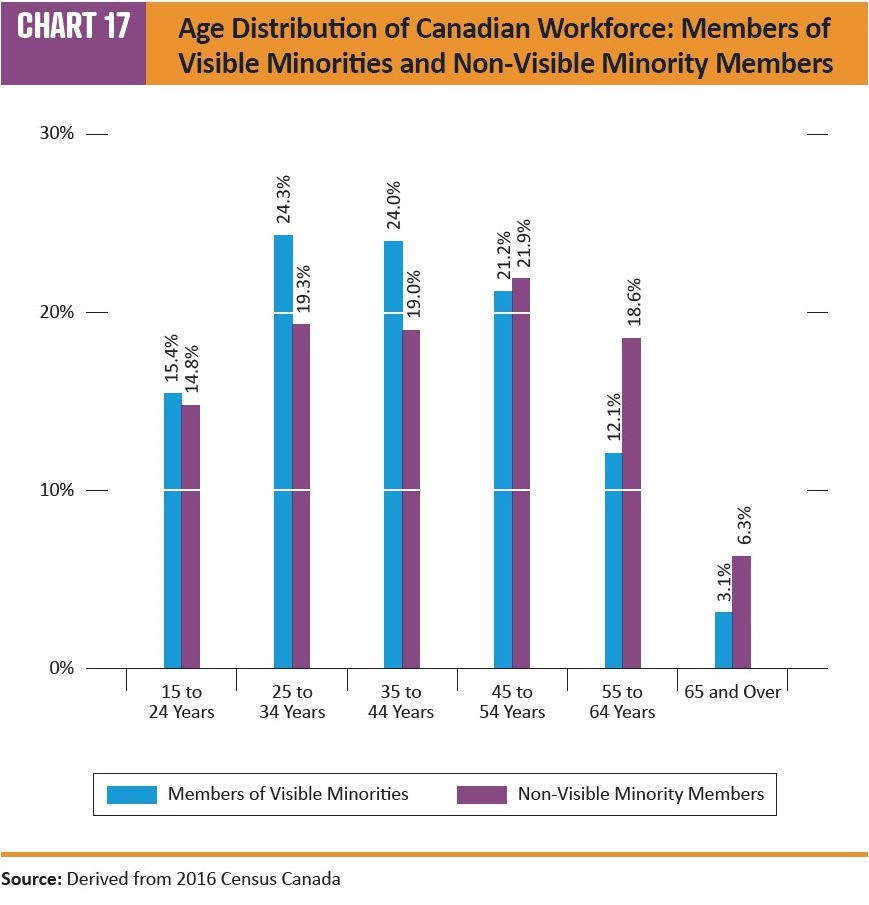
Chart 17: Age distribution of Canadian workforce: members of visible minorities and non-visible minority members – Text version
| Age group | Members of visible minorities | Non-visible minority members |
|---|---|---|
| 15 to 24 years | 15.4% | 14.8% |
| 25 to 34 years | 24.3% | 19.3% |
| 35 to 44 years | 24.0% | 19.0% |
| 45 to 54 years | 21.2% | 21.9% |
| 55 to 64 years | 12.1% | 18.6% |
| 65 and over | 3.1% | 6.3% |
Source: Derived from 2016 Census Canada
Members of visible minorities are more likely to have children, and roughly one-third of Canada’s visible minority workforce was born in Canada. It follows that they have few barriers to employment, such as knowledge of the official languages or difficulty having their educational and other credentials recognized. In addition, the combination of a higher birth rate and continued flows of immigrants will push members of visible minority availability higher beyond the 2021 Census.
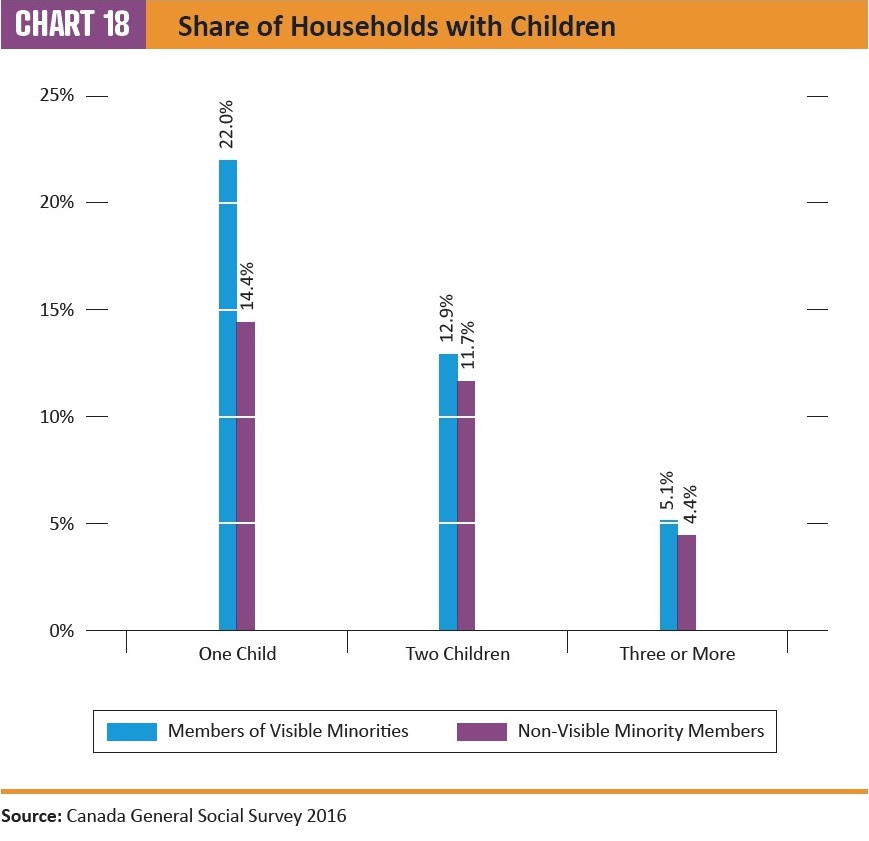
Chart 18: Share of households with children – Text version
| Number of children | Members of visible minorities | Non-Visible Minority Members |
|---|---|---|
| One Child | 22.0% | 14.4% |
| Two Children | 12.9% | 11.7% |
| Three or More | 5.1% | 4.4% |
Source: Canada General Social Survey 2016
Because immigrant suitability is partly judged on educational attainment and because the children of immigrants obtain more university credentials than other Canadians, proportionally more members of visible minorities have university degrees (44%) than other workers (27%).
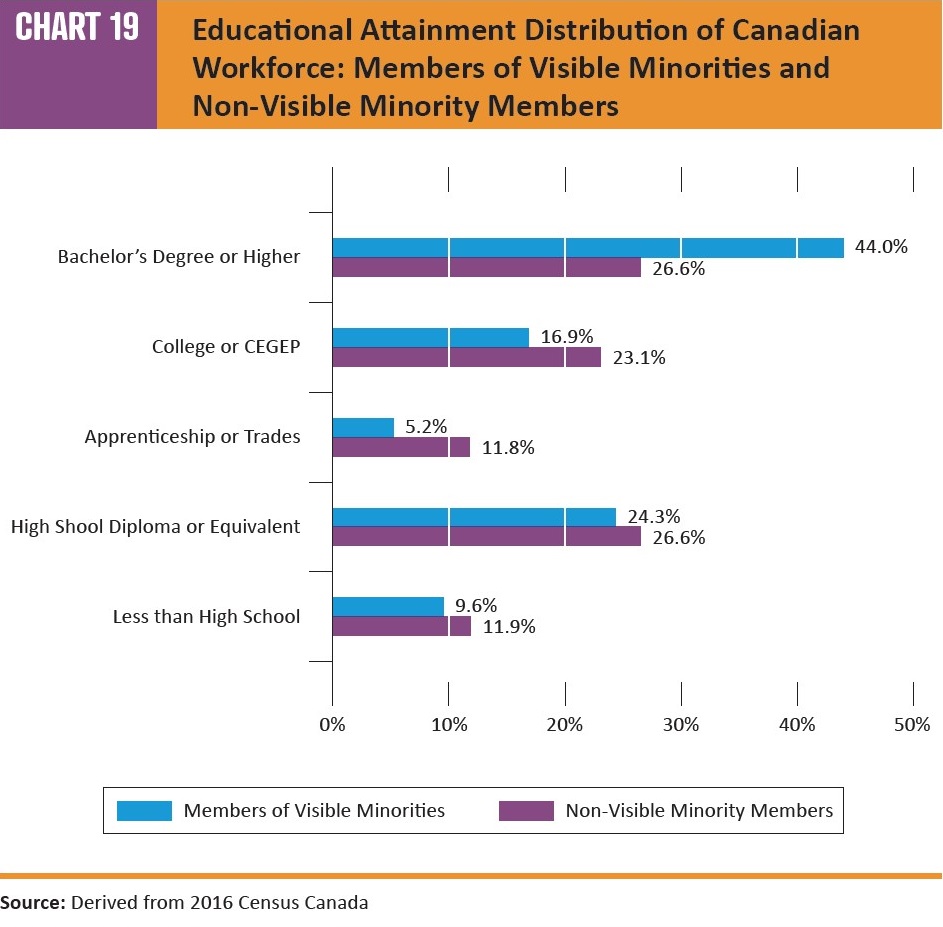
Chart 19: Educational attainment distribution of Canadian workforce: members of visible minorities and non-visible minority members – Text version
| Level of educational attainment | Members of visible minorities | Non-visible minority members |
|---|---|---|
| Less than high school | 9.6% | 11.9% |
| High school diploma or equivalent | 24.3% | 26.6% |
| Apprenticeship or trades | 5.2% | 11.8% |
| College or CEGEP | 16.9% | 23.1% |
| Bachelor's degree or higher | 44.0% | 26.6% |
Source: Derived from 2016 Census Canada
Indeed, since it costs about $14,000 per year to educate a high school student and $22,000 for a university student in CanadaFootnote 13, members of visible minorities contribute greatly to Canada’s economy:
- immigrants, the majority of whom are members of visible minorities, help build Canada’s productive capacity in a cost-effective way (even though many need additional training to meet Canada’s job requirements)
- their availability for labour market participation and economic contribution is immediate
- they increase diversity in Canada’s labour market, which increases its adaptability and potential for more global outreach (See Appendix G for further readings)
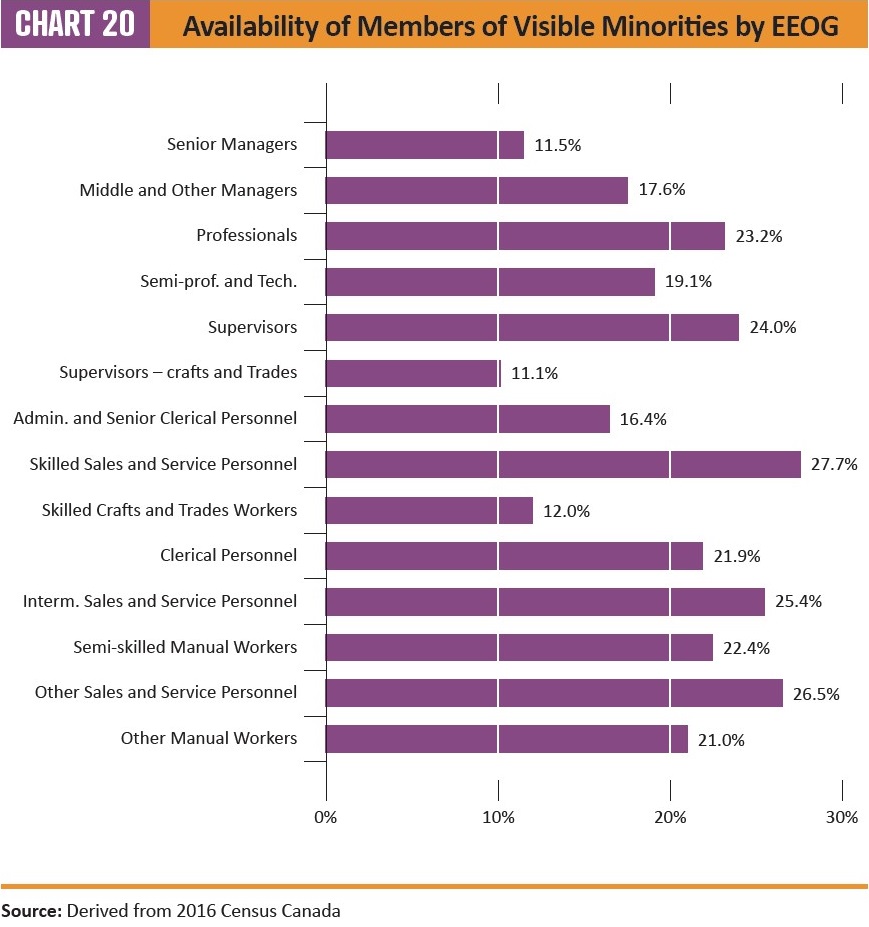
Chart 20: Availability of members of visible minorities by EEOG – Text version
| Occupational group | Percent |
|---|---|
| Other manual workers | 21.0 |
| Other sales and service personnel | 26.5 |
| Semi-skilled manual workers | 22.4 |
| Intermediate sales and services personnel | 25.4 |
| Clerical personnel | 21.9 |
| Skilled crafts and trades workers | 12.0 |
| Skilled sales and service personnel | 27.7 |
| Administrative and senior clerical personnel | 16.4 |
| Supervisors - crafts and trades | 11.1 |
| Supervisors | 24.0 |
| Semi-professionals and technicians | 19.1 |
| Professionals | 23.2 |
| Middle and other managers | 17.6 |
| Senior managers | 11.5 |
Source: Derived from 2016 Census Canada
Since the second generation in families entered the labour market directly from Canadian schools, their opportunities for work match those of other Canadians. It follows that the availability of members of visible minorities varies less across employment equity occupational groups than in the past. Availability is lower than average in management and trades-related occupations and higher than average in sales- and services-related occupations.
2.4 Persons with disabilities
The 2017 Canadian Survey on Disability (CSD) found more people with a disability –22.3% of the population – than previous disability surveys. In practice, the Employment Equity Act covers workers who self-identify that their disability affects their employment or employability. The availability of persons with disabilities rose to 9.1% in the 2016 Census cycle from 4.9% in the 2011 Census cycle.
The Employment Equity Act identifies people as disabled when they have a long-term or recurring impairment and:
- consider themselves as disadvantaged in employment by that impairment, or
- believe that an actual or potential employer likely considers them to be disadvantaged in employment by it.
This jump in availability came partly because the 2016 Census long form and CSD questionnaire included new questions to screen for persons with disabilities. It follows that employers will encounter increased equity gaps for people with disabilities. See the Questions and answers section for more information.
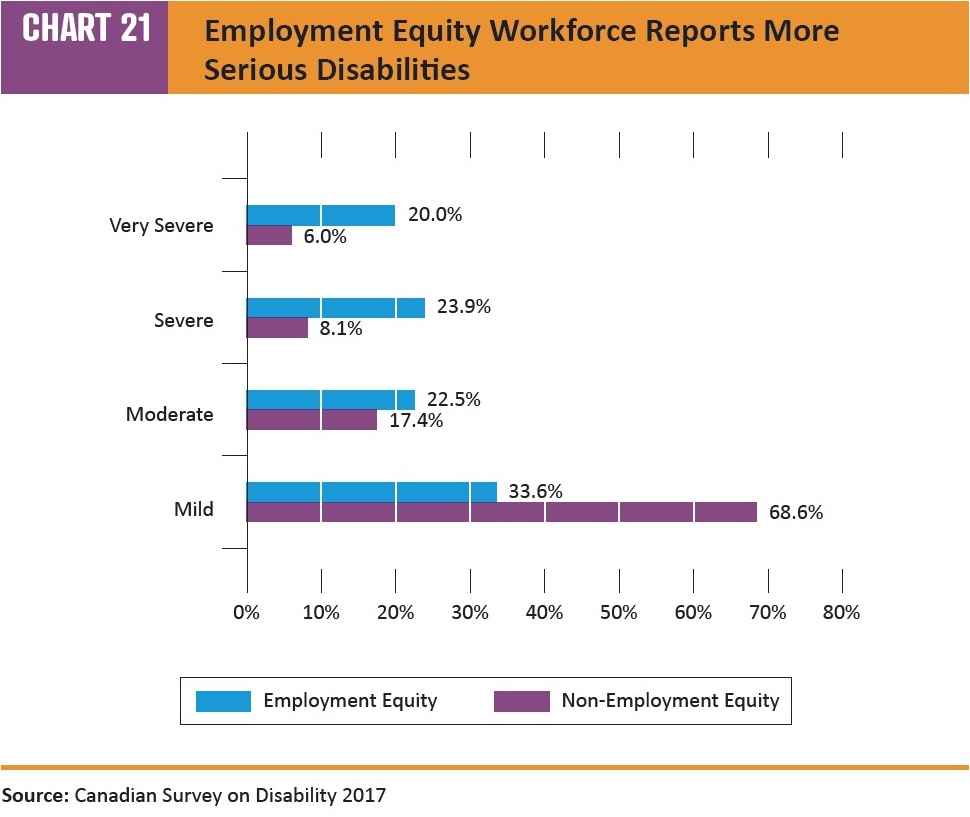
Chart 21: Employment equity workforce reports more serious disabilities – Text version
| Level of disabilities | Employment equity | Non-employment equity |
|---|---|---|
| Mild | 33.6% | 68.6% |
| Moderate | 22.5% | 17.4% |
| Severe | 23.9% | 8.1% |
| Very Severe | 20.0% | 6.0% |
Source: Canadian Survey on Disability 2017
Statistics Canada judges a person’s disability status by 3 factors:
- how many types of disability they have (the average is 3.0 types for the EE disabled versus 2.6 for other persons with disabilities);
- how severe their disability is (one third of the EE disabled have mild disabilities, while two-thirds of other persons with disabilities have mild ones); and
- how often their disability interferes with their daily activities – the Employment Equity Act also requires that a disability affect their work performance.Footnote 14
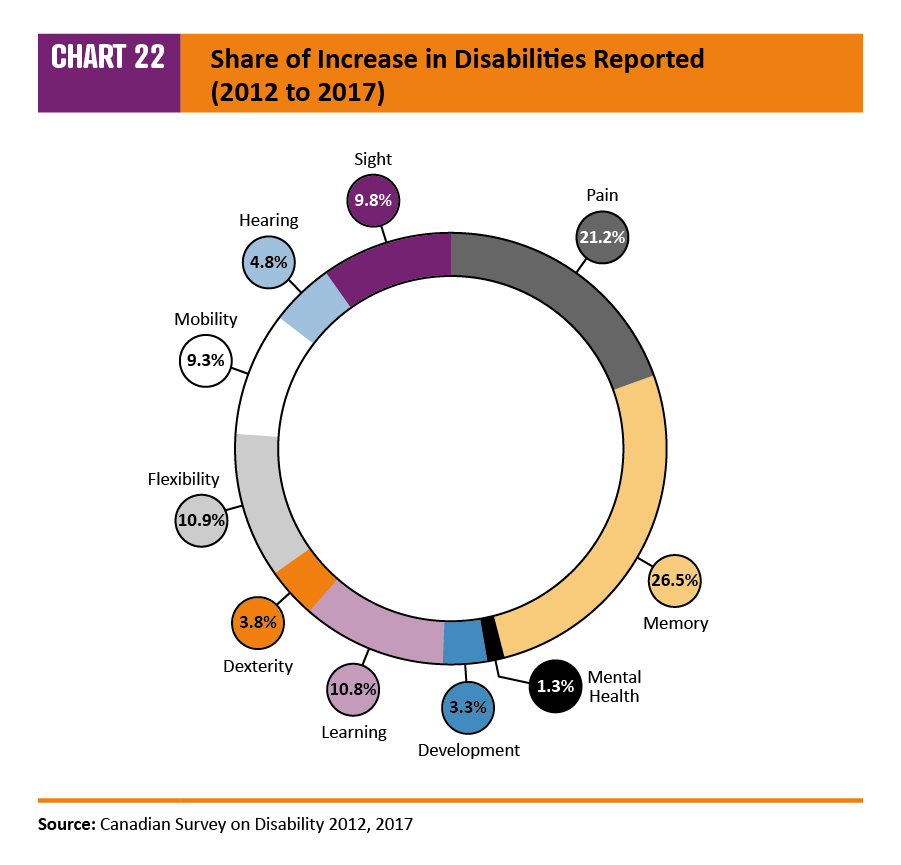
Chart 22: Share of increase in disabilities reported (2012 to 2017) – Text version
| Type of disability | Percent |
|---|---|
| Pain | 21.2% |
| Memory | 26.5% |
| Mental Health | 1.3% |
| Developmental | 3.3% |
| Learning | 10.8% |
| Dexterity | 3.8% |
| Flexibility | 10.9% |
| Mobility | 9.3% |
| Hearing | 4.8% |
| Sight | 9.8% |
Source: Canadian Survey on Disability 2012, 2017
Of all conditions reported by persons with disabilities, the number of those with every type of disability rose between the 2011 Census cycle and the 2016 Census. Pain and memory loss account for almost half of the rise in the number of disabilities. These disabilities are both age-related and less obvious – leaving some question about whether the ageing of the workforce or the more-inclusive questionnaire used in the Canadian Survey on Disability contributes most to the increase.
In 2016, two-thirds (66.2%) of all people with an employment equity disability reported that they had pain that prevents some daily activities. Nearly half (46.7%) reported memory loss; 39.8% had a lack of flexibility that deters daily activities; and 34.0% had mobility issues.
2.4.1 Availability by industrial sector
The new availability of persons with disabilities falls in a tight range -- 8% to 11% -- for the four main industries in the federal jurisdiction. While each employer has its own talent mix, the industry-average is highest in communications (11.0%), followed by transportation (9.8%), banking (9.2%) and other industries (8.3%).
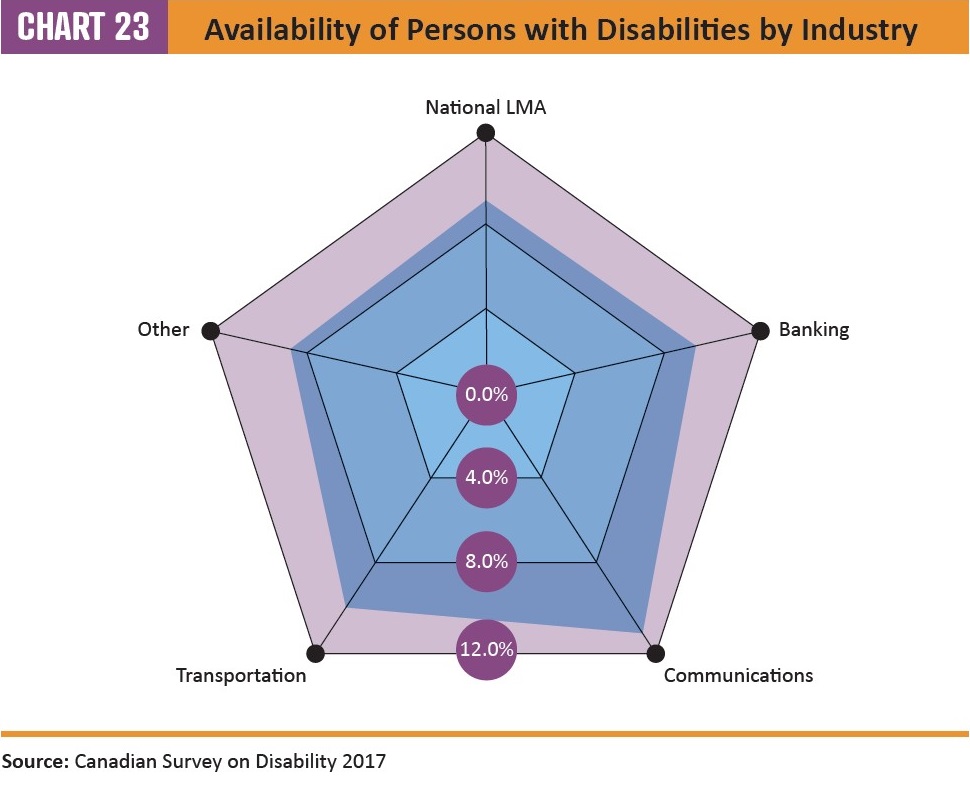
Chart 23: Availability of persons with disabilities by industry – Text version
| Industry | Percent |
|---|---|
| National LMA | 9.1% |
| Banking | 9.2% |
| Communications | 11.0% |
| Transportation | 9.8% |
| Other | 8.3% |
Source: Canadian Survey on Disability 2017
2.4.2 Availability by occupation
All Employment Equity Occupational Groups (EEOGs) except managerial ones had notable increases in their availability of persons with disabilities. The largest increase was among supervisory employees – from 13.9% in 2012 to 27.5% in 2017. While the level of availability is surprising, it follows the occupational pattern set by the 2012 Canadian Survey on Disability. Most of the remaining EEOGs have availability rates below 11%.
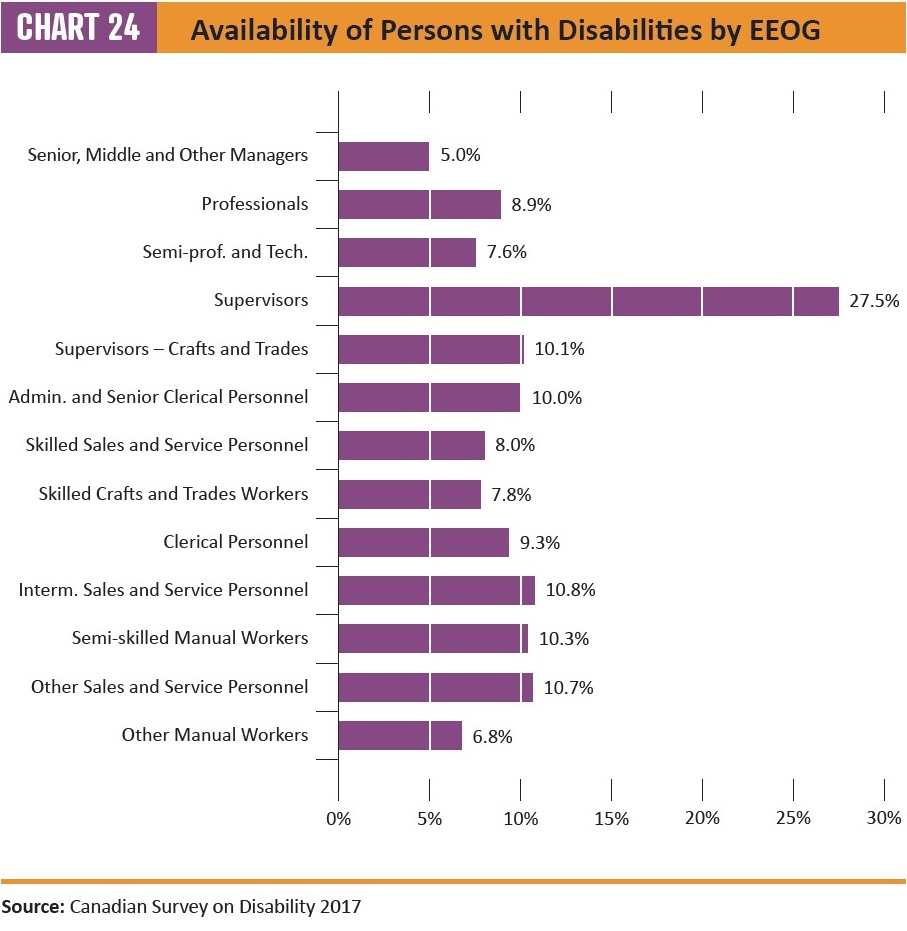
Chart 24: Availability of persons with disabilities by EEOG – Text version
| Occupational group | Percent |
|---|---|
| Other manual workers | 6.8 |
| Other sales and service personnel | 10.7 |
| Semi-skilled manual workers | 10.3 |
| Intermediate sales and service personnel | 10.8 |
| Clerical personnel | 9.3 |
| Skilled crafts and trades workers | 7.8 |
| Skilled sales and service personnel | 8.0 |
| Administrative and senior clerical personnel | 10.0 |
| Supervisors - crafts and trades | 10.1 |
| Supervisors | 27.5 |
| Semi-professionals and technicians | 7.6 |
| Professionals | 8.9 |
| Middle and other managers | 5.0 |
Source: Canadian Survey on Disability 2017
2.4.3 Availability by Province and Territory
Availability rates of persons with disabilities vary considerably by province and territory. The province-wide average is lowest in Quebec at 6.1%. The rate is highest in Nova Scotia (13.1%).
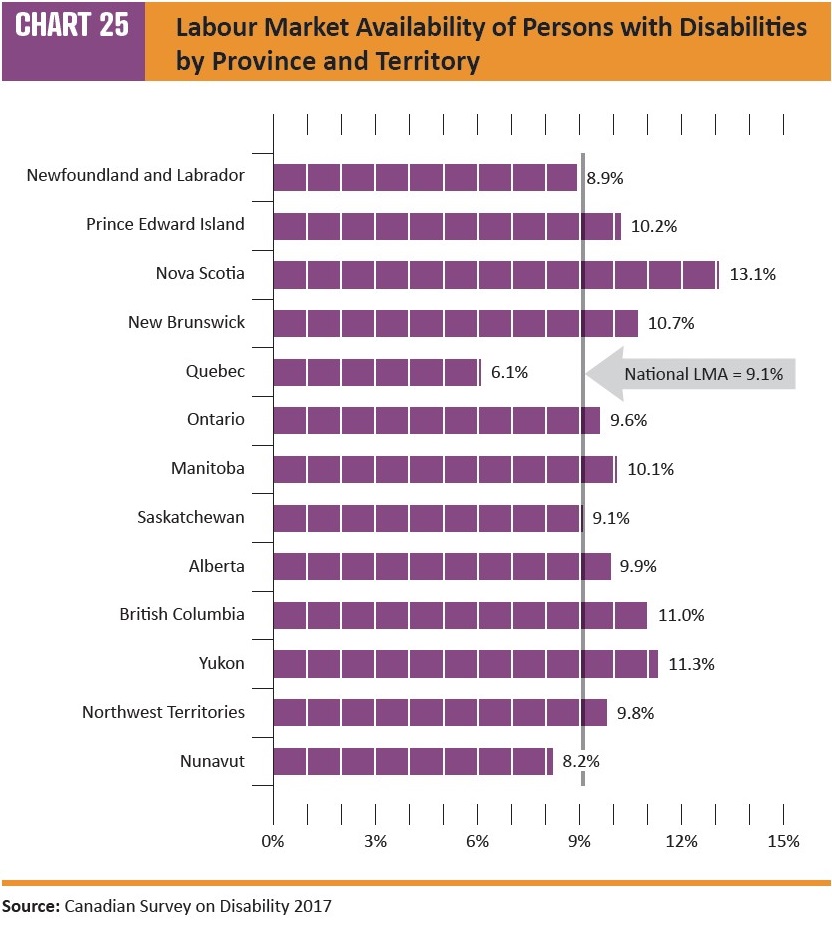
Chart 25: Labour market availability of persons with disabilities by province and territory – Text version
| Province and Territories | Availability |
|---|---|
| Nunavut | 8.2% |
| Northwest Territories | 9.8% |
| Yukon | 11.3% |
| British Columbia | 11.0% |
| Alberta | 9.9% |
| Saskatchewan | 9.1% |
| Manitoba | 10.1% |
| Ontario | 9.6% |
| Quebec | 6.1% |
| New Brunswick | 10.7% |
| Nova Scotia | 13.1% |
| Prince Edward Island | 10.2% |
| Newfoundland and Labrador | 8.9% |
| Canada | 9.1% |
Source: Canadian Survey on Disability 2017
3. Technical notes
This section of the report provides information on the sources of data on groups designated by the Employment Equity Act (the Act), the legislative and operational definitions, regulatory parameters involved, and the process the Labour Program uses to develop labour market availability (LMA) benchmarks for employers.
3.1 Data sources
The main source of data for LMA estimates is the 2016 Census long form, which the Government of Canada reinstated to replace the voluntary National Household Survey used during the 2011 Census cycle. With a response rate of 97.8% for the long form, the Census produced more reliable estimates for LMA than the voluntary National Household Survey, which had a response rate of 77%.
The long form Census asks questions related to people and where they live, which permit identification of people in the designated groups as defined in the Employment Equity Act.
| Designated group | Census | Canadian survey on disability |
|---|---|---|
| Women | Fully identified | n/a |
| Aboriginal peoples | Fully identified | n/a |
| Members of visible minorities | Fully identified | n/a |
| Persons with disabilities | Screening for sampling frame | Fully identified |
To obtain the baseline data on designated groups’ LMA, all respondents who are first identified as a member of a designated population in the 2016 CensusFootnote 15, are further screened for their labour market status at the time the Census was conducted. They are included in the Employment Equity Workforce if they were:
- employed when the Census data were collected
- unemployed (out of work and looking for a job) at the time of the Census and had work experience in 2015 or 2016
- out of the labour market, unretired and had work experience in 2015 or 2016
Additional questions on the longer-run labour market activity by persons with disabilities were placed in the Canadian Survey on Disability.
3.2 Definitions for designated groups
In general, the Employment Equity Act follows 2 kinds of definition: the legislative one provided by the Employment Equity Act and the ones defined by the operational practices that use the Act as enabling legislation.
Women
Legislative definition: Women are designated by Section 3 of the Employment Equity Act.
Operational definition: Persons identified as ‘Female’ in the question on “person’s sex” in the long form Census questionnaire.
Aboriginal peoples
Legislative definition: In the Employment Equity Act, “Aboriginal peoples” means persons who are Indians, Inuit or Métis.
Operational definition
Employment equity data on Aboriginal peoples in the 2016 Census refer to people who:
- self-identified as being at least one of First Nation (North American Indian), Métis or Inuit (Question 18)
- reported being a Status Indian (Registered or Treaty Indian) (Question 20) as defined by the Indian Act of Canada)”
- reported they were members of a First Nation/Indian band (Question 21)
Question 18
Is this person an Aboriginal person, that is, First Nations (North American Indian), Métis or Inuk (Inuit)?
Note: First Nations (North American Indian) includes Status and Non-Status Indians.
If "Yes", mark the circle(s) that best describe(s) this person now.
- No, not an Aboriginal person. Continue with the next question.
- Yes, First Nations (North American Indian). Go to question 20.
- Yes, Métis. Go to question 20.
- Yes, Inuk (Inuit). Go to question 20.
Question 20
Is this person a Status Indian (Registered or Treaty Indian as defined by the Indian Act of Canada)?
- No
- Yes, Status Indian (Registered or Treaty)
Question 21
Is this person a member of a First Nation/Indian band?
Note: If " Yes ", which First Nation/Indian band? For example, Musqueam Indian Band, Sturgeon Lake First Nation, Atikamekw of Manawan.
- No
- Yes, member of a First Nation/Indian band. Specify name of First Nation/Indian Band
Incompletely enumerated Indian reserves and settlements: In 2016, there were a total of 14 Indian reserves and Indian settlements that were incompletely enumerated. For these reserves and settlements, dwelling enumeration was either not permitted or was interrupted before it could be completed. The LMA estimates use higher-level geographic areas (Canada, provinces and territories and census metropolitan areas) and therefore, the impact of the missing data is very small.
Members of visible minorities
Legislative definition: In the Employment Equity Act, “members of visible minorities” means “persons, other than Aboriginal peoples, who are non-Caucasian in race or non-white in colour.”
Operational definition: In the 2016 Census, persons who marked-in South Asian, Chinese, Black, Filipino, Latin American, Arab, Southeast Asian, West Asian, Korean or Japanese were included in the visible minority population.
Besides these visible minority sub-groups, two remaining groupings were formed in the 2016 Census [in other words, visible minority not included elsewhere and multiple visible minority]. Visible minority not included elsewhere includes responses that could not be classified into one of the sub-groups. Multiple visible minority responses include any combination of these.
Question 19:
This question collects information in accordance with the Employment Equity Act and its Regulations and Guidelines to support programs that promote equal opportunity for everyone to share in the social, cultural, and economic life of Canada.
Is this person (Make more than one circle or specify, if applicable):
- White
- South Asian (for example, East Indian, Pakistani, Sri Lankan, etc.)
- Chinese
- Black
- Filipino
- Latin American
- Arab
- Southeast Asian (for example, Vietnamese, Cambodian, Laotian, Thai, etc.)
- West Asian (for example, Iranian, Afghan, etc.)
- Korean
- Japanese
- Other — specify
Persons with disabilities
Legislative definition
In the Employment Equity Act, “persons with disabilities”means “persons who have a long-term or recurring physical, mental, sensory, psychiatric or learning impairment and who
- consider themselves to be disadvantaged in employment by reason of that impairment, or
- believe that a(n) employer or potential employer is likely to consider them to be disadvantaged in employment by reason of that impairment, and includes persons whose functional limitations owing to their impairment have been accommodated in their current job or workplace”.
Operational definition: Identifying persons with disabilities draws on information from the 2016 Census of Population and post-censal survey, the 2017 Canadian Survey on Disability.
2016 Census of population: Disability screening questions
Consistent with the intent of the Employment Equity Act in focusing on those with long-term conditions, the 2016 Census of Population implemented Canada’s new Disability Screening Questions (Question 11 in the long-form Census questionnaire) that filter for those who have a condition that is expected to last six months or more.
Adults aged 15 or above who answered “Sometimes”, “Often” or “Always” to at least one of the daily living activities under Question 11 were included the sampling frame for the Canadian Survey on Disability.
Activities of daily living
The following question is about difficulties a person may have doing certain activities. Only difficulties or long-term conditions that have lasted or are expected to last for six months or more should be considered.
Question 11: Does this person have any:
a) difficulty seeing (even when wearing glasses or contact lenses)?
1. No
2. Sometimes
3. Often
4. Always
b) difficulty hearing (even when using a hearing aid)?
1. No
2. Sometimes
3. Often
4. Always
c) difficulty walking, using stairs, using his/her hands or fingers or doing other physical activities?
1. No
2. Sometimes
3. Often
4. Always
d) difficulty learning, remembering or concentrating?
1. No
2. Sometimes
3. Often
4. Always
e) emotional, psychological or mental health conditions (for example, anxiety, depression, bipolar disorder, substance abuse, anorexia, etc.)?
1. No
2. Sometimes
3. Often
4. Always
f) other health problem or long-term condition that has lasted or is expected to last for six months or more? (Exclude: any health problems previously reported above.)
1. No
2. Sometimes
3. Often
4. Always
2017 Canadian Survey on Disability
In the 2017 Canadian Survey on Disability, four concepts are included in the definition of disability used in the Employment Equity act:
- long term disability
- employment disadvantage
- perception of employment disadvantage
- employment accommodations
In other words, people are part of the Employment Equity disability workforce if they have a condition that is expected to last 6 months or more, and if they are disadvantaged in employment, or if they see themselves as disadvantaged, or if they need accommodations or have been accommodated in the workplace.
Accordingly, a group of work-related questions were included in the Canadian Survey on Disability questionnaire to identify any of the following:
Employment disadvantage
EDE_Q10 - Does your condition limit the amount or kind of work you can do at your present job or business?
- Yes
- No
UDE_Q40 - Does your condition limit the amount or kind of work you can do at a job or business?
- Yes
- No
NDE_Q50 - Does your condition limit the amount or kind of work you could do at a job or business?
- Yes
- No
LFD_Q20 - Do you consider yourself to be disadvantaged in employment because of your condition?
- Yes
- No
Perception of employment disadvantage
EDE_Q30 - Do you believe that your condition makes it difficult for you to change jobs or to advance at your present job?
- Yes, very difficult
- Yes, difficult
- No, not difficult
LFD_Q25 - Do you believe that your current employer or any potential employer would be likely to consider you disadvantaged in employment because of your condition?
- Yes
- No
Employment accommodation
EMO_Q05 - Because of your condition, [do/would] you require any of the following to be able to work?
- Modified or different duties
- Working from home
- Modified hours or days or reduced work hours
- Human support (for example, reader, sign language interpreter, job coach or personal assistant)
- Technical aids (for example, voice synthesizer, TTY, infrared system or portable note-taker)
- Computer, laptop or tablet with specialized software or other adaptations (for example, Braille, screen magnification software, voice recognition software or a screen reader)
- Communication aids (for example, Braille or large print reading material or recording equipment)
- Modified or ergonomic workstation
- Special chair or back support
- Handrails, ramps, widened doorways or hallways
- Adapted or accessible parking
- Accessible elevators
- Adapted washrooms
- Specialized transportation
- Other equipment, help or work arrangement - specify:
- None of the above
A positive response to any of these questions places the respondents among those who have a disability under the terms of the Employment Equity Act.
3.3 Special notes
2016 Census: random rounding, suppression and confidentiality
Random rounding
The Census-based estimates included in this report have undergone a random rounding adjustment – a confidentiality procedure to prevent the possibility of associating statistical data with any identifiable individual. Under this method, all figures, including totals and margins, are randomly rounded either up or down to a multiple of '5,' and in some cases '10.' While providing strong protection against disclosure, this technique does not add significant error to the Census-based estimates.
It should be kept in mind that totals and margins are rounded independently of the cell data so that some differences between these and the sum of rounded cell data may exist. Minor differences can also occur in corresponding totals and cell values among various data tabulations. Similarly, percentages, which are calculated on rounded figures, do not necessarily add up to 100%. Statistics such as median, quartiles, percentiles, are computed in the usual manner.
Possible data distortions can happen when rounded data are aggregated. Imprecision as a result of rounding tend to cancel each other out when data cells are re-aggregated. However, data distortions can be minimized if the appropriate subtotals, whenever possible, are used for aggregating.
The option exists for those seeking maximum precision to use custom tabulations. With custom products, aggregation is done using individual Census database records. Random rounding occurs only after the data cells have been aggregated, thus minimizing any distortion.
Suppression and confidentiality
In addition to random rounding, area suppression has been adopted to further protect the confidentiality of respondents. Area suppression is the deletion of all characteristic data from the Census for geographic areas with populations below 40 persons. However, if the Census data refer to six-character postal codes or to groups of either dissemination blocks or block-faces, they are suppressed if the total population in the area is less than 100 persons.
For further information on the quality of Census data, Please refer to Statistics Canada's Guide to the Census of Population, 2016.
3.4 Canadian Survey on Disability
Statistics Canada’s Canadian Survey on Disability (CSD), a Census follow-up survey conducted every 5 years, collects information about adults whose everyday activities are limited due to a condition or health-related problem. The 2017 CSD was conducted from March 1 to August 31, 2017. Improvements were made to the methodology and content of the 2017 Canadian Survey on Disability, which can affect comparability with the 2012 Canadian Survey on Disability data. The main differences between the 2017 and the 2012 Canadian Survey on Disability can be summarized as follows:
Disability screening questions: Overall, the same employment equity-related questions were asked in the Canadian Survey on Disability. However, the most significant change is the screening questions for disability in the Census to identify potential candidates for follow-up questions in the Canadian Survey on Disability.
In the past, Census respondents had been asked two questions:
- Did they have difficulty hearing, seeing, communicating, walking, climbing stairs, bending, learning or doing any similar activities
- at home, at school or work or in other activities
These questions typically screened 22.3% of the Canadian population into the Canadian Survey on Disability sampling frame.
The 2016 Census cycle, including the 2017 Canadian Survey on Disability, expanded the number of health problems to include:
- mobility, flexibility and dexterity instead of walking/mobility
- pain-related as a new category
- developmental, memory and mental health related instead of a single emotional / psychological category
Changes to the 2016 Census filter questions provided increased coverage of persons with a disability, especially persons with a cognitive or mental health-related disability for the 2017 Canadian Survey on Disability than for the 2012 Canadian Survey on Disability. These questions screened 35% of Canada’s population into the Canadian Survey on Disability sampling frame.
Data collection methods: For the 2017 Canadian Survey on Disability, data collection was conducted using an electronic questionnaire, which was either self-administered online by some respondents or completed by phone with the assistance of an interviewer for the others. Approximately 2 in 5 respondents (40%) opted for the self-administered online collection. This change could affect the collected data relative to the 2012 Canadian Survey on Disability, which was entirely conducted by telephone interview.
Time lag between the Census and the Canadian Survey on Disability: The 2017 Canadian Survey on Disability was conducted 10 to 16 months after the 2016 Census, a shorter time lag than the time between the 2011 National Household Survey and the 2012 Canadian Survey on Disability, which was 16 to 20 months. Nonetheless, in both cases, survey weights of the NO sample had to be adjusted to avoid underestimating the prevalence of disability due to losses caused by deaths, institutionalization and people who left the country. The adjustment, which took into account the duration of the time lag, may have a slight impact on comparisons between the 2 cycles.
Response rate: For the 2017 Canadian Survey on Disability, the sampling frame was established based on the mandatory 2016 Census, which had a response rate of 97.8% (for the long-form), while the sampling frame for the 2012 Canadian Survey on Disability was based on the voluntary 2011 National Household Survey, which had a response rate of 77.2%. This difference may have had an impact on the results of the 2017 Canadian Survey on Disability.
Questionnaire content: Compared to the 2012 cycle, the content of the 2017 Canadian Survey on Disability has been changed in many ways. Several new survey modules were added for 2017, and several modules were also substantially reorganized. Questions were asked in a new order that better reflected standard employment indicators found on other labour surveys by Statistics Canada. Some of the content from the 2012 cycle was removed in 2017 in order to balance the respondent burden created by extensive new content additions.
In summary, these changes, particularly those related to the Census filter questions, make it difficult to compare data on disability between the 2012 and 2017 CSDs. For details, please refer to Statistics Canada’s Canadian Survey on Disability, 2017: Concepts and Methods Guide.
4. Data considerations
4.1 Labour Market Availability (LMA)
The Employment Equity Act promotes “equality in the workplace so that no person shall be denied employment opportunities…for reasons unrelated to ability…” (Section 2 of the Act).
To that end, the Act requires employers to analyze their workforce and to take action where any of the four designated groups is under-represented relative to the availability in the Canadian labour market—referred to as labour market availability (LMA) of similarly skilled designated group members in either:
- the Canadian workforce as a whole
- those segments of the Canadian workforce that are identifiable by qualification, eligibility or geography, and from which the employer may reasonably be expected to draw employees (section 5 of the Act, section 6 of the Regulations)
The types of jobs in an organization help to determine a reasonable area from which to draw employees. For example, highly specialized professional jobs may require a fairly wide recruitment area such as a province, a region or the country. Occupations requiring lesser skills can usually be addressed through recruitment at a local level, such as a Census Metropolitan Area (CMA).
Under the provisions of the Employment Equity Act, the Labour Program has provided availability rates to employers participating in the Legislated Employment Equity Program (LEEP) and the federal contractors participating in the Federal Contractors Program (FCP). The LMAs also are available on the Open Government Portal.
4.2 Employers Covered under the Employment Equity Act
The following employers are covered by the Employment Equity Act:
- organizations that employ 100 or more employees in the federally-regulated private sector, federal Crown corporations and other federal government business enterprises;
- core public administration organizations listed under Schedule I or IV of the Financial Administration Act (FAA) (federal government departments and agencies);
- separate employer organizations in the federal public sector with 100 or more employees, listed in Schedule V of the Financial Administration Act (FAA) (separate agencies);
- other public-sector employer organizations with 100 or more employees, including the Canadian Forces (officers and non-commissioned members in the Regular and Reserve Forces) and the Royal Canadian Mounted Police (regular and civilian members, excluding federal public service employees); and
- federal contractor organizations that are provincially regulated suppliers of goods and services with at least 100 permanents full-time and/or permanent part-time employees in Canada that receive contracts of $1 million or more from the federal government.
4.3 Census Metropolitan Area (CMA)
A Census metropolitan area (CMA) is formed by one or more adjacent municipalities centered on a large urban area (known as the urban core). It is an important Census geographical concept to understand and use as employers under the Employment Equity Act conduct workforce analysis using CMA level data.
Canada in 2016 had 35 CMAs, as compared with 33 in 2011. For more information related to the concept of CMA, please refer to Statistics Canada’s Dictionary, Census of Population, 2016. Appendix E in this report has the complete list of CMAs and their municipalities, and refer to Statistics Canada’s Geography Series about each CMA and its geographic boundaries. Due to the small sample size of the 2017 Canadian Survey on Disability, data are not available for persons with disabilities at the CMA level.
4.4 National Occupational Classification
The National Occupational Classification (NOC) is the nationally accepted classification system for occupations in the Canadian labour market. NOC codes, signaling both skill type and skill level, are the basis for grouping Employment Equity Occupational Groups. In the 2016 Census, data on occupation is based on the National Occupational Classification (NOC) 2016.
4.5 Employment Equity Occupational Groups
Employers covered under the Legislated Employment Equity Program (LEEP), the Federal Contractors Program (FCP) and separate employers are required, for the purpose of reporting, to aggregate the different NOC codes that they have assigned to the occupations that exist within their organization into 14 Employment Equity Occupational Groups (EEOGs) (see Appendix D). EEOGs have been developed to reflect the underlying structure of the economy. Grouping NOC codes by EEOGs allows employers to track the movement of designated group members as they progress up in the hierarchy of the organization.
For details, please refer to a full list of Employment Equity Occupational Groups and their Corresponding Unit Groups in Appendix C and Employment Equity Occupational Group Definitions in Appendix D.
5. Questions and answers
Q. What is labour market availability?
A. The availability in the Canadian labour market—referred to as labour market availability (LMA) — is the benchmark against which employers covered by the Employment Equity Act (the Act) measure their employment equity performance. These estimates are derived from the Census and post-censal survey on disability conducted by Statistics Canada. The most recent LMA data is from the 2016 Census and the 2017 Canadian Survey on Disability. The LMA figures for women, Aboriginal peoples, and members of visible minorities include those aged 15 years and over who worked in their chosen occupation in 2015 or 2016. The LMA for persons with disabilities (Employment Equity Act defined) figures include those aged 15 to 64 who worked in 2016 or 2017.
Q. Does employment equity really mean hiring unqualified people?
A. Employment equity (EE) helps give all qualified people equal opportunities – only ability matters from an EE perspective. The Employment Equity Act was introduced to address the systematic disadvantage that the 4 designated groups suffer in the labour market. Data show that their disadvantage persists to this day, and that EE helps level the playing field for qualified people.
Q. Do women do better now that their educational levels have increased over the years?
A. Full equality of opportunity for women involves improvement on many fronts. Since Canadian women lead the world in scholastic achievement, it should be reflected in their working lives. To that end, Canada recently joined many developed countries in a new round of measures to ensure that women are paid equitably. Ongoing use of the Employment Equity Act broadens their opportunity to participate in the most desirable occupational niches. For example, the numbers of women taking management at the Bachelor’s and Master’s levels now approximate men’s participation. Labour market availability rates for managerial occupations suggest that they still need the support that the Employment Equity Act provides.
Q. Aren’t the population counts inflated for Aboriginal peoples and visible minorities?
A. The numbers are likely more accurate than ever. For 2016, Statistics Canada brought back the compulsory Census long form to replace the voluntary National Household Survey (NHS) of 2011. This increased the accuracy of population counts for all designated groups – the non-response rate to the 2016 Census was 2%, while 23% of Canadians did not complete the 2011 NHS form.
The 2016 Census also was more inclusive than the NHS. In 2011, 36 reserves or settlements (10% of the total) were incompletely enumerated. There were only 14 of these reserves or settlements in 2016.
Q. Why did the availability of persons with disabilities rise so much?
A. First, it rose because more people have conditions that interfere with their daily lives and their ability to earn a living. With Canada’s largestFootnote 16 “baby boom” generation at or near retirement, the number of people living with limitations has grown rapidly.Footnote 17 Second, people of all ages seem to be more willing to self-identify and discuss these limitations. The 2017 Canadian Survey on Disability reflected that change in mood, and the results fall in a range that earlier research identifies.
Q. Does diversity matter?
A. Everyone can make a difference. In the past, Canada’s productivity was built on a system where workers repeated small tasks many times to produce goods and services. In a more competitive economic environment, the ability to adapt becomes more important and having workers with varied experience can contribute greatly. This principle has been proven in a vast number of recent studies that almost universally show that diversity improves performance in firms.Footnote 18 It builds an employer’s reputation for fairness, which improves recruiting and staff retention. Indeed, international agencies, such as the OECD or the World Economic Forum, now include diversity measures among their economic indicators.
Q. How did the Canadian Survey on Disability (CSD) increase disability counts so much?
A. Statistics Canada conducts the CSD as a follow-up among Census respondents who reported that they have a long-lasting limitation on their daily activity. The 2016 Census asked questions about a number of specific limitations, which gave individuals more time to assess their situation and identify their disabilities. The 2011 National Household Survey asked a single question related to a shorter list of disabilities. As a result, the proportion of the Canadian population aged 15 years or older who self- identified with one or more disabilities rose from 14% in 2012 to 24% in 2017.
The following questions are from the 2011 National Household Survey
Activities of daily living
Question 7. Does this person have any difficulty hearing, seeing, communicating, walking, climbing stairs, bending, learning or doing any similar activities?
- Yes, sometimes
- Yes, often
- No
Question 8. Does a physical condition or mental condition or health problem reduce the amount or the kind of activity this person can do:
a) at home?
- Yes, sometimes
- Yes, often
- No
b) at work or at school?
- Yes, sometimes
- Yes, often
- No
- Not applicable
c) in other activities, for example, transportation or leisure?
- Yes, sometimes
- Yes, often
- No
The following questions are from the 2016 Census questionnaire.
The following question is about difficulties a person may have doing certain activities. Only difficulties or long-term conditions that have lasted or are expected to last for 6 months or more should be considered.
Question 11. Does this person have any:
a) difficulty seeing (even when wearing glasses or contact lenses)?
- No
- Sometimes
- Often
- Always
b) difficulty hearing (even when using a hearing aid)?
- No
- Sometimes
- Often
- Always
c) difficulty walking, using stairs, using his/her hands or fingers or doing other physical activities?
- No
- Sometimes
- Often
- Always
d) difficulty learning, remembering or concentrating?
- No
- Sometimes
- Often
- Always
e) emotional, psychological or mental health conditions (for example anxiety, depression, bipolar disorder, substance abuse, anorexia, etc.)?
- No
- Sometimes
- Often
- Always
f) other health problem or long-term condition that has lasted or is expected to last for 6 months or more?
Exclude: any health problems previously reported above.
- No
- Sometimes
- Often
- Always
Appendix A: Recent trends in workplace practices
Highlight of recent trends in workplace practices
External data and research point out significant shifts in labour markets that are relevant for employment equity in the federal jurisdiction. Tight markets, with low unemployment rates and a scarcity of candidates, have forced employers to revise their human resource strategies to find innovative approaches/technologies to make the workforce more diverse and inclusive. The following are 2 examples out of many emerging and promising workplace approaches.
1. The value of inclusion and diversity
Canada’s economy has lifted productivity by training many workers to do a set of occupational tasks that they can repeat often.Footnote 19 No worker, however, can know enough to perform all the tasks that need to be done. In a trading world, this translates into hiring workers with all the required skills and whose varied experience can contribute to growth - diversity.
“Out of the totality of what is known by society at large, a single person knows practically nothing, no matter how well educated or how brilliant!” Sherwin Rosen
Surveys conducted by the World Economic Forum reflect a variety of reasons why diversity works. Employers use their reputations for fairness and equity as recruiting tools. This raises retention rates and is more cost effective than enduring high staff turnover and constant retraining.
“Your staff should reflect your client base” is the best-known rule of thumb for building a business through diversity. Having employees from diverse background provides learning opportunities for all staff. Organizations could also use the diverse attributes that each employee contributes in order to harness these potentially significant contributions to innovation growth.Footnote 20
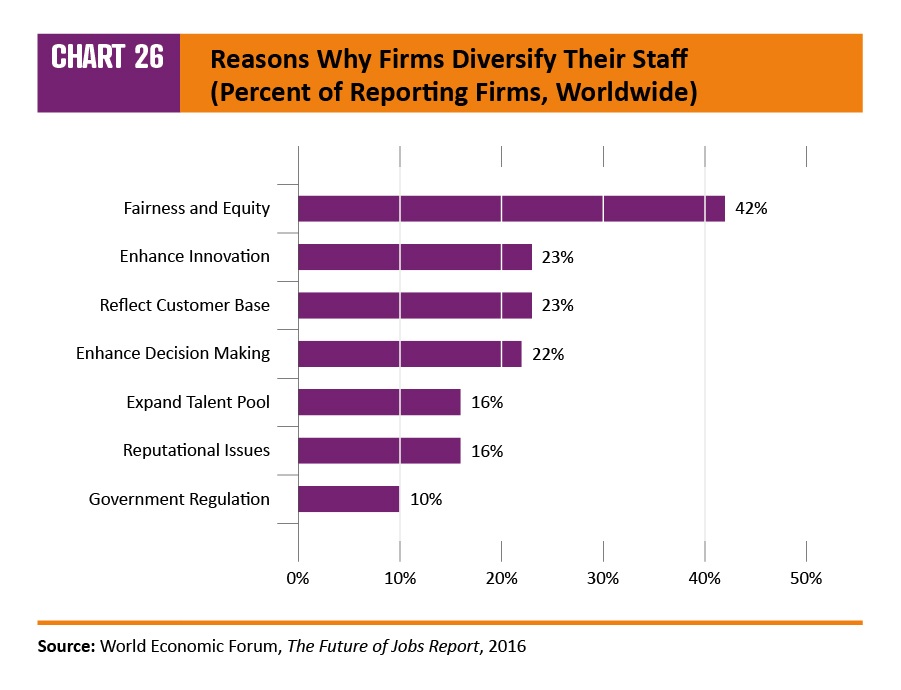
Chart 26. Reasons why firms diversify their staff (percent of reporting firms, worldwide) – Text version
| Reasons why firms diversity their staff | Percent |
|---|---|
| Government Regulation | 10% |
| Reputational Issues | 16% |
| Expand Talent Pool | 16% |
| Enhance Decision Making | 22% |
| Reflect Customer Base | 23% |
| Enhance Innovation | 23% |
| Fairness and Equity | 42% |
Source: World Economic Forum, the Future of Jobs Report 2016
Diversity in executive teams improves performance. In a study of 1,000 firms in 12 countries, Hunt et al Footnote 21 showed that gender diversity in the executive teams was linked to greater profitability and value creation. The firms with greater ethnic diversity were much more likely to be near the top in profitability.Footnote 22
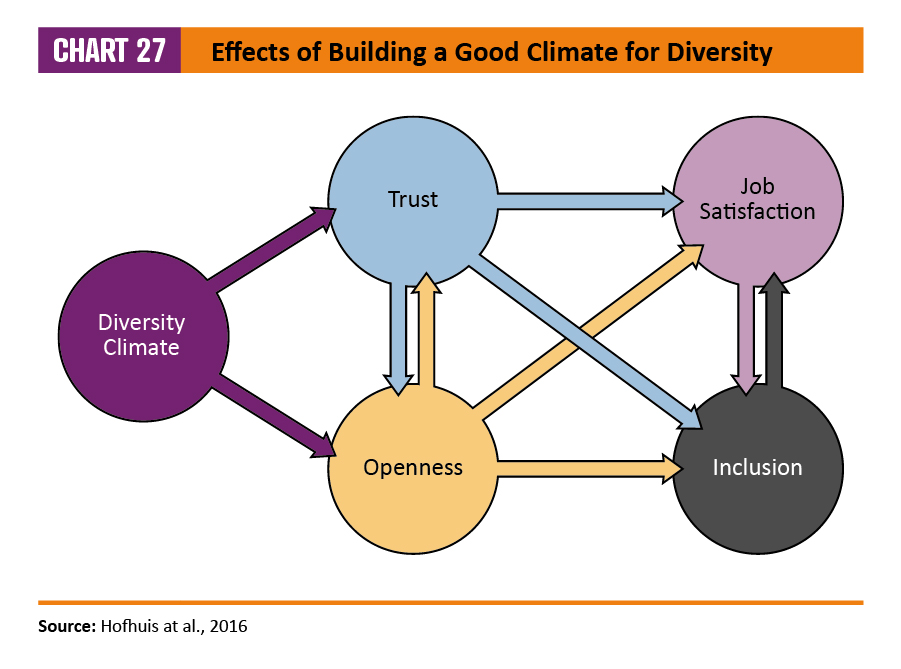
Chart 27: Effects of building a good climate for diversity – Text version
Chart 27 is Effects of building a good climate for diversity. It shows a structural model describing how improving the diversity climate builds trust and openness in the workplace. Trust and openness are mutually supportive – and they raise job satisfaction and inclusiveness in the workplace.
Source: Hofhuis et al, 2016
Ideally, management should build a good climate for diversity in the workplace that includes trust and openness for developing job satisfaction and inclusion.
The following are steps that help build a good climate for employment equityFootnote 23:
- in recruiting, emphasize details that appeal to more diverse candidates
- undertake diversity training in the workplace
- have transparent policies for all human resource policies
- accommodate – religious holidays, daycare needs, flexibility in work schedules, dress requirements, etc.
- give people a reason to stay
- show recruits how their work fits into the big picture
- inform them on the company culture
- provide them with opportunities for advancement
In the longer run, diversity benefits communities. In an extensive study of 160 U.S. cities, Ottaviano and PeriFootnote 24 show that cultural diversity improves productivity in the whole community. Kemeny and CookeFootnote 25 produce similar results. Indeed, the annual World Competitiveness Report includes a measure of diversity related to women and the LGBT community-in its large set of economic indicators.
2. Teleworking
Research shows that when employers include teleworking in their operations, they open their workplace to a deeper pool of candidates, improve productivity and reduce costs. For candidates, the benefits include avoiding a long commute, raising their earning potential and for some of the most isolated, the possibility of working at all.Footnote 26
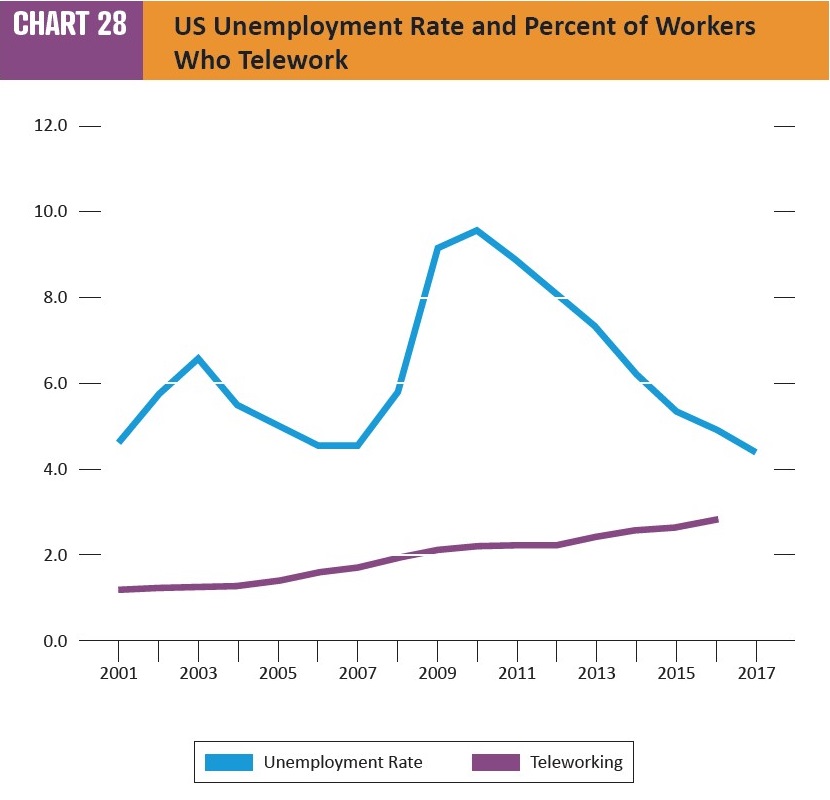
Chart 28: US unemployment rate and percent of workers who telework – Text version
| Year | Unemployment rate | Telework |
|---|---|---|
| 2001 | 4.7 | 1.2 |
| 2002 | 5.8 | 1.2 |
| 2003 | 6.6 | 1.3 |
| 2004 | 5.5 | 1.4 |
| 2005 | 5.1 | 1.4 |
| 2006 | 4.6 | 1.6 |
| 2007 | 4.6 | 1.7 |
| 2008 | 5.8 | 1.9 |
| 2009 | 9.3 | 2.1 |
| 2010 | 9.6 | 2.2 |
| 2011 | 8.9 | 2.3 |
| 2012 | 8.1 | 2.3 |
| 2013 | 7.4 | 2.5 |
| 2014 | 6.2 | 2.6 |
| 2015 | 5.3 | 2.8 |
| 2016 | 4.9 | 3.1 |
| 2017 | 4.4 | n/a |
| 2018 | 4.0 | n/a |
Source: Global Labor Market Outlook 2018: Finding Ways to Counteract Worker Shortages (hardcopy)
In the United States (U.S.), there are roughly as many full-time teleworkers – people who work away from their employer’s main workplace – as there are unemployed. In Canada, data from the General Social Survey (GSS) of 2016 shows that 2.3 million paid workers (12.7% of the workforce) telework at least an hour a week. Of these, more than 500,000 workers telework for more than 15 hours per week (the point where work is insurable for Employment Insurance purposes). This suggests that teleworking is roughly as frequent in Canada as in the U.S.
Teleworking is linked to the occupations that are most connected to the knowledge economy. More than one in three workers in management occupationsFootnote 27 already telework and the shares in education and in natural and applied sciences is above 20%. In contrast, the shares are less than half the national average in the less-skilled sales and service occupations, in those related to manufacturing, natural resource extraction, the trades and among transportation operators. Health care occupations, which rely on close interaction between patient and care provider, also have low rates of teleworking.
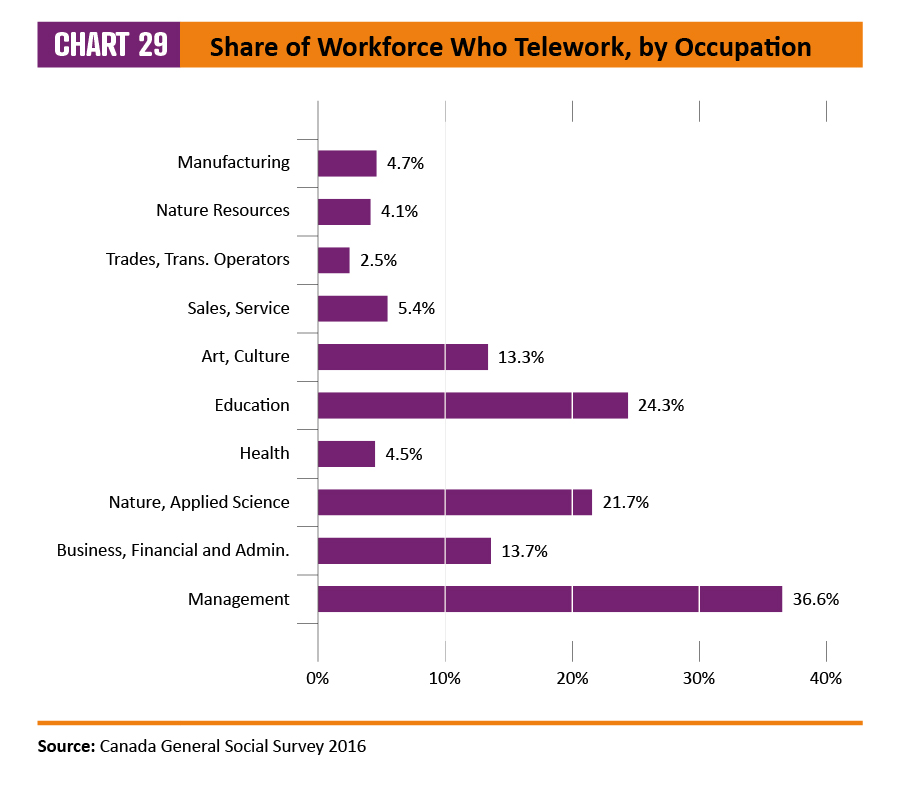
Chart 29: Share of workforce who telework by occupation – Text version
| Occupation | Share |
|---|---|
| Management | 36.6% |
| Business, Financial and Admin. | 13.7% |
| Nature, Applied Science | 21.7% |
| Health | 4.5% |
| Education | 24.3% |
| Art, Culture | 13.3% |
| Sales, Service | 5.4% |
| Trades, Trans. Operators | 2.5% |
| Nature Resources | 4.1% |
| Manufacturing | 4.7% |
Source: Canada General Social Survey 2016
The GSS data also show that teleworking could continue to grow over the 2016 to 2021 Census cycle and beyond.
- More than half of all jobs do not involve teleworking, but it is a possibility.
- About 1 job in 3 (34.7%) involves tasks that can only be done at the employer’s workplace.
- The remainder involve teleworking or working at home.
The combination of the tight labour market and large number of jobs that could be re-organized for teleworking raises the probability that teleworking will expand beyond the 2016 Census cycle.
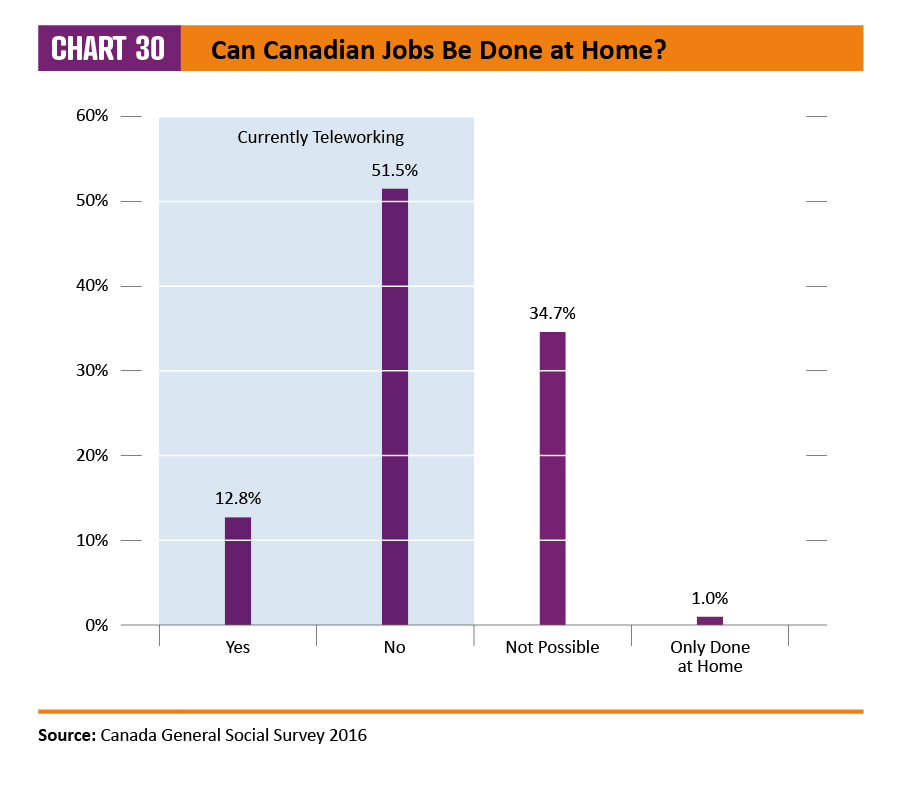
Chart 30: Can Canadian jobs be done at home? – Text version
| Responses | Percent |
|---|---|
| Yes | 12.8% |
| No | 51.5% |
| Not Possible | 34.7% |
| Only Done at Home | 1.0% |
Source: Canada General Social Survey 2016
Extending teleworking is likely to benefit designated groups greatly: nearly 70% of those who telework are designated group members. For example, nearly one-quarter of all teleworkers are persons with disabilities, while their workforce availability is 9.1%. This implies that persons with disabilities account for a disproportional share of those who telework.
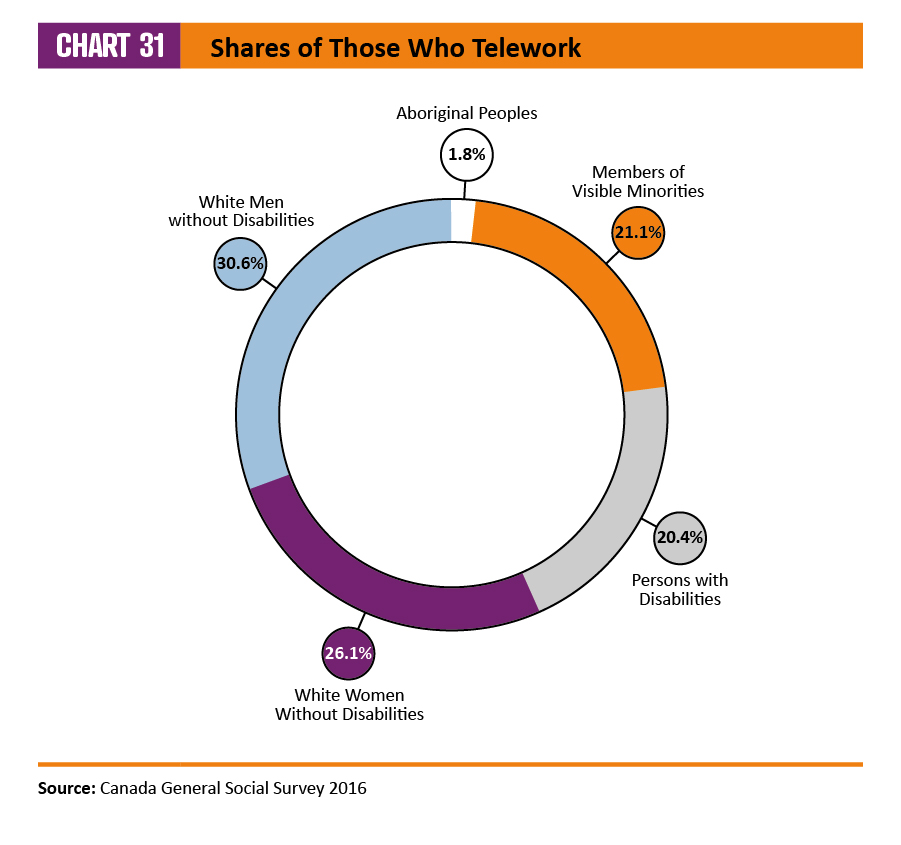
Chart 31: Shares of those who telework – Text version
| Groups | Shares |
|---|---|
| Aboriginal peoples | 1.8% |
| Members of visible minorities | 21.1% |
| Persons with disabilities | 20.4% |
| White women without disablilities | 26.1% |
| White men without disabilities | 30.6% |
Source: Canada General Social Survey 2016
Existing literature suggests that teleworking arrangements produce the best results when management acts to:
- select the most productive operations for teleworking (creative work or research improves with teleworking; repetitive tasks such as data entry deteriorate);
- discuss the reasons for teleworking and the criteria involved with all staff to avoid incurring workplace conflict;
- follow up on the results
Appendix B: Incompletely Enumerated Indian Reserves and Indian Settlements in the 2016 Population
| Indian Reserves and Settlements | 2011 | 2006 |
|---|---|---|
| Doncaster | n/a | n/a |
| Kahnawake | n/a | n/a |
| Kanesatake | n/a | n/a |
| Lac-Rapide | n/a | n/a |
| Indian Reserves and Settlements | 2011 | 2006 |
|---|---|---|
| Six Nations (Part) 40 | 946 | n/a |
| Six Nations (Part) 40 | 6,213 | n/a |
| Chippewas of tde Thames First Nation 42 | 762 | 747 |
| Oneida 41 | 1,282 | n/a |
| Wahta Mohawk Territory | n/a | n/a |
| Rankin Location 15D | n/a | 566 |
| Goulais Bay 15A | n/a | 82 |
| Pikangikum 14 | n/a | 2,100 |
| Indian Reserves and Settlements | 2011 | 2006 |
|---|---|---|
| Saddle Lake 125 | n/a | n/a |
| Indian Reserves and Settlements | 2011 | 2006 |
|---|---|---|
| Esquimalt | n/a | n/a |
“n/a”: not available for a specific reference period. Incompletely enumerated Indian reserve or Indian settlement.
Appendix C: Employment Equity Occupational Groups and their Corresponding Unit Groups (2016 NOC)
1. Senior managers [1]
0011 Legislators
0012 Senior government managers and officials
0013 Senior managers - financial, communications and other business services
0014 Senior managers - health, education, social and community services and membership organizations
0015 Senior managers - trade, broadcasting and other services, n.e.c. [2]
0016 Senior managers - construction, transportation, production and utilities
2. Middle and other managers [1]
0111 Financial managers
0112 Human resources managers
0113 Purchasing managers
0114 Other administrative services managers
0121 Insurance, real estate and financial brokerage managers
0122 Banking, credit and other investment managers
0124 Advertising, marketing and public relations managers
0125 Other business services managers
0131 Telecommunication carriers managers
0132 Postal and courier services managers
0211 Engineering managers
0212 Architecture and science managers
0213 Computer and information systems managers
0311 Managers in health care
0411 Government managers - health and social policy development and program administration
0412 Government managers - economic analysis, policy development and program administration
0413 Government managers - education policy development and program administration
0414 Other managers in public administration
0421 Administrators - post-secondary education and vocational training
0422 School principals and administrators of elementary and secondary education
0423 Managers in social, community and correctional services
0431 Commissioned police officers
0432 Fire chiefs and senior firefighting officers
0433 Commissioned officers of the Canadian Armed Forces
0511 Library, archive, museum and art gallery managers
0512 Managers - publishing, motion pictures, broadcasting and performing arts
0513 Recreation, sports and fitness program and service directors
0601 Corporate sales managers
0621 Retail and wholesale trade managers
0631 Restaurant and food service managers
0632 Accommodation service managers
0651 Managers in customer and personal services, n.e.c. [2]
0711 Construction managers
0712 Home building and renovation managers
0714 Facility operation and maintenance managers
0731 Managers in transportation
0811 Managers in natural resources production and fishing
0821 Managers in agriculture
0822 Managers in horticulture
0823 Managers in aquaculture
0911 Manufacturing managers
0912 Utilities managers
3. Professionals
1111 Financial auditors and accountants
1112 Financial and investment analysts
1113 Securities agents, investment dealers and brokers
1114 Other financial officers
1121 Human resources professionals
1122 Professional occupations in business management consulting
1123 Professional occupations in advertising, marketing and public relations
2111 Physicists and astronomers
2112 Chemists
2113 Geoscientists and oceanographers
2114 Meteorologists and climatologists
2115 Other professional occupations in physical sciences
2121 Biologists and related scientists
2122 Forestry professionals
2123 Agricultural representatives, consultants and specialists
2131 Civil engineers
2132 Mechanical engineers
2133 Electrical and electronics engineers
2134 Chemical engineers
2141 Industrial and manufacturing engineers
2142 Metallurgical and materials engineers
2143 Mining engineers
2144 Geological engineers
2145 Petroleum engineers
2146 Aerospace engineers
2147 Computer engineers (except software engineers and designers)
2148 Other professional engineers, n.e.c. [2]
2151 Architects
2152 Landscape architects
2153 Urban and land use planners
2154 Land surveyors
2161 Mathematicians, statisticians and actuaries
2171 Information systems analysts and consultants
2172 Database analysts and data administrators
2173 Software engineers and designers
2174 Computer programmers and interactive media developers
2175 Web designers and developers
3011 Nursing co-ordinators and supervisors
3012 Registered nurses and registered psychiatric nurses
3111 Specialist physicians
3112 General practitioners and family physicians
3113 Dentists
3114 Veterinarians
3121 Optometrists
3122 Chiropractors
3124 Allied primary health practitioners
3125 Other professional occupations in health diagnosing and treating
3131 Pharmacists
3132 Dietitians and nutritionists
3141 Audiologists and speech-language pathologists
3142 Physiotherapists
3143 Occupational therapists
3144 Other professional occupations in therapy and assessment
4011 University professors and lecturers
4012 Post-secondary teaching and research assistants
4021 College and other vocational instructors
4031 Secondary school teachers
4032 Elementary school and kindergarten teachers
4033 Educational counsellors
4111 Judges
4112 Lawyers and Quebec notaries
4151 Psychologists
4152 Social workers
4153 Family, marriage and other related counsellors
4154 Professional occupations in religion
4155 Probation and parole officers and related occupations
4156 Employment counsellors
4161 Natural and applied science policy researchers, consultants and program officers
4162 Economists and economic policy researchers and analysts
4163 Business development officers and marketing researchers and consultants
4164 Social policy researchers, consultants and program officers
4165 Health policy researchers, consultants and program officers
4166 Education policy researchers, consultants and program officers
4167 Recreation, sports and fitness policy researchers, consultants and program officers
4168 Program officers unique to government
4169 Other professional occupations in social science, n.e.c. [2]
5111 Librarians
5112 Conservators and curators
5113 Archivists
5121 Authors and writers
5122 Editors
5123 Journalists
5125 Translators, terminologists and interpreters
5131 Producers, directors, choreographers and related occupations
5132 Conductors, composers and arrangers
5133 Musicians and singers
5134 Dancers
5135 Actors and comedians
5136 Painters, sculptors and other visual artists
4. Semi-professionals and technicians
2211 Chemical technologists and technicians
2212 Geological and mineral technologists and technicians
2221 Biological technologists and technicians
2222 Agricultural and fish products inspectors
2223 Forestry technologists and technicians
2224 Conservation and fishery officers
2225 Landscape and horticulture technicians and specialists
2231 Civil engineering technologists and technicians
2232 Mechanical engineering technologists and technicians
2233 Industrial engineering and manufacturing technologists and technicians
2234 Construction estimators
2241 Electrical and electronics engineering technologists and technicians
2242 Electronic service technicians (household and business equipment)
2243 Industrial instrument technicians and mechanics
2244 Aircraft instrument, electrical and avionics mechanics, technicians and inspectors
2251 Architectural technologists and technicians
2252 Industrial designers
2253 Drafting technologists and technicians
2254 Land survey technologists and technicians
2255 Technical occupations in geomatics and meteorology
2261 Non-destructive testers and inspection technicians
2262 Engineering inspectors and regulatory officers
2263 Inspectors in public and environmental health and occupational health and safety
2264 Construction inspectors
2271 Air pilots, flight engineers and flying instructors
2272 Air traffic controllers and related occupations
2273 Deck officers, water transport
2274 Engineer officers, water transport
2275 Railway traffic controllers and marine traffic regulators
2281 Computer network technicians
2282 User support technicians
2283 Information systems testing technicians
3211 Medical laboratory technologists
3212 Medical laboratory technicians and pathologists' assistants
3213 Animal health technologists and veterinary technicians
3214 Respiratory therapists, clinical perfusionists and cardiopulmonary technologists
3215 Medical radiation technologists
3216 Medical sonographers
3217 Cardiology technologists and electrophysiological diagnostic technologists, n.e.c. [2]
3219 Other medical technologists and technicians (except dental health)
3221 Denturists
3222 Dental hygienists and dental therapists
3223 Dental technologists, technicians and laboratory assistants
3231 Opticians
3232 Practitioners of natural healing
3233 Licensed practical nurses
3234 Paramedical occupations
3236 Massage therapists
3237 Other technical occupations in therapy and assessment
4211 Paralegal and related occupations
4212 Social and community service workers
4214 Early childhood educators and assistants
4215 Instructors of persons with disabilities
4216 Other instructors
4217 Other religious occupations
4311 Police officers (except commissioned)
4312 Firefighters
4313 Non-commissioned ranks of the Canadian Armed Forces
5211 Library and public archive technicians
5212 Technical occupations related to museums and art galleries
5221 Photographers
5222 Film and video camera operators
5223 Graphic arts technicians
5224 Broadcast technicians
5225 Audio and video recording technicians
5226 Other technical and co-ordinating occupations in motion pictures, broadcasting and the performing arts
5227 Support occupations in motion pictures, broadcasting, photography and the performing arts
5231 Announcers and other broadcasters
5232 Other performers, n.e.c. [2]
5241 Graphic designers and illustrators
5242 Interior designers and interior decorators
5243 Theatre, fashion, exhibit and other creative designers
5244 Artisans and craftspersons
5245 Patternmakers - textile, leather and fur products
5251 Athletes
5252 Coaches
5253 Sports officials and referees
5254 Program leaders and instructors in recreation, sport and fitness
5. Supervisors
1211 Supervisors, general office and administrative support workers
1212 Supervisors, finance and insurance office workers
1213 Supervisors, library, correspondence and related information workers
1214 Supervisors, mail and message distribution occupations
1215 Supervisors, supply chain, tracking and scheduling co-ordination occupations
6211 Retail sales supervisors
6311 Food service supervisors
6312 Executive housekeepers
6313 Accommodation, travel, tourism and related services supervisors
6314 Customer and information services supervisors
6315 Cleaning supervisors
6316 Other services supervisors
6. Supervisors - crafts and trades
7201 Contractors and supervisors, machining, metal forming, shaping and erecting trades and related occupations
7202 Contractors and supervisors, electrical trades and telecommunications occupations
7203 Contractors and supervisors, pipefitting trades
7204 Contractors and supervisors, carpentry trades
7205 Contractors and supervisors, other construction trades, installers, repairers and servicers
7301 Contractors and supervisors, mechanic trades
7302 Contractors and supervisors, heavy equipment operator crews
7303 Supervisors, printing and related occupations
7304 Supervisors, railway transport operations
7305 Supervisors, motor transport and other ground transit operators
8211 Supervisors, logging and forestry
8221 Supervisors, mining and quarrying
8222 Contractors and supervisors, oil and gas drilling and services
8252 Agricultural service contractors, farm supervisors and specialized livestock workers
8255 Contractors and supervisors, landscaping, grounds maintenance and horticulture services
9211 Supervisors, mineral and metal processing
9212 Supervisors, petroleum, gas and chemical processing and utilities
9213 Supervisors, food and beverage processing
9214 Supervisors, plastic and rubber products manufacturing
9215 Supervisors, forest products processing
9217 Supervisors, textile, fabric, fur and leather products processing and manufacturing
9221 Supervisors, motor vehicle assembling
9222 Supervisors, electronics manufacturing
9223 Supervisors, electrical products manufacturing
9224 Supervisors, furniture and fixtures manufacturing
9226 Supervisors, other mechanical and metal products manufacturing
9227 Supervisors, other products manufacturing and assembly
7. Administrative and senior clerical personnel
1221 Administrative officers
1222 Executive assistants
1223 Human resources and recruitment officers
1224 Property administrators
1225 Purchasing agents and officers
1226 Conference and event planners
1227 Court officers and justices of the peace
1228 Employment insurance, immigration, border services and revenue officers
1241 Administrative assistants
1242 Legal administrative assistants
1243 Medical administrative assistants
1251 Court reporters, medical transcriptionists and related occupations
1252 Health information management occupations
1253 Records management technicians
1254 Statistical officers and related research support occupations
1311 Accounting technicians and bookkeepers
1312 Insurance adjusters and claims examiners
1313 Insurance underwriters
1314 Assessors, valuators and appraisers
1315 Customs, ship and other brokers
8. Skilled sales and service personnel
6221 Technical sales specialists - wholesale trade
6222 Retail and wholesale buyers
6231 Insurance agents and brokers
6232 Real estate agents and salespersons
6235 Financial sales representatives
6321 Chefs
6322 Cooks
6331 Butchers, meat cutters and fishmongers - retail and wholesale
6332 Bakers
6341 Hairstylists and barbers
6342 Tailors, dressmakers, furriers and milliners
6343 Shoe repairers and shoemakers
6344 Jewellers, jewellery and watch repairers and related occupations
6345 Upholsterers
6346 Funeral directors and embalmers
9. Skilled crafts and trades workers
7231 Machinists and machining and tooling inspectors
7232 Tool and die makers
7233 Sheet metal workers
7234 Boilermakers
7235 Structural metal and platework fabricators and fitters
7236 Ironworkers
7237 Welders and related machine operators
7241 Electricians (except industrial and power system)
7242 Industrial electricians
7243 Power system electricians
7244 Electrical power line and cable workers
7245 Telecommunications line and cable workers
7246 Telecommunications installation and repair workers
7247 Cable television service and maintenance technicians
7251 Plumbers
7252 Steamfitters, pipefitters and sprinkler system installers
7253 Gas fitters
7271 Carpenters
7272 Cabinetmakers
7281 Bricklayers
7282 Concrete finishers
7283 Tilesetters
7284 Plasterers, drywall installers and finishers and lathers
7291 Roofers and shinglers
7292 Glaziers
7293 Insulators
7294 Painters and decorators (except interior decorators)
7295 Floor covering installers
7311 Construction millwrights and industrial mechanics
7312 Heavy-duty equipment mechanics
7313 Heating, refrigeration and air conditioning mechanics
7314 Railway carmen/women
7315 Aircraft mechanics and aircraft inspectors
7316 Machine fitters
7318 Elevator constructors and mechanics
7321 Automotive service technicians, truck and bus mechanics and mechanical repairers
7322 Motor vehicle body repairers
7331 Oil and solid fuel heating mechanics
7332 Appliance servicers and repairers
7333 Electrical mechanics
7334 Motorcycle, all-terrain vehicle and other related mechanics
7335 Other small engine and small equipment repairers
7361 Railway and yard locomotive engineers
7362 Railway conductors and brakemen/women
7371 Crane operators
7372 Drillers and blasters - surface mining, quarrying and construction
7373 Water well drillers
7381 Printing press operators
7384 Other trades and related occupations, n.e.c. [2]
8231 Underground production and development miners
8232 Oil and gas well drillers, servicers, testers and related workers
8241 Logging machinery operators
8261 Fishing masters and officers
8262 Fishermen/women
9231 Central control and process operators, mineral and metal processing
9232 Central control and process operators, petroleum, gas and chemical processing
9235 Pulping, papermaking and coating control operators
9241 Power engineers and power systems operators
9243 Water and waste treatment plant operators
10. Clerical personnel
1411 General office support workers
1414 Receptionists
1415 Personnel clerks
1416 Court clerks
1422 Data entry clerks
1423 Desktop publishing operators and related occupations
1431 Accounting and related clerks
1432 Payroll administrators
1434 Banking, insurance and other financial clerks
1435 Collectors
1451 Library assistants and clerks
1452 Correspondence, publication and regulatory clerks
1454 Survey interviewers and statistical clerks
1511 Mail, postal and related workers
1512 Letter carriers
1513 Couriers, messengers and door-to-door distributors
1521 Shippers and receivers
1522 Storekeepers and partspersons
1523 Production logistics co-ordinators
1524 Purchasing and inventory control workers
1525 Dispatchers
1526 Transportation route and crew schedulers
11. Intermediate sales and service personnel
3411 Dental assistants
3413 Nurse aides, orderlies and patient service associates
3414 Other assisting occupations in support of health services
4411 Home child care providers
4412 Home support workers, housekeepers and related occupations
4413 Elementary and secondary school teacher assistants
4421 Sheriffs and bailiffs
4422 Correctional service officers
4423 By-law enforcement and other regulatory officers, n.e.c. [2]
6411 Sales and account representatives - wholesale trade (non-technical)
6421 Retail salespersons
6511 Maîtres d'hôtel and hosts/hostesses
6512 Bartenders
6513 Food and beverage servers
6521 Travel counsellors
6522 Pursers and flight attendants
6523 Airline ticket and service agents
6524 Ground and water transport ticket agents, cargo service representatives and related clerks
6525 Hotel front desk clerks
6531 Tour and travel guides
6532 Outdoor sport and recreational guides
6533 Casino occupations
6541 Security guards and related security service occupations
6551 Customer services representatives - financial institutions
6552 Other customer and information services representatives
6561 Image, social and other personal consultants
6562 Estheticians, electrologists and related occupations
6563 Pet groomers and animal care workers
6564 Other personal service occupations
12. Semi-skilled manual workers
7441 Residential and commercial installers and servicers
7442 Waterworks and gas maintenance workers
7444 Pest controllers and fumigators
7445 Other repairers and servicers
7451 Longshore workers
7452 Material handlers
7511 Transport truck drivers
7512 Bus drivers, subway operators and other transit operators
7513 Taxi and limousine drivers and chauffeurs
7514 Delivery and courier service drivers
7521 Heavy equipment operators (except crane)
7522 Public works maintenance equipment operators and related workers
7531 Railway yard and track maintenance workers
7532 Water transport deck and engine room crew
7533 Boat and cable ferry operators and related occupations
7534 Air transport ramp attendants
7535 Other automotive mechanical installers and servicers
8411 Underground mine service and support workers
8412 Oil and gas well drilling and related workers and services operators
8421 Chain saw and skidder operators
8422 Silviculture and forestry workers
8431 General farm workers
8432 Nursery and greenhouse workers
8441 Fishing vessel deckhands
8442 Trappers and hunters
9411 Machine operators, mineral and metal processing
9412 Foundry workers
9413 Glass forming and finishing machine operators and glass cutters
9414 Concrete, clay and stone forming operators
9415 Inspectors and testers, mineral and metal processing
9416 Metalworking and forging machine operators
9417 Machining tool operators
9418 Other metal products machine operators
9421 Chemical plant machine operators
9422 Plastics processing machine operators
9423 Rubber processing machine operators and related workers
9431 Sawmill machine operators
9432 Pulp mill machine operators
9433 Papermaking and finishing machine operators
9434 Other wood processing machine operators
9435 Paper converting machine operators
9436 Lumber graders and other wood processing inspectors and graders
9437 Woodworking machine operators
9441 Textile fibre and yarn, hide and pelt processing machine operators and workers
9442 Weavers, knitters and other fabric making occupations
9445 Fabric, fur and leather cutters
9446 Industrial sewing machine operators
9447 Inspectors and graders, textile, fabric, fur and leather products manufacturing
9461 Process control and machine operators, food and beverage processing
9462 Industrial butchers and meat cutters, poultry preparers and related workers
9463 Fish and seafood plant workers
9465 Testers and graders, food and beverage processing
9471 Plateless printing equipment operators
9472 Camera, platemaking and other prepress occupations
9473 Binding and finishing machine operators
9474 Photographic and film processors
9521 Aircraft assemblers and aircraft assembly inspectors
9522 Motor vehicle assemblers, inspectors and testers
9523 Electronics assemblers, fabricators, inspectors and testers
9524 Assemblers and inspectors, electrical appliance, apparatus and equipment manufacturing
9525 Assemblers, fabricators and inspectors, industrial electrical motors and transformers
9526 Mechanical assemblers and inspectors
9527 Machine operators and inspectors, electrical apparatus manufacturing
9531 Boat assemblers and inspectors
9532 Furniture and fixture assemblers and inspectors
9533 Other wood products assemblers and inspectors
9534 Furniture finishers and refinishers
9535 Plastic products assemblers, finishers and inspectors
9536 Industrial painters, coaters and metal finishing process operators
9537 Other products assemblers, finishers and inspectors
13. Other sales and service personnel
6611 Cashiers
6621 Service station attendants
6622 Store shelf stockers, clerks and order fillers
6623 Other sales related occupations
6711 Food counter attendants, kitchen helpers and related support occupations
6721 Support occupations in accommodation, travel and facilities set-up services
6722 Operators and attendants in amusement, recreation and sport
6731 Light duty cleaners
6732 Specialized cleaners
6733 Janitors, caretakers and building superintendents
6741 Dry cleaning, laundry and related occupations
6742 Other service support occupations, n.e.c. [2]
14. Other manual workers
7611 Construction trades helpers and labourers
7612 Other trades helpers and labourers
7621 Public works and maintenance labourers
7622 Railway and motor transport labourers
8611 Harvesting labourers
8612 Landscaping and grounds maintenance labourers
8613 Aquaculture and marine harvest labourers
8614 Mine labourers
8615 Oil and gas drilling, servicing and related labourers
8616 Logging and forestry labourers
9611 Labourers in mineral and metal processing
9612 Labourers in metal fabrication
9613 Labourers in chemical products processing and utilities
9614 Labourers in wood, pulp and paper processing
9615 Labourers in rubber and plastic products manufacturing
9616 Labourers in textile processing
9617 Labourers in food and beverage processing
9618 Labourers in fish and seafood processing
9619 Other labourers in processing, manufacturing and utilities
Footnotes
[1] Please note that management occupations are not assigned to a skill level category because factors other than education and training (e.g. previous experience, capital) are often more significant determinants for employment.
[2] n.e.c. = not elsewhere classified
Appendix D: Employment Equity Occupational group definitions
1. Senior managers
Employees holding the most senior positions in large firms or corporations. They are responsible for the corporation’s policy and strategic planning, and for directing and controlling the functions of the organization.
Examples: President, chief executive officer, vice-presidents, chief operating officer, senior government officials, general managers and divisional heads, and directors who have several middle managers reporting to them or are responsible for the direction of a critical technical function.
2. Middle and other managers
Middle and other managers receive instructions from senior managers and administer the organization’s policy and operations through subordinate managers or supervisors. Senior managers and middle and other managers comprise all managers.
Examples: Managers of transport operations, communications, finances, human resources, sales, advertising, purchasing, production, marketing, research and development, information systems, maintenance; commissioned police officers, commissioned officers in the armed forces.
3. Professionals
Professionals usually need either university graduation or prolonged formal training and often have to be members of a professional organization.
Examples: Engineers (civil, mechanical, electrical, petroleum, nuclear, aerospace), chemists, biologists, architects, economists, lawyers, teachers, doctors, accountants, computer programmers, registered nurses, physiotherapists, ministers of religion.
4. Semi-professionals and technicians
Workers in these occupations have to possess knowledge equivalent to about two years of post‑secondary education, offered in many technical institutions and community colleges, and often have further specialized on-the-job training. They may have highly developed technical and/or artistic skills.
Examples: Technologists and technicians (broadcast, forestry, biological, electronic, meteorological, geological, surveying, drafting and design, engineering, library, medical, dental), specialized inspectors and testers (public and environmental health, occupational health and safety, engineering, industrial instruments), dental hygienists, midwives, ambulance attendants, paralegal workers, graphic designers and illustrating artists, announcers and other broadcasters, coaches.
5. Supervisors
Non-management first-line coordinators of white-collar (administrative, clerical, sales, and service) workers. Supervisors may, but do not usually, perform any of the duties of the employees under their supervision.
Examples: Supervisors of administrative and clerical workers such as general office clerks, secretaries, word processing operators, receptionists, and switchboard operators, computer operators, accounting clerks, letter carriers, tellers; supervisors of sales workers such as airline sales agents, service station attendants, grocery clerks and shelf stockers, cashiers; and supervisors of service workers such as food and beverage workers, canteen workers, hotel housekeeping, and cleaning workers, dry cleaning and laundry workers, janitors, groundspeople, tour guides, parking lot attendants.
6. Supervisors: crafts and trades
Non-management first-line coordinators of workers in manufacturing, processing, trades, and primary industry occupations. They supervise skilled crafts and trades workers, semi-skilled manual workers, and/or other manual workers. Supervisors may, but do not usually, perform any of the duties of the employees under their supervision.
Examples: Supervisors of workers in manufacturing (motor vehicle assembling, electronics, electrical, furniture, fabric, etc.), processing (mineral and metal, chemical, food and beverage, plastic and rubber, textiles, etc.), trades (carpentry, mechanical, heavy construction equipment, printing, etc.), and primary industry (forestry, logging, mining and quarrying, oil and gas, agriculture and farms, etc.).
7. Administrative and senior clerical personnel
Workers in these occupations carry out and coordinate administrative procedures and administrative services primarily in an office environment, or perform clerical work of a senior nature.
Examples: Administrative officers, executive assistants, personnel and recruitment officers, loan officers, insurance adjusters, secretaries, legal secretaries, medical secretaries, court recorders, property administrators.
8. Skilled sales and service personnel
Highly skilled workers engaged wholly or primarily in selling or in providing personal service. These workers have a thorough and comprehensive knowledge of the processes involved in their work and usually have received an extensive period of training involving some post-secondary education, part or all of an apprenticeship, or the equivalent on-the-job training and work experience.
Examples: Sales – insurance agents and brokers, real estate agents, retail and wholesale buyers, technical sales specialists. Service: chefs, cooks, butchers, bakers, funeral directors, and embalmers.
9. Skilled crafts and trades workers
Manual workers of a high skill level, having a thorough and comprehensive knowledge of the processes involved in their work. They are frequently journeymen and journeywomen who have received an extensive period of training.
Examples: Sheet metal workers, plumbers, electricians, tool and die makers, carpenters, glaziers, welders, telecommunications line and cable, installation and repair technicians; mechanics (heavy duty, refrigeration, aircraft, elevator, motor vehicle), oil and gas well drillers, fishing masters and officers, paper making control operators.
10. Clerical personnel
Workers performing clerical work, other than senior clerical work.
Examples: General office and other clerks (data entry, records and file, accounting, payroll, administrative, personnel, library, purchasing, storekeepers and parts, mail and postal, insurance clerks, customer service, statistics, purchasing and inventory clerks), typists and word processing operators, receptionists and switchboard operators, computer operators, typesetters, dispatchers and radio operators, couriers and messengers, letter carriers, tellers.
11. Intermediate sales and service personnel
Workers engaged wholly or primarily in selling or in providing personal service who perform duties that may require from a few months up to two years of on-the-job training, training courses, or specific work experience. Generally, these are workers whose skill level is less than that of skilled sales and service, but greater than that of elementary sales and service workers.
Examples: Sales – airline sales agents, non-technical wholesale sales representatives, retail salespersons. Service – dental assistants, nurses aides and orderlies, tour and travel guides, hotel front desk clerks, correctional service officers, sheriffs and bailiffs, bartenders, nannies, aestheticians, pet groomers.
12. Semi-skilled manual workers
Manual workers who perform duties that usually require a few months of specific vocational on-the-job training. Generally, these are workers whose skill level is less than that of skilled crafts and trades workers, but greater than that of elementary manual workers.
Examples: Truck drivers; railway yard workers; longshore workers; material handlers; foundry workers; machine operators (plastics processing, chemical plant, sawmill, textile, pulp mill, tobacco, welding); workers assembling, inspecting, or testing products (motor vehicles, boats, electrical motors, furniture).
13. Other sales and service personnel
Workers in sales and service jobs that generally require only a few days or no on-the-job training. The duties are elementary and require little or no independent judgement.
Examples: Sales – service station attendants, grocery clerks, and shelf stockers, cashiers. Service – security guards, janitors, kitchen and food service helpers, dry cleaning and laundry occupations, attendants in recreation and sport.
14. Other manual workers
Workers in blue-collar jobs which generally require only a few days or no on-the-job training or a short demonstration. The duties are manual, elementary, and require little or no independent judgement.
Examples: Helpers and labourers in construction and other trades (plumber assistants, carpenter helpers, refrigeration mechanic helpers, surveyor helpers), garbage collectors, road maintenance workers, railway labourers, tobacco or fruit pickers, landscape labourers, fish farm helpers, roustabouts, roughnecks, swampers, labourers in processing industry.
Appendix E: Census Metropolitan Areas (CMAs) and their Census Subdivision Components
List of 35 Census Metropolitan Areas (2016 CMA Boundaries)
St. John's
- St. John's
- Conception Bay South
- Mount Pearl
- Paradise
- Portugal Cove-St. Philip's
- Torbay
- Logy Bay-Middle Cove-Outer Cove
- Pouch Cove
- Flatrock
- Witless Bay
- Bay Bulls
- Petty Harbour-Maddox Cove
- Bauline
Halifax
- Halifax
- Cole Harbour 30
- Sheet Harbour 36
- Beaver Lake 17
- Wallace Hills 14A
- Shubenacadie 13
Moncton
- Moncton, City
- Dieppe
- Riverview
- Moncton, Parish
- Memramcook
- Coverdale
- Salisbury
- Hillsborough, Parish
- Hillsborough, Village
- Dorchester
- Elgin
- Saint-Paul
- Hopewell
- Dorchester
- Fort Folly 1
Saint John
- Saint John
- Quispamsis
- Rothesay
- Grand Bay-Westfield
- Hampton
- Simonds
- Kingston
- Hampton, P
- Westfield
- Norton
- Upham
- Musquash
- Saint Martins
- Greenwich
- Lepreau
- Petersville
- Rothesay
- St. Martins
Montréal
- Montréal
- Laval
- Longueuil
- Terrebonne
- Saint-Jean-sur-Richelieu
- Brossard
- Repentigny
- Saint-Jérôme
- Blainville
- Mirabel
- Dollard-Des Ormeaux
- Châteauguay
- Mascouche
- Saint-Eustache
- Boucherville
- Vaudreuil-Dorion
- Côte-Saint-Luc
- Pointe-Claire
- Sainte-Julie
- Chambly
- Saint-Constant
- Boisbriand
- Saint-Bruno-de-Montarville
- Sainte-Thérèse
- La Prairie
- Beloeil
- L'Assomption
- Saint-Lambert
- Varennes
- Candiac
- Saint-Lin--Laurentides
- Westmount
- Mont-Royal
- Kirkland
- Saint-Lazare
- Beaconsfield
- Dorval
- Mont-Saint-Hilaire
- Sainte-Marthe-sur-le-Lac
- Deux-Montagnes
- Saint-Basile-le-Grand
- Sainte-Catherine
- Saint-Colomban
- Pincourt
- Sainte-Anne-des-Plaines
- Rosemère
- Lavaltrie
- Mercier
- Beauharnois
- Saint-Amable
- L'Île-Perrot
- Notre-Dame-de-l'Île-Perrot
- Bois-des-Filion
- Carignan
- Lorraine
- Otterburn Park
- Saint-Zotique
- Delson
- Coteau-du-Lac
- Hampstead
- Les Cèdres
- Saint-Joseph-du-Lac
- Pointe-Calumet
- Saint-Philippe
- Charlemagne
- Verchères
- McMasterville
- L'Épiphanie
- Les Coteaux
- Richelieu
- Hudson
- Montréal-Ouest
- Sainte-Anne-de-Bellevue
- Saint-Mathias-sur-Richelieu
- Montréal-Est
- Oka
- Baie-D'Urfé
- Saint-Sulpice
- L'Épiphanie
- Saint-Mathieu-de-Beloeil
- Saint-Isidore
- Léry
- Saint-Mathieu
- Terrasse-Vaudreuil
- Gore
- Saint-Placide
- Pointe-des-Cascades
- Vaudreuil-sur-le-Lac
- Senneville
- L'Île-Cadieux
- L'Île-Dorval
- Kahnawake
- Kanesatake
Ottawa - Gatineau
- Ottawa
- Gatineau
- Clarence-Rockland
- Russell
- North Grenville
- Val-des-Monts
- Cantley
- La Pêche
- Chelsea
- Pontiac
- L'Ange-Gardien
- Thurso
- Val-des-Bois
- Lochaber-Partie-Ouest
- Notre-Dame-de-la-Salette
- Bowman
- Mayo
- Denholm
- Lochaber
Québec
- Québec
- Lévis
- Saint-Augustin-de-Desmaures
- L'Ancienne-Lorette
- Stoneham-et-Tewkesbury
- Lac-Beauport
- Sainte-Catherine-de-la-Jacques-Cartier
- Boischatel
- Sainte-Brigitte-de-Laval
- Saint-Lambert-de-Lauzon
- Shannon
- Saint-Henri
- Neuville
- Château-Richer
- L'Ange-Gardien
- Saint-Gabriel-de-Valcartier
- Beaumont
- Wendake
- Saint-Pierre-de-l'Île-d'Orléans
- Fossambault-sur-le-Lac
- Saint-Antoine-de-Tilly
- Saint-Laurent-de-l'Île-d'Orléans
- Saint-Jean-de-l'Île-d'Orléans
- Sainte-Pétronille
- Sainte-Famille
- Lac-Delage
- Saint-François-de-l'Île-d'Orléans
- Notre-Dame-des-Anges
- Lac-Saint-Joseph
Sherbrooke
- Sherbrooke
- Magog
- Orford
- Saint-Denis-de-Brompton
- Ascot Corner
- Compton
- Stoke
- Waterville
- Hatley
- Val-Joli
- North Hatley
Saguenay
- Saguenay
- Saint-Honoré
- Saint-David-de-Falardeau
- Saint-Fulgence
- Larouche
- Saint-Félix-d'Otis
- Bégin
- Saint-Charles-de-Bourget
- Sainte-Rose-du-Nord
Trois-Rivières
- Trois-Rivières
- Bécancour
- Saint-Maurice
- Yamachiche
- Champlain
- Saint-Luc-de-Vincennes
- Wôlinak
Toronto
- Toronto
- Mississauga
- Brampton
- Markham
- Vaughan
- Richmond Hill
- Oakville
- Ajax
- Milton
- Pickering
- Newmarket
- Caledon
- Halton Hills
- Aurora
- Whitchurch-Stouffville
- Georgina
- Bradford West Gwillimbury
- New Tecumseth
- Orangeville
- King
- East Gwillimbury
- Uxbridge
- Mono
- Chippewas of Georgina Island First Nation
Hamilton
- Hamilton
- Burlington
- Grimsby
Kitchener - Cambridge - Waterloo
- Kitchener
- Cambridge
- Waterloo
- Woolwich
- Wilmot
- North Dumfries
London
- London
- St. Thomas
- Strathroy-Caradoc
- Middlesex Centre
- Thames Centre
- Central Elgin
- Southwold
- Adelaide-Metcalfe
St. Catharines - Niagara
- St. Catharines
- Niagara Falls
- Welland
- Fort Erie
- Lincoln
- Thorold
- Port Colborne
- Niagara-on-the-Lake
- Pelham
- Wainfleet
Oshawa
- Oshawa
- Whitby
- Clarington
Windsor
- Windsor
- Lakeshore
- LaSalle
- Tecumseh
- Amherstburg
Barrie
- Barrie
- Innisfil
- Springwater
Greater Sudbury
- Greater Sudbury / Grand Sudbury
- Markstay-Warren
- Whitefish Lake 6
- Wahnapitei 11
Kingston
- Kingston
- South Frontenac
- Loyalist
- Frontenac Islands
Guelph
- Guelph
- Guelph/Eramosa
- Puslinch
Brantford
- Brantford
- Brant
- Six Nations (Part) 40
Peterborough
- Peterborough
- Selwyn
- Cavan Monaghan
- Douro-Dummer
- Otonabee-South Monaghan
- Curve Lake First Nation 35
- Hiawatha First Nation
Thunder Bay
- Thunder Bay
- Oliver Paipoonge
- Shuniah
- Neebing
- Fort William 52
- Conmee
- O'Connor
- Gillies
Belleville
- Belleville
- Quinte West
- Stirling-Rawdon
- Tyendinaga
Winnipeg
- Winnipeg
- Springfield
- Taché
- St. Clements
- East St. Paul
- Macdonald
- Ritchot
- West St. Paul
- Headingley
- St. François Xavier
- Rosser
- Brokenhead 4
Saskatoon
- Saskatoon
- Warman
- Martensville
- Corman Park No. 344
- Vanscoy No. 345
- Dundurn No. 314
- Blucher No. 343
- Dalmeny
- Langham
- Aberdeen No. 373
- Osler
- Delisle
- Allan
- Asquith
- Aberdeen
- Dundurn
- Vanscoy
- Colonsay
- Whitecap
- Clavet
- Shields
- Colonsay No. 342
- Bradwell
- Thode
- Meacham
Regina
- Regina
- Edenwold No. 158
- White City
- Pilot Butte
- Lumsden No. 189
- Lumsden
- Balgonie
- Lajord No. 128
- Regina Beach
- Sherwood No. 159
- Grand Coulee
- Buena Vista
- Pense
- Pense No. 160
- Edenwold
- Belle Plaine
- Disley
- Lumsden Beach
Calgary
- Calgary
- Airdrie
- Rocky View County
- Cochrane
- Chestermere
- Crossfield
- Tsuu T'ina Nation 145 (Sarcee 145)
- Irricana
- Beiseker
Edmonton
- Edmonton
- Strathcona County
- St. Albert
- Spruce Grove
- Parkland County
- Leduc
- Fort Saskatchewan
- Sturgeon County
- Beaumont
- Stony Plain
- Leduc County
- Morinville
- Devon
- Gibbons
- Calmar
- Redwater
- Stony Plain 135
- Wabamun 133A
- Bon Accord
- Legal
- Bruderheim
- Alexander 134
- Thorsby
- Warburg
- Spring Lake
- Wabamun
- Seba Beach
- Golden Days
- Sundance Beach
- Wabamun 133B
- Lakeview
- Itaska Beach
- Betula Beach
- Kapasiwin
- Point Alison
Lethbridge
- Lethbridge
- Lethbridge County
- Coaldale
- Coalhurst
- Picture Butte
- Nobleford
- Barons
Vancouver
- Vancouver
- Surrey
- Burnaby
- Richmond
- Coquitlam
- Langley
- Delta
- North Vancouver
- Maple Ridge
- New Westminster
- Port Coquitlam
- North Vancouver
- West Vancouver
- Port Moody
- Langley
- White Rock
- Pitt Meadows
- Greater Vancouver A
- Bowen Island
- Capilano 5
- Anmore
- Burrard Inlet 3
- Musqueam 2
- Lions Bay
- Tsawwassen
- Belcarra
- Mission 1
- Matsqui 4
- Katzie 1
- Seymour Creek 2
- Semiahmoo
- McMillan Island 6
- Coquitlam 1
- Barnston Island 3
- Katzie 2
- Musqueam 4
- Coquitlam 2
- Langley 5
- Whonnock 1
Victoria
- Saanich
- Victoria
- Langford
- Oak Bay
- Esquimalt
- Colwood
- Central Saanich
- Sooke
- Sidney
- North Saanich
- View Royal
- Metchosin
- Juan de Fuca (Part 1)
- Highlands
- New Songhees 1A
- East Saanich 2
- South Saanich 1
- Cole Bay 3
- T'Sou-ke
- Becher Bay 1
- Union Bay 4
- Esquimalt
Kelowna
- Kelowna
- West Kelowna
- Lake Country
- Tsinstikeptum 9
- Peachland
- Central Okanagan
- Central Okanagan J
- Duck Lake 7
- Tsinstikeptum 10
Abbotsford - Mission
- Abbotsford
- Mission
- Upper Sumas 6
- Matsqui Main 2
List of the eight Designated Census Metropolitan Areas as stipulated by the Employment Equity Regulations, Schedule I, Subsection 1(1)
- Calgary, Alberta
- Edmonton, Alberta
- Halifax, Nova Scotia
- Montréal, Quebec
- Regina, Saskatchewan
- Toronto, Ontario
- Vancouver, British Columbia
- Winnipeg, Manitoba
Appendix F: Data Variables
Geography
Canada
Provinces/Territories
- Newfoundland and Labrador
- Prince Edward Island
- Nova Scotia
- New Brunswick
- Quebec
- Ontario
- Manitoba
- Saskatchewan
- Alberta
- British Columbia
- Yukon Territory
- Northwest Territories
- Nunavut
Census Metropolitan Areas
- St.John’s
- Halifax
- Moncton
- Saint John
- Saguenay
- Québec
- Sherbrooke
- Trois-Rivières
- Montréal
- Ottawa-Gatineau
- Kingston
- Peterborough
- Oshawa
- Toronto
- Hamilton
- St. Catharines–Niagara
- Kitchener–Cambridge–Waterloo
- Brantford
- Guelph
- London
- Windsor
- Barrie
- Greater Sudbury
- Thunder Bay
- Bellville
- Winnipeg
- Regina
- Saskatoon
- Calgary
- Edmonton
- Lethbridge
- Kelowna
- Abbotsford–Mission
- Vancouver
- Victoria
Employment Equity Occupational Groups (2016 NOC)
- 1) Senior managers
- 2) Middle and other managers
- 3) Professionals
- 4) Semi-professionals and technicians
- 5) Supervisors
- 6) Supervisors: crafts and trades
- 7) Administrative and senior clerical personnel
- 8) Skilled sales and service personnel
- 9) Skilled crafts and trades workers
- 10) Clerical personnel
- 11) Intermediate sales and service personnel
- 12) Semi-skilled manual workers
- 13) Other sales and service personnel
- 14) Other manual workers
Appendix G: References
Introduction
Employment Equity Act: Annual Report 2017
Grad,L., Maselli, I., & Steemers, F. (2018). Global Labour Market Outlook 2018: Finding Ways to Counteract Worker Shortages. New York, Conference Board Research Report 1657.
World Economic Forum (2016). The Future of Jobs: Employment, Skills and Workforce Strategy for the Fourth Industrial Revolution. Geneva, World Economic Forum.
Women
Canada-United States Council for Advancement of Women as Entrepreneurs and Business Leaders (2018). Advancing Women as Leaders in the Private Sector.
Canada-United States Council for Advancement of Women as Entrepreneurs and Business Leaders (2018). Increasing the Number of Women in Science, Technology, Engineering and Mathematics.
Catalyst (2018). Why Diversity and Inclusion Matter: Financial Performance; Catalyst.
The Conference Board of Canada (2018); Measuring Up: Benchmarking Diversity and Inclusion in Canadian Organizations. The Conference Board of Canada.
Edge, Jessica, Eleni Kachulls and Matthew McKean (2018). Gender Equity, Diversity, and Inclusion: Business and Higher Education Perspectives. The Conference Board of Canada.
McKinsey and Company (2018). Women in the Workplace 2018; Boston.
OECD (2018); Education at a Glance. Paris, OECD.
Wall, Katherine, John Zhao, Sarah-Jane Ferguson and Carlos Rodriguez (2018). “Results from the 2016 Census: Is field of study a factor in the pay-off of a graduate degree?”; Statistics Canada, Insights on Canadian Society.
Aboriginal peoples
MacLaine, Cameron, Melissa Lalonde and Adam Fiser (2019); Working Together: Indigenous Recruiting and Retention in Remote Canada; Ottawa, The Conference Board of Canada.
Members of visible minorities
Annen, Silvia (2018); “Recognition and Utilization of Foreign Qualification and Skills in the Canadian Labour Market; The International Journal of Community Diversity, Vol. 18, Issue 1.
Organization for International Co-operation and Development (2018); Education at a Glance; Paris, OECD.
Organization for International Co-operation and Development (2018); International Migration Review; Paris, OECD.
Ottaviano, Gianmarco I. P., and Giovanni Peri (2003), “The Economic Value of Cultural Diversity”; CESifo Working Paper 1117.
Schwab, Klaus, ed. (2018); World Competitiveness Report; World Economic Forum, Geneva.
Recent trends in workplace practices
Boell, Sebastian K., Dubravka Cecez-Kecmanovic and John Campbell (2016); “Telework Paradoxes and Practices: The Importance of the Nature of the work”; New Technology, Work and Employment 31:2.
Levanon, Gad, Elizabeth Crofoot and Brian Schaitkin (2018); “Contrary to the Hype: Real Trends in Non-Traditional Work”; The Conference Board, Research Report 1673-18.
Messenger, Jon C., and Lutz Gschwind (2016); “Three Generations of Telework: New ICTs and the (R) evolution from Home Office to Virtual Office”; New Technology, Work and Employment, 31(3).
John A. Pearce II (2008); “Successful Corporate Telecommuting with Technology Considerations for Late Adopters”; Organizational Dynamics, Vol. 38, No. 1.
The value of inclusion and diversity
Ali, Muhammad, Isabel Metz and Carol T. Kulik (2015); Retaining a diverse workforce: the impact of gender‐focused human resource management; Human Resource Management Journal.
Angele, Susan M. (2018); “Leverage Diversity for Better Decisions”; KPMG, New York.
Buttner, E. Holly, and Kevin B. Lowe (2017); “Addressing Internal Stakeholders’ Concerns: The Interactive Effect of Perceived Pay Equity and Diversity Climate on Turnover Intentions”; Journal of Business Ethics, Volume 143, Issue 3, pp 621–633
Conference Board of Canada (2018); Measuring Up: Benchmarking Diversity and Inclusion in Canadian Organizations; Ottawa, The Conference Board of Canada.
Galinsky, Adam D., Andrew R. Todd, Astrid C. Homan, Katherine W. Phillips, Evan P. Apfelbaum, Stacey J. Sasaki, Jennifer A. Richeson, Jennifer B. Olayon, and William W. Maddux (2015); “Maximizing the Gains and Minimizing the Pains of Diversity: A Policy Perspective”; Perspectives on Psychological Science, Vol. 10(6).
Hewlett, Sylvia Ann, Melinda Marshall, Laura Sherbin and Tara Gonzalves (2013); Diversity, Innovation and Market Growth; New York, Center for Talent Innovation.
Hofhuis, Joep, Pernill G. A. van der Rijt and Martijn Vlug (2016); “Diversity climate enhances work outcomes through trust and openness in workgroup communication ”; Springer Plus.
Hunt, Vivian, Sara Prince, Sundiafu Dixon-Fyle and Loreina Lee (2015); Delivering Through Diversity (PDF, 6.52 MB), McKinsey & Company, New York.
Ottaviano, Gianmarco I. P., and Giovanni Peri (2003), “The Economic Value of Cultural Diversity”; CESifo Working Paper 1117.
Rocío, Lorenzo, Nicole Voigt, Karin Schetelig, Annika Zawadzki, Isabell M. Welpe, and Prisca Brosi (2017); The Mix That Matters: Innovation Through Diversity; Boston, The Boston Consulting Group.
Sujin Jang (2017) “Cultural Brokerage and Creative Performance in Multicultural Teams”; Organization Science 28(6):993-1009.
Williams, Maxine (2017); “Numbers Take Us only So Far”; Harvard Business Review, November-December 2017.