
Employment Equity Act: Annual Report 2019
On this page
- 2019 message from the Minister
- Introduction
- Section 1: The federally regulated private sector
- Section 2: Sector profiles
- Section 3: Designated group profiles
- Section 4: Employment equity program highlights
- Conclusion
- Appendix A: Federally regulated private sector employers tables
- Appendix B: Technical notes
Alternate formats

Employment Equity Act: Annual Report 2019[PDF - 1.90 MB]
Large print, braille, MP3 (audio), e-text and DAISY formats are available on demand by ordering online or calling 1 800 O-Canada (1-800-622-6232). If you use a teletypewriter (TTY), call 1-800-926-9105.
2019 message from the Minister
As the new Minister of Labour, I am pleased to present the Employment Equity Act: Annual Report 2019. This report demonstrates the ongoing efforts of employers in the federally regulated private sector to ensure equity in workplaces across the country for the 4 designated groups under the Employment Equity Act (women, Aboriginal peoples, persons with disabilities and members of visible minorities).
The 2019 report demonstrates that, overall, workplace representation of persons with disabilities and members of visible minorities has increased. It also shows that the representation of women in senior management positions exceeded labour market availability at the national level and at the industrial sector level. In addition, both women and members of visible minorities in middle management occupations continue to surpass labour market availability at the national level.
These results demonstrate the success of our continued efforts and commitment to making federally regulated workplaces more equitable and inclusive. Over the last 4 years, the Government has introduced a number of new pieces of legislation and regulations that will make a real difference for Canadians:
- We introduced proactive pay equity legislation to ensure that women and men receive equal pay for work of equal value, as well as new pay transparency measures to address wage gaps that affect not only women, but also other groups, including Aboriginal peoples, persons with disabilities and members of visible minorities
- We are helping employees improve their overall work-life balance by bringing federal labour standards into the 21st century
- We also recently published the final Workplace Harassment and Violence Prevention Regulations to better protect Canadian workers from harmful behaviours in the workplace. The Regulations, along with the legislation (Bill C-65), will come into force on January 1, 2021
These and other measures will help ensure that workers in the federally regulated private sector have good quality jobs and, at the same time, will support employers in creating a supportive and positive work environment that attracts and retains talent.
We know that we need to do more.
The COVID-19 pandemic has touched every part of Canadian society; however, the pandemic is disproportionately impacting certain groups. For example, front-line workers are predominantly women, and many of them have had to balance work with increased child care responsibilities as a result of school and daycare closures. This situation amplifies the social and economic barriers they face, in some cases putting them at greater risk of stress, job loss, poverty and domestic violence.
While this unprecedented situation is undoubtedly creating many challenges, it is also an opportunity to make meaningful and lasting change. The decisions we make today will impact the workplaces of tomorrow. Together, let’s seize this opportunity to create more equitable, inclusive, respectful and secure workplaces where everyone has an equal and fair chance to succeed.
The Honourable Filomena Tassi, P.C., M.P.
Minister of Labour
Introduction
Under the Employment Equity Act (the Act), the Minister responsible for Labour must submit an annual report to Parliament on the status of employment equity in the federally regulated private sector.Footnote 1
The purpose of the Act is to achieve equality in the workplace so that no person shall be denied employment opportunities or benefits for reasons unrelated to ability. In the fulfilment of that goal, the Act seeks to correct the conditions of disadvantage in employment experienced by women, Aboriginal peoples, persons with disabilities and members of visible minorities.
The Act gives effect to the principle that employment equity means more than treating persons in the same way but also requires special measures and the accommodation of differences.
This report consolidates and highlights the results achieved by employers subject to the Legislated Employment Equity ProgramFootnote 2 during the 2018 calendar year for the 4 designated groups: women, Aboriginal peoples, persons with disabilities and members of visible minorities. While information from the employers’ submitted narrative reports is not consolidated in this report, it is used in program and policy development.
Data from 2017 is included throughout the report to allow for year-to-year comparisons.
Federally regulated private sector
Employers are organized by sector, based on the classification of the majority of their workforce using the North American Industry Classification System (NAICS). The federally regulated private sector workforce comprises 4 industrial sectors:
- Banking and financial services: Includes all major Canadian banks and other establishments primarily engaged in financial transactions or in facilitating financial transactions
- Communications: Comprises businesses that operate radio and television broadcasting studios and facilities, as well as telecommunications services providers
- Transportation: Consists of employers in:
- air, rail, bus, water and pipeline transportation industries
- inter-provincial trucking
- postal service
- couriers
- warehousing and storage
- Other: Encompasses a diverse group of employers working in industries such as:
- nuclear power generation
- metal ore mining
- professional, scientific and technical services
- investigation and security services, and
- public administration
About the data
Employment equity requires the establishment of working conditions that are free of barriers, corrects the conditions of disadvantage in employment and promotes the principle that equality requires special measures and the accommodation of differences.
A key indicator of employment equity is the extent to which the representation of members of designated groups in the employers’ workforce meets their representationFootnote 3 in the Canadian workforce. The representation of each of the 4 designated groups is compared to their availability in the Canadian labour market, referred to as labour market availabilityFootnote 4(LMA). A workforce is considered fully representative when the representation of designated group members is equal to their LMA.
The extent to which the representation of a particular designated group approaches, meets or surpasses LMA is referred to as the attainment rateFootnote 5. This indicator allows for the identification of gaps between the representation of a particular designated group and its LMA. For example, if a designated group’s representation is below its LMA, the attainment rate will be less than 100% and further analysis may be required to identify if barriers to employment exist and where appropriate corrective measures would need to be implemented.
Progress is considered to have been made when the gap between a designated group’s representation and LMA narrows (namely, the attainment rate approaches 100%) or when a group’s representation equals or exceeds LMA (namely, the attainment rate equals or surpasses 100%).
Other indicators of employment equity include salary ranges, as well as shares of hires, promotions and terminations. This report provides statistics on each of these indicators for the 4 designated groups.
Table 1 provides Statistics Canada’s LMA data at the national (Canadian) level that is used for comparison to representation of the designated groups reported by employers. In this report, the 2018 employer data is compared to the 2016 Census for women, Aboriginal peoples and members of visible minorities, and to the 2017 Canadian Survey on Disability (CSD) for persons with disabilities.
Since the new LMA data based on the 2016 Census and 2017 CSD was not available until after the previous annual report was published, it was not used for comparisons to the 2017 representation data reported by employers. Throughout this report, the 2017 employer data is kept as previously reported and compared to LMA data that is based on the 2011 National Household Survey (NHS) and 2012 CSD.
| Year | Women | Aboriginal peoples | Persons with disabilities | Members of visible minorities |
|---|---|---|---|---|
| 2011 | 48.2 | 3.5 | 4.9 | 17.8 |
| 2016 | 48.2 | 4.0 | 9.1 | 21.3 |
* Sources: Statistics Canada, 2011 National Household Survey; 2016 Census; and 2012 and 2017 Canadian Survey on Disability.
At the national level, from 2011 to 2016, the new LMA data for Aboriginal peoples, persons with disabilities and members of visible minorities increased, while the LMA for women remained at the same level. The most significant increase in LMA was observed for persons with disabilities. This is due to changes made in capturing the CSD data by Statistics Canada. The CSD became more inclusive of all persons with a disability, especially of persons with less visible types of disabilities. Given that the 2017 CSD is more inclusive than the 2012 CSD, one cannot interpret the higher rate in 2017 to mean that disability has increased compared to 2012. The higher 2017 number of persons with disabilities is in large part due to the fact that the new Disability Screening Questions on the 2016 Census allowed to identify persons with disabilities that may have been missed previously. Those who tended to be missed with the previous census questions were people who had less visible types of disabilities such as learning, developmental, memory, mental health-related and pain-related disabilities.
Section 1: The federally regulated private sector
For the 2018 calendar year, 603 employers submitted a report to the Minister of Labour. Together, these employers had a total of 771,698 employees across Canada, which represents approximately 3.9%Footnote 6 of the Canadian workforce. Of these submissions, 67 were from employers that reported for the first time on a combined total of 15,284 employees. These employers who reported for the first time were only required to include statistical reports by gender; no data was required to be included on Aboriginal peoples, persons with disabilities and members of visible minorities.
Table 2A shows the data from all 603 employers that submitted reports for the 2018 calendar year, including the 67 employers that reported for the first time and were only required to submit statistical reports by gender. The representation of women decreased by 0.4Footnote 7 of a percentage point while the attainment rate of Canadian LMA decreased from 82.5% in 2017 to 81.6% in 2018.
| Year | Representation | Attainment rate of Canadian LMA*** |
|---|---|---|
| 2017 | 39.8 | 82.5 |
| 2018 | 39.3 | 81.6 |
* Sources: Statistics Canada, 2011 National Household Survey and 2016 Census.
** 603 employers overall in 2018.
*** The 2017 and 2018 attainment rates are respectively based on the 2011 Canadian LMA (48.2%) and the 2016 Canadian LMA (48.2%).
Table 2B provides the data submitted from the 536 employers with a total of 756,414 employees that had full reporting responsibility, excluding the 67 employers noted above. It shows that the representation of women decreased, while that of Aboriginal peoples remained the same between 2017 and 2018. Persons with disabilities and members of visible minorities made progress, increasing their overall representation by +0.1 and +1.0 percentage point respectively. Members of visible minorities was the only designated group whose representation continued to surpass Canadian LMA.
| Designated groups | 2017 representation | 2018 representation | Change in representation from 2017 to 2018*** | 2017 attainment rate of 2011 Canadian LMA**** | 2018 attainment rate of 2016 Canadian LMA***** |
|---|---|---|---|---|---|
| Women | 40.2 | 39.4 | -0.7 | 83.3 | 81.8 |
| Aboriginal peoples | 2.3 | 2.3 | 0.0 | 66.1 | 57.1 |
| Persons with disabilities | 3.3 | 3.4 | +0.1 | 67.6 | 37.5 |
| Members of visible minorities | 22.8 | 23.8 | +0.1 | 128.2 | 111.8 |
* Sources: Statistics Canada, 2011 National Household Survey; 2016 Census; and 2012 and 2017 Canadian Survey on Disability.
** 536 employers overall in 2018
*** Change values may not equal the differences between the representation rates due to rounding
**** The 2017 attainment rate is calculated from the 2011 Canadian LMA (%): women (48.2), Aboriginal peoples (3.5), persons with disabilities (4.9), and members of visible minorities (17.8).
***** The 2018 attainment rate is calculated from the 2016 Canadian LMA (%): women (48.2), Aboriginal peoples (4.0), persons with disabilities (9.1), and members of visible minorities (21.3).
From this point forward, this report will only include information on the 536 employers that did not report for the first time (namely, exclude the 67 employers who reported for the first time). For the 2019 data, these new employers will be expected to submit their workforce data on all 4 designated groups and their results will be included in the 2020 annual report.
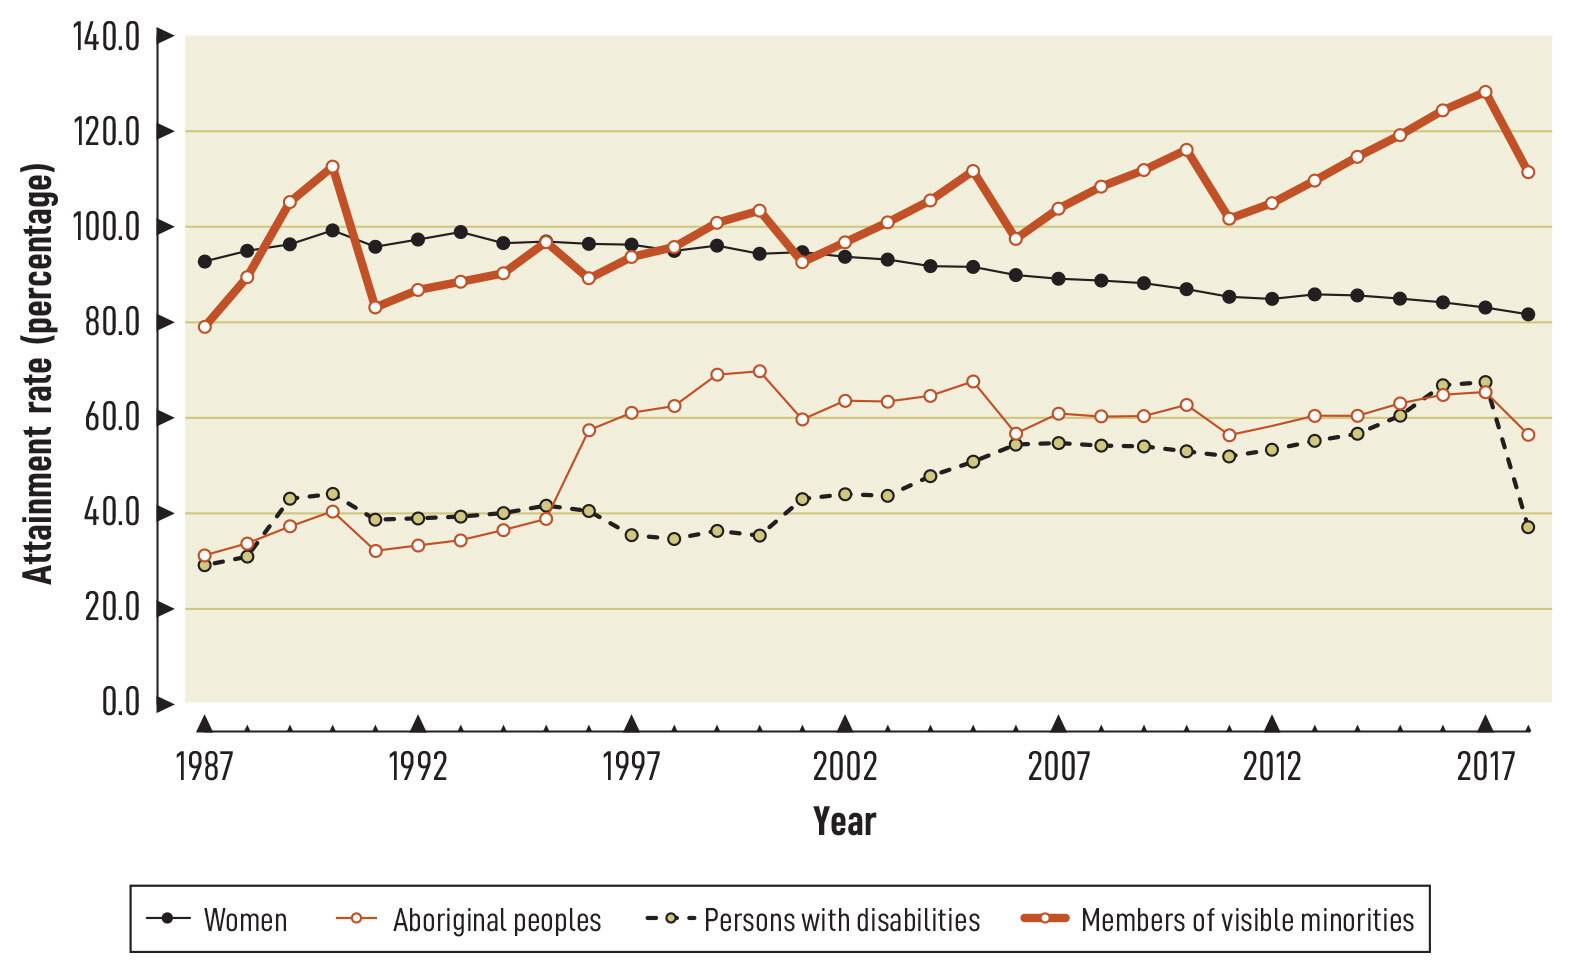
Chart 1 provides an overview of the extent to which representation approaches, meets or exceeds LMA for the 4 designated groups at the overall national level. The chart shows that Aboriginal peoples and persons with disabilities have made progress towards LMA since 1987, when employers started reporting under the Act, and members of visible minorities have surpassed LMA since 2007.
* Sources: Statistics Canada, 1986 to 2016 Census; 1986 and 1991 Health and Activity Limitation Survey; 2001 and 2006 Participation and Activity Limitation Survey; 2011 National Household Survey; and 2012 and 2017 Canadian Survey on Disability.
Chart 1: text description
| Year | Women | Aboriginal peoples | Persons with disabilities | Members of visible minorities |
|---|---|---|---|---|
| 1987 | 93.0 | 31.4 | 29.4 | 79.3 |
| 1988 | 95.3 | 34.0 | 31.2 | 90.0 |
| 1989 | 96.6 | 37.7 | 43.3 | 105.9 |
| 1990 | 99.4 | 40.6 | 44.3 | 112.5 |
| 1991 | 96.3 | 32.1 | 38.6 | 83.1 |
| 1992 | 97.3 | 33.7 | 39.1 | 86.9 |
| 1993 | 99.1 | 34.8 | 39.5 | 88.5 |
| 1994 | 96.7 | 36.7 | 40.4 | 90.4 |
| 1995 | 96.9 | 39.1 | 42.0 | 97.1 |
| 1996 | 96.6 | 57.9 | 40.9 | 89.3 |
| 1997 | 96.0 | 61.3 | 35.6 | 93.9 |
| 1998 | 95.2 | 62.7 | 34.8 | 95.7 |
| 1999 | 96.1 | 69.4 | 36.8 | 101.2 |
| 2000 | 94.3 | 70.3 | 35.7 | 103.6 |
| 2001 | 94.8 | 59.8 | 43.2 | 92.6 |
| 2002 | 93.9 | 63.9 | 44.3 | 97.0 |
| 2003 | 93.0 | 63.6 | 43.8 | 101.0 |
| 2004 | 91.8 | 64.7 | 48.0 | 105.5 |
| 2005 | 91.5 | 67.8 | 50.9 | 111.6 |
| 2006 | 89.9 | 57.1 | 54.5 | 97.5 |
| 2007 | 89.2 | 61.2 | 55.0 | 103.8 |
| 2008 | 88.9 | 60.5 | 54.3 | 108.3 |
| 2009 | 88.2 | 60.8 | 54.2 | 111.9 |
| 2010 | 87.0 | 62.7 | 53.1 | 116.1 |
| 2011 | 85.5 | 56.4 | 52.2 | 102.1 |
| 2012 | 84.9 | 58.4 | 53.5 | 104.7 |
| 2013 | 86.2 | 60.7 | 55.4 | 110.0 |
| 2014 | 85.8 | 60.9 | 56.6 | 114.7 |
| 2015 | 85.1 | 63.1 | 60.4 | 119.0 |
| 2016 | 84.5 | 65.1 | 67.0 | 124.4 |
| 2017 | 83.3 | 66.1 | 67.6 | 128.2 |
| 2018 | 81.8 | 57.1 | 37.5 | 111.8 |
Note: In 1996, the Census methodology for calculating LMA of Aboriginal peoples changed, causing a drop in LMA. In 2001, Statistics Canada began using the World Health Organization’s International Classification of Functioning, Disability and Health framework to define disability rather than the 1980 International Classification of Impairments, Disabilities, and Handicaps; this resulted in a drop in LMA for persons with disabilities. In 2017, Statistics Canada introduced new methodology for capturing persons with disabilities data that resulted in a significant increase in LMA for this designated group.
The attainment rate for women has been declining since reaching its highest point in 1990 (99.4%), and 2018 marked the lowest rate (81.8%) for women. The attainment rate for Aboriginal peoples was exhibiting an upward trend between 1987 and 2000, with a substantial increase of +18.8 percentage points from 1995 (39.1%) to 1996 (57.9%) due to changes made to the collection of LMA data, but has remained stable since 2001. The attainment rate for persons with disabilities more than doubled since 1987, but decreased from 67.6% in 2017 to 37.5% in 2018 and currently is the lowest of all 4 designated groups. This decrease in attainment rate is mainly due to the significant increase in persons with disabilities’ LMA from 4.9% in 2012 to 9.1% in 2017. The only group whose representation has continued to surpass LMA is members of visible minorities.
Table 3A and Table 3B displays the cumulative distribution of permanent full-time designated group and non-designated group members by salary ranges. The data shows that some of the designated groups experience higher concentrations in certain salary ranges when compared to other groups of employees within the same threshold. For example:
- a higher proportion of women (30.7%) earned a salary below $50,000, compared to 20.6% of men, or any other groups of employees (27.4% of Aboriginal peoples, 24.3% of non-Aboriginal peoples, etc.), and
- a higher proportion of Aboriginal peoples (14.2%) earned a salary below $40,000, compared to 10.6% of non-Aboriginal peoples, 13.6% of women, 8.9% of men, or any other groups of employees
| Salary range (by dollar) | Women | Men | Aboriginal peoples | Non-Aboriginal peoples |
|---|---|---|---|---|
| Under 15,000 | 0.5 | 0.6 | 1.7 | 0.5 |
| 15,000 to 19,999 | 0.6 | 0.8 | 2.1 | 0.7 |
| 20,000 to 24,999 | 1.5 | 1.2 | 2.7 | 1.3 |
| 25,000 to 29,999 | 3.6 | 2.4 | 4.8 | 2.8 |
| 30,000 to 34,999 | 7.3 | 4.8 | 8.6 | 5.7 |
| 35,000 to 39,999 | 13.6 | 8.9 | 14.2 | 10.6 |
| 40,000 to 44,999 | 22.0 | 14.7 | 20.6 | 17.3 |
| 45,000 to 49,999 | 30.7 | 20.6 | 27.4 | 24.3 |
| 50,000 to 59,999 | 49.9 | 35.6 | 44.3 | 40.9 |
| 60,000 to 69,999 | 63.2 | 49.8 | 59.0 | 54.7 |
| 70,000 to 84,999 | 75.9 | 65.2 | 73.4 | 69.1 |
| 85,000 to 99,999 | 84.5 | 75.8 | 83.1 | 79.0 |
| 100,000 and over | 100.0 | 100.0 | 100.0 | 100.0 |
Note: Each figure in the Cumulative percentage columns represents the cumulative total percentage of each designated group in the identified salary range or lower.
| Salary range (by dollar) | Persons with disabilities | Persons without disabilities | Members of visible minorities | Non-visible minority members |
|---|---|---|---|---|
| Under 15,000 | 0.3 | 0.5 | 0.4 | 0.6 |
| 15,000 to 19,999 | 0.5 | 0.7 | 0.6 | 0.8 |
| 20,000 to 24,999 | 0.8 | 1.3 | 1.1 | 1.4 |
| 25,000 to 29,999 | 1.9 | 2.9 | 2.8 | 2.9 |
| 30,000 to 34,999 | 4.8 | 5.8 | 5.9 | 5.7 |
| 35,000 to 39,999 | 11.3 | 10.6 | 11.7 | 10.3 |
| 40,000 to 44,999 | 19.3 | 17.3 | 19.6 | 16.7 |
| 45,000 to 49,999 | 26.7 | 24.3 | 27.2 | 23.5 |
| 50,000 to 59,999 | 44.5 | 40.8 | 43.9 | 40.0 |
| 60,000 to 69,999 | 58.3 | 54.7 | 57.0 | 54.1 |
| 70,000 to 84,999 | 72.7 | 69.1 | 70.8 | 68.7 |
| 85,000 to 99,999 | 82.2 | 79.0 | 81.2 | 78.5 |
| 100,000 and over | 100.0 | 100.0 | 100.0 | 100.0 |
Note: Each figure in the Cumulative percentage columns represents the cumulative total percentage of each designated group in the identified salary range or lower.
Section 2: Sector profiles
This section provides an analysis of the sectors and subsectors that comprise the federally regulated private sector.
Table 4A and Table 4B show that overall, the number of employers across federally regulated private sectors increased by +16.0% and the number of employees increased by +5.0% between 2017 and 2018. The banking and financial services sector continued to account for less than 10% of employers but employed about a third of all employees. Communications was the third largest sector, comprising 10.8% of employers and 17.4% of employees. The transportation sector continued to have the largest number of employers (69.0%) and of employees (42.5%), with the majority of this workforce operating in the ground transportation subsector. Among all sectors, the transportation sector experienced the highest increase in the number of employees (+9.2%). The other sector experienced an increase in the number of employers and of employees by +14.8% and +4.9% respectively.
| Federally regulated private sectors | 2017 count | 2018 count | Change in number of employers from 2017 to 2018 (by percentage) | 2017 distribution | 2018 distribution |
|---|---|---|---|---|---|
| Banking and financial services | 36 | 38 | +5.6 | 7.8 | 7.1 |
| Communications | 52 | 58 | +11.5 | 11.3 | 10.8 |
| Transportation | 313 | 370 | +18.2 | 67.7 | 69.0 |
| 'Other' | 61 | 70 | +14.8 | 13.2 | 13.1 |
| All sectors | 462 | 536 | +16.0 | N/A | N/A |
* The number of employers in the federally regulated private sector can change from year to year as a result of mergers, acquisitions, closures, start-ups or organizations fluctuating above or below the 100-employee threshold.
| Federally regulated private sectors | 2017 count | 2018 count | Change in number of employers from 2017 to 2018 (by percentage) | 2017 distribution | 2018 distribution |
|---|---|---|---|---|---|
| Banking and financial services | 237,016 | 244,910 | +3.3 | 32.9 | 32.4 |
| Communications | 132,890 | 131,305 | -1.2 | 18.4 | 17.4 |
| Transportation | 294,612 | 321,707 | +9.2 | 40.9 | 42.5 |
| 'Other' | 55,779 | 58,492 | +4.9 | 7.7 | 7.7 |
| All sectors | 720,297 | 756,414 | +5.0 | N/A | N/A |
Table 4C and Table 4D show the count and distributions of federally regulated private sector employers and employees by subsectors in 2017 and 2018. The highest proportional increases in the number of federally regulated private sector employers are in the production industries subsector (+25.9%) and the ground transportation subsector (+24.2%). Among all subsectors, the air transportation subsector experienced the highest increase in the number of employees (+10.8%).
| Federally regulated private sectors | 2017 count | 2018 count | Change in number of employers from 2017 to 2018 (by percentage) | 2017 distribution | 2018 distribution |
|---|---|---|---|---|---|
| Air transportation | 84 | 91 | +8.3 | 26.8 | 24.6 |
| Ground transportation | 194 | 241 | +24.2 | 62.0 | 65.1 |
| Water transportation | 35 | 38 | +8.6 | 11.2 | 10.3 |
| Production industries | 27 | 34 | +25.9 | 44.3 | 48.6 |
| Service industries | 34 | 36 | +5.9 | 55.7 | 51.4 |
* The number of employers in the federally regulated private sector can change from year to year as a result of mergers, acquisitions, closures, start-ups or organizations fluctuating above or below the 100-employee threshold.
| Federally regulated private sectors | 2017 count | 2018 count | Change in number of employers from 2017 to 2018 (by percentage) | 2017 distribution | 2018 distribution |
|---|---|---|---|---|---|
| Air transportation | 86,987 | 96,419 | +10.8 | 29.5 | 30.0 |
| Ground transportation | 190,024 | 206,160 | +8.5 | 64.5 | 64.1 |
| Water transportation | 17,601 | 19,128 | +8.7 | 6.0 | 5.9 |
| Production industries | 29,327 | 30,525 | +4.4 | 52.4 | 52.2 |
| Service industries | 26,542 | 27,967 | +5.4 | 47.6 | 47.8 |
Table 5A shows that in the banking and financial services sector between 2017 and 2018, the representation of women decreased by -1.1 percentage point and the representation of members of visible minorities increased by +2.3 percentage points. While the representation of members of visible minorities continued to surpass sector LMA with an attainment rate above 100%, women’s attainment rate is getting closer to full representation. The representation of Aboriginal peoples in 2018 remained unchanged and stayed below the sector LMA (1.7%) with an attainment rate of 72.1%. While the representation of persons with disabilities increased by +0.5 of a percentage point, it was below the sector LMA of 9.2%.
| Designated groups | 2017 representation | 2018 representation | Change in representation from 2017 to 2018 (point of percentage)** | 2017 attainment rate of 2011 sector LMA*** | 2018 attainment rate of 2016 sector LMA**** |
|---|---|---|---|---|---|
| Women | 57.7 | 56.6 | -1.1 | 93.2 | 96.1 |
| Aboriginal peoples | 1.2 | 1.2 | 0.0 | 76.4 | 72.1 |
| Persons with disabilities | 4.5 | 5.0 | +0.5 | 136.2 | 54.1 |
| Members of visible minorities | 31.6 | 33.9 | +2.3 | 119.1 | 108.5 |
* Sources: Statistics Canada, 2011 National Household Survey; 2016 Census; and 2012 and 2017 Canadian Survey on Disability.
** Change values may not equal the differences between the representation rates due to rounding.
*** The 2011 banking and financial services sector LMA (%): women (61.9), Aboriginal peoples (1.6), persons with disabilities (3.3) and members of visible minorities (26.5).
**** The 2016 banking and financial services sector LMA (%): women (58.9), Aboriginal peoples (1.7), persons with disabilities (9.2) and members of visible minorities (31.2).
Table 5A.1 shows that in the banking and financial services sector between 2017 and 2018, the representation of women decreased and the representation of members of visible minorities increased, but both designated groups’ representation continued to surpass Canadian LMA with attainment rates above 100%. The representation of Aboriginal peoples in 2018 remained unchanged and stayed below the Canadian LMA (4.0%) with an attainment rate of only 30.6%. While the representation of persons with disabilities increased by +0.5%, it was below the Canadian LMA of 9.1%. The representation of members of visible minorities increased by +2.3% and continued to surpass the Canadian LMA, with attainment rates above 100%.
| Designated groups | 2017 attainment rate of 2011 Canadian LMA** | 2018 attainment rate of 2016 Canadian LMA*** |
|---|---|---|
| Women | 119.7 | 117.4 |
| Aboriginal peoples | 34.9 | 30.6 |
| Persons with disabilities | 91.7 | 54.7 |
| Members of visible minorities | 177.3 | 159.0 |
* Sources: Statistics Canada, 2011 National Household Survey; 2016 Census; and 2012 and 2017 Canadian Survey on Disability.
** The 2011 Canadian LMA (%): women (48.2), Aboriginal peoples (3.5), persons with disabilities (4.9) and members of visible minorities (17.8).
*** The 2016 Canadian LMA (%): women (48.2), Aboriginal peoples (4.0), persons with disabilities (9.1) and members of visible minorities (21.3).
Table 5B indicates that for the communications sector between 2017 and 2018, the representation among all designated groups remained generally stable. Given the increase in sector LMA in 2016 for all designated groups except women, the attainment rate of sector LMA for the communications sector decreased to 84.6% for Aboriginal peoples, to 31.0% for persons with disabilities and to 94.8% for members of visible minorities. Women’s attainment rate of this sector LMA slightly increased by +0.7 of a percentage point to 78.9%.
| Designated groups | 2017 representation | 2018 representation | Change in representation from 2017 to 2018 (point of percentage)** | 2017 attainment rate of 2011 sector LMA*** | 2018 attainment rate of 2016 sector LMA**** |
|---|---|---|---|---|---|
| Women | 35.2 | 34.8 | -0.4 | 78.2 | 78.9 |
| Aboriginal peoples | 2.2 | 2.1 | -0.1 | 96.2 | 84.6 |
| Persons with disabilities | 3.5 | 3.4 | -0.1 | 69.1 | 31.0 |
| Members of visible minorities | 23.2 | 23.5 | +0.4 | 167.8 | 94.8 |
* Sources: Statistics Canada, 2011 National Household Survey; 2016 Census; and 2012 and 2017 Canadian Survey on Disability.
** Change values may not equal the differences between the representation rates due to rounding.
*** The 2011 communications sector LMA (%): women (45.0), Aboriginal peoples (2.3), persons with disabilities (5.1) and members of visible minorities (13.8).
**** The 2016 communications sector LMA (%): women (44.1), Aboriginal peoples (2.5), persons with disabilities (11.0) and members of visible minorities (24.8).
Table 5B.1 shows that members of visible minorities continued to surpass the Canadian LMA with an attainment rate above 100%. Given the increase in Canadian LMA in 2016 for the designated groups except women, the attainment rate of Canadian LMA decreased to 52.9% for Aboriginal peoples and to 37.5% for persons with disabilities.
| Designated groups | 2017 attainment rate of 2011 Canadian LMA** | 2018 attainment rate of 2016 Canadian LMA*** |
|---|---|---|
| Women | 73.0 | 72.1 |
| Aboriginal peoples | 63.2 | 52.9 |
| Persons with disabilities | 71.9 | 37.5 |
| Members of visible minorities | 130.1 | 110.4 |
* Sources: Statistics Canada, 2011 National Household Survey; 2016 Census; and 2012 and 2017 Canadian Survey on Disability.
** The 2011 Canadian LMA (%): women (48.2), Aboriginal peoples (3.5), persons with disabilities (4.9) and members of visible minorities (17.8).
*** The 2016 Canadian LMA (%): women (48.2), Aboriginal peoples (4.0), persons with disabilities (9.1) and members of visible minorities (21.3).
Table 5C indicates that in the transportation sector, representation remained stable from 2017 to 2018. While the representation of women continued to exceed sector LMA with an attainment rate of over 100%, higher sector LMA resulted in decreased attainment rates for the other 3 designated groups. The representation of persons with disabilities remained low in 2018 with a 25.0% attainment rate of sector LMA.
| Designated groups | 2017 representation | 2018 representation | Change in representation from 2017 to 2018 (point of percentage)** | 2017 attainment rate of 2011 sector LMA*** | 2018 attainment rate of 2016 sector LMA**** |
|---|---|---|---|---|---|
| Women | 30.4 | 30.1 | -0.3 | 118.2 | 118.9 |
| Aboriginal peoples | 2.9 | 2.9 | 0.0 | 88.3 | 74.7 |
| Persons with disabilities | 2.5 | 2.5 | 0.0 | 42.2 | 25.0 |
| Members of visible minorities | 17.0 | 17.7 | +0.7 | 87.4 | 70.6 |
* Sources: Statistics Canada, 2011 National Household Survey; 2016 Census; and 2012 and 2017 Canadian Survey on Disability.
** Change values may not equal the differences between the representation rates due to rounding.
*** The 2011 transportation sector LMA (%): women (25.7), Aboriginal peoples (3.3), persons with disabilities (5.9) and members of visible minorities (19.5).
**** The 2016 transportation sector LMA (%): women (25.3), Aboriginal peoples (3.9), persons with disabilities (9.8) and members of visible minorities (25.1).
Table 5C.1 shows that the attainment rate of Canadian LMA in the transportation sector for designated groups in 2017 and 2018. While none of the designated groups reached or surpassed Canadian LMA, the representation of women showed the smallest decrease in 2018. The representation of persons with disabilities continue to remain low compared to Canadian LMA.
| Designated groups | 2017 attainment rate of 2011 Canadian LMA** | 2018 attainment rate of 2016 Canadian LMA*** |
|---|---|---|
| Women | 63.0 | 62.4 |
| Aboriginal peoples | 83.3 | 72.9 |
| Persons with disabilities | 50.8 | 27.0 |
| Members of visible minorities | 95.7 | 83.2 |
* Sources: Statistics Canada, 2011 National Household Survey; 2016 Census; and 2012 and 2017 Canadian Survey on Disability.
** The 2011 Canadian LMA (%): women (48.2), Aboriginal peoples (3.5), persons with disabilities (4.9) and members of visible minorities (17.8).
*** The 2016 Canadian LMA (%): women (48.2), Aboriginal peoples (4.0), persons with disabilities (9.1) and members of visible minorities (21.3).
Tables 5D.1, 5D.2 and5D.3 indicate that the representation of women decreased in the air and the ground transportation subsectors but increased in the water transportation subsector. Women’s representation continued to surpass the transportation sector LMA in the air and the ground transportation subsectors with an attainment rate above 100%, but remained below the transportation sector LMA in the water transportation subsector with a 66.8% attainment rate. The representation of Aboriginal peoples continued to surpass the transportation sector LMA in the water transportation subsector with an attainment rate above 100%. The representation of persons with disabilities and members of visible minorities remained below the transportation sector LMA across all transportation subsectors.
| Designated groups | 2017 representation | 2018 representation | Change in representation from 2017 to 2018 (point of percentage)** | 2017 attainment rate of 2011 sector LMA*** | 2018 attainment rate of 2016 sector LMA**** |
|---|---|---|---|---|---|
| Women | 38.6 | 38.5 | -0.1 | 150.2 | 152.0 |
| Aboriginal peoples | 2.9 | 2.8 | -0.2 | 88.8 | 71.2 |
| Persons with disabilities | 1.6 | 1.6 | 0.0 | 27.7 | 16.4 |
| Members of visible minorities | 18.9 | 19.6 | +0.7 | 97.0 | 78.0 |
* Sources: Statistics Canada, 2011 National Household Survey; 2016 Census; and 2012 and 2017 Canadian Survey on Disability.
** Change values may not equal the differences between the representation rates due to rounding.
*** The 2011 transportation sector LMA (%): women (25.7), Aboriginal peoples (3.3), persons with disabilities (5.9) and members of visible minorities (19.5).
**** The 2016 transportation sector LMA (%): women (25.3), Aboriginal peoples (3.9), persons with disabilities (9.8) and members of visible minorities (25.1).
| Designated groups | 2017 representation | 2018 representation | Change in representation from 2017 to 2018 (point of percentage)** | 2017 attainment rate of 2011 sector LMA*** | 2018 attainment rate of 2016 sector LMA**** |
|---|---|---|---|---|---|
| Women | 27.9 | 27.4 | -0.6 | 108.7 | 108.2 |
| Aboriginal peoples | 2.8 | 2.8 | 0.0 | 83.8 | 71.7 |
| Persons with disabilities | 2.9 | 2.9 | 0.0 | 48.8 | 29.3 |
| Members of visible minorities | 16.4 | 17.1 | +0.7 | 84.3 | 68.3 |
* Sources: Statistics Canada, 2011 National Household Survey; 2016 Census; and 2012 and 2017 Canadian Survey on Disability.
** Change values may not equal the differences between the representation rates due to rounding.
*** The 2011 transportation sector LMA (%): women (25.7), Aboriginal peoples (3.3), persons with disabilities (5.9) and members of visible minorities (19.5).
**** The 2016 transportation sector LMA (%): women (25.3), Aboriginal peoples (3.9), persons with disabilities (9.8) and members of visible minorities (25.1).
| Designated groups | 2017 representation | 2018 representation | Change in representation from 2017 to 2018 (point of percentage)** | 2017 attainment rate of 2011 sector LMA*** | 2018 attainment rate of 2016 sector LMA**** |
|---|---|---|---|---|---|
| Women | 16.0 | 16.9 | +0.9 | 62.3 | 66.8 |
| Aboriginal peoples | 4.5 | 4.9 | +0.4 | 135.2 | 124.8 |
| Persons with disabilities | 2.5 | 2.2 | -0.3 | 42.4 | 22.7 |
| Members of visible minorities | 14.2 | 14.5 | +0.2 | 72.9 | 57.6 |
* Sources: Statistics Canada, 2011 National Household Survey; 2016 Census; and 2012 and 2017 Canadian Survey on Disability.
** Change values may not equal the differences between the representation rates due to rounding.
*** The 2011 transportation sector LMA (%): women (25.7), Aboriginal peoples (3.3), persons with disabilities (5.9) and members of visible minorities (19.5).
**** The 2016 transportation sector LMA (%): women (25.3), Aboriginal peoples (3.9), persons with disabilities (9.8) and members of visible minorities (25.1).
Table 5E shows that in the ‘other’ sector, the representation of women increased by +0.4 of a percentage point between 2017 and 2018 but remained below sector LMA. The representation of Aboriginal peoples decreased by -0.4 of a percentage point and their attainment rate of sector LMA decreased to 78.7%. The representation of persons with disabilities remained at the same level and below sector LMA. Members of visible minorities’ representation increased but their attainment rate is now below the sector LMA due to an increase of +2.2 percentage points in their sector LMA level.
| Designated groups | 2017 representation | 2018 representation | Change in representation from 2017 to 2018 (point of percentage)** | 2017 attainment rate of 2011 sector LMA*** | 2018 attainment rate of 2016 sector LMA**** |
|---|---|---|---|---|---|
| Women | 29.3 | 29.8 | +0.4 | 83.1 | 86.2 |
| Aboriginal peoples | 4.0 | 3.6 | -0.4 | 93.6 | 78.7 |
| Persons with disabilities | 2.1 | 2.1 | 0.0 | 56.5 | 24.7 |
| Members of visible minorities | 15.4 | 15.9 | +0.4 | 111.7 | 99.1 |
* Sources: Statistics Canada, 2011 National Household Survey; 2016 Census; and 2012 and 2017 Canadian Survey on Disability.
** Change values may not equal the differences between the representation rates due to rounding.
*** The 2011 ‘other’ sector LMA (%): women (35.3), Aboriginal peoples (4.3), persons with disabilities (3.8) and members of visible minorities (13.8).
**** The 2016 ‘other’ sector LMA (%): women (34.5), Aboriginal peoples (4.6), persons with disabilities (8.3) and members of visible minorities (16.0).
Table 5E.1 shows that, in the ‘other’ sector, women’s representation remained below the Canadian LMA. The attainment rate of the Canadian LMA for Aboriginal peoples also decreased to 90.5% respectively. The representation of persons with disabilities remained at the same level and below the Canadian LMA. Due to the increase in the LMA levels of members of visible minorities, their attainment rate continues to be below the Canadian LMA.
| Designated groups | 2017 attainment rate of 2011 Canadian LMA** | 2018 attainment rate of 2016 Canadian LMA*** |
|---|---|---|
| Women | 60.9 | 61.7 |
| Aboriginal peoples | 114.9 | 90.5 |
| Persons with disabilities | 43.8 | 22.6 |
| Members of visible minorities | 86.6 | 74.4 |
* Sources: Statistics Canada, 2011 National Household Survey; 2016 Census; and 2012 and 2017 Canadian Survey on Disability.
** The 2011 Canadian LMA (%): women (48.2), Aboriginal peoples (3.5), persons with disabilities (4.9) and members of visible minorities (17.8).
*** The 2016 Canadian LMA (%): women (48.2), Aboriginal peoples (4.0), persons with disabilities (9.1) and members of visible minorities (21.3).
Tables 5F.1 and 5F.2 show that the representation of women and members of visible minorities increased between 2017 and 2018 in both subsectors of the ‘other’ sector and continued to exceed the sector LMA in the service industries subsector. The representation of Aboriginal peoples decreased by -0.9 of a percentage point in the production industries subsector and increased by +0.1 of a percentage point in the service industries subsector but their attainment rates were below the ‘other’ sector LMA in both subsectors. The attainment rate of sector LMA for persons with disabilities across both subsectors of the ‘other’ sector dropped by more than half from 2017 to 2018, partly due to the sector LMA increase.
| Designated groups | 2017 representation | 2018 representation | Change in representation from 2017 to 2018 (point of percentage)** | 2017 attainment rate of 2011 sector LMA*** | 2018 attainment rate of 2016 sector LMA**** |
|---|---|---|---|---|---|
| Women | 22.9 | 23.4 | +0.6 | 64.8 | 67.9 |
| Aboriginal peoples | 5.2 | 4.3 | -0.9 | 120.9 | 93.5 |
| Persons with disabilities | 2.4 | 2.2 | -0.2 | 64.2 | 27.0 |
| Members of visible minorities | 12.2 | 12.7 | +0.5 | 88.4 | 79.6 |
* Sources: Statistics Canada, 2011 National Household Survey; 2016 Census; and 2012 and 2017 Canadian Survey on Disability.
** Change values may not equal the differences between the representation rates due to rounding.
*** The 2011 other sector LMA (%): women (35.3), Aboriginal peoples (4.3), persons with disabilities (3.8) and members of visible minorities (13.8).
**** The 2016 other sector LMA (%): women (34.5), Aboriginal peoples (4.6), persons with disabilities (8.3) and members of visible minorities (16.0).
| Designated groups | 2017 representation | 2018 representation | Change in representation from 2017 to 2018 (point of percentage)** | 2017 attainment rate of 2011 sector LMA*** | 2018 attainment rate of 2016 sector LMA**** |
|---|---|---|---|---|---|
| Women | 36.5 | 36.7 | +0.2 | 103.3 | 106.3 |
| Aboriginal peoples | 2.7 | 2.9 | +0.1 | 63.4 | 62.5 |
| Persons with disabilities | 1.8 | 1.9 | 0.0 | 48.1 | 22.3 |
| Members of visible minorities | 18.9 | 19.3 | +0.3 | 137.3 | 120.3 |
* Sources: Statistics Canada, 2011 National Household Survey; 2016 Census; and 2012 and 2017 Canadian Survey on Disability.
** Change values may not equal the differences between the representation rates due to rounding.
*** The 2011 'other' sector LMA (%): women (35.3), Aboriginal peoples (4.3), persons with disabilities (3.8) and members of visible minorities (13.8).
**** The 2016 'other' sector LMA (%): women (34.5), Aboriginal peoples (4.6), persons with disabilities (8.3) and members of visible minorities (16.0).
Additional data on the representation, hires, promotions and terminations of employees by designated group and sector is provided in Appendix A.
Section 3: Designated group profiles
Women
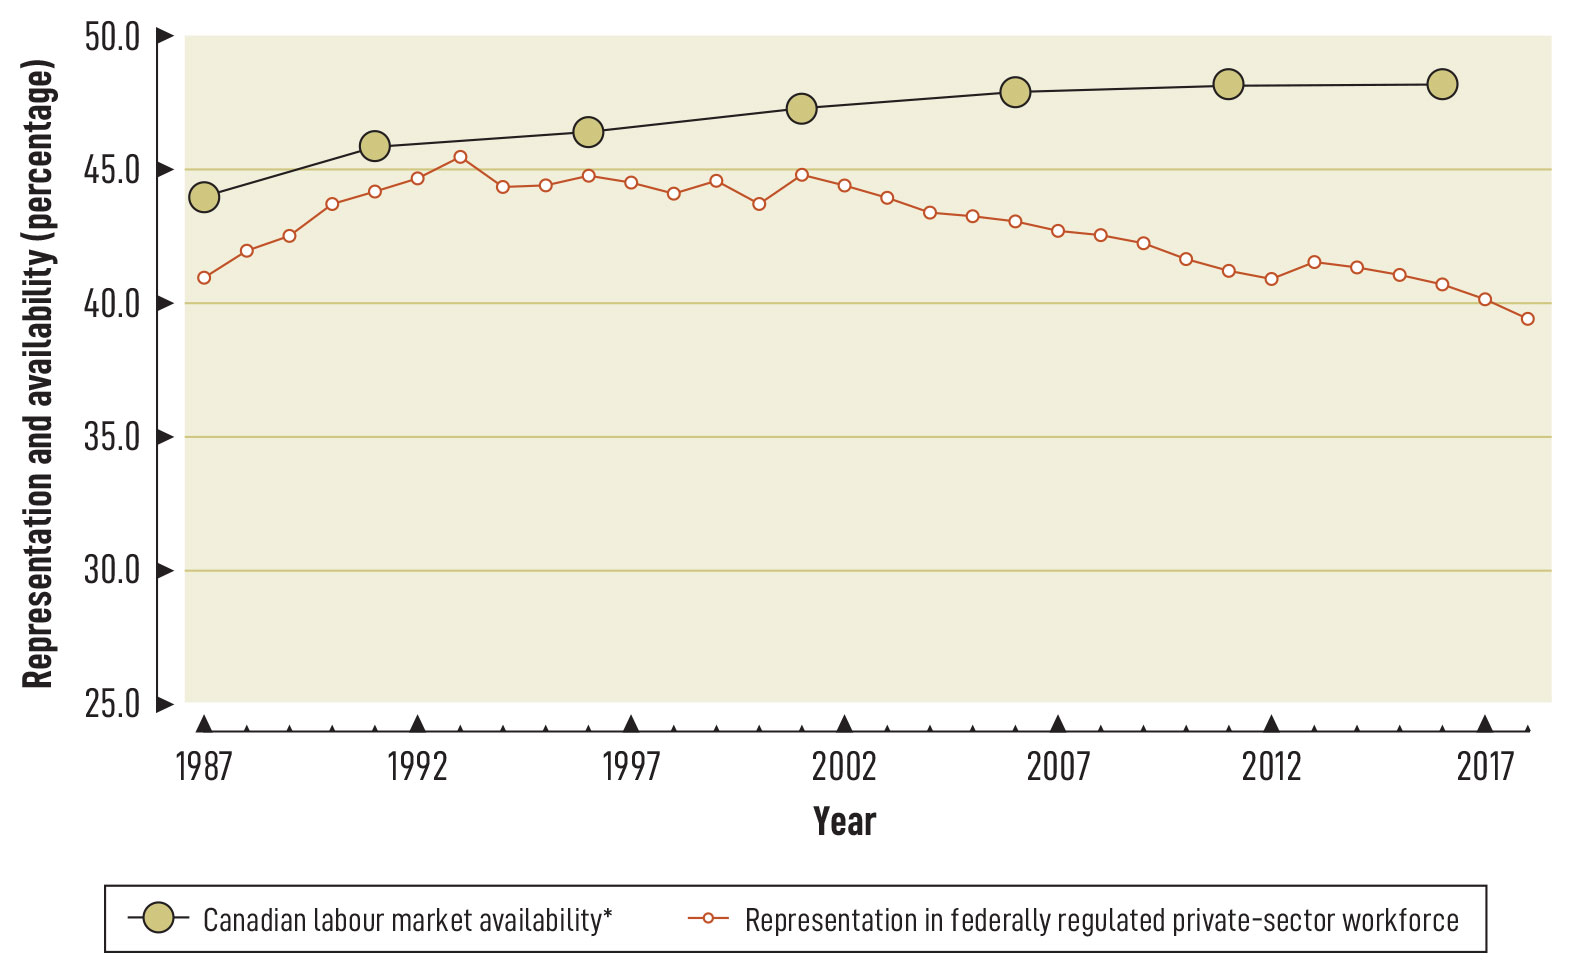
In 2018, the representation of women decreased by -0.8 of a percentage point compared to 2017 (from 40.2% in 2017 to 39.4% in 2018), the only designated group to have experienced a decrease. At the combined workforce level, and more specifically in the banking and financial services sector and the communications sector, where the majority of women were employed (61.7%) in 2018, women continued to leave the workforce at a higher rate than enter it. Since 2013, this trend has affected and led to the decline in the representation of women at the overall level.
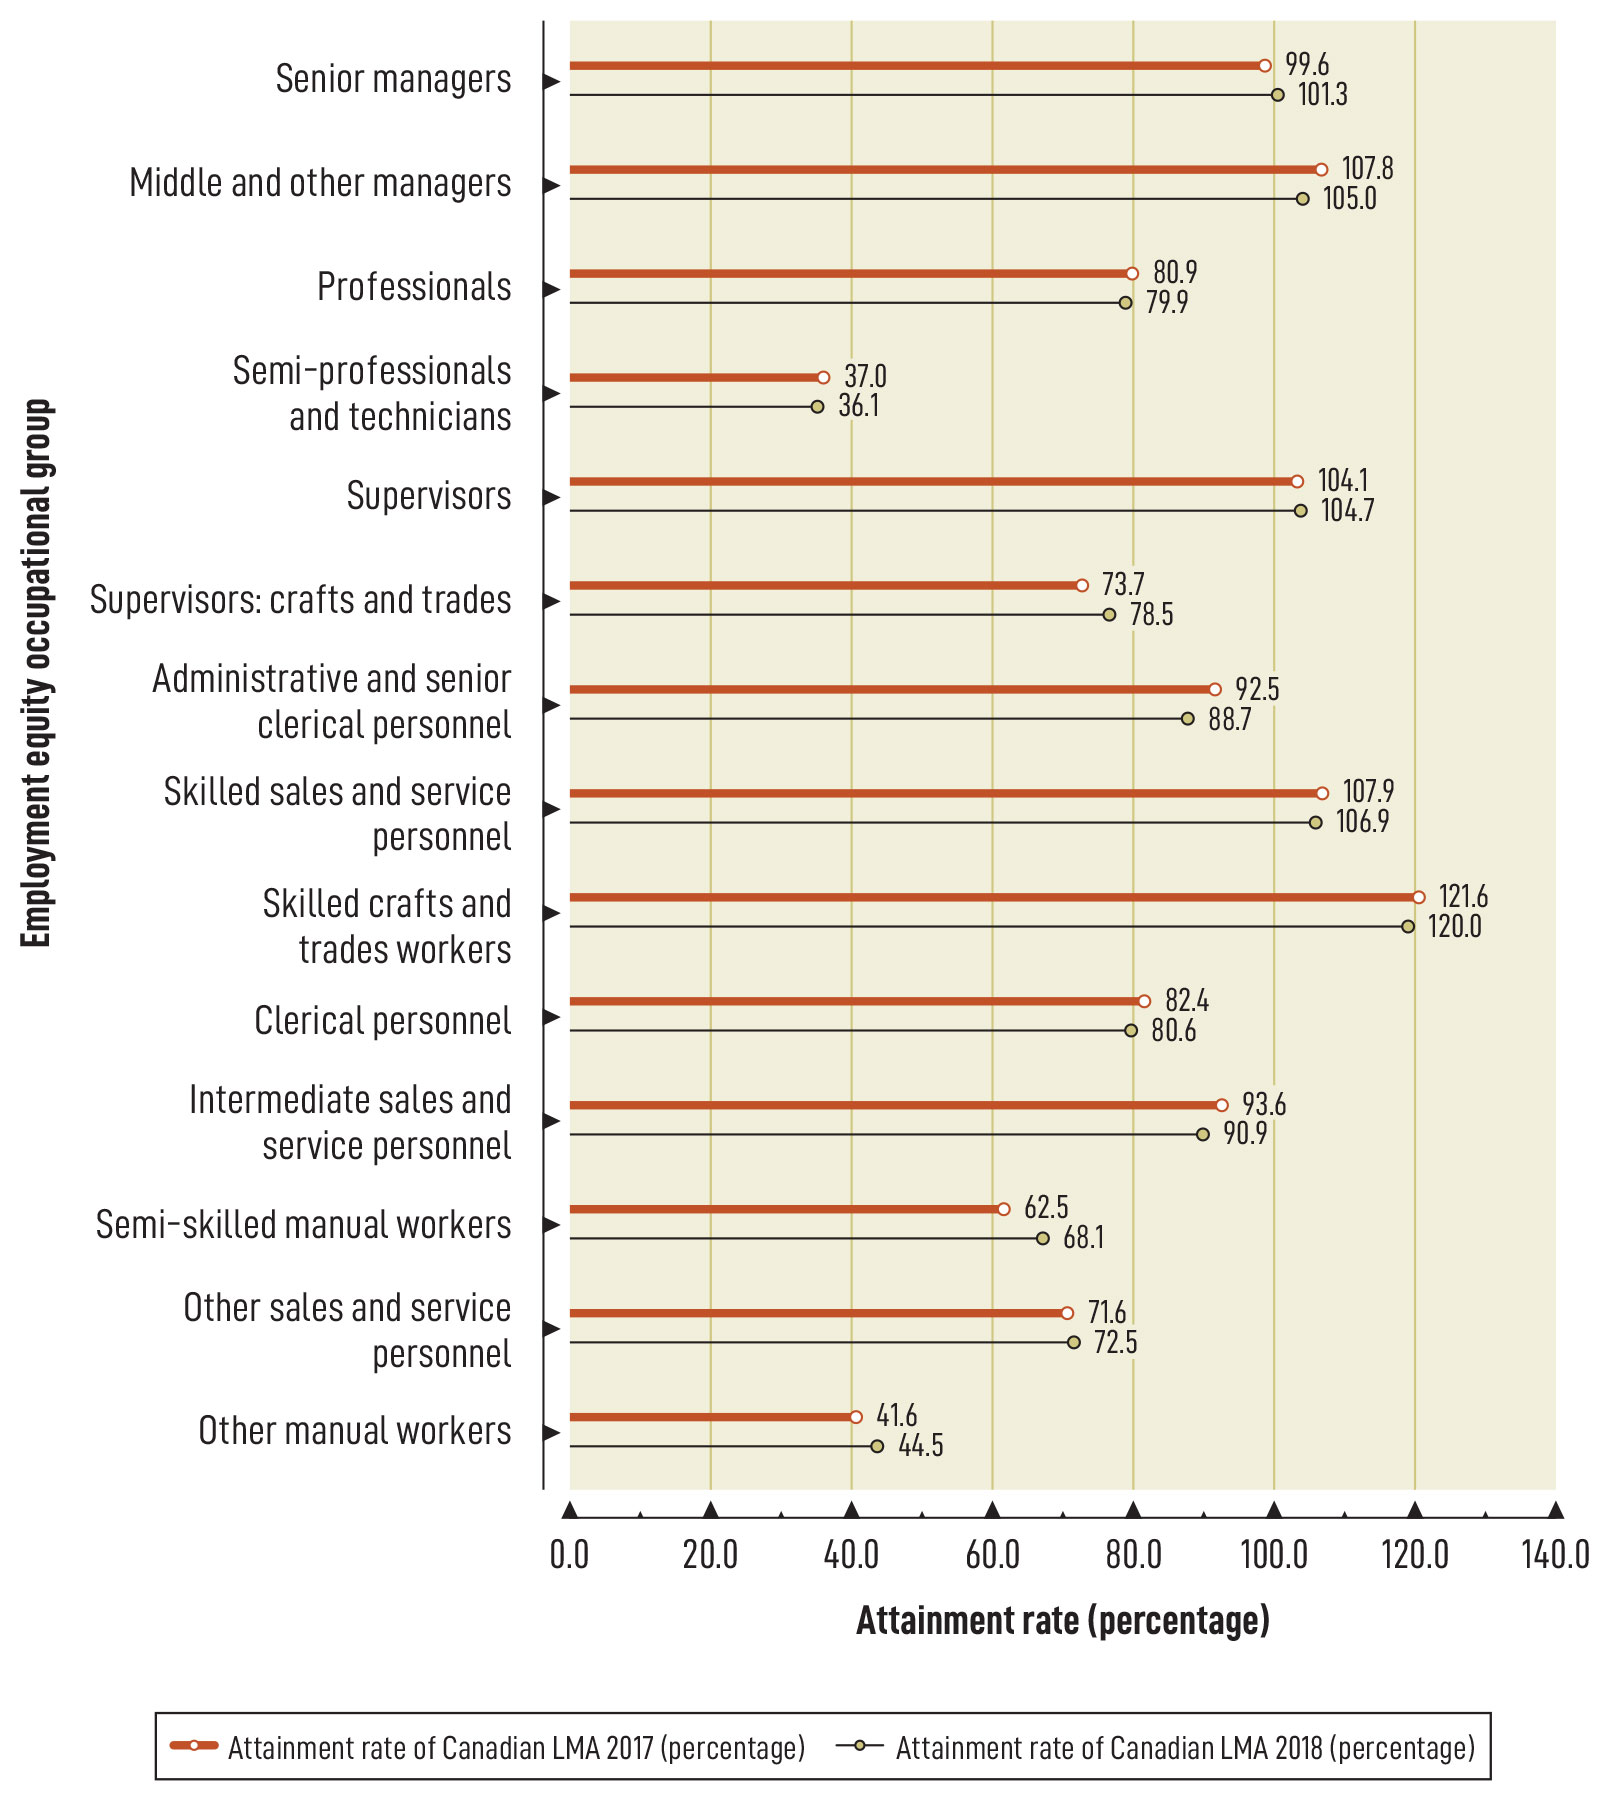
Progress was observed for women in some areas in the federally regulated private sector. For instance, between 2017 and 2018, the representation of women in the Senior Managers occupational group increased and surpassed LMA. During the same time period, although the representation of women in the Middle and Other Managers, Skilled Sales and Service Personnel, and Skilled Crafts and Trades Workers occupational groups decreased, it continued to surpass LMA.
Chart 2 shows that since 1987, the representation of women increased and peaked in 1993; however, it has been on a mostly downward trend since the early 2000s. The representation of women in 2018 (39.4%) was 1.5 of a percentage point below what it was in 1987 (40.9%).
* Sources: Statistics Canada, 1986 to 2016 Census and 2011 National Household Survey.
Chart 2: text description
| Year | Canadian labour market availability | Representation in federally regulated private sector workforce |
|---|---|---|
| 1987 | 44 | 40.94 |
| 1988 | N/A | 41.95 |
| 1989 | N/A | 42.53 |
| 1990 | N/A | 43.74 |
| 1991 | 45.9 | 44.21 |
| 1992 | N/A | 44.68 |
| 1993 | N/A | 45.47 |
| 1994 | N/A | 44.38 |
| 1995 | N/A | 44.46 |
| 1996 | 46.4 | 44.81 |
| 1997 | N/A | 44.53 |
| 1998 | N/A | 44.16 |
| 1999 | N/A | 44.61 |
| 2000 | N/A | 43.75 |
| 2001 | 47.3 | 44.85 |
| 2002 | N/A | 44.42 |
| 2003 | N/A | 44.01 |
| 2004 | N/A | 43.43 |
| 2005 | N/A | 43.29 |
| 2006 | 47.9 | 43.07 |
| 2007 | N/A | 42.71 |
| 2008 | N/A | 42.60 |
| 2009 | N/A | 42.27 |
| 2010 | N/A | 41.68 |
| 2011 | 48.2 | 41.21 |
| 2012 | N/A | 40.90 |
| 2013 | N/A | 41.56 |
| 2014 | N/A | 41.36 |
| 2015 | N/A | 41.04 |
| 2016 | 48.2 | 40.73 |
| 2017 | N/A | 40.17 |
| 2018 | N/A | 39.45 |
Chart 3 illustrates that at the overall level, the attainment rates of women in management and skilled occupational groups exceeded the Canadian LMA (Senior Managers; Middle and Other Managers; Supervisors; Skilled Sales and Service Personnel; and Skilled Crafts and Trades Workers) but remain particularly low for the following 2 occupational groups: Semi-professionals and Technicians and Other Manual Workers. Women have the highest attainment rate of Canadian LMA of all 4 designated groups in the Senior Managers occupational group. Of all occupational groups, the attainment rate is highest for women in the Skilled Crafts and Trades Workers group.
* Sources: Statistics Canada, 2011 National Household Survey and 2016 Census.
Chart 3: text description
| Occupational group | Attainment rate of Canadian LMA 2017 (percentage) | Attainment rate of Canadian LMA 2018 (percentage) |
|---|---|---|
| Senior managers | 99.6 | 101.3 |
| Middle and other managers | 107.8 | 105.0 |
| Professionals | 80.9 | 79.9 |
| Semi-professionals and technicians | 37.0 | 36.1 |
| Supervisors | 104.1 | 104.7 |
| Supervisors: crafts and trades | 73.7 | 78.5 |
| Administrative and senior clerical personnel | 92.5 | 88.7 |
| Skilled sales and service personnel | 107.9 | 106.9 |
| Skilled crafts and trades workers | 121.6 | 120.0 |
| Clerical personnel | 82.4 | 80.6 |
| Intermediate sales and service personnel | 93.6 | 90.9 |
| Semi-skilled manual workers | 62.5 | 68.1 |
| Other sales and service personnel | 71.6 | 72.5 |
| Other manual workers | 41.6 | 44.5 |
Banking and financial services sector
Table 6A shows that the attainment rate of sector occupational LMA of women increased from 2017 to 2018 in the Senior Managers, Supervisors, Clerical Personnel, Intermediate Sales and Service Personnel, Other Sales and Service Personnel and Other Manual Workers occupational groups. The increase in the Other Manual Workers occupational group is particularly noticeable at +170.1 percentage points, but this is a very small occupational group, where only 2 women of a total of 3 employees were reported for 2018. The representation of women was above sector occupational LMA in the Senior Managers, Professionals, Supervisors and Other Manual Workers occupational groups in 2018. However, the representation of women was well below sector occupational LMA in the Supervisors: Crafts and Trades, a small occupational group that consisted of 2 women out of a total of 13 employees for 2018.
| Occupational group | 2017 attainment rate of 2011 sector LMA | 2018 attainment rate of 2016 sector LMA | Change in attainment rate from 2017 to 2018 (point of percentage)** |
|---|---|---|---|
| Senior managers | 117.1 | 124.1 | +7.1 |
| Middle and other managers | 88.8 | 88.8 | -0.1 |
| Professionals | 106.2 | 105.1 | -1.0 |
| Semi-professionals and technicians | 92.5 | 82.3 | -10.1 |
| Supervisors | 93.6 | 100.1 | +6.5 |
| Supervisors: crafts and trades | 123.3 | 47.1 | -76.3 |
| Administrative and senior clerical personnel | 99.6 | 96.5 | -3.2 |
| Skilled sales and service personnel | 97.4 | 97.0 | -0.4 |
| Skilled crafts and trades workers | 84.9 | 69.4 | -15.5 |
| Clerical personnel | 87.6 | 88.0 | +0.5 |
| Intermediate sales and service personnel | 94.4 | 96.1 | +1.6 |
| Semi-skilled manual workers | 108.7 | 65.3 | -43.4 |
| Other sales and service personnel | 40.7 | 57.6 | +16.9 |
| Other manual workers | 80.4 | 250.6 | +170.1 |
| Total | 93.2 | 96.1 | +2.9 |
* Sources: Statistics Canada, 2011 National Household Survey and 2016 Census.
** Change values may not equal the differences between the attainment rates due to rounding.
Communications sector
Table 6B shows that the attainment rate of sector occupational LMA of women improved in 11 of the 14 occupational groups from 2017 to 2018. The only 3 occupational groups that did not improve were the Administrative and Senior Clerical Personnel, Clerical Personnel and Other Manual Workers. The representation of women was above the communications sector’s occupational LMA and reached the highest level of attainment rate of sector occupational LMA among the 4 sectors in the Senior Managers, Semi-skilled Manual Workers and Other Sales and Service Personnel occupational groups in 2018. However, women in this sector have the lowest level of attainment rate of sector occupational LMA in the Professionals, Supervisors and Clerical Personnel occupational groups. The decrease in the attainment rate of sector occupational LMA between 2017 and 2018 for the Other Manual Workers is particularly noticeable at -228.6 percentage points, but this is a very small occupational group that consisted of a total of 9 male employees for 2018.
| Occupational group | 2017 attainment rate of 2011 sector LMA | 2018 attainment rate of 2016 sector LMA | Change in attainment rate from 2017 to 2018 (point of percentage)** |
|---|---|---|---|
| Senior managers | 108.5 | 124.8 | +16.3 |
| Middle and other managers | 92.1 | 96.8 | +4.7 |
| Professionals | 85.6 | 85.7 | +0.1 |
| Semi-professionals and technicians | 84.0 | 87.0 | +3.0 |
| Supervisors | 72.5 | 75.3 | +2.9 |
| Supervisors: crafts and trades | 52.2 | 68.9 | +16.6 |
| Administrative and senior clerical personnel | 98.3 | 97.1 | -1.2 |
| Skilled sales and service personnel | 81.3 | 84.3 | +3.0 |
| Skilled crafts and trades workers | 63.7 | 80.1 | +16.4 |
| Clerical personnel | 86.2 | 84.6 | -1.6 |
| Intermediate sales and service personnel | 85.3 | 88.0 | +2.8 |
| Semi-skilled manual workers | 107.5 | 153.7 | +46.2 |
| Other sales and service personnel | 112.7 | 135.1 | +22.4 |
| Other manual workers | 228.6 | 0.0 | -228.6 |
| Total | 78.2 | 78.9 | +0.7 |
* Sources: Statistics Canada, 2011 National Household Survey and 2016 Census.
** Change values may not equal the differences between the attainment rates due to rounding.
Transportation sector
Table 6C shows that the attainment rate of sector occupational LMA of women increased in 5 of the 14 occupational groups from 2017 to 2018. In 2018, the representation of women was also above sector occupational LMA in 8 of the occupational groups, making this sector the most successful at reaching full representation for women at the occupational group level, compared to sector-specific occupational level LMA. Among the 4 sectors, women in the transportation sector reached the highest level of attainment rate of sector occupational LMA in the Middle and Other Managers, Supervisors, Clerical Personnel and Intermediate Sales and Service Personnel occupational groups in 2018.
| Occupational group | 2017 attainment rate of 2011 sector LMA | 2018 attainment rate of 2016 sector LMA | Change in attainment rate from 2017 to 2018 (point of percentage)** |
|---|---|---|---|
| Senior managers | 117.1 | 123.7 | +6.6 |
| Middle and other managers | 109.3 | 108.3 | -0.9 |
| Professionals | 104.1 | 103.1 | -1.0 |
| Semi-professionals and technicians | 89.1 | 79.2 | -9.9 |
| Supervisors | 114.2 | 118.5 | +4.3 |
| Supervisors: crafts and trades | 74.1 | 57.0 | -17.1 |
| Administrative and senior clerical personnel | 89.9 | 88.0 | -1.9 |
| Skilled sales and service personnel | 72.9 | 64.5 | -8.5 |
| Skilled crafts and trades workers | 125.2 | 130.4 | +5.2 |
| Clerical personnel | 101.5 | 99.4 | -2.0 |
| Intermediate sales and service personnel | 112.2 | 109.0 | -3.2 |
| Semi-skilled manual workers | 96.7 | 104.0 | +7.3 |
| Other sales and service personnel | 131.3 | 125.1 | -6.3 |
| Other manual workers | 37.9 | 39.2 | +1.4 |
| Total | 118.2 | 118.9 | +0.7 |
* Sources: Statistics Canada, 2011 National Household Survey and 2016 Census.
** Change values may not equal the differences between the attainment rates due to rounding.
‘Other’ sector
Table 6D shows that, between 2017 and 2018, the attainment rate of sector occupational LMA of women increased in 8 of the 14 occupational groups. In 2018, the representation of women surpassed sector occupational LMA in the Senior Managers, Skilled Crafts and Trades Workers and Other Sales and Service Personnel occupational groups. Among the 4 sectors, women in the ‘other’ sector reached the highest level of attainment rate of sector occupational LMA in the Supervisors: Crafts and Trades, Administrative and Senior Clerical Personnel and Skilled Crafts and Trades Workers occupational groups in 2018. However, women in this sector have the lowest level of attainment rate of sector occupational LMA in the Senior Managers, Middle and Other Managers, Semi-professionals and Technicians, Skilled Sales and Service Personnel, Intermediate Sales and Service Personnel and Semi-skilled Manual Workers occupational groups in 2018.
| Occupational group | 2017 attainment rate of 2011 sector LMA | 2018 attainment rate of 2016 sector LMA | Change in attainment rate from 2017 to 2018 (point of percentage)** |
|---|---|---|---|
| Senior managers | 104.9 | 119.4 | +14.6 |
| Middle and other managers | 89.0 | 87.7 | -1.3 |
| Professionals | 92.8 | 93.9 | +1.1 |
| Semi-professionals and technicians | 64.3 | 67.2 | +2.8 |
| Supervisors | 86.6 | 92.0 | +5.4 |
| Supervisors: crafts and trades | 68.5 | 78.2 | +9.8 |
| Administrative and senior clerical personnel | 101.4 | 98.8 | -2.6 |
| Skilled sales and service personnel | 28.7 | 30.6 | +1.9 |
| Skilled crafts and trades workers | 199.3 | 186.6 | -12.7 |
| Clerical personnel | 104.9 | 99.0 | -5.9 |
| Intermediate sales and service personnel | 79.7 | 79.0 | -0.7 |
| Semi-skilled manual workers | 56.4 | 62.5 | +6.1 |
| Other sales and service personnel | 94.6 | 101.7 | +7.1 |
| Other manual workers | 46.5 | 46.2 | -0.3 |
| Total | 83.1 | 86.2 | +3.1 |
* Sources: Statistics Canada, 2011 National Household Survey and 2016 Census.
** Change values may not equal the differences between the attainment rates due to rounding.
Additional data on the representation, hires, promotions and terminations of employees by designated group and sector is provided in Appendix A.
Aboriginal peoples
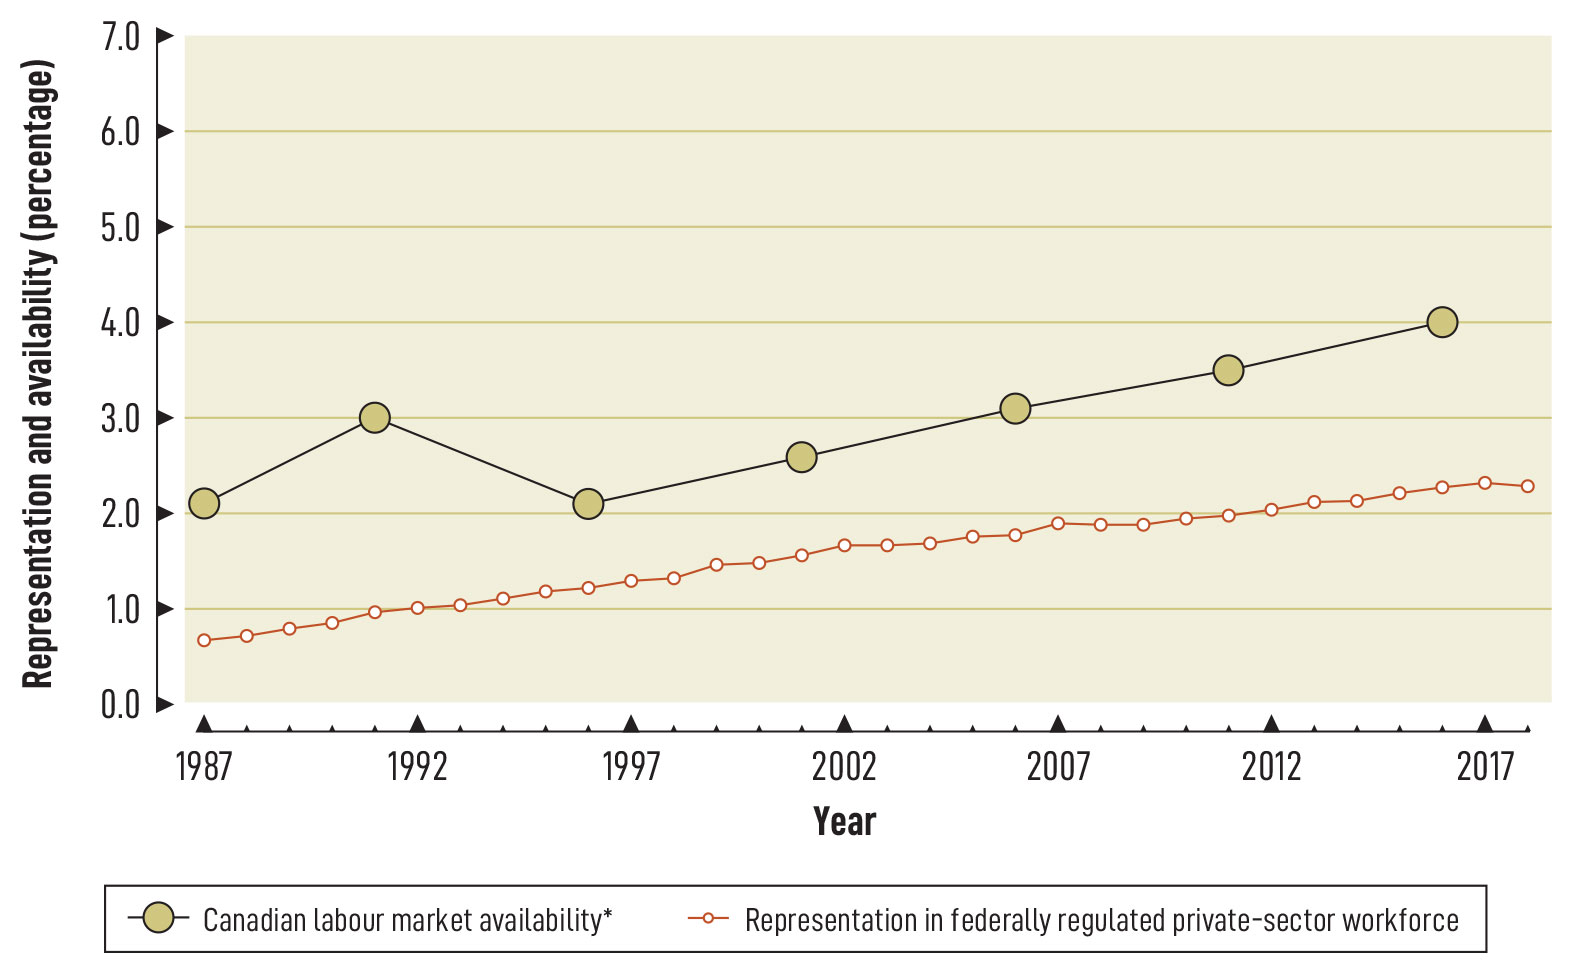
For the third year in a row, the representation of Aboriginal peoples remained at 2.3%. In 2018, more Aboriginal employees left than entered the workforce at the overall level and in 3 of the 4 sectors. The only exception was the transportation sector where a higher number and share of Aboriginal employees were hired than left the workplace.
Chart 4 shows that the representation of Aboriginal peoples remained short of the 4.0% Canadian LMA; however, the representation of Aboriginal peoples has been increasing steadily since its initial low of 0.7% in 1987.
* Sources: Statistics Canada, 1986 to 2016 Census and 2011 National Household Survey.
Chart 4: text description
| Year | Canadian labour market availability | Representation in federally regulated private sector workforce |
|---|---|---|
| 1987 | 2.1 | 0.66 |
| 1988 | N/A | 0.71 |
| 1989 | N/A | 0.79 |
| 1990 | N/A | 0.85 |
| 1991 | 3 | 0.96 |
| 1992 | N/A | 1.01 |
| 1993 | N/A | 1.04 |
| 1994 | N/A | 1.10 |
| 1995 | N/A | 1.17 |
| 1996 | 2.1 | 1.22 |
| 1997 | N/A | 1.29 |
| 1998 | N/A | 1.32 |
| 1999 | N/A | 1.46 |
| 2000 | N/A | 1.48 |
| 2001 | 2.6 | 1.55 |
| 2002 | N/A | 1.66 |
| 2003 | N/A | 1.65 |
| 2004 | N/A | 1.68 |
| 2005 | N/A | 1.76 |
| 2006 | 3.1 | 1.77 |
| 2007 | N/A | 1.90 |
| 2008 | N/A | 1.88 |
| 2009 | N/A | 1.88 |
| 2010 | N/A | 1.94 |
| 2011 | 3.5 | 1.97 |
| 2012 | N/A | 2.04 |
| 2013 | N/A | 2.12 |
| 2014 | N/A | 2.13 |
| 2015 | N/A | 2.21 |
| 2016 | 4.0 | 2.28 |
| 2017 | N/A | 2.31 |
| 2018 | N/A | 2.28 |
Note: In 1996, the Census methodology for calculating LMA of Aboriginal peoples changed, causing a drop in LMA.
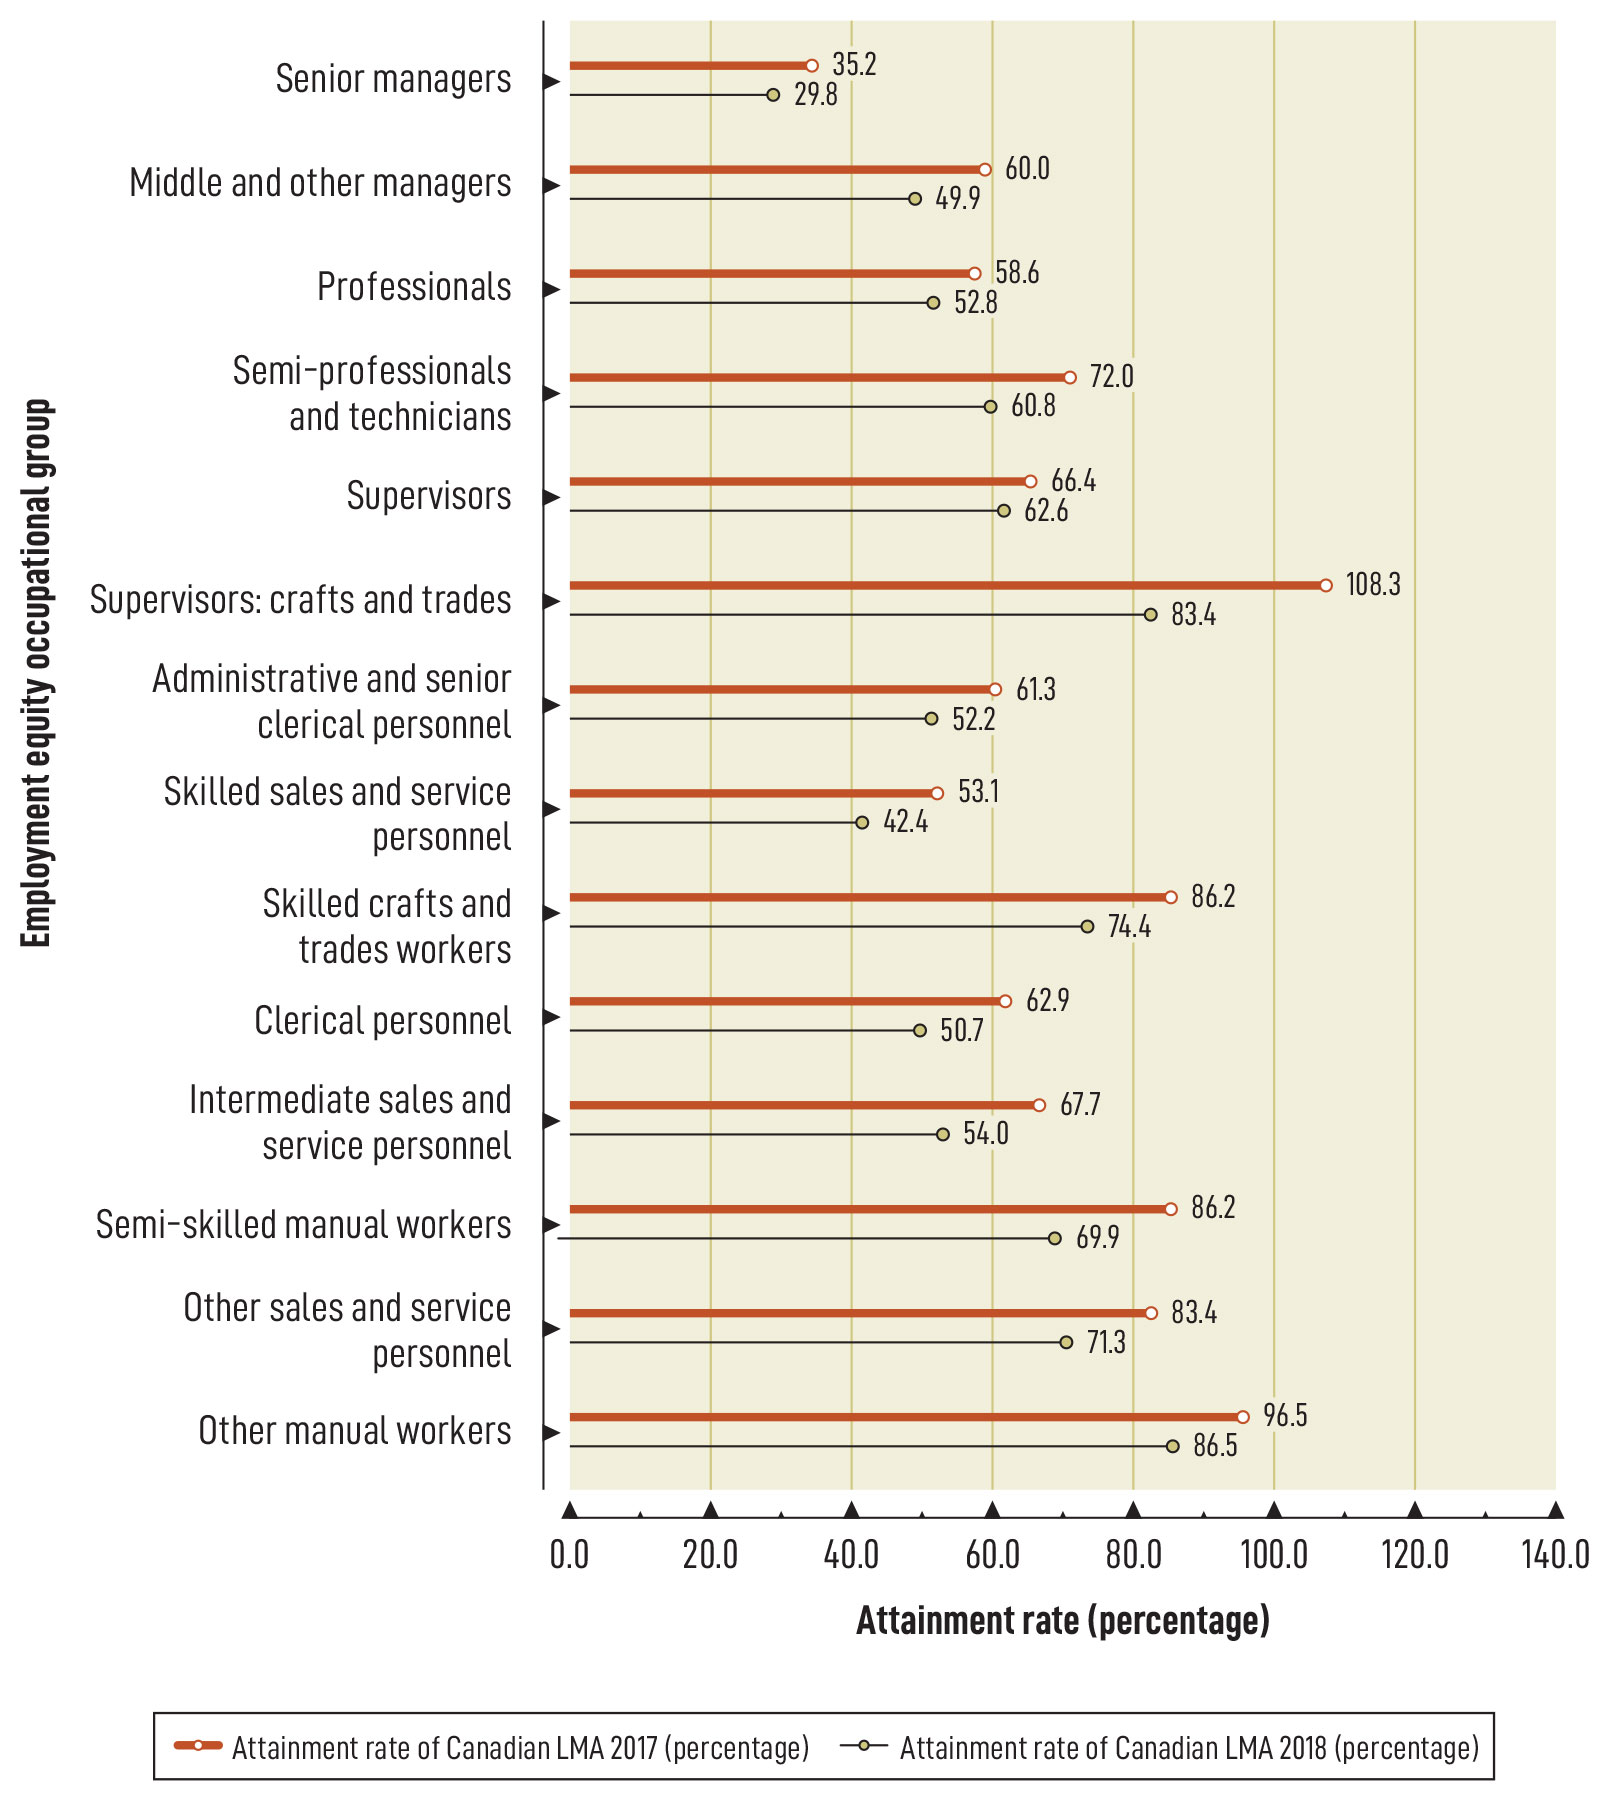
Chart 5 shows that at the overall level, the representation of Aboriginal peoples continued to be significantly short of reaching full representation in the Senior Managers occupational group. Aboriginal peoples’ representation in the other supervisory and management occupations were also below Canadian LMA but to a lesser extent. Aboriginal employees in the Supervisors: Crafts and Trades occupational group were fully represented in 2017 but dropped to an attainment rate of Canadian LMA of 83.4% in 2018.
* Sources: Statistics Canada, 2011 National Household Survey and 2016 Census.
Chart 5: text description
| Occupational group | Attainment rate of Canadian LMA 2017 (percentage) | Attainment rate of Canadian LMA 2018 (percentage) |
|---|---|---|
| Senior managers | 35.2 | 29.8 |
| Middle and other managers | 60.0 | 49.9 |
| Professionals | 58.6 | 52.8 |
| Semi-professionals and technicians | 72.0 | 60.8 |
| Supervisors | 66.4 | 62.6 |
| Supervisors: crafts and trades | 108.3 | 83.4 |
| Administrative and senior clerical personnel | 61.3 | 52.2 |
| Skilled sales and service personnel | 53.1 | 42.4 |
| Skilled crafts and trades workers | 86.2 | 74.4 |
| Clerical personnel | 62.9 | 50.7 |
| Intermediate sales and service personnel | 67.7 | 54.0 |
| Semi-skilled manual workers | 86.2 | 69.9 |
| Other sales and service personnel | 83.4 | 71.3 |
| Other manual workers | 96.5 | 86.5 |
Banking and financial services sector
Table 7A shows that, from 2017 to 2018, the attainment rate of sector occupational LMA of Aboriginal peoples decreased in all occupational groups where there were employees, except in the Semi-skilled Manual Workers occupational group which increased by +0.9 of a percentage point. The decrease in the attainment rate of sector occupational LMA in the Skilled Crafts and Trades Workers occupational group is particularly noticeable at -240.5 percentage points, but this is a very small occupational group that consisted of a total of 14 employees and no reported Aboriginal peoples in 2018. The representation of Aboriginal peoples was well below sector occupational LMA in all occupational groups in 2018.
| Occupational group | 2017 attainment rate of 2011 sector LMA | 2018 attainment rate of 2016 sector LMA | Change in attainment rate from 2017 to 2018 (point of percentage)** |
|---|---|---|---|
| Senior managers | 87.5 | 58.5 | -29.1 |
| Middle and other managers | 86.9 | 74.0 | -13.0 |
| Professionals | 89.6 | 84.6 | -4.9 |
| Semi-professionals and technicians | 88.7 | 53.1 | -35.6 |
| Supervisors | 100.2 | 67.7 | -32.6 |
| Supervisors: crafts and trades | 0.0 | 0.0 | 0.0 |
| Administrative and senior clerical personnel | 76.2 | 63.8 | -12.4 |
| Skilled sales and service personnel | 110.0 | 64.8 | -45.2 |
| Skilled crafts and trades workers | 240.5 | 0.0 | -240.5 |
| Clerical personnel | 71.9 | 71.7 | -0.2 |
| Intermediate sales and service personnel | 76.6 | 69.5 | -7.1 |
| Semi-skilled manual workers | 56.0 | 56.9 | +0.9 |
| Other sales and service personnel | 0.0 | 0.0 | 0.0 |
| Other manual workers | 0.0 | 0.0 | 0.0 |
| Total | 76.4 | 72.1 | -4.3 |
* Sources: Statistics Canada, 2011 National Household Survey and 2016 Census.
** Change values may not equal the differences between the attainment rates due to rounding.
Communications sector
Table 7B shows that the attainment rate of sector occupational LMA of Aboriginal peoples improved in Senior Managers, Supervisors, Supervisors: Crafts and Trades and Other Sales and Service Personnel occupational groups between 2017 and 2018. Two particularly noticeable declines in the Aboriginal peoples’ attainment rate of sector LMA were noted. The first decrease of -242.5 percentage points in the Semi-skilled Manual Workers occupational group was mainly due to the increase in the sector occupational LMA from 0.8% in 2017 based on the 2011 National Household Survey to 3.7% in 2018 based on the 2016 Census. The second noticeable decrease of -400.0 percentage points in the Other Manual Workers occupational group was due to the small size of this occupational group that consisted of a total of 9 employees and no reported Aboriginal peoples in 2018. However, the representation of Aboriginal peoples in the Professionals, Supervisors and Supervisors: Crafts and Trades occupational groups was above sector occupational LMA in 2018.
| Occupational group | 2017 attainment rate of 2011 sector LMA | 2018 attainment rate of 2016 sector LMA | Change in attainment rate from 2017 to 2018 (point of percentage)** |
|---|---|---|---|
| Senior managers | 26.9 | 53.6 | +26.6 |
| Middle and other managers | 109.6 | 85.2 | -24.4 |
| Professionals | 111.4 | 109.3 | -2.1 |
| Semi-professionals and technicians | 79.1 | 61.6 | -17.5 |
| Supervisors | 179.4 | 231.4 | +52.0 |
| Supervisors: crafts and trades | 69.8 | 104.0 | +34.2 |
| Administrative and senior clerical personnel | 68.6 | 67.9 | -0.7 |
| Skilled sales and service personnel | 118.7 | 84.8 | -33.9 |
| Skilled crafts and trades workers | 126.3 | 93.3 | -33.0 |
| Clerical personnel | 100.3 | 80.6 | -19.7 |
| Intermediate sales and service personnel | 108.7 | 77.1 | -31.6 |
| Semi-skilled manual workers | 317.6 | 75.0 | -242.5 |
| Other sales and service personnel | 66.2 | 87.1 | +20.9 |
| Other manual workers | 400.0 | 0.0 | -400.0 |
| Total | 96.2 | 84.6 | -11.6 |
* Sources: Statistics Canada, 2011 National Household Survey and 2016 Census.
** Change values may not equal the differences between the attainment rates due to rounding.
Transportation sector
Table 7C shows that the attainment rate of sector occupational LMA of Aboriginal peoples decreased in all 14 occupational groups from 2017 to 2018. The attainment rate of sector occupational LMA that were fully represented in 6 occupational groups in 2017 dropped below 100% in 2018 mainly due to increases in the Aboriginal peoples’ sector occupational LMA data between the 2011 National Household Survey and the 2016 Census.
| Occupational group | 2017 attainment rate of 2011 sector LMA | 2018 attainment rate of 2016 sector LMA | Change in attainment rate from 2017 to 2018 (point of percentage)** |
|---|---|---|---|
| Senior managers | 212.7 | 58.0 | -154.7 |
| Middle and other managers | 86.4 | 65.6 | -20.8 |
| Professionals | 145.3 | 101.1 | -44.2 |
| Semi-professionals and technicians | 98.9 | 66.9 | -32.0 |
| Supervisors | 88.2 | 83.5 | -4.7 |
| Supervisors: crafts and trades | 152.4 | 77.7 | -74.6 |
| Administrative and senior clerical personnel | 80.8 | 66.2 | -14.6 |
| Skilled sales and service personnel | 224.3 | 77.5 | -146.8 |
| Skilled crafts and trades workers | 111.5 | 85.8 | -25.7 |
| Clerical personnel | 83.1 | 66.1 | -17.0 |
| Intermediate sales and service personnel | 121.0 | 84.8 | -36.2 |
| Semi-skilled manual workers | 90.2 | 79.4 | -10.8 |
| Other sales and service personnel | 91.4 | 87.3 | -4.1 |
| Other manual workers | 63.7 | 60.4 | -3.3 |
| Total | 88.3 | 74.7 | -13.6 |
* Sources: Statistics Canada, 2011 National Household Survey and 2016 Census.
** Change values may not equal the differences between the attainment rates due to rounding.
‘Other’ sector
Between 2017 and 2018, Aboriginal peoples’ attainment rate of sector occupational LMA decreased in 10 occupational groups but this designated group continued to be fully represented in the Semi-professionals and Technicians, Skilled Crafts and Trades Workers and Semi-skilled Manual Workers occupational groups in 2018. The attainment rate of sector occupational LMA improved in the Professionals, Skilled Sales and Service Personnel and Other Sales and Service Personnel occupational groups.
| Occupational group | 2017 attainment rate of 2011 sector LMA | 2018 attainment rate of 2016 sector LMA | Change in attainment rate from 2017 to 2018 (point of percentage)** |
|---|---|---|---|
| Senior managers | 20.0 | 14.8 | -5.3 |
| Middle and other managers | 61.1 | 61.1 | -0.0 |
| Professionals | 83.2 | 89.9 | +6.6 |
| Semi-professionals and technicians | 109.5 | 106.3 | -3.1 |
| Supervisors | 88.0 | 60.9 | -27.1 |
| Supervisors: crafts and trades | 97.2 | 73.7 | -23.5 |
| Administrative and senior clerical personnel | 82.1 | 73.3 | -8.8 |
| Skilled sales and service personnel | 64.9 | 68.4 | +3.5 |
| Skilled crafts and trades workers | 151.2 | 113.0 | -38.2 |
| Clerical personnel | 86.4 | 65.4 | -21.0 |
| Intermediate sales and service personnel | 48.4 | 44.4 | -4.0 |
| Semi-skilled manual workers | 211.9 | 127.5 | -84.4 |
| Other sales and service personnel | 43.5 | 45.8 | +2.2 |
| Other manual workers | 79.2 | 71.6 | -7.6 |
| Total | 93.6 | 78.7 | -14.9 |
* Sources: Statistics Canada, 2011 National Household Survey and 2016 Census.
** Change values may not equal the differences between the attainment rates due to rounding.
Additional data on the representation, hires, promotions and terminations of employees by designated group and sector is provided in Appendix A.
Persons with disabilities
The representation of persons with disabilities increased from 3.3% in 2017 to 3.4% in 2018 despite the continued trend over the past decade of a higher number of this designated group leaving than entering the workforce.
Statistics Canada introduced new methodology for collecting the LMA data on persons with disabilities when it conducted its 2017 CSD which resulted in a significant increase in LMA from 4.9% in 2012 to 9.1% in 2017 at the overall level. This change is largely due to one factor – better overall coverage of persons with disabilities in the 2017 CSD compared to the 2012 CSD. The significant changes are largely the result of introducing the new version of the 2016 Census “Activities of Daily Living” filter questions, which were used to create the sampling frame for the CSD. Qualitative and quantitative testing have shown that these new filter questions used for the 2017 CSD sampling frame, compared to the census filter questions used for the 2012 CSD, allow for better coverage overall of persons with disabilities, and especially of persons with disability types that are less visible, such as disabilities related to pain, memory, learning, development and mental health. The increased prevalence of disability in the 2017 CSD is attributable in large part to this improved coverage of persons with disabilities.Footnote 8
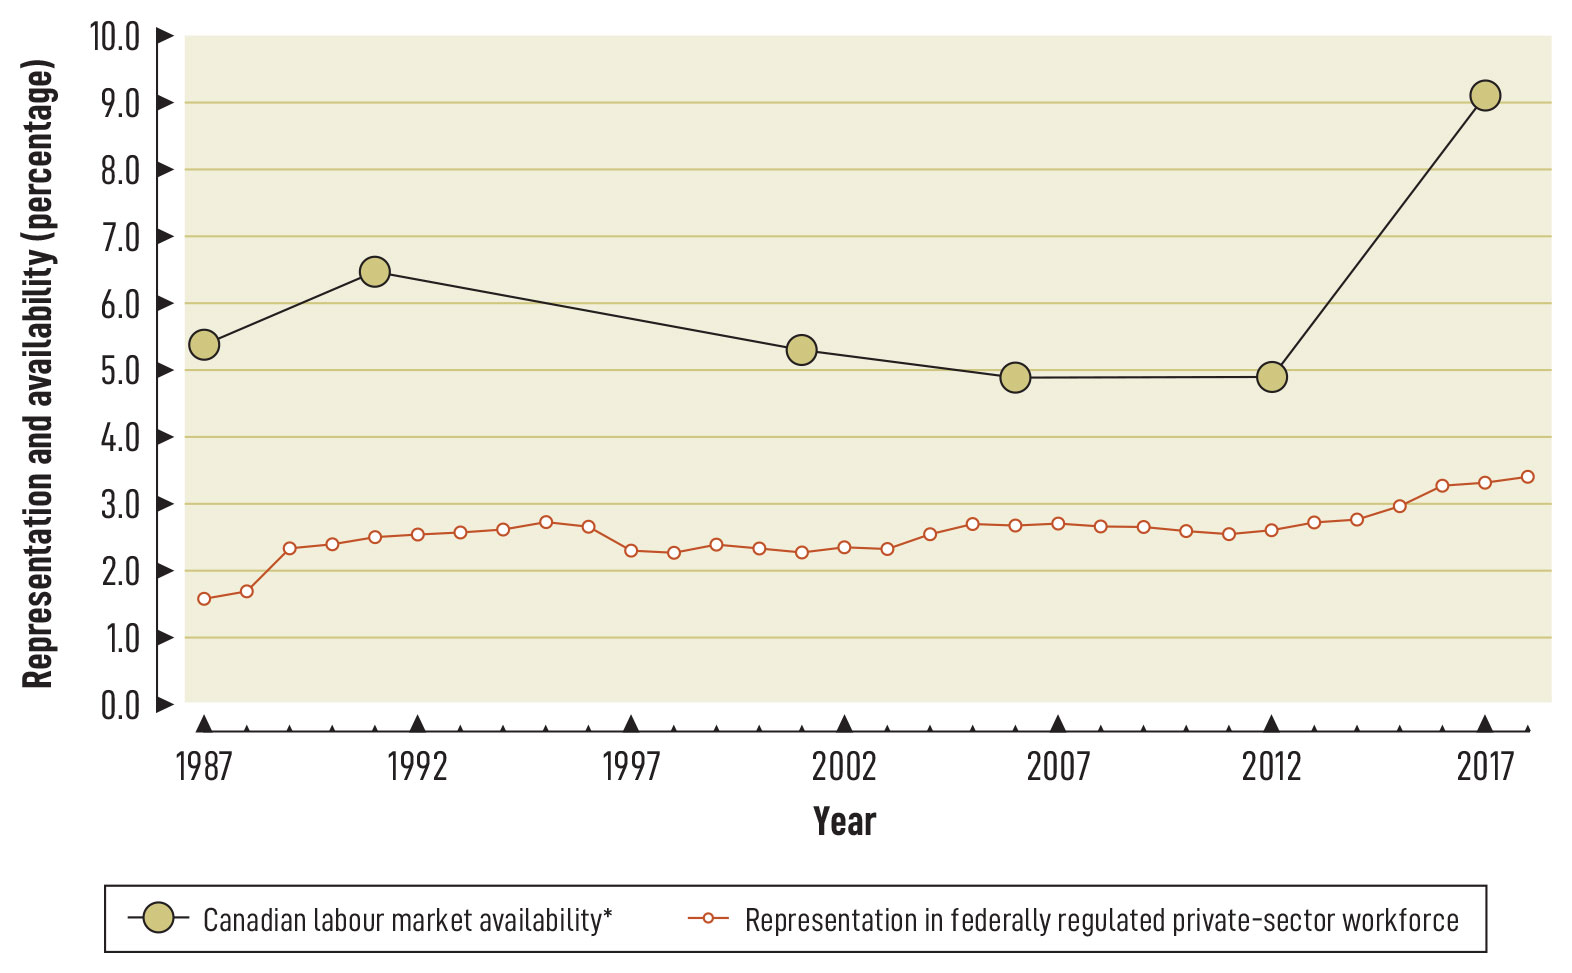
Chart 6 illustrates that the representation of persons with disabilities reached its highest level at 3.4% in 2018, a significant increase from the initial low of 1.6% in 1987. The 2018 representation rate is currently 5.7 percentage points below the 9.1% Canadian LMA.
* Sources: Statistics Canada, 1986 and 1991 Health and Activity Limitation Survey; 2001 and 2006 Participation and Activity Limitation Survey; and 2012 and 2017 Canadian Survey on Disability.
Chart 6: text description
| Year | Canadian labour market availability | Representation in federally regulated private sector workforce |
|---|---|---|
| 1987 | 5.4 | 1.59 |
| 1988 | N/A | 1.69 |
| 1989 | N/A | 2.34 |
| 1990 | N/A | 2.39 |
| 1991 | 6.5 | 2.51 |
| 1992 | N/A | 2.54 |
| 1993 | N/A | 2.56 |
| 1994 | N/A | 2.63 |
| 1995 | N/A | 2.73 |
| 1996 | 6.5 | 2.66 |
| 1997 | N/A | 2.32 |
| 1998 | N/A | 2.26 |
| 1999 | N/A | 2.39 |
| 2000 | N/A | 2.32 |
| 2001 | 5.3 | 2.29 |
| 2002 | N/A | 2.35 |
| 2003 | N/A | 2.32 |
| 2004 | N/A | 2.54 |
| 2005 | N/A | 2.70 |
| 2006 | 4.9 | 2.67 |
| 2007 | N/A | 2.70 |
| 2008 | N/A | 2.66 |
| 2009 | N/A | 2.66 |
| 2010 | N/A | 2.60 |
| 2011 | 4.9 | 2.56 |
| 2012 | N/A | 2.62 |
| 2013 | N/A | 2.72 |
| 2014 | N/A | 2.78 |
| 2015 | N/A | 2.96 |
| 2016 | 9.1 | 3.28 |
| 2017 | N/A | 3.31 |
| 2018 | N/A | 3.41 |
Note: In 2001, Statistics Canada began using the World Health Organization’s International Classification of Functioning, Disability and Health framework to define disability rather than the 1980 International Classification of Impairments, Disabilities, and Handicaps; this resulted in a drop in LMA. In 2017, Statistics Canada introduced new methodology for capturing persons with disabilities data that resulted in a significant increase in LMA for this designated group.
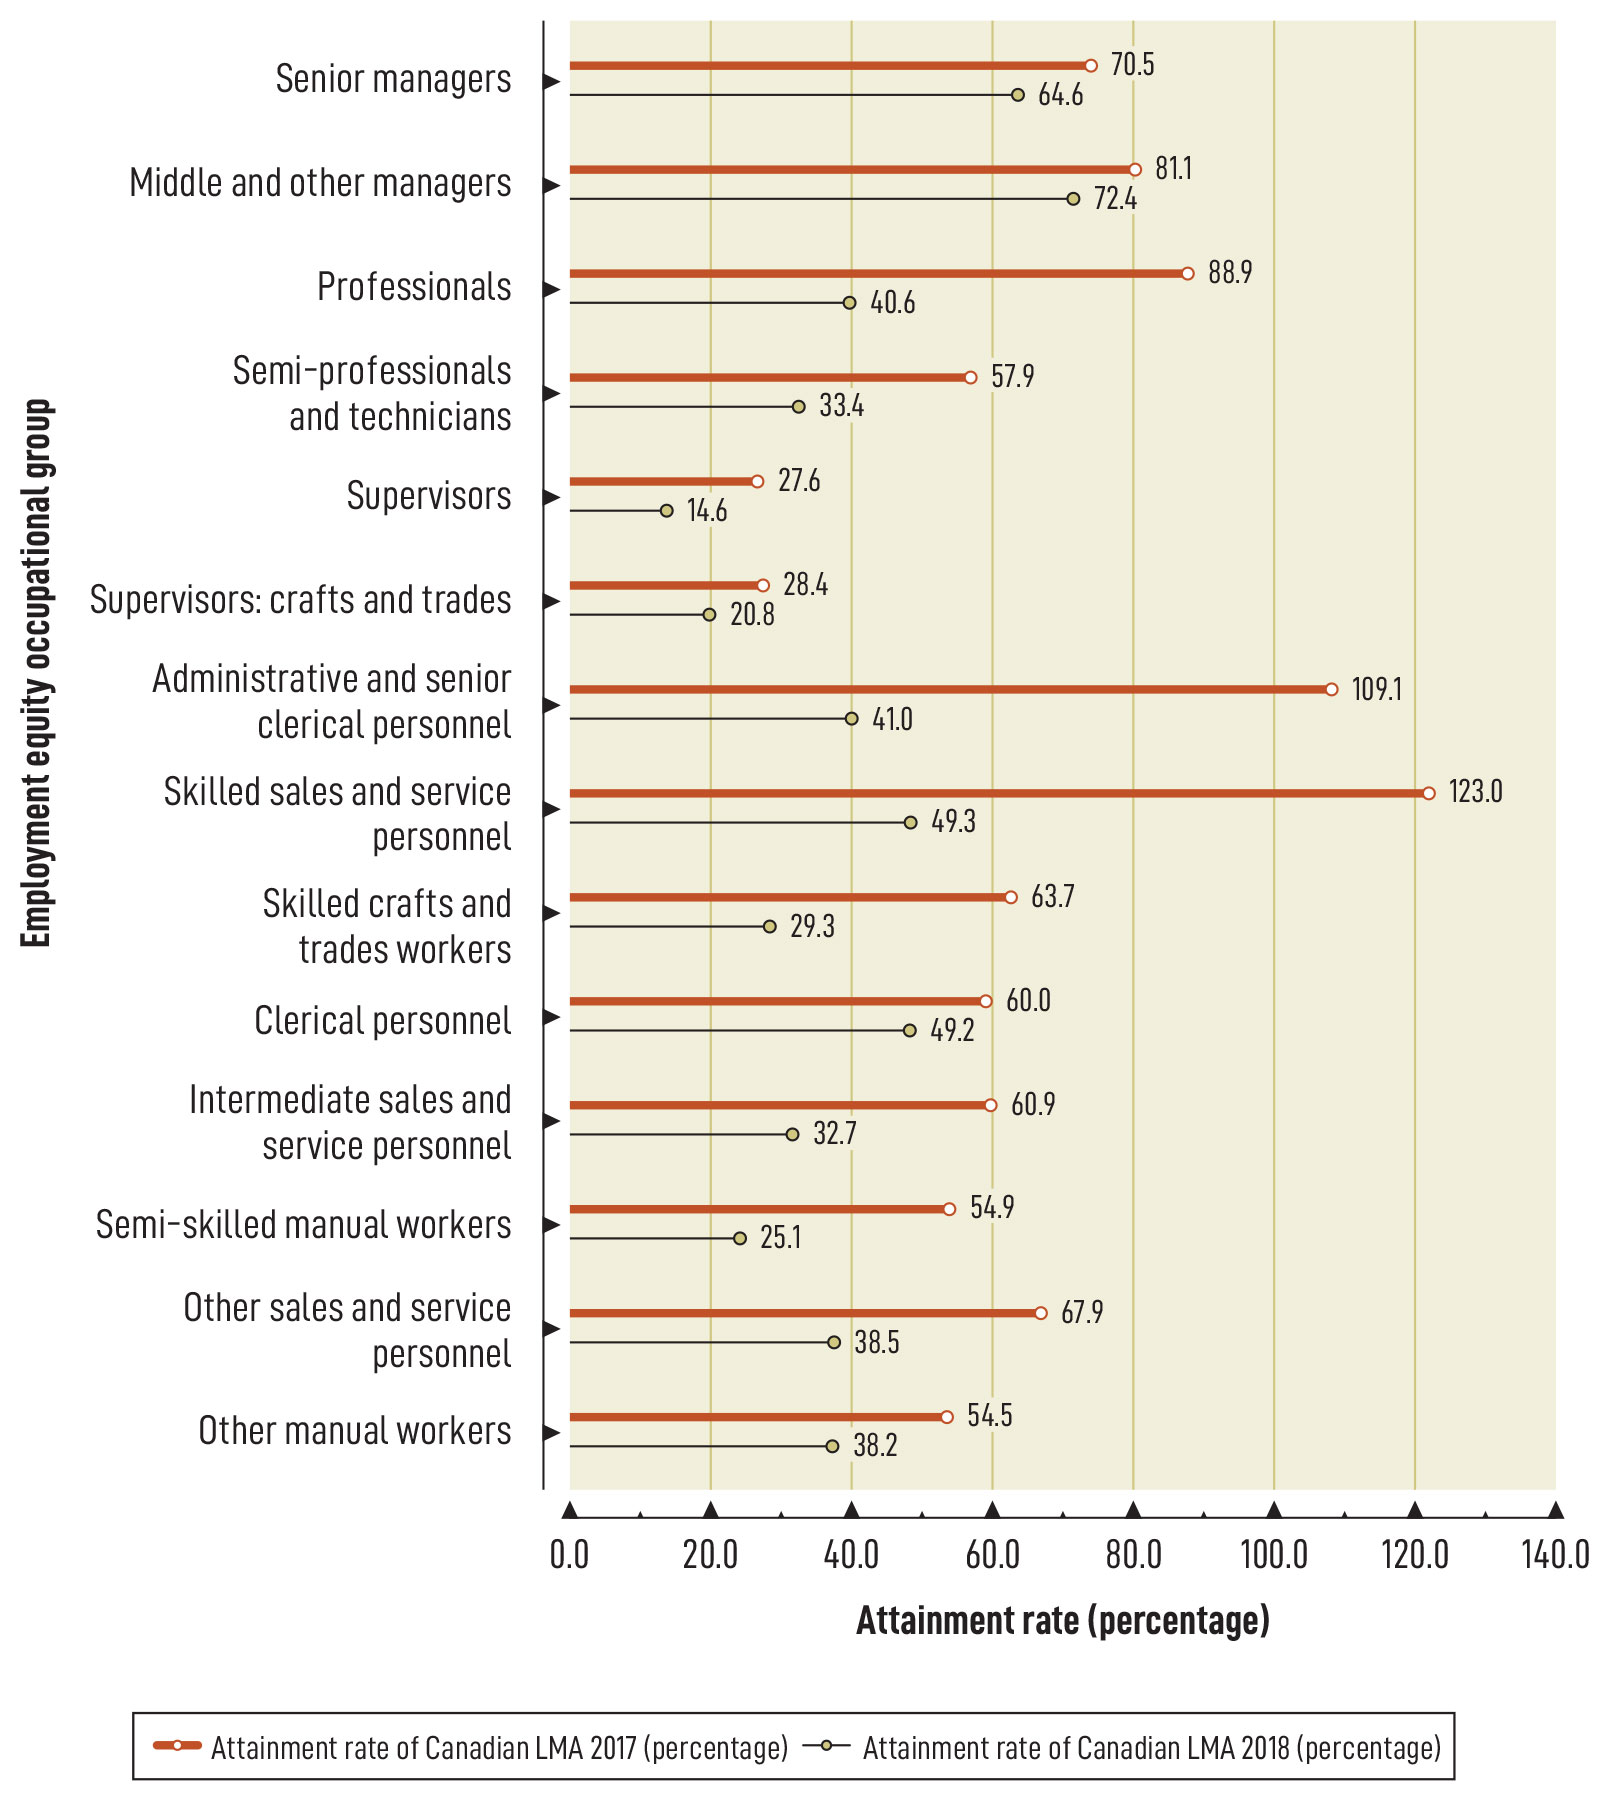
Chart 7 shows that at the overall level, the attainment rate of Canadian LMA of persons with disabilities is low in all occupational groups in 2018. The attainment rate of persons with disabilities dropped by more than 50 percentage points in the Administrative and Senior Clerical Personnel and Skilled Sales and Service Personnel occupational groups, where this designated group was previously well represented in 2017. The main reason for the decrease in attainment rates of Canadian LMA of persons with disabilities is Statistics Canada’s change in methodology, when it collected the LMA data through the new 2017 CSD, which led to higher LMA data.
* Sources: Statistics Canada, 2012 and 2017 Canadian Survey on Disability.
Chart 7: text description
| Occupational group | Attainment rate of Canadian LMA 2017 (percentage) | Attainment rate of Canadian LMA 2018 (percentage) |
|---|---|---|
| Senior managers | 70.5 | 64.6 |
| Middle and other managers | 81.1 | 72.4 |
| Professionals | 88.9 | 40.6 |
| Semi-professionals and technicians | 57.9 | 33.4 |
| Supervisors | 27.6 | 14.6 |
| Supervisors: crafts and trades | 28.4 | 20.8 |
| Administrative and senior clerical personnel | 109.1 | 41.0 |
| Skilled sales and service personnel | 123.0 | 49.3 |
| Skilled crafts and trades workers | 63.7 | 29.3 |
| Clerical personnel | 60.0 | 49.2 |
| Intermediate sales and service personnel | 60.9 | 32.7 |
| Semi-skilled manual workers | 54.9 | 25.1 |
| Other sales and service personnel | 67.9 | 38.5 |
| Other manual workers | 54.5 | 38.2 |
Data on the attainment rate of sector occupational LMA of persons with disabilities is not available as numbers are negligible. Additional data on the representation, hires, promotions and terminations of employees by designated group and sector is provided in Appendix A.
Members of visible minorities
The representation of members of visible minorities in the federally regulated private sector increased from 22.8% in 2017 to 23.8% in 2018. All sectors combined and in each sector, except for the communications sector, more members of visible minorities entered than left the workforce. This designated group also received a higher share of promotions than their representation level at the overall level and in each sector, with the exception of the ‘other’ sector.
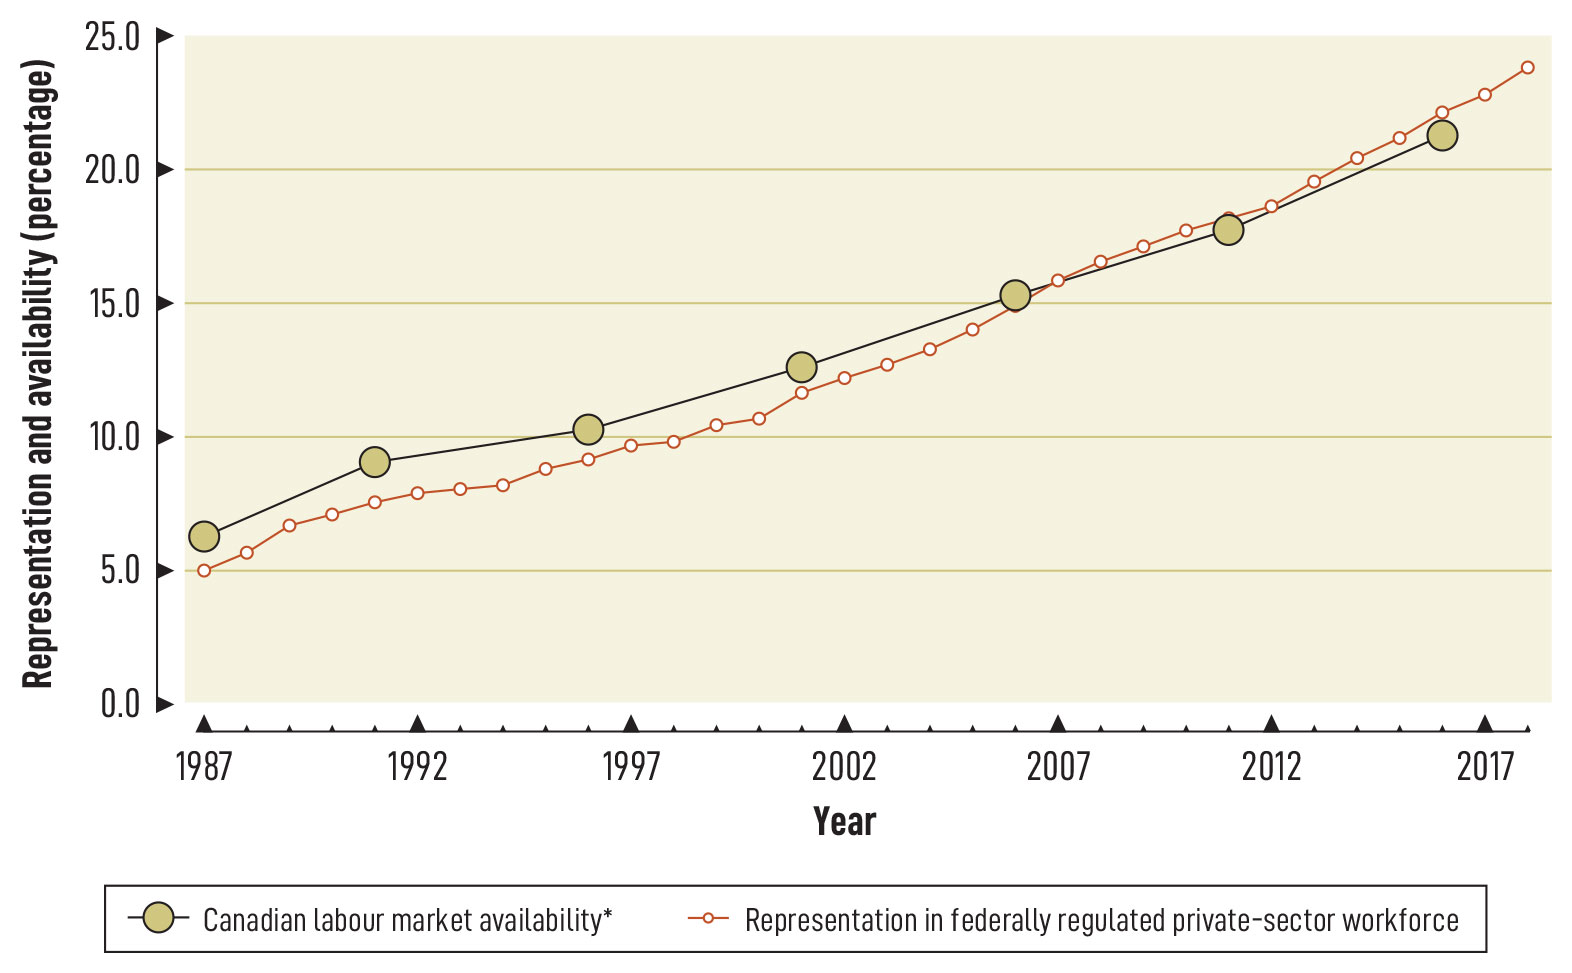
Chart 8 illustrates that since 1987, the representation of members of visible minorities has been increasing steadily; this designated group has made the most progress in overall representation since 1987.
* Sources: Statistics Canada, 1986 to 2016 Census and 2011 National Household Survey.
Chart 8: text description
| Year | Canadian labour market availability | Representation in federally regulated private sector workforce |
|---|---|---|
| 1987 | 6.3 | 5.00 |
| 1988 | N/A | 5.67 |
| 1989 | N/A | 6.67 |
| 1990 | N/A | 7.09 |
| 1991 | 9.1 | 7.57 |
| 1992 | N/A | 7.91 |
| 1993 | N/A | 8.05 |
| 1994 | N/A | 8.23 |
| 1995 | N/A | 8.84 |
| 1996 | 10.3 | 9.20 |
| 1997 | N/A | 9.67 |
| 1998 | N/A | 9.86 |
| 1999 | N/A | 10.43 |
| 2000 | N/A | 10.67 |
| 2001 | 12.6 | 11.67 |
| 2002 | N/A | 12.22 |
| 2003 | N/A | 12.73 |
| 2004 | N/A | 13.30 |
| 2005 | N/A | 14.06 |
| 2006 | 15.3 | 14.91 |
| 2007 | N/A | 15.88 |
| 2008 | N/A | 16.57 |
| 2009 | N/A | 17.11 |
| 2010 | N/A | 17.76 |
| 2011 | 17.8 | 18.17 |
| 2012 | N/A | 18.64 |
| 2013 | N/A | 19.58 |
| 2014 | N/A | 20.41 |
| 2015 | N/A | 21.18 |
| 2016 | 21.3 | 22.15 |
| 2017 | N/A | 22.82 |
| 2018 | N/A | 23.81 |
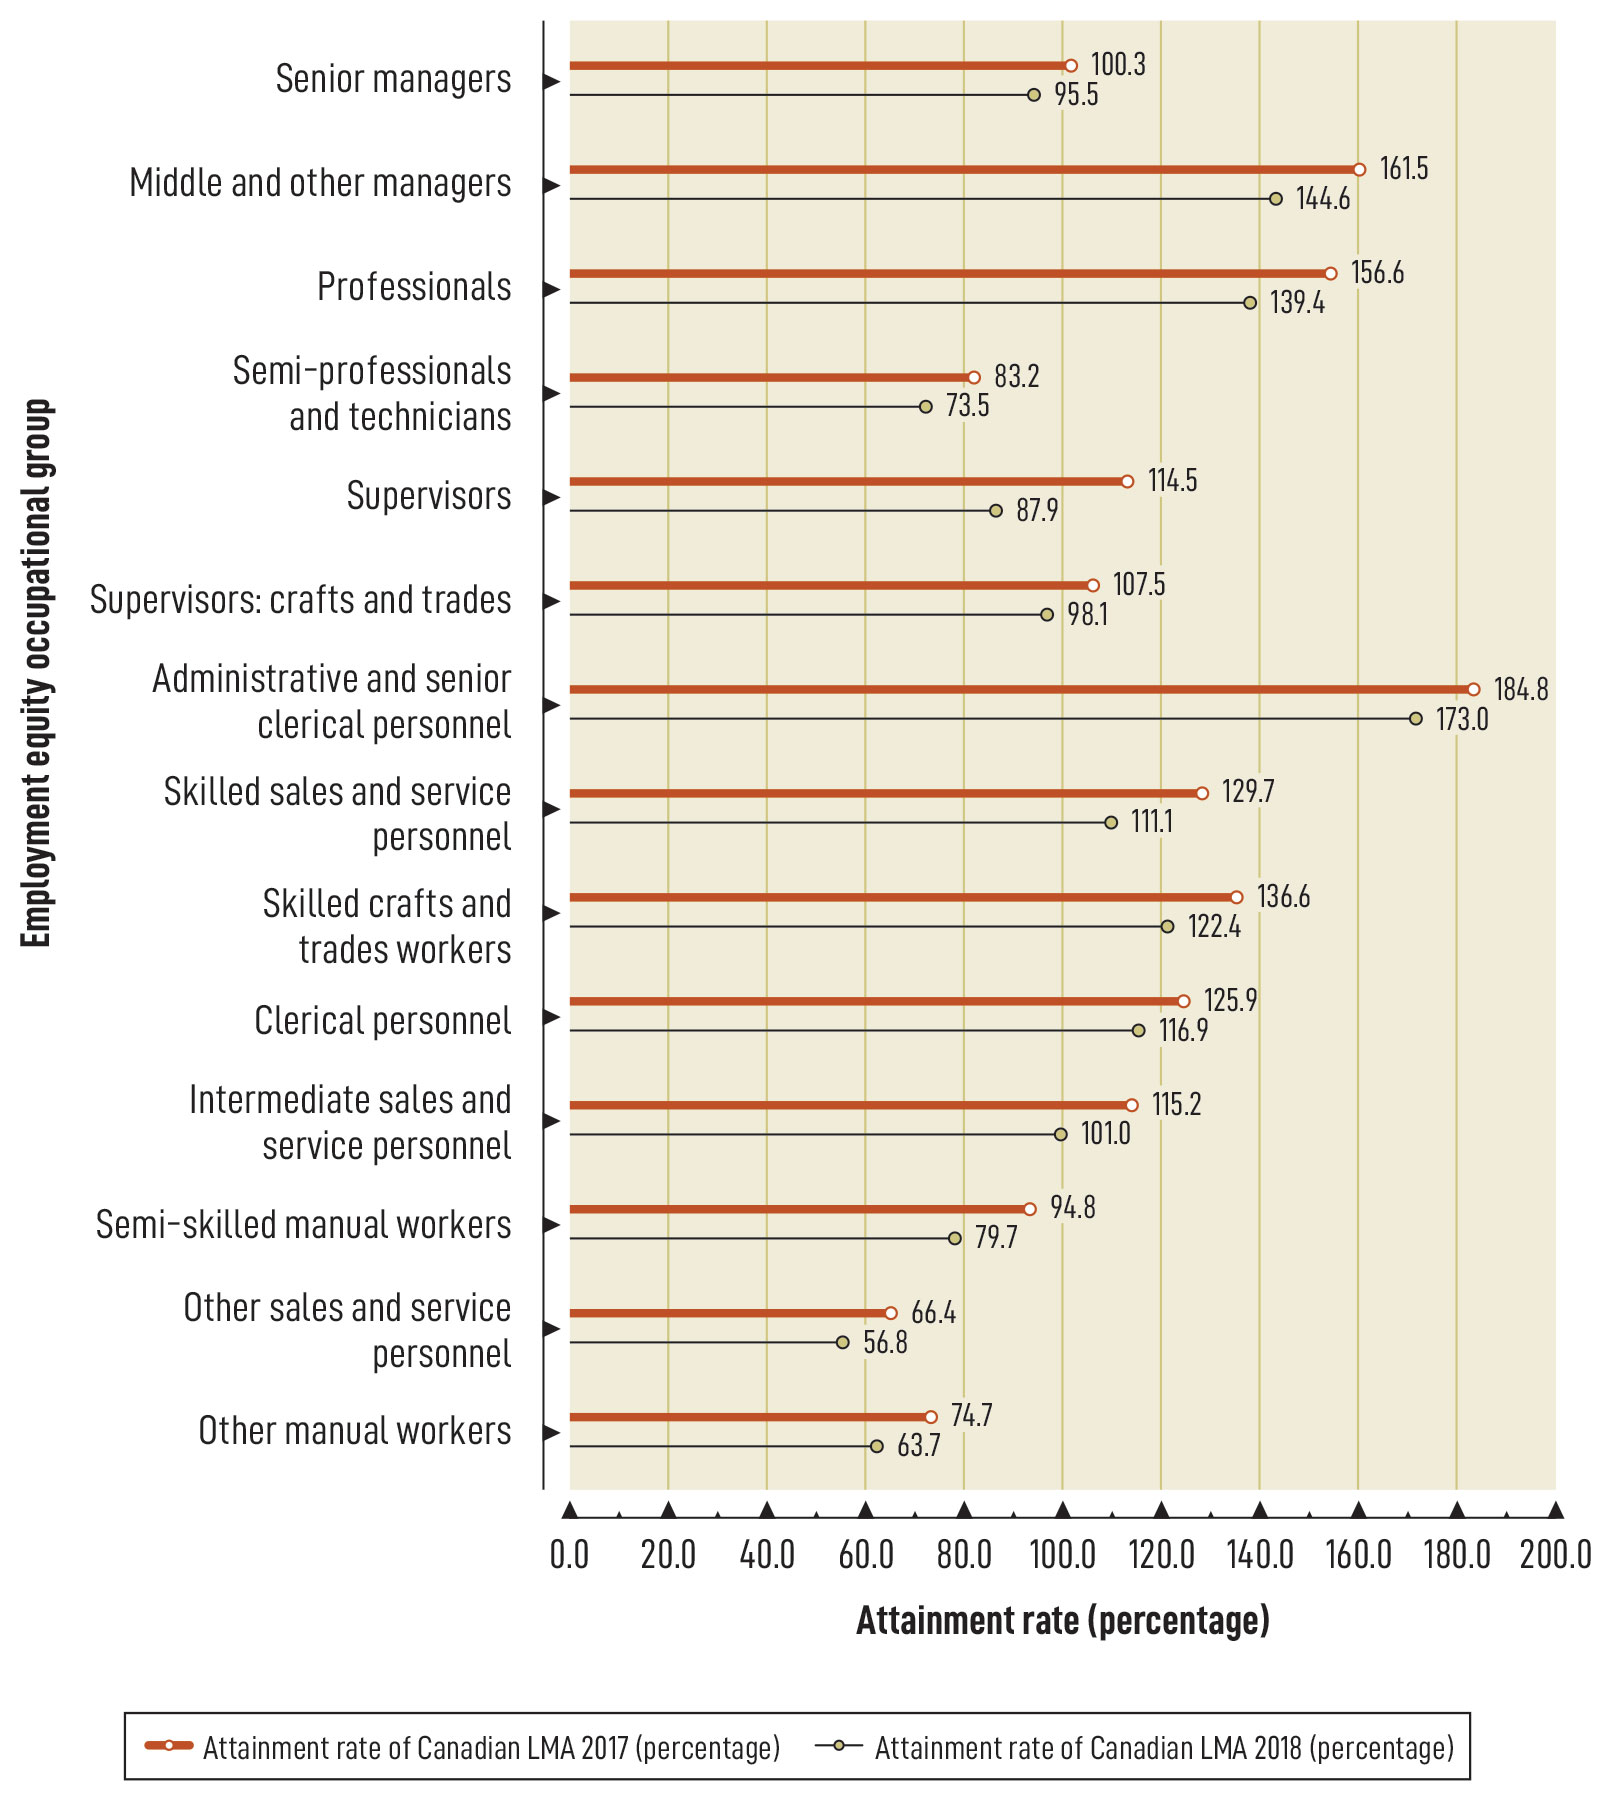
Chart 9 shows that at the overall level, members of visible minorities had attainment rates of Canadian LMA that are above the 100% threshold in 7 of the 14 occupational groups in 2018, including reaching full representation and the highest attainment rate of Canadian LMA in the Administrative and Senior Clerical Personnel occupational group. This designated group’s representation continued to surpass Canadian LMA in the Middle and Other Managers and Professionals occupational groups that are important feeder groups to the Senior Managers occupational group.
* Sources: Statistics Canada, 2011 National Household Survey and 2016 Census.
Chart 9: text description
| Occupational group | Attainment rate of Canadian LMA 2017 (percentage) | Attainment rate of Canadian LMA 2018 (percentage) |
|---|---|---|
| Senior managers | 100.3 | 95.5 |
| Middle and other managers | 161.5 | 144.6 |
| Professionals | 156.6 | 139.4 |
| Semi-professionals and technicians | 83.2 | 73.5 |
| Supervisors | 114.5 | 87.9 |
| Supervisors: crafts and trades | 107.5 | 98.1 |
| Administrative and senior clerical personnel | 184.8 | 173.0 |
| Skilled sales and service personnel | 129.7 | 111.1 |
| Skilled crafts and trades workers | 136.6 | 122.4 |
| Clerical personnel | 125.9 | 116.9 |
| Intermediate sales and service personnel | 115.2 | 101.0 |
| Semi-skilled manual workers | 94.8 | 79.7 |
| Other sales and service personnel | 66.4 | 56.8 |
| Other manual workers | 74.7 | 63.7 |
Banking and financial services sector
Table 8A shows that, from 2017 to 2018, the attainment rate of sector occupational LMA of members of visible minorities increased in the Supervisors: Crafts and Trades, Administrative and Senior Clerical Personnel and Skilled Crafts and Trades Workers occupational groups. The increase in the attainment rate of the Supervisors: Crafts and Trades occupational group is particularly noticeable at +457.1 percentage points, but this is a very small occupational group, where only 8 visible minority employees of a total of 13 employees were reported for 2018, and the sector occupational LMA increased from a negligible amount based on the 2011 NHS to 13.5% based on the 2016 Census. The representation of members of visible minorities was above sector occupational LMA in all but 2 occupational groups where the sector reported representation in 2018. Only in the Skilled Crafts and Trades Workers and Intermediate Sales and Service Personnel occupational groups did the representation of members of visible minorities remain below the sector occupational LMA.
| Occupational group | 2017 attainment rate of 2011 sector LMA | 2018 attainment rate of 2016 sector LMA | Change in attainment rate from 2017 to 2018 (point of percentage)** |
|---|---|---|---|
| Senior managers | 112.8 | 107.3 | -5.5 |
| Middle and other managers | 125.4 | 111.4 | -14.0 |
| Professionals | 113.7 | 104.9 | -8.8 |
| Semi-professionals and technicians | 119.7 | 106.8 | -12.9 |
| Supervisors | 143.9 | 130.5 | -13.4 |
| Supervisors: crafts and trades | - | 457.1 | +457.1 |
| Administrative and senior clerical personnel | 147.8 | 155.1 | +7.3 |
| Skilled sales and service personnel | 130.3 | 105.1 | -25.2 |
| Skilled crafts and trades workers | 0.0 | 54.0 | +54.0 |
| Clerical personnel | 123.4 | 118.3 | -5.1 |
| Intermediate sales and service personnel | 86.3 | 82.8 | -3.5 |
| Semi-skilled manual workers | 277.1 | 234.5 | -42.5 |
| Other sales and service personnel | 230.2 | 154.6 | -75.6 |
| Other manual workers | 0.0 | 0.0 | 0.0 |
| Total | 119.1 | 108.5 | -10.6 |
* Sources: Statistics Canada, 2011 National Household Survey and 2016 Census.
** Change values may not equal the differences between the attainment rates due to rounding.
“-“ Amount is negligible.
Communications sector
Table 8B shows that the attainment rate of sector occupational LMA of members of visible minorities improved in Senior Managers, Supervisors: Crafts and Trades, Clerical Personnel and Other Sales and Service Personnel occupational groups between 2017 and 2018. The decrease in the attainment rate of sector occupational LMA of this designated group in the Other Manual Workers occupational group by ‑124.6 percentage points is particularly noticeable, but this is a very small occupational group where only one visible minority employee of a total of 9 employees were reported for 2018, and the sector occupational LMA increased from 9.4% based on the 2011 NHS to 20.9% based on the 2016 Census. The representation of members of visible minorities was above sector occupational LMA in only 4 of the 14 occupational groups in 2018, including the Middle and Other Managers occupational group.
| Occupational group | 2017 attainment rate of 2011 sector LMA | 2018 attainment rate of 2016 sector LMA | Change in attainment rate from 2017 to 2018 (point of percentage)** |
|---|---|---|---|
| Senior managers | 73.7 | 87.6 | +13.9 |
| Middle and other managers | 115.6 | 109.9 | -5.7 |
| Professionals | 106.0 | 98.3 | -7.7 |
| Semi-professionals and technicians | 89.6 | 86.1 | -3.5 |
| Supervisors | 122.7 | 82.3 | -40.4 |
| Supervisors: crafts and trades | 62.7 | 79.9 | +17.3 |
| Administrative and senior clerical personnel | 122.1 | 109.9 | -12.2 |
| Skilled sales and service personnel | 83.6 | 75.5 | -8.1 |
| Skilled crafts and trades workers | 98.6 | 84.7 | -14.0 |
| Clerical personnel | 107.1 | 107.3 | +0.2 |
| Intermediate sales and service personnel | 90.9 | 78.6 | -12.3 |
| Semi-skilled manual workers | 115.5 | 101.8 | -13.7 |
| Other sales and service personnel | 35.7 | 72.9 | +37.2 |
| Other manual workers | 177.8 | 53.1 | -124.6 |
| Total | 167.8 | 94.8 | -73.0 |
* Sources: Statistics Canada, 2011 National Household Survey and 2016 Census.
** Change values may not equal the differences between the attainment rates due to rounding.
Transportation sector
Table 8C shows that the attainment rate of sector occupational LMA of members of visible minorities only increased in the Semi-professionals and Technicians occupational group from 2017 to 2018. The representation of this designated group only continued to exceed sector occupational LMA in the Administrative and Senior Clerical Personnel occupational group in 2018.
| Occupational group | 2017 attainment rate of 2011 sector LMA | 2018 attainment rate of 2016 sector LMA | Change in attainment rate from 2017 to 2018 (point of percentage)** |
|---|---|---|---|
| Senior managers | 73.8 | 66.0 | -7.8 |
| Middle and other managers | 91.6 | 75.0 | -16.6 |
| Professionals | 95.5 | 82.5 | -13.0 |
| Semi-professionals and technicians | 72.1 | 72.9 | +0.8 |
| Supervisors | 80.5 | 59.8 | -20.7 |
| Supervisors: crafts and trades | 108.7 | 82.8 | -25.8 |
| Administrative and senior clerical personnel | 129.3 | 101.8 | -27.5 |
| Skilled sales and service personnel | 53.3 | 28.2 | -25.0 |
| Skilled crafts and trades workers | 104.5 | 99.2 | -5.3 |
| Clerical personnel | 91.3 | 82.2 | -9.1 |
| Intermediate sales and service personnel | 93.4 | 83.4 | -10.0 |
| Semi-skilled manual workers | 85.0 | 63.1 | -22.0 |
| Other sales and service personnel | 51.2 | 44.9 | -6.3 |
| Other manual workers | 96.9 | 63.7 | -33.2 |
| Total | 87.4 | 70.6 | -16.8 |
* Sources: Statistics Canada, 2011 National Household Survey and 2016 Census.
** Change values may not equal the differences between the attainment rates due to rounding.
‘Other’ sector
Table 8D shows that, between 2017 and 2018, the attainment rate of sector occupational LMA of members of visible minorities increased in the Senior Managers, Semi-professionals and Technicians, Skilled Sales and Service Personnel and Other Manual Workers occupational groups. This designated group’s representation continued to exceed sector occupational LMA in the Middle and Other Managers, Skilled Crafts and Trades Workers and Other Sales and Service Personnel occupational groups in 2018.
| Occupational group | 2017 attainment rate of 2011 sector LMA | 2018 attainment rate of 2016 sector LMA | Change in attainment rate from 2017 to 2018 (point of percentage)** |
|---|---|---|---|
| Senior managers | 62.4 | 70.7 | +8.4 |
| Middle and other managers | 145.2 | 128.8 | -16.4 |
| Professionals | 108.2 | 94.9 | -13.3 |
| Semi-professionals and technicians | 61.7 | 64.6 | +2.9 |
| Supervisors | 83.8 | 57.9 | -25.9 |
| Supervisors: crafts and trades | 109.9 | 86.0 | -23.9 |
| Administrative and senior clerical personnel | 99.4 | 90.8 | -8.6 |
| Skilled sales and service personnel | 47.6 | 66.0 | +18.3 |
| Skilled crafts and trades workers | 137.6 | 119.7 | -17.9 |
| Clerical personnel | 91.7 | 81.1 | -10.5 |
| Intermediate sales and service personnel | 116.0 | 91.9 | -24.1 |
| Semi-skilled manual workers | 66.0 | 62.3 | -3.7 |
| Other sales and service personnel | 130.9 | 101.5 | -29.4 |
| Other manual workers | 84.8 | 86.3 | +1.5 |
| Total | 111.7 | 99.1 | -12.6 |
* Sources: Statistics Canada, 2011 National Household Survey and 2016 Census.
** Change values may not equal the differences between the attainment rates due to rounding.
Additional data on the representation, hires, promotions and terminations of employees by designated group and sector is provided in Appendix A.
Section 4: Employment equity program highlights
Under the Act, in addition to ensuring compliance with the annual reporting requirements of federally regulated private sector employers, the Minister of Labour is mandated a number of responsibilities including:
- administrating the Federal Contractors Program
- undertaking research and developing information programs that foster understanding and promote employment equity, and
- recognizing private sector employers that demonstrate outstanding achievement and efforts in implementing employment equity
This section provides an overview of the Labour Program’s activities as they relate to the Federal Contractors Program, the Workplace Opportunities: Removing Barriers to Equity grants and contributions program, pay transparency, the Employment Equity Achievement Awards and the 2019 Symposium on Women and the Workplace.
Federal Contractors Program
The Federal Contractors Program (FCP) seeks to advance social and economic development objectives through procurement by ensuring that organizations that do business with the Government of Canada implement employment equity in their workplace. It applies to provincially regulated employers that have a workforce in Canada of 100 or more employees and that received a federal government goods and services contract valued at $1 million or more (including applicable taxes).
The Treasury Board’s Contracting Policy is the main policy instrument through which FCP is administered, making Treasury Board of Canada Secretariat and Public Services and Procurement Canada key partners.
As part of their obligations, contractors must collect and analyze data about their workforce and, where gaps in representation exist, establish goals to increase representation for the 4 designated groups: women, Aboriginal peoples, persons with disabilities and members of visible minorities. Contractors are required to make reasonable efforts to ensure that reasonable progress is made towards meeting their goals and achieving an equitable workforce.
As of December 31, 2018, 328 (321 certified and 7 voluntary) employers were covered under the FCP. A total of 36 (34 certified and 2 voluntary) employers were added during the 2018 calendar year.
The Labour Program conducts compliance assessments to ensure that contractors fulfill their commitment to implement employment equity. A first compliance assessment is conducted one year after an employer has been awarded a contract. Subsequent assessments are conducted 4 years after the contract award date and every 3 years thereafter to verify that progress is being made. In 2018, the Labour Program completed 45 first-year assessments and 122 subsequent assessments for a combined total of 167 compliance assessments, with all contractors being found in compliance.
Workplace opportunities: Removing barriers to equity
Workplace Opportunities: Removing Barriers to Equity is a grants and contributions program designed to support employers in their efforts to improve the representation and participation of designated group members in areas experiencing low representation through partnerships, information sharing and implementation of industry-tailored strategies. Up to $500,000 per fiscal year in total funding is available to eligible recipients.
Since the launch of Workplace Opportunities in 2014, a total of 10 projects have been funded. Four grant projects were completed in 2016. Two contribution agreements concluded in 2017 and 3 contribution agreements concluded in March 2018. Project results were included in the Employment Equity Act: Annual Report 2018. A contribution agreement with Ryerson University for the “ALiGN Network for Employment Equity and Inclusion” project began in 2018 and will conclude in October 2021.
Workplace opportunities project in 2019
Ryerson University Diversity Institute, ALiGN Network for Employment Equity and Inclusion
Funding: $1,498,370 (November 2018 to October 2021)
The “ALiGN Network for Employment Equity and Inclusion” project aims to:
- improve understanding among stakeholders in the banking and financial services, communications and transportation sectors of industry-specific barriers to inclusion, including systemic barriers, implicit bias and non-essential qualifications in high demand occupations, and effective processes to overcome them
- expand the pool of women, Aboriginal peoples and persons with disabilities for select job classifications across the 3 sectors using evidence-based recruitment to minimize unconscious bias and industry-tailored skills training
- develop new inclusion tools and guides tailored to promote evidence-based approaches to recruitment, based on research and practices for the 3 sectors
Pay transparency
In Budget 2018, the Government of Canada committed to reducing the gender wage gap through several measures including new pay transparency requirements for employers subject to the Act. The pay transparency measures will provide Canadians with accessible, comparable, online information about the wage gaps of federally regulated private sector employers with 100 or more employees. Pay transparency will go beyond addressing the gender wage gap by highlighting wage gaps that affect women, Aboriginal peoples, persons with disabilities and members of visible minorities, making Canada the first country to make this level of information publicly available.
Pay transparency is recognized across the world as a key measure towards addressing wage gaps. The United Kingdom was the first country to require all large employers to publish gender wage gaps online and has found pay transparency to be effective in raising awareness on wage gaps. Making this information publicly available prompts employers to take action to examine their practices and show leadership in reducing wage gaps, helping to shift business culture and expectations towards greater equality.
In Canada, despite narrowing educational and work experience gaps, the gap in wages between men and women persists among workers at the overall national level. According to Statistics Canada, on average, women aged 15 years and over in full-time employment earned $0.89 for every dollar earned by men in 2018, up from $0.83 in 1997.Footnote 9
Wage gaps also exist for Aboriginal peoples, persons with disabilities and members of visible minorities in the Canadian federally regulated private sector as reported to the Labour Program. In 2018, the earnings of designated group members in permanent full-time positions were consistently lower than those not belonging to the designated groups. For example, as per the salary data displayed in Table 2 of this report:
- 50.1% of women earned a salary of $60,000 or more, whereas 64.4% of men were at this threshold
- 55.7% of Aboriginal peoples earned a salary of $60,000 or more, compared to 59.1% of non-Aboriginal peoples
- 55.5% of persons with disabilities earned a salary of $60,000 or more, compared to 59.2% of persons without disabilities, and
- 56.1% of visible minority members earned a salary of $60,000 or more, compared to 60% of non-visible minority members
Federally regulated private sector employers with 100 or more employees already report employee salary information as part of the requirements under the Act and the Employment Equity Regulations (the Regulations). Budget 2019 introduced amendments to both the Act and the Regulations that will change the way employers report salary information to, in part, support the introduction of pay transparency.
Throughout 2019, the Labour Program engaged Legislated Employment Equity Program employers, Federal Contractors Program employers, union representatives, special interest groups, industry associations and representatives from provincial and municipal orders of government in several consultation initiatives aimed at soliciting feedback on the proposed amendments to the Regulations. Feedback was collected from in-person sessions that were held across Canada, an online questionnaire and communication with the Labour Program. Overall, employers, industry associations and other stakeholders are supportive of the proposed amendments to the Regulations, as well as the overarching purpose. Several stakeholders have also emphasized that pay transparency is an important measure that will support reducing wage gaps.
Work is ongoing and the Labour Program will continue to engage employers, employee representatives and special interest groups in the coming months regarding supporting tools detailing the changes to reporting processes and to system tools that are provided by the Government of Canada.
2019 Employment Equity Achievement Awards
The Employment Equity Achievement Awards (EEAA) recognize federally regulated private sector employers, federal contractors and individual business leaders for their outstanding achievements in employment equity and their commitment to creating diverse and inclusive workplaces.
Following an application process, 14 private sector employers and 4 champion award recipients were recognized for their efforts in advancing employment equity, as well as promoting diversity and inclusiveness in the workplace.
The 2019 awards were distributed according to the following categories:
- Sector distinction: this award recognizes employers who are inspirational role models in their sector. In addition to demonstrating a strong commitment and achieving success in implementing employment equity in their own organization, these employers also champion employment equity for the sector
- Air Canada
- Atlantic Towing Limited
- Canada Mortgage & Housing Corporation
- Defence Construction Canada
- HSBC Bank Canada
- RST Industries and Sunbury Transport
- Outstanding commitment: this award recognizes employers who have demonstrated outstanding commitment in implementing their employment equity plans by instituting measures to remove barriers, adopting special measures and/or establishing positive policies and practices to achieve tangible results
- Canadian National Railway Company
- Irving Shipbuilding Inc.
- Jazz Aviation LP
- Ontario Power Generation Inc.
- Randstad Canada
- Vancouver Airport Authority
- Innovation: this award recognizes employers who have been innovative in the implementation of employment equity. This can include creativity in the design and implementation of measures to remove barriers, adoption of special measures, establishment of positive policies or practices, forward-thinking in human resources practices and/or development of new or unique initiatives
- Hudbay Minerals Inc.
- Queen’s University
- Employment equity champion: this award recognizes an executive or executive team of an employer for their proven track record of championing employment equity within their organization, as well as their overall contribution to diversity and inclusiveness in the workplace
- James J.D. Paul and Juliet Woodfield (Defence Construction Canada)
- Chris J. Hatton (HSBC Bank Canada)
- Michele Mawhinney (Vancouver Airport Authority)
Symposium on women and the workplace
The Labour Program hosted a 2-day Symposium on Women and the Workplace at the University of Toronto's Rotman School of Management in May 2019. Two hundred and forty Canadian leaders and champions of workplace gender equality and diversity shared best practices to inspire and advance women's participation in the workplace. Presenters and participants came from the public and private sector, unions, academia, industry and human resource associations and civil society organizations.
Although their perspectives varied, there was general agreement on 3 key components to advancing workplace gender equality and diversity in Canada:
- Increasing awareness about gender equality and challenging widespread myths
- Changing structures instead of people
- Adopting an intersectional approach to gender equality in the workplace
Best practice strategies that emerged during the Symposium centred around 3 phases of the employment cycle: hiring, retention and career advancement. To disseminate the learnings from the event to a broader Canadian audience, a report, “Women and the workplace – How employers can advance equality and diversity,” was written that provides readers links to key note and panel discussions, workshop presentations and resources. Partners from the event have shared the developed resources with their networks.Footnote 10
Conclusion
This report contains a high-level analysis of the results that employers have achieved in implementing employment equity in their workplaces for the 2018 calendar year. This year’s report includes submissions received from 536 employers with a combined workforce of 756,414 employees, an increase of 27.0% in the workforce coverage since the collection of employment equity data commenced in 1987, when 373 employers reported on their workforce data, which was composed of 595,417 employees.
At the overall level, the representation of members of visible minorities has continued to consistently exceed labour market availability since 2007, reaching 23.8% in 2018. Women, Aboriginal peoples and persons with disabilities remain under-represented. The representation of women decreased from 40.2% in 2017 to 39.4% in 2018, which is the lowest level of representation for this designated group since the implementation of the Act in 1986. Aboriginal peoples remained at 2.3% and persons with disabilities increased from 3.3% in 2017 to 3.4% in 2018, yet both of these groups’ representation shows a gradual long-term upward trend. Some increases in representation of the designated groups were observed at the sector and occupational group levels. Although members of visible minorities continue to maintain a representation rate that exceeds LMA at the overall level, they are still under-represented in certain sectors and occupational groups.
Three Workplace Opportunities: Removing Barriers to Equity projects successfully concluded in 2018 and 1 new contribution agreement has been put in place. As part of each completed project, outcomes and tools have been disseminated to relevant stakeholders through in-person presentations and webinars, as well as online, to help strengthen employers’ efforts and support them in implementing measures to remove barriers and improve their workplaces.
The Labour Program has been working on addressing wage gaps through the Pay Transparency initiative for the 4 designated groups. Consultations on employment equity regulatory changes with stakeholders from across the country took place during the 2019 calendar year, including the engagement of stakeholders on supporting tools that detail the changes to reporting processes and to system tools that are provided by the Government of Canada. This initiative will raise awareness of the wage gaps affecting the designated group members, providing a platform for further action.
The 2-day Symposium on Women and the Workplace that was hosted by the Labour Program in 2019 brought together Canadian leaders and champions of workplace gender equality and diversity to share best practices to inspire and advance women’s participation in the workplace. A report was produced and made available online to provide materials and resources related to the event.
It is encouraging to see the level of commitment from employers engaging in activities to identify and eliminate employment barriers and to improve working conditions for the 4 designated groups.
Appendix A: Federally regulated private sector employers tables
The following tables consolidate data from the annual reports submitted by federally regulated private sector employers. To allow for comparative analysis, some of the data from 1987 (the year data was first collected) is included with 2017 and 2018 data.
Tables 1.1 to 3.4 in this appendix present data aggregated to include permanent full-time, permanent part-time and temporary employees. Tables 4.1 to 4.10 summarize information for the 4 industrial sectors, including: number, representation, hires, promotions, terminations and the net effect of hires less terminations. Tables 5.1 to 6.4 present salary data for permanent full-time and permanent part-time employees respectively.
List of tables
- Table 1.1: Women’s representation and availability in the federally regulated private sector by census metropolitan area, province and territory in 1987, 2017 and 2018 (by percentage)
- Table 1.2: Aboriginal peoples’ representation and availability in the federally regulated private sector by census metropolitan area, province and territory in 1987, 2017 and 2018 (by percentage)
- Table 1.3: Person with disabilities’ representation and availability in the federally regulated private sector by census metropolitan area, province and territory in 1987, 2017 and 2018 (by percentage)
- Table 1.4: Members of visible minorities’ representation and availability in the federally regulated private sector by census metropolitan area, province and territory in 1987, 2017 and 2018 (by percentage)
- Table 2.1: Representation and availability of women in the federally regulated private sector by occupational group in 2017 and 2018 (by percentage)
- Table 2.2: Representation and availability of Aboriginal peoples in the federally regulated private sector by occupational group in 2017 and 2018 (by percentage)
- Table 2.3: Representation and availability of persons with disabilities in the federally regulated private sector by occupational group in 2017 and 2018 (by percentage)
- Table 2.4: Representation and availability of members of visible minorities in the federally regulated private sector by occupational group in 2017 and 2018 (by percentage)
- Table 3.1: Distribution of women and men in the federally regulated private sector by occupational group in 2017 and 2018 (by percentage)
- Table 3.2: Distribution of Aboriginal and non-Aboriginal peoples in the federally regulated private sector by occupational group in 2017 and 2018 (by percentage)
- Table 3.3: Distribution of persons with and without disabilities in the federally regulated private sector by occupational group in 2017 and 2018 (by percentage)
- Table 3.4: Distribution of members and non-members of visible minorities in the federally regulated private sector by occupational group in 2017 and 2018 (by percentage)
- Table 4.1: Number, hires, promotions, terminations and net effect of designated group members in the banking and financial services sector in 2017 and 2018
- Table 4.2: Representation, and shares of hires, promotions and terminations of designated group members in the banking and financial services sector in 2017 and 2018 (by percentage)
- Table 4.3: Number, hires, promotions, terminations and net effect of designated group members in the communications sector in 2017 and 2018
- Table 4.4: Representation, and shares of hires, promotions and terminations of designated group members in the communications sector in 2017 and 2018 (by percentage)
- Table 4.5: Number, hires, promotions, terminations and net effect of designated group members in the transportation sector in 2017 and 2018
- Table 4.6: Representation, and shares of hires, promotions and terminations of designated group members in the transportation sector in 2017 and 2018 (by percentage)
- Table 4.7: Number, hires, promotions, terminations and net effect of designated group members in the ‘other’ sector in 2017 and 2018
- Table 4.8: Representation, and shares of hires, promotions and terminations of designated group members in the ‘other’ sector in 2017 and 2018 (by percentage)
- Table 4.9: Number, hires, promotions, terminations and net effect of designated group members in the federally regulated private sector in 2017 and 2018
- Table 4.10: Representation, and shares of hires, promotions and terminations of designated group members in the federally regulated private sector in 2017 and 2018 (by percentage)
- Table 5.1: Number and representation of women in permanent full-time employment in the federally regulated private sector by salary range as of December 31, 2018
- Table 5.2: Number and representation of Aboriginal peoples in permanent full-time employment in the federally regulated private sector by salary range and gender as of December 31, 2018
- Table 5.3: Number and representation of persons with disabilities in permanent full-time employment in the federally regulated private sector by salary range and gender as of December 31, 2018
- Table 5.4: Number and representation of members of visible minorities in permanent full-time employment in the federally regulated private sector by salary range and gender as of December 31, 2018
- Table 6.1: Number and representation of women in permanent part-time employment in the federally regulated private sector by salary range as of December 31, 2018
- Table 6.2: Number and representation of Aboriginal peoples in permanent part-time employment in the federally regulated private sector by salary range as of December 31, 2018
- Table 6.3: Number and representation of persons with disabilities in permanent part-time employment in the federally regulated private sector by salary range and gender as of December 31, 2018
- Table 6.4: Number and representation of members of visible minorities in permanent part-time employment in the federally regulated private sector by salary range and gender as of December 31, 2018
| Census metropolitan area, province and territory | 1987 | 2017 | 2018 | Availability |
|---|---|---|---|---|
| Halifax | 41.2 | 41.2 | 40.9 | 49.6 |
| Montréal | 39.0 | 40.4 | 39.6 | 48.5 |
| Toronto | 47.1 | 44.2 | 43.5 | 48.7 |
| Winnipeg | 32.7 | 32.2 | 31.8 | 48.6 |
| Regina | 42.9 | 48.4 | 47.2 | 48.1 |
| Calgary | 47.6 | 43.5 | 43.0 | 47.2 |
| Edmonton | 44.5 | 38.5 | 37.1 | 47.1 |
| Vancouver | 40.4 | 37.5 | 37.5 | 48.5 |
| Newfoundland and Labrador | 38.4 | 44.6 | 42.9 | 48.2 |
| Prince Edward Island | 38.0 | 32.3 | 35.2 | 49.4 |
| Nova Scotia | 34.4 | 42.5 | 42.6 | 49.2 |
| New Brunswick | 32.2 | 47.7 | 46.7 | 48.5 |
| Quebec | 39.8 | 39.2 | 38.3 | 48.1 |
| Ontario | 44.2 | 42.4 | 41.6 | 48.6 |
| Manitoba | 30.5 | 31.9 | 31.2 | 47.9 |
| Saskatchewan | 35.1 | 36.8 | 37.0 | 47.5 |
| Alberta | 45.3 | 41.1 | 40.0 | 46.7 |
| British Columbia | 41.5 | 37.2 | 36.9 | 48.4 |
| Yukon | 31.4 | 41.5 | 40.3 | 49.7 |
| Northwest Territories | 21.9 | 25.7 | 27.6 | 47.8 |
| Nunavut | N/A | 25.3 | 26.4 | 48.4 |
| Canada | 40.9 | 40.2 | 39.4 | 48.2 |
* Sources: Statistics Canada, 2016 Census.
| Census metropolitan area, province and territory | 1987 | 2017 | 2018 | Availability |
|---|---|---|---|---|
| Halifax | 0.5 | 2.4 | 2.5 | 3.8 |
| Montréal | 0.3 | 0.9 | 0.8 | 0.8 |
| Toronto | 0.6 | 1.0 | 1.0 | 0.8 |
| Winnipeg | 0.8 | 7.2 | 7.3 | 9.8 |
| Regina | 0.4 | 2.8 | 2.9 | 6.8 |
| Calgary | 0.5 | 2.1 | 2.1 | 2.7 |
| Edmonton | 0.7 | 3.1 | 3.1 | 5.0 |
| Vancouver | 0.5 | 2.2 | 2.1 | 2.3 |
| Newfoundland and Labrador | 0.6 | 6.0 | 6.1 | 8.7 |
| Prince Edward Island | 0.2 | 0.9 | 1.3 | 1.8 |
| Nova Scotia | 0.4 | 2.5 | 2.6 | 5.3 |
| New Brunswick | 0.4 | 1.4 | 1.4 | 3.6 |
| Quebec | 0.4 | 1.1 | 1.1 | 2.1 |
| Ontario | 0.7 | 1.5 | 1.5 | 2.5 |
| Manitoba | 1.0 | 8.1 | 8.1 | 13.2 |
| Saskatchewan | 1.4 | 7.4 | 6.2 | 11.1 |
| Alberta | 0.7 | 2.8 | 2.8 | 5.2 |
| British Columbia | 0.7 | 3.2 | 3.4 | 5.2 |
| Yukon | 3.8 | 7.3 | 7.3 | 19.9 |
| Northwest Territories | 9.6 | 8.6 | 9.2 | 41.7 |
| Nunavut | N/A | 29.9 | 32.0 | 75.6 |
| Canada | 0.7 | 2.3 | 2.3 | 4.0 |
* Sources: Statistics Canada, 2016 Census.
| Census metropolitan area, province and territory | 1987 | 2017 | 2018 | Availability |
|---|---|---|---|---|
| Halifax | 1.6 | 5.4 | 5.6 | N/A |
| Montréal | 1.1 | 2.3 | 2.3 | N/A |
| Toronto | 1.5 | 3.4 | 3.6 | N/A |
| Winnipeg | 1.8 | 3.4 | 3.4 | N/A |
| Regina | 2.4 | 3.8 | 3.6 | N/A |
| Calgary | 1.9 | 3.2 | 3.1 | N/A |
| Edmonton | 2.0 | 3.3 | 3.4 | N/A |
| Vancouver | 1.5 | 3.1 | 3.0 | N/A |
| Newfoundland and Labrador | 1.0 | 3.0 | 3.0 | 8.9 |
| Prince Edward Island | 1.2 | 2.2 | 2.9 | 10.2 |
| Nova Scotia | 3.5 | 5.3 | 5.5 | 13.1 |
| New Brunswick | 1.8 | 4.2 | 4.5 | 10.7 |
| Quebec | 1.1 | 2.2 | 2.2 | 6.1 |
| Ontario | 1.6 | 3.7 | 3.9 | 9.6 |
| Manitoba | 1.7 | 3.3 | 3.3 | 10.1 |
| Saskatchewan | 1.8 | 3.1 | 3.1 | 9.1 |
| Alberta | 1.9 | 3.3 | 3.3 | 9.9 |
| British Columbia | 1.7 | 3.4 | 3.3 | 11.0 |
| Yukon | 0.8 | 2.9 | 3.2 | 11.3 |
| Northwest Territories | 1.4 | 1.8 | 1.6 | 9.8 |
| Nunavut | N/A | 1.9 | 2.1 | 8.2 |
| Canada | 1.6 | 3.3 | 3.4 | 9.1 |
* Sources: Statistics Canada, 2017 Canadian Survey on Disability.
| Census metropolitan area, province and territory | 1987 | 2017 | 2018 | Availability |
|---|---|---|---|---|
| Halifax | 1.9 | 9.0 | 9.8 | 9.7 |
| Montréal | 3.0 | 17.2 | 18.1 | 20.7 |
| Toronto | 12.0 | 37.9 | 39.0 | 48.8 |
| Winnipeg | 2.9 | 19.8 | 20.9 | 25.2 |
| Regina | 1.6 | 17.2 | 18.0 | 16.9 |
| Calgary | 5.6 | 23.6 | 24.8 | 31.3 |
| Edmonton | 4.4 | 23.0 | 24.2 | 26.5 |
| Vancouver | 7.9 | 36.3 | 37.0 | 45.9 |
| Newfoundland and Labrador | 0.7 | 2.2 | 2.5 | 2.3 |
| Prince Edward Island | 1.0 | 2.9 | 2.8 | 4.2 |
| Nova Scotia | 1.3 | 7.7 | 8.5 | 5.8 |
| New Brunswick | 1.1 | 4.0 | 5.0 | 3.0 |
| Quebec | 2.6 | 14.4 | 15.2 | 12.1 |
| Ontario | 7.3 | 28.6 | 29.9 | 27.9 |
| Manitoba | 2.6 | 16.8 | 17.6 | 17.8 |
| Saskatchewan | 1.2 | 10.1 | 11.0 | 10.7 |
| Alberta | 4.0 | 20.8 | 21.5 | 22.3 |
| British Columbia | 6.2 | 29.0 | 29.4 | 29.2 |
| Yukon | 1.4 | 12.0 | 13.0 | 8.5 |
| Northwest Territories | 2.5 | 12.2 | 14.3 | 10.5 |
| Nunavut | N/A | 7.1 | 8.6 | 4.0 |
| Canada | 5.0 | 22.8 | 23.8 | 21.3 |
* Sources: Statistics Canada, 2016 Census.
| Occupational group | 2017 representation | 2018 representation | 2016 availability |
|---|---|---|---|
| Senior managers | 27.3 | 28.0 | 27.6 |
| Middle and other managers | 42.0 | 41.4 | 39.4 |
| Professionals | 44.5 | 44.0 | 55.0 |
| Semi-professionals and technicians | 19.2 | 19.3 | 53.5 |
| Supervisors | 58.8 | 58.1 | 55.5 |
| Supervisors: crafts and trades | 8.3 | 8.4 | 10.8 |
| Administrative and senior clerical personnel | 76.4 | 73.1 | 82.4 |
| Skilled sales and service personnel | 53.9 | 53.1 | 49.7 |
| Skilled crafts and trades workers | 4.7 | 4.8 | 4.0 |
| Clerical personnel | 56.4 | 55.4 | 68.7 |
| Intermediate sales and service personnel | 62.5 | 62.2 | 68.4 |
| Semi-skilled manual workers | 11.2 | 11.6 | 17.1 |
| Other sales and service personnel | 41.1 | 40.8 | 56.3 |
| Other manual workers | 9.5 | 9.8 | 22.1 |
| Total | 40.2 | 39.4 | 48.2 |
* Sources: Statistics Canada, 2016 Census.
| Occupational group | 2017 representation | 2018 representation | 2016 availability |
|---|---|---|---|
| Senior managers | 1.0 | 1.0 | 3.2 |
| Middle and other managers | 1.3 | 1.3 | 2.7 |
| Professionals | 1.2 | 1.2 | 2.4 |
| Semi-professionals and technicians | 2.6 | 2.5 | 4.2 |
| Supervisors | 2.4 | 2.4 | 3.9 |
| Supervisors: crafts and trades | 4.0 | 3.6 | 4.3 |
| Administrative and senior clerical personnel | 1.9 | 1.8 | 3.5 |
| Skilled sales and service personnel | 1.7 | 1.6 | 3.7 |
| Skilled crafts and trades workers | 3.9 | 3.9 | 5.2 |
| Clerical personnel | 2.1 | 2.1 | 4.2 |
| Intermediate sales and service personnel | 2.5 | 2.4 | 4.5 |
| Semi-skilled manual workers | 3.5 | 3.3 | 4.8 |
| Other sales and service personnel | 4.2 | 4.1 | 5.8 |
| Other manual workers | 5.8 | 5.9 | 6.8 |
| Total | 2.3 | 2.3 | 4.0 |
* Sources: Statistics Canada, 2016 Census.
| Occupational group | 2017 representation | 2018 representation | 2016 availability |
|---|---|---|---|
| Senior managers | 3.0 | 3.2 | 5.0 |
| Middle and other managers | 3.5 | 3.6 | 5.0 |
| Professionals | 3.4 | 3.6 | 8.9 |
| Semi-professionals and technicians | 2.7 | 2.5 | 7.6 |
| Supervisors | 3.8 | 4.0 | 27.5 |
| Supervisors: crafts and trades | 2.2 | 2.1 | 10.1 |
| Administrative and senior clerical personnel | 3.7 | 4.1 | 10.0 |
| Skilled sales and service personnel | 4.3 | 4.0 | 8.0 |
| Skilled crafts and trades workers | 2.4 | 2.3 | 7.8 |
| Clerical personnel | 4.2 | 4.6 | 9.3 |
| Intermediate sales and service personnel | 3.4 | 3.5 | 10.8 |
| Semi-skilled manual workers | 2.6 | 2.6 | 10.3 |
| Other sales and service personnel | 4.3 | 4.1 | 10.7 |
| Other manual workers | 2.9 | 2.6 | 6.8 |
| Total | 3.3 | 3.4 | 9.1 |
* Sources: Statistics Canada, 2017 Canadian Survey on Disability.
| Occupational group | 2017 representation | 2018 representation | 2016 availability |
|---|---|---|---|
| Senior managers | 10.1 | 11.0 | 11.5 |
| Middle and other managers | 24.2 | 25.4 | 17.6 |
| Professionals | 31.2 | 32.4 | 23.2 |
| Semi-professionals and technicians | 13.6 | 14.0 | 19.1 |
| Supervisors | 21.2 | 21.1 | 24.0 |
| Supervisors: crafts and trades | 10.2 | 10.9 | 11.1 |
| Administrative and senior clerical personnel | 26.1 | 28.3 | 16.4 |
| Skilled sales and service personnel | 29.6 | 30.7 | 27.7 |
| Skilled crafts and trades workers | 14.0 | 14.7 | 12.0 |
| Clerical personnel | 23.9 | 25.6 | 21.9 |
| Intermediate sales and service personnel | 23.9 | 25.6 | 25.4 |
| Semi-skilled manual workers | 17.7 | 17.9 | 22.4 |
| Other sales and service personnel | 14.6 | 15.1 | 26.5 |
| Other manual workers | 12.9 | 13.4 | 21.0 |
| Total | 22.8 | 23.8 | 21.3 |
* Sources: Statistics Canada, 2016 Census.
| Occupational group | 2017 women distribution | 2017 men distribution | 2018 women distribution | 2018 men distribution |
|---|---|---|---|---|
| Senior managers | 0.6 | 1.0 | 0.6 | 1.0 |
| Middle and other managers | 11.5 | 10.7 | 11.3 | 10.5 |
| Professionals | 21.7 | 18.2 | 21.4 | 17.8 |
| Semi-professionals and technicians | 3.2 | 9.0 | 3.2 | 8.7 |
| Supervisors | 4.8 | 2.2 | 4.6 | 2.2 |
| Supervisors: crafts and trades | 0.3 | 2.2 | 0.3 | 2.2 |
| Administrative and senior clerical personnel | 5.3 | 1.1 | 5.4 | 1.3 |
| Skilled sales and service personnel | 4.8 | 2.8 | 4.4 | 2.5 |
| Skilled crafts and trades workers | 1.0 | 13.2 | 1.0 | 13.0 |
| Clerical personnel | 17.8 | 9.2 | 18.0 | 9.5 |
| Intermediate sales and service personnel | 24.9 | 10.0 | 25.0 | 9.9 |
| Semi-skilled manual workers | 3.5 | 18.7 | 4.0 | 19.9 |
| Other sales and service personnel | 0.4 | 0.4 | 0.4 | 0.4 |
| Other manual workers | 0.2 | 1.1 | 0.2 | 1.1 |
| Total | 100.0 | 100.0 | 100.0 | 100.0 |
| Occupational group | 2017 Aboriginal peoples distribution | 2017 non-Aboriginal peoples distribution | 2018 Aboriginal peoples distribution | 2018 non-Aboriginal peoples distribution |
|---|---|---|---|---|
| Senior managers | 0.4 | 0.9 | 0.4 | 0.9 |
| Middle and other managers | 6.3 | 11.1 | 6.3 | 10.9 |
| Professionals | 10.3 | 19.9 | 10.5 | 19.4 |
| Semi-professionals and technicians | 7.6 | 6.7 | 7.2 | 6.5 |
| Supervisors | 3.4 | 3.3 | 3.3 | 3.1 |
| Supervisors: crafts and trades | 2.5 | 1.4 | 2.3 | 1.5 |
| Administrative and senior clerical personnel | 2.2 | 2.8 | 2.3 | 2.9 |
| Skilled sales and service personnel | 2.6 | 3.6 | 2.3 | 3.3 |
| Skilled crafts and trades workers | 13.9 | 8.2 | 14.1 | 8.2 |
| Clerical personnel | 11.7 | 12.7 | 11.9 | 12.9 |
| Intermediate sales and service personnel | 17.3 | 16.0 | 16.8 | 15.9 |
| Semi-skilled manual workers | 19.0 | 12.4 | 19.9 | 13.5 |
| Other sales and service personnel | 0.8 | 0.4 | 0.8 | 0.4 |
| Other manual workers | 1.8 | 0.7 | 1.9 | 0.7 |
| Total | 100.0 | 100.0 | 100.0 | 100.0 |
| Occupational group | 2017 persons with disabilities distribution | 2017 persons without disabilities distribution | 2018 persons with disabilities distribution | 2018 persons without disabilities distribution |
|---|---|---|---|---|
| Senior managers | 0.8 | 0.9 | 0.8 | 0.9 |
| Middle and other managers | 11.6 | 11.0 | 11.4 | 10.8 |
| Professionals | 20.0 | 19.6 | 20.5 | 19.2 |
| Semi-professionals and technicians | 5.4 | 6.7 | 4.8 | 6.6 |
| Supervisors | 3.8 | 3.2 | 3.7 | 3.1 |
| Supervisors: crafts and trades | 1.0 | 1.5 | 0.9 | 1.5 |
| Administrative and senior clerical personnel | 3.2 | 2.8 | 3.5 | 2.9 |
| Skilled sales and service personnel | 4.6 | 3.5 | 3.8 | 3.2 |
| Skilled crafts and trades workers | 6.0 | 8.4 | 5.6 | 8.4 |
| Clerical personnel | 16.0 | 12.5 | 17.2 | 12.7 |
| Intermediate sales and service personnel | 16.4 | 16.0 | 16.4 | 15.9 |
| Semi-skilled manual workers | 10.0 | 12.7 | 10.3 | 13.7 |
| Other sales and service personnel | 0.5 | 0.4 | 0.5 | 0.4 |
| Other manual workers | 0.6 | 0.7 | 0.6 | 0.7 |
| Total | 100.0 | 100.0 | 100.0 | 100.0 |
| Occupational group | 2017 members of visible minorities distribution | 2017 non-members of visible minorities distribution | 2018 members of visible minorities distribution | 2018 non-members of visible minorities distribution |
|---|---|---|---|---|
| Senior managers | 0.4 | 1.0 | 0.4 | 1.0 |
| Middle and other managers | 11.7 | 10.8 | 11.6 | 10.6 |
| Professionals | 26.9 | 17.5 | 26.1 | 17.1 |
| Semi-professionals and technicians | 4.0 | 7.5 | 3.8 | 7.3 |
| Supervisors | 3.0 | 3.3 | 2.8 | 3.3 |
| Supervisors: crafts and trades | 0.7 | 1.7 | 0.7 | 1.7 |
| Administrative and senior clerical personnel | 3.2 | 2.7 | 3.5 | 2.7 |
| Skilled sales and service personnel | 4.6 | 3.3 | 4.2 | 3.0 |
| Skilled crafts and trades workers | 5.1 | 9.3 | 5.1 | 9.3 |
| Clerical personnel | 13.2 | 12.5 | 13.8 | 12.5 |
| Intermediate sales and service personnel | 16.7 | 15.8 | 17.1 | 15.5 |
| Semi-skilled manual workers | 9.8 | 13.4 | 10.2 | 14.7 |
| Other sales and service personnel | 0.3 | 0.5 | 0.3 | 0.5 |
| Other manual workers | 0.4 | 0.8 | 0.4 | 0.8 |
| Total | 100.0 | 100.0 | 100.0 | 100.0 |
| Designated groups | 2017 count | 2018 count | 2017 hires | 2018 hires | 2017 promotions | 2018 promotions | 2017 terminations | 2018 terminations | 2017 net effect | 2018 net effect |
|---|---|---|---|---|---|---|---|---|---|---|
| Women | 136,762 | 138,586 | 19,124 | 22,763 | 17,686 | 21,046 | 22,514 | 22,652 | -3,390 | 111 |
| Aboriginal peoples | 2,889 | 3,002 | 378 | 465 | 364 | 500 | 553 | 559 | -175 | -94 |
| Persons with disabilities | 10,651 | 12,199 | 1,227 | 1,557 | 1,054 | 1,475 | 1,913 | 1,917 | -686 | -360 |
| Members of visible minorities | 74,811 | 82,920 | 9,803 | 14,603 | 11,002 | 13,560 | 10,898 | 11,671 | -1,095 | 2,932 |
| All employees | 237,016 | 244,910 | 38,007 | 45,721 | 31,924 | 37,658 | 39,326 | 40,533 | -1,319 | 5,188 |
* The number of employees hired reduced by those terminated.
** The number of employees covers permanent full-time, permanent part-time and temporary employees. The hires, promotions, terminations and net effect data cover only permanent full-time and permanent part-time employees.
| Designated groups | 2017 representation | 2018 representation | 2017 share of hires | 2018 share of hires | 2017 share of promotions | 2018 share of promotions | 2017 share of terminations | 2018 share of terminations |
|---|---|---|---|---|---|---|---|---|
| Women | 57.7 | 56.6 | 50.3 | 49.8 | 55.4 | 55.9 | 57.2 | 55.9 |
| Aboriginal peoples | 1.2 | 1.2 | 1.0 | 1.0 | 1.1 | 1.3 | 1.4 | 1.4 |
| Persons with disabilities | 4.5 | 5.0 | 3.2 | 3.4 | 3.3 | 3.9 | 4.9 | 4.7 |
| Members of visible minorities | 31.6 | 33.9 | 25.8 | 31.9 | 34.5 | 36.0 | 27.7 | 28.8 |
| All employees | 100.0 | 100.0 | 100.0 | 100.0 | 100.0 | 100.0 | 100.0 | 100.0 |
* The representation of the designated groups covers permanent full-time, permanent part-time and temporary employees. The shares of hires, promotions, terminations and net effect data cover only permanent full-time and permanent part-time employees.
| Designated groups | 2017 count | 2018 count | 2017 hires | 2018 hires | 2017 promotions | 2018 promotions | 2017 terminations | 2018 terminations | 2017 net effect | 2018 net effect |
|---|---|---|---|---|---|---|---|---|---|---|
| Women | 46,740 | 45,662 | 7,623 | 7,193 | 2,635 | 2,955 | 8,430 | 9,040 | -807 | -1,847 |
| Aboriginal peoples | 2,941 | 2,776 | 585 | 456 | 154 | 161 | 594 | 624 | -9 | -168 |
| Persons with disabilities | 4,680 | 4,484 | 643 | 571 | 206 | 252 | 747 | 849 | -104 | -278 |
| Members of visible minorities | 30,773 | 30,877 | 5,242 | 5,335 | 1,889 | 2,127 | 5,103 | 5,884 | 139 | -549 |
| All employees | 132,890 | 131,305 | 20,084 | 20,032 | 6,706 | 7,783 | 21,665 | 24,226 | -1,581 | -4,194 |
* The number of employees hired reduced by those terminated.
** The number of employees covers permanent full-time, permanent part-time and temporary employees. The hires, promotions, terminations and net effect data cover only permanent full-time and permanent part-time employees.
| Designated groups | 2017 representation | 2018 representation | 2017 share of hires | 2018 share of hires | 2017 share of promotions | 2018 share of promotions | 2017 share of terminations | 2018 share of terminations |
|---|---|---|---|---|---|---|---|---|
| Women | 35.2 | 34.8 | 38.0 | 35.9 | 39.3 | 38.0 | 38.9 | 37.3 |
| Aboriginal peoples | 2.2 | 2.1 | 2.9 | 2.3 | 2.3 | 2.1 | 2.7 | 2.6 |
| Persons with disabilities | 3.5 | 3.4 | 3.2 | 2.9 | 3.1 | 3.2 | 3.4 | 3.5 |
| Members of visible minorities | 23.2 | 23.5 | 26.1 | 26.6 | 28.2 | 27.3 | 23.6 | 24.3 |
| All employees | 100.0 | 100.0 | 100.0 | 100.0 | 100.0 | 100.0 | 100.0 | 100.0 |
* The representation of the designated groups covers permanent full-time, permanent part-time and temporary employees. The shares of hires, promotions, terminations and net effect data cover only permanent full-time and permanent part-time employees.
| Designated groups | 2017 count | 2018 count | 2017 hires | 2018 hires | 2017 promotions | 2018 promotions | 2017 terminations | 2018 terminations | 2017 net effect | 2018 net effect |
|---|---|---|---|---|---|---|---|---|---|---|
| Women | 89,460 | 96,736 | 14,488 | 18,739 | 3,293 | 3,716 | 13,628 | 16,467 | 860 | 2,272 |
| Aboriginal peoples | 8,587 | 9,375 | 2,176 | 2,556 | 264 | 343 | 1,868 | 2,155 | 308 | 401 |
| Persons with disabilities | 7,331 | 7,895 | 970 | 1,278 | 209 | 287 | 1,315 | 1,469 | -345 | -191 |
| Members of visible minorities | 50,201 | 56,997 | 12,209 | 17,694 | 2,107 | 2,397 | 9,794 | 13,249 | 2,415 | 4,445 |
| All employees | 294,612 | 321,707 | 55,793 | 74,744 | 11,070 | 12,474 | 53,502 | 65,584 | 2,291 | 9,160 |
* The number of employees hired reduced by those terminated.
** The number of employees covers permanent full-time, permanent part-time and temporary employees. The hires, promotions, terminations and net effect data cover only permanent full-time and permanent part-time employees.
| Designated groups | 2017 representation | 2018 representation | 2017 share of hires | 2018 share of hires | 2017 share of promotions | 2018 share of promotions | 2017 share of terminations | 2018 share of terminations |
|---|---|---|---|---|---|---|---|---|
| Women | 30.4 | 30.1 | 26.0 | 25.1 | 29.7 | 29.8 | 25.5 | 25.1 |
| Aboriginal peoples | 2.9 | 2.9 | 3.9 | 3.4 | 2.4 | 2.7 | 3.5 | 3.3 |
| Persons with disabilities | 2.5 | 2.5 | 1.7 | 1.7 | 1.9 | 2.3 | 2.5 | 2.2 |
| Members of visible minorities | 17.0 | 17.7 | 21.9 | 23.7 | 19.0 | 19.2 | 18.3 | 20.2 |
| All employees | 100.0 | 100.0 | 100.0 | 100.0 | 100.0 | 100.0 | 100.0 | 100.0 |
* The representation of the designated groups covers permanent full-time, permanent part-time and temporary employees. The shares of hires, promotions, terminations and net effect data cover only permanent full-time and permanent part-time employees.
| Designated groups | 2017 count | 2018 count | 2017 hires | 2018 hires | 2017 promotions | 2018 promotions | 2017 terminations | 2018 terminations | 2017 net effect | 2018 net effect |
|---|---|---|---|---|---|---|---|---|---|---|
| Women | 16,365 | 17,403 | 2,462 | 2,698 | 901 | 869 | 2,302 | 2,289 | 160 | 409 |
| Aboriginal peoples | 2,244 | 2,117 | 278 | 293 | 100 | 129 | 345 | 527 | -67 | -234 |
| Persons with disabilities | 1,198 | 1,201 | 97 | 88 | 66 | 37 | 180 | 159 | -83 | -71 |
| Members of visible minorities | 8,597 | 9,274 | 1,959 | 2,072 | 323 | 322 | 1,603 | 1,675 | 356 | 397 |
| All employees | 55,779 | 58,492 | 8,244 | 8,827 | 2,746 | 2,690 | 8,277 | 8,448 | -33 | 379 |
* The number of employees hired reduced by those terminated.
** The number of employees covers permanent full-time, permanent part-time and temporary employees. The hires, promotions, terminations and net effect data cover only permanent full-time and permanent part-time employees.
| Designated groups | 2017 representation | 2018 representation | 2017 share of hires | 2018 share of hires | 2017 share of promotions | 2018 share of promotions | 2017 share of terminations | 2018 share of terminations |
|---|---|---|---|---|---|---|---|---|
| Women | 29.3 | 29.8 | 29.9 | 30.6 | 32.8 | 32.3 | 27.8 | 27.1 |
| Aboriginal peoples | 4.0 | 3.6 | 3.4 | 3.3 | 3.6 | 4.8 | 4.2 | 6.2 |
| Persons with disabilities | 2.1 | 2.1 | 1.2 | 1.0 | 2.4 | 1.4 | 2.2 | 1.9 |
| Members of visible minorities | 15.4 | 15.9 | 23.8 | 23.5 | 11.8 | 12.0 | 19.4 | 19.8 |
| All employees | 100.0 | 100.0 | 100.0 | 100.0 | 100.0 | 100.0 | 100.0 | 100.0 |
* The representation of the designated groups covers permanent full-time, permanent part-time and temporary employees. The shares of hires, promotions, terminations and net effect data cover only permanent full-time and permanent part-time employees.
| Designated groups | 2017 count | 2018 count | 2017 hires | 2018 hires | 2017 promotions | 2018 promotions | 2017 terminations | 2018 terminations | 2017 net effect | 2018 net effect |
|---|---|---|---|---|---|---|---|---|---|---|
| Women | 289,327 | 298,387 | 43,697 | 51,393 | 24,515 | 28,586 | 46,874 | 50,448 | -3,177 | 945 |
| Aboriginal peoples | 16,671 | 17,270 | 3,417 | 3,770 | 882 | 1,133 | 3,360 | 3,865 | 57 | -95 |
| Persons with disabilities | 23,860 | 25,779 | 2,937 | 3,494 | 1,535 | 2,051 | 4,155 | 4,394 | -1,218 | -900 |
| Members of visible minorities | 164,382 | 180,068 | 29,213 | 39,704 | 15,321 | 18,406 | 27,398 | 32,479 | 1,815 | 7,225 |
| All employees | 720,297 | 756,414 | 122,128 | 149,324 | 52,446 | 60,605 | 122,770 | 138,791 | -642 | 10,533 |
* The number of employees hired reduced by those terminated.
** The number of employees covers permanent full-time, permanent part-time and temporary employees. The hires, promotions, terminations and net effect data cover only permanent full-time and permanent part-time employees.
| Designated groups | 2017 representation | 2018 representation | 2017 share of hires | 2018 share of hires | 2017 share of promotions | 2018 share of promotions | 2017 share of terminations | 2018 share of terminations |
|---|---|---|---|---|---|---|---|---|
| Women | 40.2 | 39.4 | 35.8 | 34.4 | 46.7 | 47.2 | 38.2 | 36.3 |
| Aboriginal peoples | 2.3 | 2.3 | 2.8 | 2.5 | 1.7 | 1.9 | 2.7 | 2.8 |
| Persons with disabilities | 3.3 | 3.4 | 2.4 | 2.3 | 2.9 | 3.4 | 3.4 | 3.2 |
| Members of visible minorities | 22.8 | 23.8 | 23.9 | 26.6 | 29.2 | 30.4 | 22.3 | 23.4 |
| All employees | 100.0 | 100.0 | 100.0 | 100.0 | 100.0 | 100.0 | 100.0 | 100.0 |
* The representation of the designated groups covers permanent full-time, permanent part-time and temporary employees. The shares of hires, promotions, terminations and net effect data cover only permanent full-time and permanent part-time employees.
| Salary range (by dollar) | Total | Men | Women | Women’s representation over total employees within the salary range (by percentage) |
|---|---|---|---|---|
| Under 15,000 | 3,447 | 2,326 | 1,121 | 32.5 |
| 15,000 to 19,999 | 1,188 | 753 | 435 | 36.6 |
| 20,000 to 24,999 | 3,974 | 1,859 | 2,115 | 53.2 |
| 25,000 to 29,999 | 9,871 | 4,905 | 4,966 | 50.3 |
| 30,000 to 34,999 | 18,783 | 9,665 | 9,118 | 48.5 |
| 35,000 to 37,499 | 15,325 | 8,095 | 7,230 | 47.2 |
| 37,500 to 39,999 | 16,586 | 8,600 | 7,986 | 48.1 |
| 40,000 to 44,999 | 43,778 | 23,467 | 20,311 | 46.4 |
| 45,000 to 49,999 | 45,452 | 24,136 | 21,316 | 46.9 |
| 50,000 to 59,999 | 107,271 | 60,816 | 46,455 | 43.3 |
| 60,000 to 69,999 | 89,944 | 57,681 | 32,263 | 35.9 |
| 70,000 to 84,999 | 93,488 | 62,685 | 30,803 | 32.9 |
| 85,000 to 99,999 | 64,148 | 43,043 | 21,105 | 32.9 |
| 100,000 and over | 135,601 | 98,085 | 37,516 | 27.7 |
| Total | 648,856 | 406,116 | 242,740 | 37.4 |
| Salary range (by dollar) | Total | Aboriginal men | Aboriginal women | Representation over total employees within the salary range (by percentage) |
|---|---|---|---|---|
| Under 15,000 | 246 | 171 | 75 | 7.1 |
| 15,000 to 19,999 | 66 | 46 | 20 | 5.6 |
| 20,000 to 24,999 | 85 | 50 | 35 | 2.1 |
| 25,000 to 29,999 | 306 | 146 | 160 | 3.1 |
| 30,000 to 34,999 | 554 | 278 | 276 | 2.9 |
| 35,000 to 37,499 | 400 | 177 | 223 | 2.6 |
| 37,500 to 39,999 | 412 | 244 | 168 | 2.5 |
| 40,000 to 44,999 | 937 | 482 | 455 | 2.1 |
| 45,000 to 49,999 | 989 | 545 | 444 | 2.2 |
| 50,000 to 59,999 | 2,470 | 1,424 | 1,046 | 2.3 |
| 60,000 to 69,999 | 2,135 | 1,470 | 665 | 2.4 |
| 70,000 to 84,999 | 2,099 | 1,520 | 579 | 2.2 |
| 85,000 to 99,999 | 1,418 | 1,001 | 417 | 2.2 |
| 100,000 and over | 2,468 | 1,950 | 518 | 1.8 |
| Total | 14,585 | 9,504 | 5,081 | 2.2 |
| Salary range (by dollar) | Total | Men with disabilities | Women with disabilities | Representation over total employees within the salary range(by percentage) |
|---|---|---|---|---|
| Under 15,000 | 68 | 45 | 23 | 2.0 |
| 15,000 to 19,999 | 36 | 17 | 19 | 3.0 |
| 20,000 to 24,999 | 83 | 42 | 41 | 2.1 |
| 25,000 to 29,999 | 241 | 114 | 127 | 2.4 |
| 30,000 to 34,999 | 637 | 256 | 381 | 3.4 |
| 35,000 to 37,499 | 593 | 245 | 348 | 3.9 |
| 37,500 to 39,999 | 822 | 396 | 426 | 5.0 |
| 40,000 to 44,999 | 1,765 | 824 | 941 | 4.0 |
| 45,000 to 49,999 | 1,633 | 737 | 896 | 3.6 |
| 50,000 to 59,999 | 3,928 | 1,951 | 1,977 | 3.7 |
| 60,000 to 69,999 | 3,039 | 1,679 | 1,360 | 3.4 |
| 70,000 to 84,999 | 3,188 | 1,921 | 1,267 | 3.4 |
| 85,000 to 99,999 | 2,092 | 1,254 | 838 | 3.3 |
| 100,000 and over | 3,916 | 2,584 | 1,332 | 2.9 |
| Total | 22,041 | 12,065 | 9,976 | 3.4 |
| Salary range (by dollar) | Total | Visible minorities men | Visible minorities women | Representation over total employees within the salary range (by percentage) |
|---|---|---|---|---|
| Under 15,000 | 659 | 445 | 214 | 19.1 |
| 15,000 to 19,999 | 212 | 131 | 81 | 17.8 |
| 20,000 to 24,999 | 845 | 360 | 485 | 21.3 |
| 25,000 to 29,999 | 2,544 | 1,353 | 1,191 | 25.8 |
| 30,000 to 34,999 | 4,788 | 2,450 | 2,338 | 25.5 |
| 35,000 to 37,499 | 4,369 | 2,301 | 2,068 | 28.5 |
| 37,500 to 39,999 | 4,649 | 2,285 | 2,364 | 28.0 |
| 40,000 to 44,999 | 12,133 | 6,282 | 5,851 | 27.7 |
| 45,000 to 49,999 | 11,777 | 6,295 | 5,482 | 25.9 |
| 50,000 to 59,999 | 25,641 | 14,181 | 11,460 | 23.9 |
| 60,000 to 69,999 | 20,188 | 12,257 | 7,931 | 22.4 |
| 70,000 to 84,999 | 21,308 | 13,355 | 7,953 | 22.8 |
| 85,000 to 99,999 | 15,917 | 9,985 | 5,932 | 24.8 |
| 100,000 and over | 29,036 | 19,525 | 9,511 | 21.4 |
| Total | 154,066 | 91,205 | 62,861 | 23.7 |
| Salary range (by dollar) | Total | Men | Women | Women's representation over total employees within the salary range (by percentage) |
|---|---|---|---|---|
| Under 5,000 | 2,304 | 1,327 | 977 | 42.4 |
| 5,000 to 14,999 | 1,500 | 665 | 835 | 55.7 |
| 15,000 to 17,499 | 8,692 | 4,290 | 4,402 | 50.6 |
| 17,500 to 19,999 | 9,122 | 4,627 | 4,495 | 49.3 |
| 20,000 to 22,499 | 7,117 | 3,235 | 3,882 | 54.5 |
| 22,500 to 24,999 | 8,859 | 4,283 | 4,576 | 51.7 |
| 25,000 to 29,999 | 14,968 | 6,410 | 8,558 | 57.2 |
| 30,000 to 34,999 | 11,161 | 4,652 | 6,509 | 58.3 |
| 35,000 to 39,999 | 8,016 | 3,505 | 4,511 | 56.3 |
| 40,000 to 49,999 | 8,751 | 4,017 | 4,734 | 54.1 |
| 50,000 and over | 6,102 | 3,032 | 3,070 | 50.3 |
| Total | 101,814 | 48,165 | 53,649 | 52.7 |
| Salary range (by dollar) | Total | Aboriginal men | Aboriginal women | Representation over total employees within the salary range (by percentage) |
|---|---|---|---|---|
| Under 5,000 | 56 | 24 | 32 | 2.4 |
| 5,000 to 14,999 | 31 | 14 | 17 | 2.1 |
| 15,000 to 17,499 | 267 | 121 | 146 | 3.1 |
| 17,500 to 19,999 | 248 | 116 | 132 | 2.7 |
| 20,000 to 22,499 | 201 | 84 | 117 | 2.8 |
| 22,500 to 24,999 | 212 | 93 | 119 | 2.4 |
| 25,000 to 29,999 | 376 | 145 | 231 | 2.5 |
| 30,000 to 34,999 | 260 | 116 | 144 | 2.3 |
| 35,000 to 39,999 | 208 | 93 | 115 | 2.6 |
| 40,000 to 49,999 | 184 | 55 | 129 | 2.1 |
| 50,000 and over | 135 | 66 | 69 | 2.2 |
| Total | 2,573 | 1,116 | 1,457 | 2.5 |
| Salary range (by dollar) | Total | Men with disabilities | Women with disabilities | Representation over total employees within the salary range (by percentage) |
|---|---|---|---|---|
| Under 5,000 | 57 | 35 | 22 | 2.5 |
| 5,000 to 14,999 | 42 | 23 | 19 | 2.8 |
| 15,000 to 17,499 | 291 | 110 | 181 | 3.3 |
| 17,500 to 19,999 | 326 | 146 | 180 | 3.6 |
| 20,000 to 22,499 | 269 | 84 | 185 | 3.8 |
| 22,500 to 24,999 | 331 | 142 | 189 | 3.7 |
| 25,000 to 29,999 | 614 | 200 | 414 | 4.1 |
| 30,000 to 34,999 | 420 | 133 | 287 | 3.8 |
| 35,000 to 39,999 | 301 | 107 | 194 | 3.8 |
| 40,000 to 49,999 | 274 | 96 | 178 | 3.1 |
| 50,000 and over | 218 | 98 | 120 | 3.6 |
| Total | 3,661 | 1,396 | 2,265 | 3.6 |
| Salary range (by dollar) | Total | Visible minorities men | Visible minorities women | Representation over total employees within the salary range (by percentage) |
|---|---|---|---|---|
| Under 5,000 | 534 | 355 | 179 | 23.2 |
| 5,000 to 14,999 | 244 | 134 | 110 | 16.3 |
| 15,000 to 17,499 | 2,384 | 1,286 | 1,098 | 27.4 |
| 17,500 to 19,999 | 2,542 | 1,433 | 1,109 | 27.9 |
| 20,000 to 22,499 | 1,783 | 928 | 855 | 25.1 |
| 22,500 to 24,999 | 2,630 | 1,515 | 1,115 | 29.7 |
| 25,000 to 29,999 | 3,891 | 2,164 | 1,727 | 26.0 |
| 30,000 to 34,999 | 2,740 | 1,344 | 1,396 | 24.5 |
| 35,000 to 39,999 | 1,745 | 885 | 860 | 21.8 |
| 40,000 to 49,999 | 1,589 | 910 | 679 | 18.2 |
| 50,000 and over | 1,143 | 655 | 488 | 18.7 |
| Total | 25,385 | 14,114 | 11,271 | 24.9 |
Appendix B: Technical notes
Employers covered under the Employment Equity Act
The Act covers:
- organizations that employ 100 or more employees in the federally regulated private sector, federal Crown corporations, other federal consolidated entities (namely, Canada Pension Plan Investment Board, Public Sector Pension Investment Board and St. Lawrence Seaway Management Corporation) and other federal government business enterprises (namely, Montreal Port Authority, PortsToronto and Vancouver Fraser Port Authority)
- core public administration organizations listed under Schedule I or IV of the Financial Administration Act (FAA) (federal government departments and agencies)
- separate employer organizations in the federal public sector with 100 or more employees, listed in Schedule V of the FAA (separate agencies), and
- other public-sector employer organizations with 100 or more employees, including the Canadian Forces (officers and non-commissioned members in the Regular and Reserve Forces) and the Royal Canadian Mounted Police (regular and civilian members, excluding federal public service employees)
Limitations of the employment equity data
This report provides the most recent information on employment equity data for the federally regulated private sector, with the following limitations:
- To measure progress of the designated groups, their representation (namely, the number of designated group employees divided by the number of all employees) in the federally regulated private sector is compared to their availability in the workforce population. Availability data is obtained from censuses or surveys conducted every 5 years by Statistics Canada. As a result, there is a time lag in measuring representation gaps. The current labour market availability (LMA) is based on the 2016 Census and the 2017 Canadian Survey on Disability. More information on LMA can be found in the 2016 Employment Equity Data Report
- The designated groups data is based on self-identification. Some individuals may not self-identify to their employer and/or to Statistics Canada. Therefore, the data on all designated group members may not be captured by the employers and Statistics Canada
- Data is received annually from employers; however, the number of employers can differ from one year to the next
- The Treasury Board of Canada Secretariat is responsible for reporting on employment equity in the federal departments and agencies that make up the core public administration. This information is available on the Employment Equity in Public Service of Canada website. Other areas of the federal public sector are responsible for preparing their own reports on employment equity, which can be found on their respective websites or obtained upon request directly from the organizations
- Federal contractors are not required to report annually