
A portrait of the federally regulated private sector
Disclaimer: This paper is one of a series of papers prepared by the Secretariat to the Expert Panel on Modern Federal Labour Standards as background information to stimulate the Panel's discussions. The papers do not necessarily reflect the views of the Government of Canada.
On this page
The federally regulated private sector (FRPS) is comprised of approximately 910,000 employees and 18,000 employers whose labour rights and responsibilities are defined by the Canada Labour Code (the Code). Federal labour standards, which establish minimum working conditions, are set out in Part III of the Code. They apply to employers and employees in, or in connection with, the operation of any work, undertaking or business under the legislative authority of the Parliament of Canada.
The businesses and industries covered by Part III include banks, air transportation, rail and road transportation that involves crossing provincial or international borders, marine transportation, pipelines crossing provincial borders, feed, flour and seed mills and grain elevators, telecommunications and broadcasting. Part III also applies to Crown corporations (including Canada Post) and certain Indigenous government activities on First Nations reserves. The federal public service is not covered by Part III.
This portrait provides an overview of workers and employers in the FRPS. It looks at who the workers are—those who are in employer-employee relationships and thus covered by Part III of the Code and those who are not—and where they work. Particular attention is paid to those segments of the FRPS workforce that are relevant to the five issues under study by the Expert Panel on Modern Federal Labour Standards, such as individuals in non-standard work.Footnote 1 However, due to data limitations, Indigenous governments on First Nations reserves are not included in the analysis. The portrait should be seen as a companion to the five Issue Papers prepared by the Secretariat to support the Expert Panel on the five issues.
The portrait is based primarily on data from two Statistics Canada surveys: the Federal Jurisdiction Workplace Survey (FJWS) and the Labour Force Survey (LFS). In most cases, the data are derived from the 2015 FJWS, adjusted by the Labour Program using 2017 LFS estimates and other measures, such as population growth. In cases where the data are derived from the 2015 FJWS alone, this is noted with an asterisk (*). Otherwise, data sources are noted throughout. For more information on the data sources used, see the separate Backgrounder on Data Sources prepared for the Expert Panel by the Secretariat.
The portrait has five parts:
- a high-level "snapshot" of the FRPS;
- some more detailed data regarding employers;
- some more detailed data regarding employees;
- a closer look at workers in non-standard work; and
- some longitudinal data comparing employees and non-standard workers and changes over time.
Snapshot
Figure 1 presents a high-level "snapshot" of the FRPS (not including Indigenous governments on First Nations reserves). It shows that the FRPS is composed of an estimated 18,000 employers, 910,000 employees and 80,000 self-employed workers.
More specifically, Figure 1 shows that:
- Approximately 785,000 of the 910,000 (about 85%) employees are full-time and permanent (see blue boxes).
- The remaining 125,000 (about 15%) employees are in "non-standard" forms of work, namely part-time permanent employment and full-time and part-time temporary employment (in other words seasonal, casual and term or contract). They are shown in green in Figure 1.
- In addition to the 910,000 employees, there are approximately 80,000 self-employed workers in the FRPS who are not protected by labour standards under Part III of the Code (see boxes in red). Although no precise data are available, these workers are likely a mix of independent and dependent contractors.Footnote 2
- Of those who are self-employed, an estimated 60,000 do not have employees.
- The 20,000 self-employed workers who employ other people are subject to the labour standards under Part III in their role as an employer; however, these self-employed workers are not themselves protected by the provisions of the Code.
As Figure 2 shows, the majority of employees in the FRPS work in Ontario (39%), Quebec (20%) and British Columbia (13%).
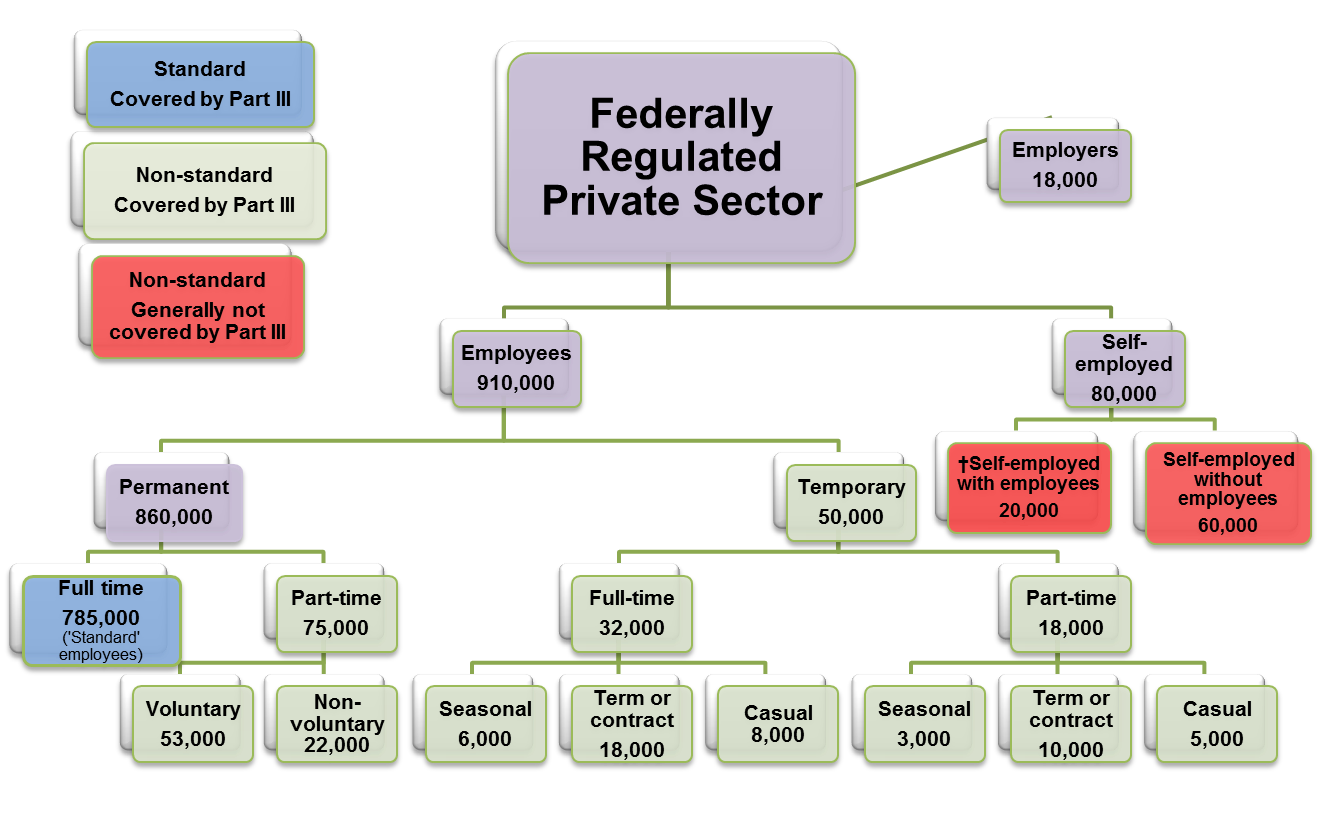
Figure 1 - Text version
Federally regulated private sector
Employers=18,000
Employees=910,000
- Permanent=860,000
- Full time=785,000 (standard employees) (standard covered by Part III)
- Part-time=75,000
- Voluntary= 53,000 (non-standard covered by Part III)
- Non-voluntary= 22,000 (non-standard covered by Part III)
- Temporary = 50,000 (non-standard covered by Part III)
- Full-time (non-standard covered by Part III)
- Seasonal=6,000 (non-standard covered by Part III)
- Term or contract=18,000 (non-standard covered by Part III)
- Casual=8,000 (non-standard covered by Part III)
- Part-time=18,000 (non-standard covered by Part III)
- Seasonal=3,000 (non-standard covered by Part III)
- Term or contract=10,000 (non-standard covered by Part III)
- Casual=5,000 (non-standard covered by Part III)
- Full-time (non-standard covered by Part III)
Self-employed=80,000
- Self-employed with employees=20,000 (non-standard generally not covered by Part III)
- Self-employed without employees=60,000 (non-standard generally not covered by Part III)
Source: 2015 Federal Jurisdiction Workplace Survey; 2017 Survey of Employment, Payroll, and Hours; 2017 Labour Force Survey; and Labour Program, Workplace Information Research Division calculations.
These individuals are not subject to Part III of the Canada Labour Code as workers, but as employers.

Figure 2 - Text version
This graphic is a map that illustrates how employees in the FRPS are spread across Canada, excluding the territories. There is no data available for the territories.
- British Columbia: 13%
- Alberta: 12%
- Saskatchewan: 3%
- Manitoba: 4%
- Ontario: 39%
- Quebec: 20%
- Atlantic provinces: 8%
Source: Labour Program, Workplace Information and Research Division calculations based on the Survey of Employment, Payroll, and Hours (2015, 2017); Federal Jurisdiction Workplace Survey, 2008; and Labour Force Survey, 2013–2017.
Employers in the FRPS
According to the 2015 FJWS, of the 18,000 employers in the FRPS, large companies with 100 or more employees employed 87% of all employees (see Figure 3).
Among these large companies, the highest proportion of employees was employed in banking (28%), followed by telecommunications and broadcasting (16%) and road transportation (16%).
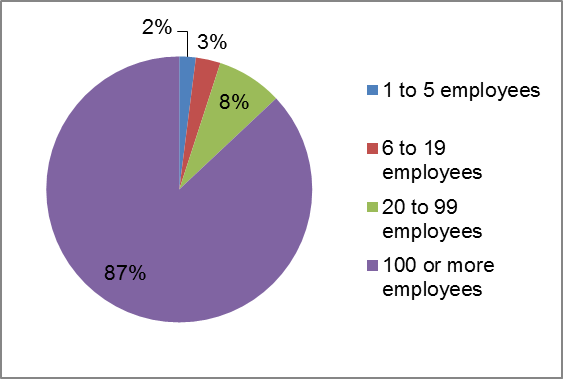
Figure 3 - Text version
| Company size | Distribution |
|---|---|
| 1 to 5 employees | 2% |
| 6 to 19 employees | 3% |
| 20 to 99 employees | 8% |
| 100 or more employees | 87% |
Source: Federal Jurisdiction Workplace Survey, 2015.
In the FRPS, companies with a small number of employees are more numerous than companies with a large number of employees. About 85% of employers in the FRPS have fewer than 20 employees, as shown in Figure 4.
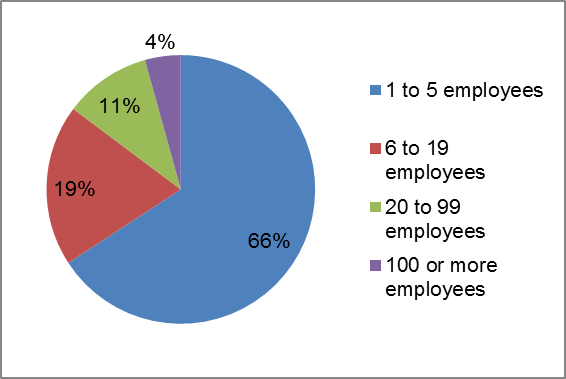
Figure 4 - Text version
| Company size | Distribution |
|---|---|
| 1 to 5 employees | 66% |
| 6 to 19 employees | 19% |
| 20 to 99 employees | 10% |
| 100 or more employees | 4% |
Source: Federal Jurisdiction Workplace Survey, 2015.
Small companies are dominated by the road transportation sector, which accounts for 83% of employees in companies with one to five employees.
Among large companies with more than 100 employees, banks account for 32% of employees and telecommunications and broadcasting companies account for 17% of employees.
Of the approximately 18,000 employers in the FRPS, about 13,900 are in the trucking industry. This amounts to more than three-quarters of all FRPS employers.Footnote 3
Of the approximately 3,800 FRPS employers who are not in the trucking industry, about one in four operate in air transportation (26%) or telecommunications and broadcasting (25%).
The distribution of employers in the FRPS by industry, province and number of employees is shown in Table 1.
| Industry | Total | Newfounland and Labrador | Prince Edward Islande | Nova Scotia | New Brunswick | Quebec | Ontario | Manitoba | Saskatchewan | Alberta | British Columbia |
|---|---|---|---|---|---|---|---|---|---|---|---|
| Road transportation | 14,180* | 80 | 30 | 170 | 290 | 2,560 | 6,440 | 640 | 460 | 2,060 | 1,430 |
| Air transportation | 1,010* | 20 | 2 | 20 | 10 | 160 | 300 | 40 | 20 | 140 | 270 |
| Telecommunications | 960* | 10 | 3 | 30 | 20 | 240 | 380 | 30 | 20 | 80 | 120 |
| Maritime transportation | 430* | 50 | 10 | 30 | 20 | 70 | 70 | 3 | 2 | 10 | 150 |
| Feed, flour, seed and grain | 410* | 1 | 1 | 10 | 10 | 110 | 130 | 30 | 30 | 40 | 40 |
| Postal services and pipelines | 390* | 10 | 1 | 10 | 10 | 60 | 150 | 10 | 10 | 70 | 60 |
| Banks | 100* | 0 | 0 | 2 | 1 | 10 | 50 | 1 | 3 | 20 | 10 |
| Rail transportation | 20* | 0 | 0 | 0 | 1 | 4 | 5 | 1 | 4 | 2 | 2 |
| Total (without misc. industries) | 17,500 | 170 | 50 | 270 | 370 | 3,210 | 7,540 | 760 | 550 | 2,420 | 2,090 |
| Miscellaneous industriesFootnote 4 | 500* | n/a | n/a | n/a | n/a | n/a | n/a | n/a | n/a | n/a | n/a |
| Total (with misc. industries) | 18,000* | n/a | n/a | n/a | n/a | n/a | n/a | n/a | n/a | n/a | n/a |
Source: Workplace Information and Research Division calculations based on the Canadian Business Patterns (2015, 2017); and Federal Jurisdiction Workplace Survey, 2015.
Employees in the FRPS
This section provides more detailed information regarding employees in the FRPS:
- the distribution of employees in the FRPS by industry, province and number of employees (Table 2);
- the distribution of total employees in the FRPS by industry (see Figure 5);
- standard and non-standard work in the FRPS compared to Canada (see Figure 6); and
- the proportion of employees covered by collective bargaining agreements in the FRPS and in Canada (Figure 7).
| Industry | Canada | Atlantic | Quebec | Ontario | Manitoba | Saskatchewan | Alberta | British Columbia |
|---|---|---|---|---|---|---|---|---|
| Banks | 257,600* | 21,700 | 61,400 | 105,000 | 6,900 | 7,500 | 22,800 | 32,400 |
| Telecom and broadcasting | 148,400 * | 24,800 | 17,700 | 51,700 | 6,900 | 6,400 | 18,000 | 22,800 |
| Road transportation | 141,700 * | 12,400 | 30,000 | 61,200 | 3,500 | 1,700 | 16,300 | 16,600 |
| Postal and pipelines | 127,600* | 5,300 | 24,000 | 65,200 | 3,200 | 3,000 | 17,400 | 9,500 |
| Air transportation | 107,600* | 5,900 | 30,700 | 34,400 | 3,600 | 1,500 | 13,800 | 17,600 |
| Rail transportation | 61,700* | 2,100 | 10,200 | 14,400 | 8,000 | 4,800 | 11,700 | 10,600 |
| Feed, flour, seed, grain | 17,800* | 500 | 2,400 | 5,800 | 1,800 | 2,300 | 3,300 | 1,700 |
| Maritime transportation | 17,400* | 3,500 | 3,100 | 2,000 | 40 | 40 | 100 | 8,600 |
| Miscellaneous | 30,200* | n/a | n/a | n/a | n/a | n/a | n/a | n/a |
| All industries | 910,000 * | 77,300 | 185,500 | 356,500 | 34,100 | 27,600 | 108,300 | 120,600 |
Source: Labour Program, Workplace Information and Research Division calculations based on the Survey of Employment, Payroll, and Hours (2015, 2017); Federal Jurisdiction Workplace Survey, 2008; and Labour Force Survey, 2013–2017.
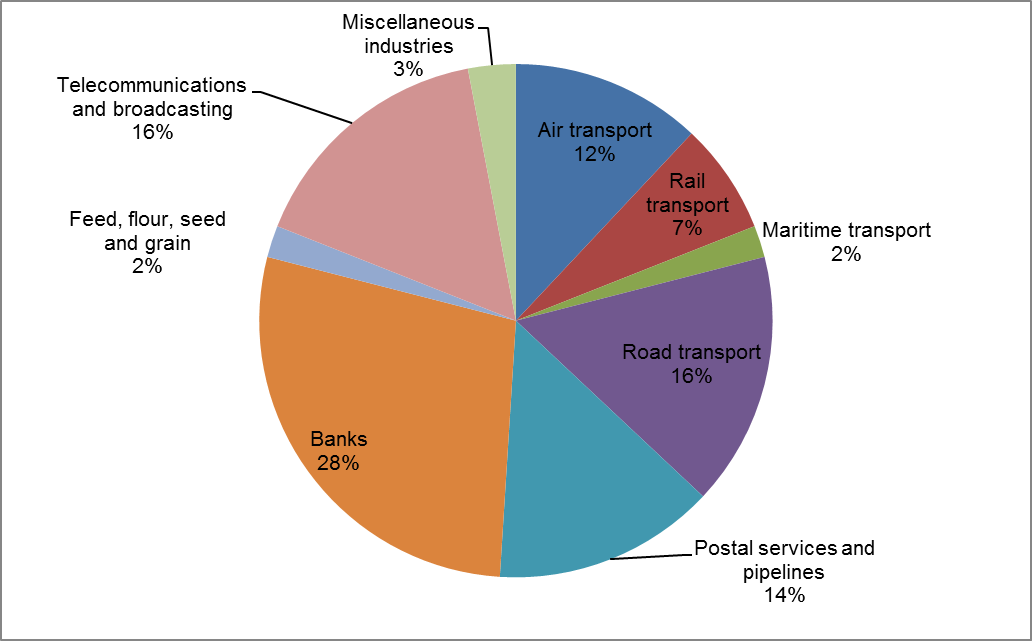
Figure 5 - Text version
| Industry | Percentage |
|---|---|
| Air transport | 12% |
| Rail | 7% |
| Road | 16% |
| Maritime | 2% |
| Postal and pipeline | 14% |
| Banks | 28% |
| Feed and flour | 2% |
| Telecom and broadcast | 16% |
| Miscellaneous | 3% |
| Total | 100% |
Source: Federal Jurisdiction Workplace Survey, 2015.
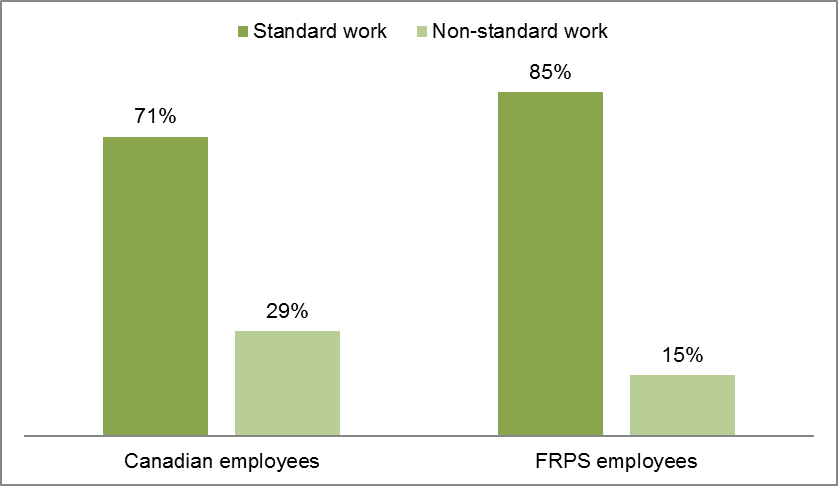
Figure 6 - Text version
| Type of work | Canadian employees | FRPS employees |
|---|---|---|
| Standard work | 71% | 85% |
| Non-standard work | 29% | 15% |
Source: 2015 Federal Jurisdiction Workplace Survey; 2017 Survey of Employment, Payroll, and Hours; 2017 Labour Force Survey; and Labour Program, Workplace Information Research Division analysis.
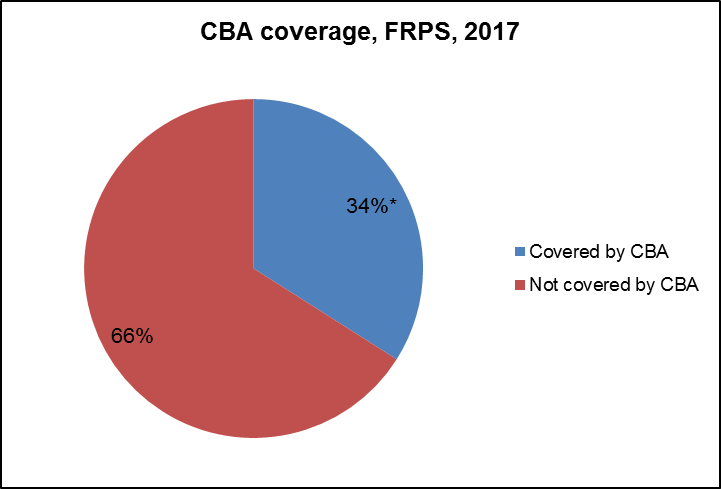
Figure 7A - Text version
| Collective bargaining | Percentage |
|---|---|
| Covered by a collective bargaining agreement | 34% |
| Not covered by a collective bargaining agreement | 66% |
Source: Federal Jurisdiction Workplace Survey, 2015 updated to 2017.

Figure 7B - Text version
| Collective bargaining | Percentage |
|---|---|
| Covered by a collective bargaining agreement | 30% |
| Not covered by a collective bargaining agreement | 70% |
Source: Labour Force Survey, 2017.
Non-standard workers in the FRPS
While all employers in the FRPS are subject to the Code, not all workers are covered by all aspects of the Code. The labour standards set out in Part III only cover workers who are considered employees; however, Part III does not define "employee."
Non-standard work includes temporary and part-time work. If an employment relationship exists, an individual in temporary or part-time work is covered by Part III of the Code regardless of the terms of employment. However, these non-standard employees often have difficulty meeting eligibility requirements for benefits and have varying degrees of job security.
Non-standard work also includes self-employment. Some, though not all, self-employed workers who do not have employees are contract workers. In the FRPS, the vast majority (92%) of the 60,000 self-employed workers without employees are men.
While only 28% of employees in the FRPS are non-Canadian born, over half (54%) of self-employed workers without employees in the FRPS are non-Canadian born.
Among the 20,000 self-employed with employees in the FRPS, 85% are men and 42% are non-Canadian born.
Temporary employees, including contract/term, seasonal and casual employees, are subject to a wage differential compared to the FRPS as a whole. Proportionally more temporary employees earn less than $15 per hour, and proportionally fewer temporary employees earn more than $35 per hour, compared to the FRPS overall (see Figure 8).
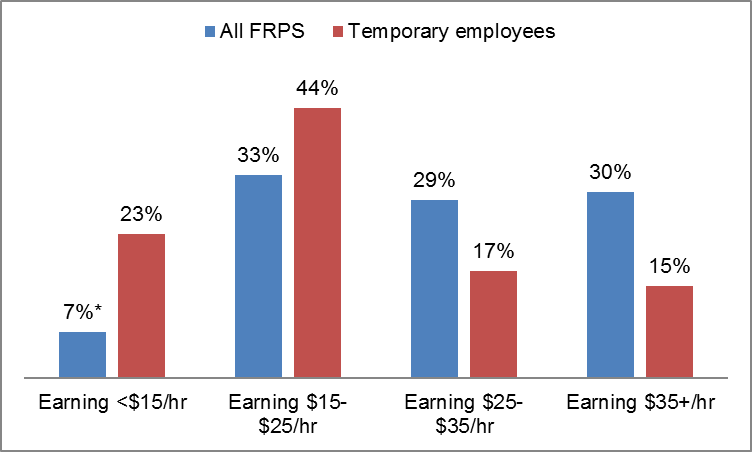
Figure 8 - Text version
| Wages for temporary employees | All FRPS | Temporary employees |
|---|---|---|
| Earning <$15/hr | 7% | 23% |
| Earning $15-$25/hr | 33% | 44% |
| Earning $25-$35/hr | 29% | 17% |
| Earning $35+/hr | 30% | 15% |
Source: 2015 Federal Jurisdiction Workplace Survey; 2017 Survey of Employment, Payroll, and Hours; 2017 Labour Force Survey; and Labour Program, Workplace Information Research Division analysis.
In 2017, more than one-third (37%) of temporary employees had spent 1-5 years with the same employer and 19% had spent more than five years with the same employer, suggesting that “temporary” status as a contract/term, seasonal or casual employee could be a long-term arrangement (see Table 3).
| 2017 | All FRPS | Temporary employees | Self-employed without employees |
|---|---|---|---|
| <1 year employment tenure | 12%* | 44% | 8% |
| 1–5 years employment tenure | 29%* | 37% | 33% |
| 5–10 years employment tenure | 21%* | 9% | 22% |
| 10+ years employment tenure | 38%* | 10% | 37% |
| 2007 | |||
| <1 year employment tenure | 17% | 48% | 11% |
| 1–5 years employment tenure | 28% | 33% | 34% |
| 5–10 years employment tenure | 19% | 11% | 23% |
| 10+ years employment tenure | 36% | 8% | 31% |
Source: 2015 Federal Jurisdiction Workplace Survey; 2017 Survey of Employment, Payroll, and Hours; 2017 Labour Force Survey; and Labour Program, Workplace Information Research Division analysis.
In 2017, the greatest proportion of temporary employees worked in banks (25%), followed by telecommunications and broadcasting (16%), miscellaneous industries (16%), road transport (13%) and postal services and pipelines (13%).
In 2017, 83% of self-employed workers with no employees worked in road transportation, including interprovincial trucking, followed by postal services and pipelines (with 11%).Footnote 5
The FRPS comprises diverse groups of people who are engaged in non-standard work in varying proportions (see Table 4). Women comprise 39% of all FRPS employees, but 53% of part-time employees. Women also account for only 8% of the self-employed without employees. The proportion of non-Canadian born workers is greater among self-employed workers without employees (54%) than employees (28%).
| Personal characteristic | All employees (910,000) | Temporary employees (50,000) | Part time employees (93,000) | Self-employed workers without employees (60,000) |
|---|---|---|---|---|
| Women* | 39% (355,000)* | 45% (23,000)* | 53% (49,000)* | 8% (5,000) |
| Men* | 61% (555,000)* | 55% (28,000)* | 47% (44,000)* | 92% (55,000) |
| Aboriginal status | 4% (32,000) | 5% (2,000) | 2% (2,000) | 4% (3,000) |
| Canadian born | 72% (655,000) | 72% (36,000) | 76% (71,000) | 46% (28,000) |
| Earning <$15 | 7% (68,000)* | 23% (12,000) | 25% (23,000) | ND |
| 55+* | 19% (173,000)* | 19% (10,000) | 25% (24,000) | 29% (18,000) |
Source: 2015 Federal Jurisdiction Workplace Survey; 2017 Survey of Employment, Payroll, and Hours; 2017 Labour Force Survey; and Labour Program, Workplace Information Research Division analysis.
Changes over time
In the FRPS, and as shown in Table 5, temporary work has risen by about 5,000 employees in the last decade, mostly due to growth in the number of FRPS employees.Footnote 6 In Canada overall, the number and proportion of temporary employees have increased.
In the FRPS, part-time employment has fluctuated as a proportion of total employment since 1998 and has declined by 23,000 employees over the past decade. In Canada overall, the number of part-time employees has risen.
The proportion of older employees aged 55 and over has more than tripled in the FRPS since 1998 and, in absolute numbers, has risen by about 59,000 people in the past decade. This is consistent with Canadian trends: the proportion of older employees 55 year of age and over has increased in Canada overall, from 8% in 1998 to 19% in 2017.
The proportion of FRPS employees covered by a collective bargaining agreement has declined by 7% in the last decade and has declined by about 27,000 in absolute numbers.
The number of self-employed workers without employees as a proportion of the FRPS workforce as a whole (i.e. including employees and self-employed workers with and without employees) has remained steady at approximately 6% since 2007, but has increased by approximately 10,000 workers in the last decade. In Canada overall, the proportion has also remained steady at around 10%.
| Characteristic | FRPS 1998Footnote 7 | FRPS 2007Footnote 8 | FRPS 2017 | Canada 1998 | Canada 2007 | Canada 2017 |
|---|---|---|---|---|---|---|
| Total employees | ND | 820,000 | 910,000 | 11,633,000 | 14,171,000 | 15,610,000 |
| Temporary employees as % total employees | 7% | 5%* | 5%* | 12% | 13% | 14% |
| Temporary employees as a number | ND | 45,000 | 50,000 | 1,372,000 | 1,840,000 | 2,137,000 |
| Part-time employees as % of total employees | 11% | 14% | 10%* | 18% | 18% | 18% |
| Part-time employees as a number | ND | 116,000 | 93,000 | 2,102,000 | 2,541,000 | 2,839,000 |
| Age 55+ employees as % of total employees | 6% | 14% | 19%* | 8% | 13% | 19% |
| Age 55+ employees as a number | nd | 114,000 | 173,000 | 931,000 | 1,798,000 | 2,894,000 |
| Earning <$15/hr employees as % of total employees | nd | nd | 7%* | nd | nd | 21% |
| Earning <$15/hr employees as a number | nd | nd | 68,000 | nd | nd | 3,318,000 |
| Covered by CBA employees as % of total employees | 37% | 41% | 34%* | 33% | 32% | 30% |
| Covered by CBA employees as a number | nd | 336,000 | 309,000 | 3,842,000 | 4,472,000 | 4,749,000 |
| Self-employed workers as a number | nd | 50,000 | 60,000 | 1,546,000 | 1,722,000 | 1,954,000 |
| Self-employed workers as a % of total workforce | nd | 6% | 6% | 11% | 10% | 11% |
| Self-employed with employees as a number | nd | 19,000 | 20,000 | 809,000 | 851,000 | 829,000 |
| Self-employed with employees as a % of total workforce | nd | 2% | 2% | 6% | 5% | 5% |
Source (2017): 2015 Federal Jurisdiction Workplace Survey; 2017 Survey of Employment, Payroll, and Hours; 2017 Labour Force Survey; and Labour Program, Workplace Information Research Division calculations.
Source (2007): 2008 Federal Jurisdiction Workplace Survey.
Source (1998): Labour Force Survey, 1998.
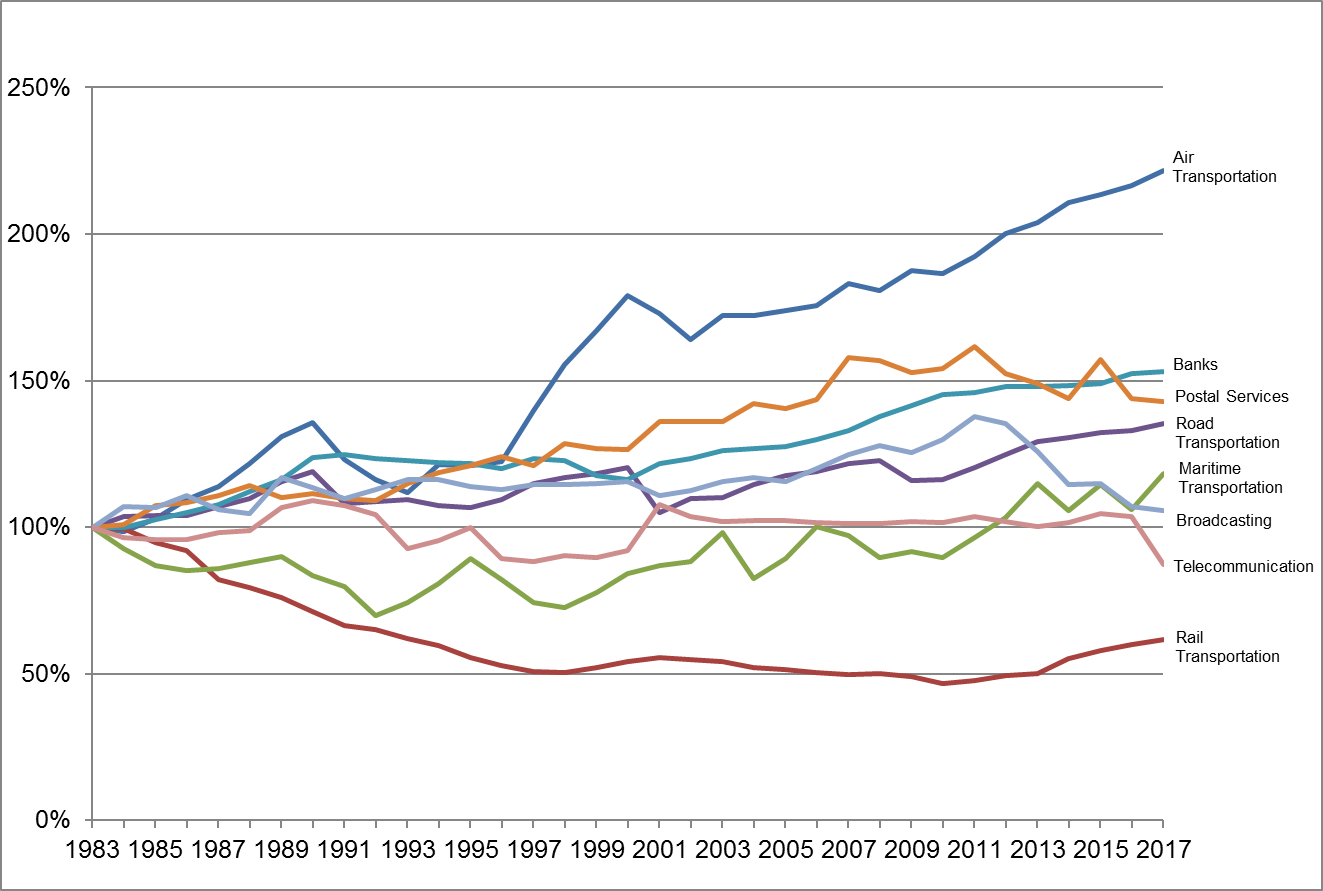
Figure 9 - Text version
| Industry | Air | Rail | Maritime | Road | Banks | Postal | Broadcasting | Telecom |
|---|---|---|---|---|---|---|---|---|
| 1983 | 1 | 1 | 1 | 1 | 1 | 1 | 1 | 1 |
| 1984 | 99% | 99% | 93% | 104% | 100% | 101% | 107% | 97% |
| 1985 | 103% | 95% | 87% | 104% | 102% | 107% | 107% | 96% |
| 1986 | 110% | 92% | 85% | 104% | 105% | 109% | 111% | 96% |
| 1987 | 114% | 82% | 86% | 107% | 108% | 111% | 106% | 98% |
| 1988 | 122% | 79% | 88% | 110% | 112% | 114% | 105% | 99% |
| 1989 | 131% | 76% | 90% | 115% | 116% | 110% | 117% | 107% |
| 1990 | 136% | 71% | 84% | 119% | 124% | 111% | 113% | 109% |
| 1991 | 123% | 66% | 80% | 108% | 125% | 110% | 110% | 107% |
| 1992 | 116% | 65% | 70% | 109% | 123% | 109% | 113% | 104% |
| 1993 | 112% | 62% | 74% | 109% | 123% | 115% | 116% | 93% |
| 1994 | 121% | 60% | 81% | 107% | 122% | 119% | 116% | 95% |
| 1995 | 121% | 56% | 89% | 106% | 122% | 121% | 114% | 100% |
| 1996 | 122% | 53% | 82% | 109% | 120% | 124% | 113% | 89% |
| 1997 | 140% | 51% | 74% | 115% | 123% | 121% | 114% | 88% |
| 1998 | 156% | 50% | 73% | 117% | 123% | 128% | 115% | 90% |
| 1999 | 167% | 52% | 78% | 118% | 118% | 127% | 115% | 90% |
| 2000 | 179% | 54% | 84% | 120% | 116% | 126% | 116% | 92% |
| 2001 | 173% | 55% | 87% | 105% | 122% | 136% | 111% | 108% |
| 2002 | 164% | 55% | 88% | 110% | 123% | 136% | 112% | 104% |
| 2003 | 172% | 54% | 98% | 110% | 126% | 136% | 115% | 102% |
| 2004 | 172% | 52% | 83% | 114% | 127% | 142% | 117% | 102% |
| 2005 | 174% | 51% | 89% | 118% | 127% | 141% | 116% | 102% |
| 2006 | 176% | 50% | 100% | 119% | 130% | 144% | 120% | 102% |
| 2007 | 183% | 50% | 97% | 122% | 133% | 158% | 125% | 101% |
| 2008 | 181% | 50% | 90% | 123% | 138% | 157% | 128% | 101% |
| 2009 | 187% | 49% | 92% | 116% | 141% | 153% | 125% | 102% |
| 2010 | 186% | 47% | 90% | 116% | 145% | 154% | 130% | 102% |
| 2011 | 192% | 48% | 97% | 120% | 146% | 161% | 138% | 104% |
| 2012 | 200% | 49% | 103% | 125% | 148% | 152% | 135% | 102% |
| 2013 | 204% | 50% | 115% | 129% | 148% | 149% | 126% | 100% |
| 2014 | 211% | 55% | 106% | 131% | 148% | 144% | 114% | 101% |
| 2015 | 213% | 58% | 114% | 132% | 149% | 157% | 115% | 105% |
| 2016 | 216% | 60% | 106% | 133% | 152% | 144% | 107% | 104% |
| 2017 | 222% | 61% | 118% | 135% | 153% | 143% | 106% | 87% |
Source: Survey of Employment, Payrolls and Hours, 1983 to 2017; Labour Force Survey, 1997 to 2018.
Page details
- Date modified: