
Departmental Results Report for fiscal year 2019 to 2020
On this page
- Ministers’ message
- Results at a glance and operating context
- Results: what we achieved
- Analysis of trends in spending and human resources
- Additional information
- Appendix: definitions
Alternate formats

Large print, braille, MP3 (audio), e-text and DAISY formats are available on demand by ordering online or calling 1 800 O-Canada (1-800-622-6232). If you use a teletypewriter (TTY), call 1-800-926-9105.
Complete a survey on your experience using this Departmental Results Report
Ministers’ message
We are pleased to present the 2019 to 2020 Departmental Results Report for Employment and Social Development Canada (ESDC). This report outlines the results achieved and the progress made toward the Department’s mandate to build a stronger and more inclusive country. This includes helping individuals live productive and rewarding lives and delivering many of the Government of Canada’s services that Canadians access throughout their lives.
Looking back on our key highlights, we would like to acknowledge the Department’s efforts to help support Canadians through the COVID-19 pandemic.
When the pandemic first shuttered the Canadian economy last spring, the Government of Canada moved swiftly to support Canadians. A keystone piece of that support was the Canada Emergency Response Benefit (CERB). The Department developed this new temporary income support benefit in collaboration with the Canada Revenue Agency. The benefit was designed and implemented in a matter of weeks. ESDC realigned its objectives from the traditional Employment Insurance program to support millions of Canadians suddenly out of work due to the pandemic. Having closed Service Canada Centres across the country, ESDC quickly shifted to respond and deliver while more than 25,000 employees suddenly began working from home.
ESDC provides many other supports for Canadian individuals, parents, families, organizations, workers and businesses. We want to express our sincere gratitude to all ESDC employees for their ongoing contributions. The Department’s cross-government collaboration, innovation and dedication to serving Canadians were once again recognized this year: ESDC was named one of Canada’s Top 100 employers and diversity employers in 2019. This is a reflection of our extremely talented and skilled workforce.
Now, more than ever, we see the importance of our mandate to support Canadians, especially the most vulnerable. In 2019, we launched Reaching Home: Canada’s Homelessness Strategy. This community-based program contributes to the goals of the National Housing Strategy. It maintains safe, stable and affordable housing and will reduce chronic homelessness nationally by 50 % by 2028. We have been working hard to improve the standard of living for all Canadians. That’s why we worked toward lifting Canadians out of poverty through investments and initiatives. To ensure continued accountability on poverty reduction, the Department formed the National Advisory Council on Poverty. This council will advise and report on yearly poverty reduction progress.
We continue to work to improve the quality of life for seniors in Canada. Through the New Horizons for Seniors Program, we launched community projects that increase connection, reduce isolation and help seniors maintain a social support network. In addition, we took steps to provide more financial security for seniors by enhancing the Guaranteed Income Supplement earnings exemption and proactively enrolling eligible seniors in the Canada Pension Plan. To help seniors with higher costs during the pandemic, we provided one-time, tax-free payments, with extra support for those with the lowest incomes. To ensure those seniors continue to get the benefits they depend on, we temporarily extended Guaranteed Income Supplement and Allowances payments for those who could not file their income information on-time.
The Government of Canada remains committed to ensuring parents have more money to help with the costs of raising kids. Since 2018, the Canada Child Benefit has been indexed annually to inflation to keep up with the cost of living. In July 2019, the yearly maximum benefit was increased once again. Over the past 3 years, ESDC has been working with the provinces and territories to create more affordable child care spaces across the country. This will ensure every child gets the best start in life. New bilateral agreements are currently underway to further support the early learning and child care sector. We are also strengthening early learning and child care programs for Indigenous children. In 2019, First Nations, Inuit and Métis Nation communities received new funding through community agreements and our federal partner departments.
To help youth participate in the labour market, we launched a renewed Youth Employment and Skills Strategy. We also expanded the Student Work Placement Program so that more students would have access to learning opportunities. We promoted skilled trades as a first-choice career. We lowered interest rates on Canada Student Loans and Canada Apprentice Loans. We also introduced a new option to help borrowers return their defaulted loans to good standing. In addition, we made it easier for students with permanent disabilities to access further funding when returning to school. As announced in Budget 2019, we introduced interest-free and payment-free leave for Canada Student Loan borrowers. This allows for temporary leave from studies for medical or parental reasons, including mental health leave. Supports for students were also a priority early on in the COVID-19 pandemic. We provided additional financial relief to student loan borrowers by temporarily pausing the repayment of Canada Student Loans.
We continued to enhance the Employment Insurance program to keep it aligned with the changing labour market. In the event of an employment transition such as job loss, illness or maternity/parental leave, financial support is available to Canadian workers.
Canadians have a right to fair, equitable, safe and healthy workplaces. We made a number of important changes to the Canada Labour Code to bring federal labour standards into the 21st century. This includes new breaks, leaves and the right to request flexible work arrangements. Gender equality and inclusiveness are important goals for modern workplaces. Ensuring all workers in federally regulated workplaces receive equal pay for work of equal value is a big step forward in meeting the expectations of today’s workers and best recognizing everyone’s contributions to the workplace. To that end, we continued to make progress on the implementation of the Pay Equity Act. We appointed the first-ever federal Pay Equity Commissioner. Furthermore, we are moving forward with new pay transparency measures in the federally regulated private sector. This aims to address the wage gaps affecting not only women, but also Indigenous peoples, persons with disabilities and visible minorities. These results are built on extensive ongoing consultation, which has created better results for workers and for employers.
Creating communities, workplaces and services that enable everyone to participate fully and without barriers is another priority area for the Government of Canada. In July 2019, the first-ever Accessible Canada Act came into effect. The Act established a framework to create a barrier-free Canada through the proactive identification, removal and prevention of accessibility barriers in the federal jurisdiction. It continues to guide us in everything we do.
It is critical that government services be reliable, accurate, secure and available to everyone, including those living in remote areas. By increasing its outreach activities, the Department is better able to accommodate vulnerable and marginalized populations. ESDC has made progress on the Department’s Service Strategy, meeting and exceeding numerous target goals. We modernized departmental IT systems and improved the quality of the client service experience and outcomes. We also ensured that all eligible Canadians have access to our services. As a result, the Department is better equipped to adapt to new challenges as they arise. This was proven during the onset of the COVID-19 pandemic, when the Department acted decisively and quickly to pivot services to ensure continuity of service for Canadians while keeping Canadians safe.
Canadians should rest assured that we will continue to assess and adjust our priorities. In this regard, the health, safety and financial security of Canadians will remain top of mind. Next year’s report will tell the more detailed story of how COVID-19 has affected our lives, our families and our work. We will continue to prove that together, we will get through this and build a better, more inclusive and stronger Canada.
We invite you to read the full report for more details about these. You will also learn about the many other accomplishments achieved by the Department over the past year.
Minister of Employment, Workforce Development and Disability Inclusion,
Carla Qualtrough
Minister of Families, Children and Social Development, Ahmed Hussen
Minister of Labour, Filomena Tassi
Minister of Seniors, Deb Schulte
Results at a glance and operating context
Operating context
The operating context for the 2019 to 2020 fiscal year can be split into 2 very distinct periods. First, there was the period before the COVID-19 pandemic, which lasted from April 2019 to February 2020. Then, there was the month of March, in which the department was significantly impacted by the COVID-19 pandemic and resulting global economic downturn.
From April 2019 to February 2020, the department operated in an environment characterized by:
- a healthy economy and labour market, with more jobs created and more money spent by consumers
- a strong housing market
- a growing global economy
- significant government investments in people and infrastructure
- strong government support for families with children and for seniors
In 2019, Canada experienced the second largest percentage growth in Gross Domestic Product (GDP) among G7 countries. It had a higher rate of GDP growth than the European Union.
The annual unemployment rate of 5.7% in 2019 was the lowest on record. Employment rose by nearly 400,000 from its 2018 level, its strongest growth since 2007. As a result, the number of Employment Insurance claimants receiving regular income benefits decreased, reaching its lowest point in more than 20 years. At the same time, the percentage of Canadians aged 15 to 64 who were employed reached an all-time high.
Trade disputes and skills pressures still posed risks to the Canadian economy. In addition, new technologies continued to change the way Canadians do their jobs. These changes benefitted employers and employees in many ways. They increased productivity, speed and ease of communication. They also highlighted where some Canadians may need to be re-trained in the future.
Challenges in hiring remained an issue and the percentage of firms reporting vacant jobs remained higher than the historical average. Labour market tightness was observed in many provinces, industries and occupations. Despite this, some groups continued to struggle in the labour market. These included recent immigrants, Indigenous Peoples, Black Canadians and members of other visible minorities. They also include persons with disabilities, youth, and persons with lower levels of educational attainment.
The department continued to address the expectations of Canadians with regard to government service delivery online, through call centres, and in person. We recognize that Canadians expect high-quality, easy-to-access, simple and secure services that are responsive to their needs.
Designing and delivering services with the client in mind and improving the client experience remained top priorities for the department. It listened and responded to the needs and expectations of Canadians by enhancing online service delivery. It also addressed security and privacy concerns, and strived to ensure full access to government programs for vulnerable Canadians.
Canadians expect the reliable delivery of benefits. In response, the department continued to invest in improving and modernizing its benefit delivery systems. These systems support the delivery of Employment Insurance, Canada Pension Plan and Old Age Security programs. The pandemic highlighted the critical importance for the department of a reliable and trusted digital infrastructure to guarantee delivery of benefits to Canadians when they need it.
The department’s operating context changed very suddenly and dramatically in March 2020 because of the pandemic. All levels of government began to implement physical and social distancing measures to contain its spread. Unemployment increased from 5.6% in February 2020 to 7.8% in March 2020. Over one million jobs were lost in that month. In addition, the number of persons employed, but working no hours, almost quadrupled from 565,500 in February to 2,085,000 in March. The number of persons employed and on the job, but working less than half their regular hours, also almost quadrupled from 242,000 in February to 943,000 in March (seasonally adjusted). These were unexpected events that the department had never dealt with before. In some cases, these events have meant that the department was unable to achieve its expected results while being called upon to deliver unexpectedly in other areas. The impacts of the beginning of the pandemic in March 2020, on the department are described in more detail later in the report.
Key Policy Achievements
The department continued to build a stronger and more inclusive Canada in fiscal year 2019 to 2020. It continued to help Canadians live productive and rewarding lives and to improve their quality of life. The department focused its attention and resources on supporting growth that benefits all and on transforming its services. This report outlines the main initiatives that the department undertook to meet its mandate, including the following:
The department launched the renewed Youth Employment and Skills Strategy to help all young people participate in the labour market. The strategy helps youth to access the supports and training they need to integrate the labour market. It introduced the Goal Getters stream to help youth under 15 to complete high school and transition to post-secondary education.
The department launched Reaching Home: Canada’s Homelessness Strategy to support Canadians experiencing, and at risk of, homelessness. As a part of the National Housing Strategy, it will contribute to reducing chronic homelessness by 50% by fiscal year 2027 to 2028. Reaching Home provides funding to community-based organizations to help them prevent and reduce homelessness.
The department supported amendments to the Canada Labour Code that improve employee eligibility for medical, maternity and parental leave. Other amendments give employees in federally regulated workplaces the right to request flexible work arrangements and new types of paid and unpaid leave. These new types of leave include leave for prescribed personal reasons, victims of family violence, traditional Indigenous practices, bereavement and absence for members of the Canadian Reserve Force.
In July 2019, the department supported the passage of the Accessible Canada Act. This act established a framework to create a barrier-free Canada through the proactive identification, removal and prevention of accessibility barriers in federal jurisdictions.
The department funded more than 2,800 projects under the New Horizons for Seniors Program. These projects helped more seniors benefit from, and contribute to, the quality of life in their communities. At least 848,700 Canadians benefitted from these projects.
The department began to work on the foundational elements of a Social Innovation and Social Finance Strategy. The strategy will strengthen the ability of communities to develop, finance and scale new solutions to persistent social challenges in Canada. The first pillar of the strategy, the Investment Readiness Program, was launched in June 2019 to help community organizations become ready for social finance.
Key Service Achievements
The department advanced its ambitious service agenda as outlined in its Service Strategy and implemented it through the Service Transformation Plan. The department’s efforts to ensure service excellence for clients are grouped into 3 main areas:
- maintaining the momentum in modernizing departmental IT systems, which underpin online service delivery
- continuing to improve upon the client service experience and outcomes
- ensuring all eligible Canadians can access our services so no one is left behind as a result of the digital transformation
Many service enhancements were achieved in the fiscal year prior to the pandemic. These contributed to the department’s rapid and effective rollout of government support measures in response to the pandemic. They also contributed to maintaining uninterrupted delivery of services to Canadians.
Technology and systems modernization
Canadians expect government services to be reliable, accurate, secure, and increasingly offered online. In addition, services must be flexible enough to quickly adapt to changes when necessary. All this requires continued modernization and investments in service infrastructure. In its 2019 to 2020 modernization efforts, the department made a number of advancements and achieved very concrete results, including:
- completing the migration of the Pensions Call Centre (Canada Pension Plan and Old Age Security) and of the Employment Insurance Call Centres to a new platform. The new technology platform greatly improves Canadians’ access to automated service and self-serve features. This migration addresses technology limitations that were preventing call centres from being 100% accessible to clients, which was also a key concern stemming from the OAG Call Centre audit
- moving forward on the design of the Interactive Voice Response System used for Canada Pension Plan and Old Age Security. This new design will introduce additional self-service features, which will be available to clients in fiscal year 2020 to 2021
- significantly progressing towards the migration of current and previous Old Age Security pension data to a more modern Canada Pension Plan platform. Once fully implemented, this will create a streamlined, reliable solution for the 2 pension programs to better serve Canadians
- designing, testing and launching a way to capture foreign nationals’ biometric information and transmit it to Immigration, Refugees and Citizenship Canada. Between December 3, 2019 and March 17, 2020, Service Canada Centres booked approximately 141,000 biometric collection appointments from the online Service Canada appointment booking system and completed approximately 95,000 biometric collections
- significantly advancing the planning of the Benefits Delivery Modernization programme, including the future state, requirements and procurement needs. This initiative, which will span over 10 years, will transform service delivery for the department’s 3 major programs. These major programs include Employment Insurance, Old Age Security and the Canada Pension Plan. Through this programme, the department will adopt a modern technology platform, which will simplify the processing of benefits. It will also offer new digital services, and it will enhance the department’s capacity to manage its services
Improving the client service experience and outcomes
Service modernization and investments in technology are ultimately a means to improve the client service experience. As a citizen-centred organization, the department achieved tangible improvements for clients. Some noteworthy examples include:
- optimizing its web pages to make them more accessible for those who use voice to search for trusted content. This increased voice search results by 20% and web search results in general by about 50%
- making it easier for organizations to apply to grants and contributions programs. Organizations can track their status, sign agreements, manage active projects, submit supporting documents and data, and review past projects online
- simplifying the language on the websites, forms, and letters to clients issued by Social Security Tribunal of Canada. The tribunal also introduced case navigators to help appellants better understand the process and how to prepare for a hearing
- streamlining application processes and improving services to eligible Canadian seniors by implementing service improvement strategies. These included automated processing for the Canada Pension Plan, the Canada Pension Plan enhancement and the Old Age Security
- harmonizing the processes for requests for reconsideration of Employment Insurance applications. This improved the efficiency of decision making and provided more timely decisions and information to clients on their entitlement
- supporting the coordination of client services provided on-line, in-person, and by phone through the implementation of the Integrated Channel Strategy. This coordination enabled greater consistency in the client service experience and better management of the workload
- increasing the number of self-service options students can access to manage their funding using almost any device. This includes tracking funding status and a “Virtual Repayment Counselor”, as well as financial literacy tools and tips
Ensuring no one is left behind
The department recognizes that government services must be available to everyone, especially to vulnerable Canadians. As such, the department undertook several measures and initiatives to strengthen accessibility of its services to vulnerable populations, including:
- expanding its outreach efforts to remote areas, northern and Indigenous communities
- reaching out to vulnerable Canadians through virtual community outreach to support people with barriers in accessing services online. To this end, community organizations serving those who experience internet connectivity issues were contacted. The department provided them with information on programs and services, including the manner in which clients can access services. This ongoing solution will result in the ability to provide equal access to services and benefits to all Canadians, regardless of where they live
- supporting veterans and their families through the delivery of information services. The department responded to over 1,600 requests for information, including approximately 50 referrals to Veterans Affairs Canada (VAC) employees. It also assisted with approximately 250 applications for VAC programs and services. The department also supported VAC with the launch of Pensions for Life in April 2019. It ensured the information was up to date and available throughout its service delivery network
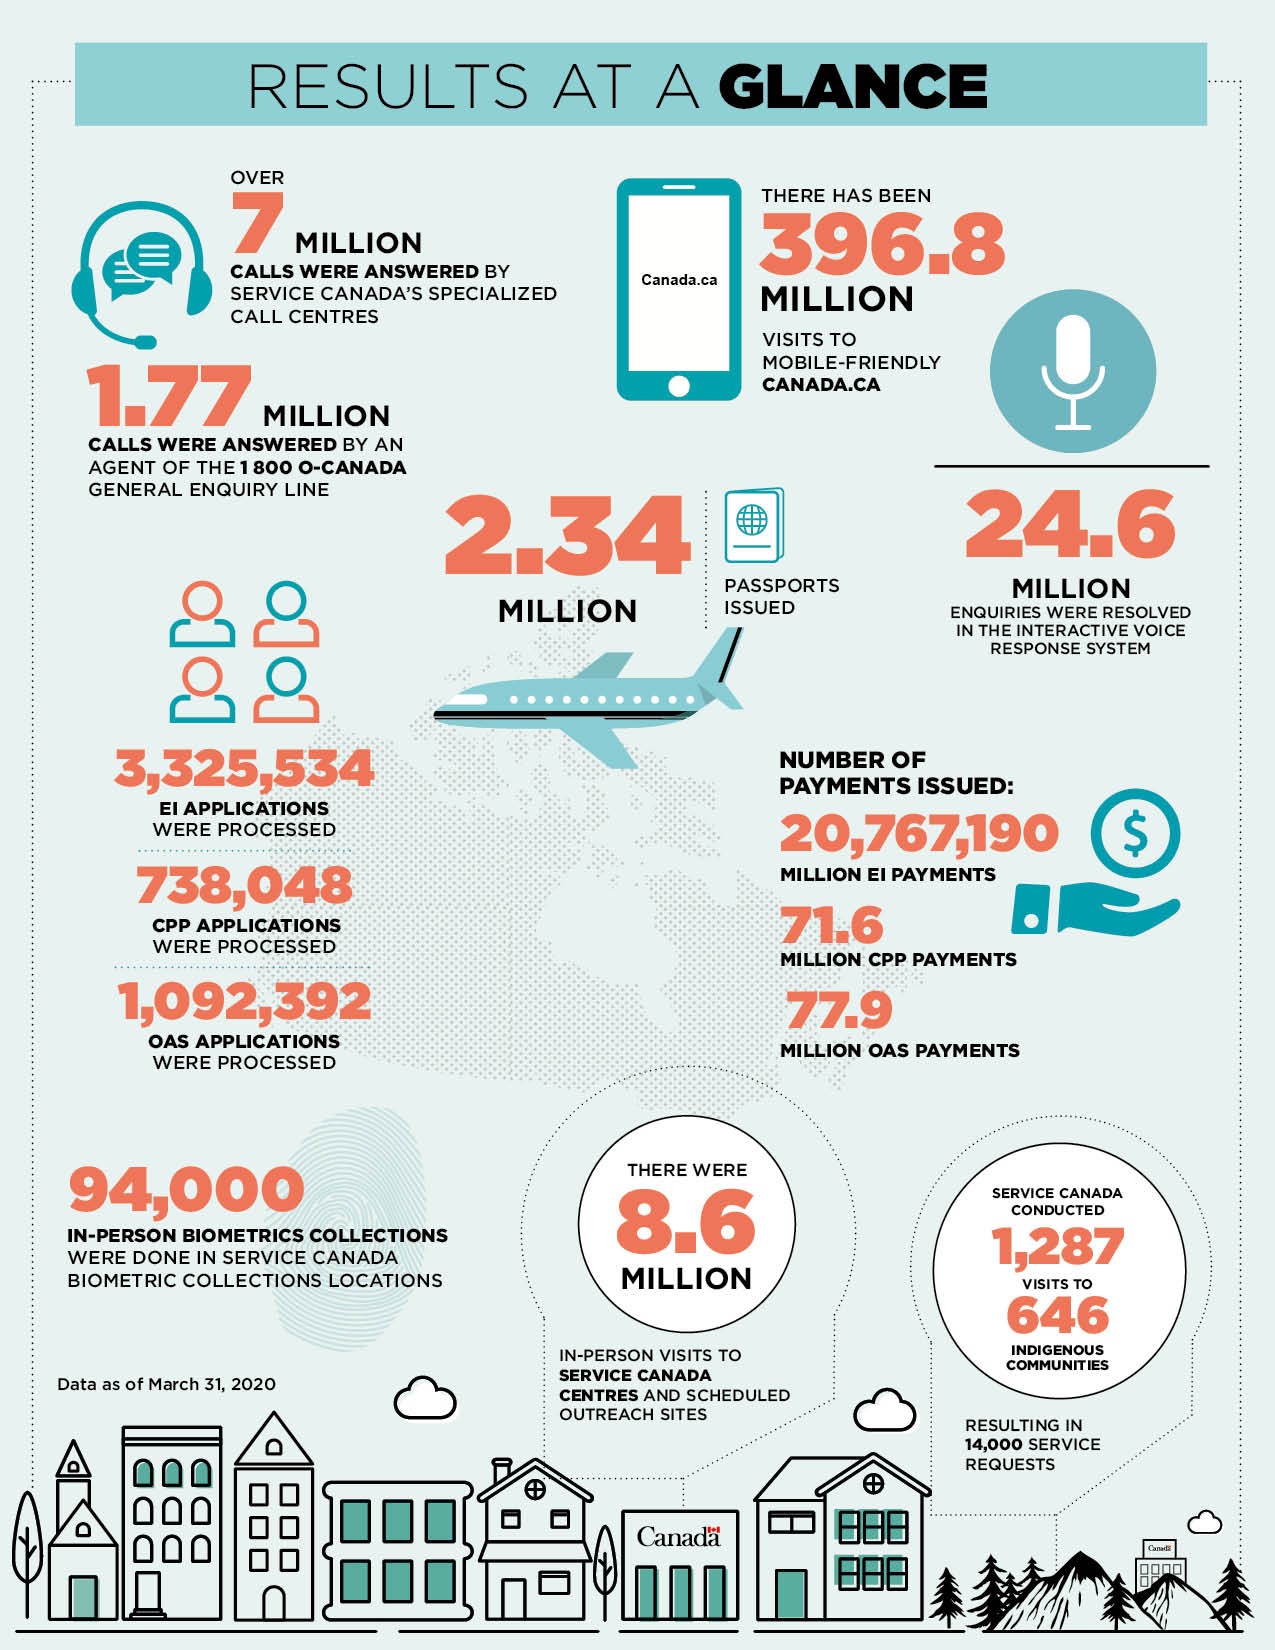
Text description of figure 1:
- Over 7 million calls were answered by Service Canada’s specialized call centres
- 1.77 million calls were answered by an agent of the 1 800 O-Canada general enquiry line
- There has been 396.8 million visits to mobile-friendly Canada.ca
- 2.34 million passports issued
- 24.6 million enquiries were resolved in the interactive voice response system
- Number of payments issued:
- EI: 20,767,190 payments
- CPP: 71.6 million payments
- OAS: 77.9 million payments
- Number of applications processed:
- EI: 3,325,534
- CPP: 738,048
- OAS: 1,092,392
- 94,000 in-person biometrics collections were done in Service Canada biometric collections locations
- There were 8.6 million in-person visits to Service Canada Centres and scheduled outreach sites
- Service Canada conducted 1,287 visits to 646 Indigenous communities, resulting in 14,000 service requests
Response to COVID-19
In March 2020, the department began to put in place measures to support Canada’s whole-of-government response to the COVID-19 pandemic. These measures are part of a comprehensive plan to support all Canadians. The department focused its efforts on workers, families, students, seniors, persons with disabilities, individuals experiencing and at risk of homelessness, and Indigenous peoples. Department employees across the country took part in this collective effort. They worked hard to serve as many Canadians as possible, whether through direct service delivery or by providing a supporting role.
The department’s initial response to the pandemic crisis was implemented in just a matter of weeks. It included the initiation of new initiatives, adjustments to existing programs, and finding new ways of delivering services to Canadians. Below is an overview of the measures taken to support the government response to the pandemic, which were implemented in fiscal year 2019 to 2020.
New initiatives
The Canada Emergency Response Benefit (CERB) was the main initiative that the department put in place. Through collaboration, ESDC and the Canada Revenue Agency designed and implemented this new temporary income benefit in a matter of weeks. The CERB provided Canadian workers who had stopped working due to COVID-19 with a taxable benefit of $2,000 a month. Since March 2020, almost 9 million people have received CERB benefits. As noted by Maclean’s Magazine on May 4, 2020: “The scope and speed of what happened to get the CERB out the door is unparalleled – a truly historic moment for the public service.”
Adjustments to existing programs
As the impacts of the pandemic evolved, the department worked hard to adjust its programs to address the new reality. It identified measures that would enhance support to Canadians as quickly as possible. This included changes to the Employment Insurance regime and increasing the flexibility of public pensions.
Many Canadians had to stop working or lost their jobs because of COVID-19. To support these affected workers, the department made important changes to the Employment Insurance regime, by:
- waiving the one-week waiting period for people in quarantine or who were directed to self-isolate, and were claiming EI sickness benefits
- extending the maximum duration of the Work-Sharing program from 38 weeks to 76 weeks for employers who were experiencing a downturn in business due to COVID-19, and their workers. This measure provided income support to employees eligible for EI who agreed to reduce their normal working hours because of developments beyond the control of their employers
Changes to the public pension programs made it easier for pension beneficiaries to access their benefits. They also reduced barriers to access caused by the pandemic. Some of these changes to processes included:
- giving beneficiaries of the Guaranteed Income Supplement, Allowance, and Allowance for the Survivor until October 1, 2020 (instead of June 1, 2020) to provide their income information. The department uses this information to renew their benefits. The period was extended given the deferred 2019 income tax filing deadline. Benefits will be retroactively adjusted to July 2020. This will ensure that beneficiaries continue receiving benefits without interruption until December 2020
- simplifying various requirements, such as eliminating the need for a wet signature, waiving some documentary evidence, and creating generic email boxes
The department secured an additional $157.5 million to help those experiencing, or at risk of, homelessness as a result of the COVID-19 crisis. Reaching Home: Canada’s Homelessness Strategy will use the funds in fiscal year 2020 to 2021, to help communities adapt service delivery and put in place emergency measures to try and reduce the risk of COVID-19 transmission for Canadians experiencing, or at risk of, homelessness and those serving them.
The department also took measures to support students and apprentices through the Canada Student Loans Program and Canada Apprentice Loans. The department introduced a 6-month, interest-free period on Canada Student Loans and Canada Apprentice Loans, from March 30 to September 30, 2020.
Adjustments to Service Delivery
After temporarily closing its Service Canada Centres on March 26 to protect clients and employees, the department reinvented itself to ensure Canadians could access services. Among many initiatives, the department:
- developed a new approach to service delivery with the launch of e‑ServiceCanada, which began with the first quarantines on February 7th, 2020. With this service, clients can request assistance online, then be contacted by a Citizen Service Officer within 2 business days
- set up the new Canada Emergency Response Benefit call center in only 9 days. The department redeployed around 1,500 employees to operate it. At its peak, the call centre handled more than 30,000 calls daily
The department contributed to keeping Canadians informed during these challenging times through several means, including:
- working with Health Canada to ensure Canadians always had the most reliable and up-to-date information about COVID-19. This was done through:
- maintaining the Canada.ca/coronavirus website, that provided information resources for Canadians
- implementing the Government of Canada's coronavirus information line (1‑833-784-4397), available from 7:00 a.m. to midnight (EST) 7 days a week. The line was supported by the 1-800 O Canada contact centre
- building the Canada Emergency Response Benefit web pages on Canada.ca, in collaboration with the Canada Revenue Agency. These pages were launched in early April (over 2.5 million visitors on April 6 alone). They included an innovative triage tool to steer Canadians between Canada Revenue Agency and Service Canada support
- building a COVID-19 Virtual Assistant in less than 48 hours to help Canadians find the latest COVID-19 information on Canada.ca. By March 31st, it had supported over 490,000 requests
- working with federally regulated employers and workers to deliver essential services to Canadians safely and efficiently. This includes those in the trucking, food supply chain, railways, ports, and airways, along with many other industries
The department continued to support the Government’s response to the pandemic past March 2020. As the impact of the pandemic on the lives of Canadians became clearer, the department worked hard to implement and adjust programs to better respond to the crisis. The following measures outline additional initiatives the department put in place in response to the pandemic:
- providing an additional amount of up to $300 per child through the Canada Child benefit, for benefit year 2019 to 2020
- providing a one-time, tax-free payment of $300 for seniors eligible for Old Age Security and a further $200 for seniors eligible for the Guaranteed Income Supplement. Those eligible for the Allowances also received a payment of $500
- providing a one-time payment of up to $600 in recognition of the expenses incurred by persons with disabilities during the COVID-19 pandemic
- creating a new E-SIN online application, in 10 working days, for clients looking to obtain or renew a Social Insurance Number. This application eliminated the need to complete paper documents and submit them by mail or in person. Obtaining a valid Social Insurance Number enabled clients to obtain employment and important benefits
- launching over a thousand additional local seniors projects through the New Horizons for Seniors Program to reduce isolation, improve seniors’ quality of life, and help them maintain a social support network
- establishing the Emergency Community Support Fund, through the Social Development Partnerships Program, in fiscal year 2020 to 2021. This fund will provide $350 million to support community organizations serving vulnerable Canadians during the COVID-19 crisis
- adapting the Enabling Accessibility Fund to allow organizations to get funding faster, with less administrative burden. Changes include the implementation of a flat rate model, and doubling the time allowed to organizations, under the small projects component, to complete activities
- making temporary changes to the Canada Summer Jobs program, which allow employers to receive an increased wage subsidy. Other changes include extending the end date of employment to February 28, 2021 and allowing hiring on a part-time basis
The long-term economic and socio-economic impacts of COVID-19 in Canada remain to be seen. As the pandemic evolves, the department will continue to focus on supporting Canadians and ensuring access to accurate government information and services that meet their needs.
For more information on Employment and Social Development Canada’s plans, priorities and results achieved, see the “Results: what we achieved” section of this report.
Results: what we achieved
Social development
Description
To increase inclusion and opportunities for Canadians to participate in their communities.
Results
In 2019 to 2020, the department undertook the following initiatives to advance this core responsibility:
The department contributed to preventing and reducing homelessness
The department launched Reaching Home: Canada’s Homelessness Strategy on April 1st, 2019. This community-based program’s goals are to prevent and reduce homelessness. It does so by providing direct financial support to designated communities, Indigenous and rural and remote communities across Canada. The program is part of the National Housing Strategy. Reaching Home contributes to the goal of reducing chronic homelessness by 50% by fiscal year 2027 to 2028. In fiscal year 2019 to 2020, Reaching Home provided approximately $189 million to communities across the country.
Under Reaching Home, the department introduced coordinated access processes. Coordinated access helps communities identify people that need assistance and match them to the right housing and services in a more streamlined way. Reaching Home is also putting more focus on addressing Indigenous homelessness. This includes the unique needs of First Nations, Inuit and Métis communities.
The department also expanded Reaching Home to 6 additional designated communities through an open and transparent process. As a result, Abbotsford, Cochrane District (Timmins), Lambton County, Cowichan Valley, Chilliwack, and Kenora are now funded through the Designated Communities stream.
The department worked to reduce poverty
The department formed the National Advisory Council on Poverty, a key commitment of Opportunity for All: Canada’s First Poverty Reduction Strategy. Statistics Canada and Employment and Social Development Canada conducted a comprehensive review of the Market Basket Measure (MBM), Canada’s Official Poverty Line. This will ensure that the MBM reflects the up-to-date cost of goods and services representing a modest, basic standard of living.
The department helped not-for-profit organizations, communities, and other groups enhance their capacity to address social issues
Persons with disabilities
The department funded 81 projects under the Disability component of the Social Development Partnerships Program. Eight of these were completed in fiscal year 2019 to 2020, and were able to obtain over $1.8 million in supplementary investments from various partners. The department also launched 4 new calls for proposals for persons with disabilities targeted at improving financial security, youth leadership, Accessible Canada partnerships, and Indigenous Leadership. Projects are expected to begin in fiscal year 2020 to 2021.
The department also supported the social inclusion of people with disabilities by:
- facilitating the Canadian disability community’s contributions to the development of:
- the United Nations Convention on the Rights of Persons with Disabilities
- the Accessible Canada Act
- developing, testing and identifying promising practices and tools to promote social inclusion of persons with disabilities
- supporting capacity building within disability organizations that encourage partnerships and collaboration between organizations. This allows them to improve their operations, expand their impact, and improve their sustainability. Six organizations addressed limitations in their organizational capacity, and received assistance with Board and management recruitment. They also worked on promotion, branding, marketing, and communication, and addressed legal barriers facing their organizations such as those related to intellectual property or corporate structure
The department also facilitated the production and distribution of alternate format publications to support Canadians with print disabilities.
Children and Families
The department funded projects that directly benefitted 512,724 vulnerable Canadians (children, youth and adults) through the Children and Families component of the Social Development Partnerships Program. This funding enabled community organizations to raise an additional $0.78 from non-federal partners for every dollar received from the program.
Black communities
Budget 2019 provided $25 million over 5 years, in recognition of the United Nations International Decade for People of African Descent. This funding, starting in fiscal year 2019 to 2020, will serve to establish the Supporting Black Canadian Communities Initiative. This initiative will build foundational infrastructure within Black communities. It will also increase awareness of the realities for Black communities within government. Through the Social Development Partnerships Program, the department funded an initial project under the Supporting Black Canadian Communities Initiative. It funded Caribbean African Canadian Social Services to conduct a feasibility study and to develop a concept paper. This work will help plan the creation of a Canadian Institute for People of African Descent. The institute will be dedicated to addressing social issues faced by Black Canadian communities.
Community organizations
The department launched the Investment Readiness Program. This 2-year, $50 million pilot program is aimed at helping social purpose organizations to participate in the social finance market. The department established 24 partnerships to support the implementation of the program.
By the end of the pilot, it is expected that funding will be redistributed to 300 to 500 social purpose organizations by 5 Readiness Support Partners. Of these partners, 2 are Indigenous-focused and one is women-focused. With this funding, social purpose organizations will increase their readiness to access social finance opportunities. They will also enhance their capacity to address persistent social issues. They will be able to access expertise to get ready for financing opportunities.
Through the program, the department also supported the development of the social finance ecosystem in Canada by providing funding to projects that will:
- expand and strengthen the social finance ecosystem by engaging underrepresented groups, such as those from Indigenous, Black, and women-led or focused organizations
- address system-level gaps in the social finance marketplace, such as expanding the focus of the common approach to impact measurement
The department helped to improve seniors' quality of life, and to better promote seniors' participation and inclusion in their communities
The department funded at least 2,831 projectsFootnote 1 across Canada under the Community-Based stream of the New Horizons for Seniors Program. These helped seniors benefit from, and contribute to, the quality of life in their communities through active living and social activities. Most funded organizations reported an increase in their capacity to:
- provide activities to seniors
- recruit volunteers
- develop partnerships
- enhance facilities that support seniors’ initiatives in their communities
An estimated total of more than 848,700 community members benefitted from these projects in fiscal year 2019 to 2020.
The department exceeded its 2019 to 2020 funding target, which was at least 1,850 projects. This is partly due to an additional investment of $100 million over 5 years for the New Horizons for Seniors Program. This additional funding resulted in 666 additional community-based projects funded in 2019 to 2020.
The department also funded multi-year projects of up to 5 years in duration under the Pan-Canadian stream of the New Horizons for Seniors Program. These projects used innovative approaches to address senior’s issues and included:
- funding 22 organizations to support the development and implementation of collective impact plans. These projects, which brought together organizations from different sectors within a community, focus on building long-lasting community networks. The goal is to help meet the growing social needs of seniors, with a focus on addressing the social isolation of seniors
- funding the United Way of the Lower Mainland in the amount of $250K to increase the capacity and effectiveness of Community Based Seniors Services agencies. The project is helping agencies to better communicate, coordinate, collaborate, and learn from each other about effective ways to promote and support healthy aging, and address the growing challenges of an aging population. This will be done through the development and implementation of a national online knowledge hub
- funding the Canadian Mental Health Association Ontario to support the sustainability of some partnerships formed under the Toronto Collective Impact Plan entitled 'ENRICHES'. This project allowed for greater knowledge transfer of the programs developed as well as more training of senior peer leaders for various activities
The department supported the National Seniors Council in implementing its 3-year mandate.
This mandate includes a work plan to provide advice on ways to address financial crimes and harm against seniors. It also includes a national seniors strategy, initiatives to support healthy aging and identifying measures to counter ageism. It also aims to strengthen attention to seniors’ housing needs and on the value of a national seniors’ strategy. The department provided the Council with administrative and logistical support. This helped the Council contribute to the engagement of seniors, caregivers, and community stakeholders.
The department contributed to removing barriers to accessibility for people with disabilities
The department started to implement the Accessible Canada Act, which came into force on July 11, 2019. This included helping to launch Accessibility Standards Canada, a new standards development organization, and beginning to develop foundational regulations.
The department signed a 5-year Memorandum of Understanding with Statistics Canada to develop a new Accessibility Data and Measurement Strategy. This collaboration resulted in a Performance Indicator Framework and Implementation Plan. These tools will help measure and monitor the progress of the act in removing barriers to accessibility for Canadians. The department also conducted public opinion research. This research will gather information on attitudes towards accessibility and on the experiences of persons with disabilities with barriers to accessibility.
Through the Disability component of the Social Development Partnerships Program, the department:
- supported 13 projects for the 2019 National AccessAbility Week. These projects carried out activities such as film festivals, art exhibits, workshops, training modules, and social media campaigns. These projects contributed to raising awareness of the importance of accessibility and inclusion in different sectors and communities
- supported innovative ways to identify barriers and best practices to ensure the development of regulations is an accessible process. The department also facilitated the participation of disability stakeholders in regulatory processes
The department led a project to better understand the barriers associated with electronic payment terminals. The project also identified options for improving accessibility.
Under the Enabling Accessibility Fund, the department funded 376 projects. Fewer projects than targeted were funded, as part of the funds were transferred to the Disability component of the Social Development Partnerships Program. These funds were transferred to respect a Budget 2019 commitment to help produce new accessible reading materials. However, the department funded more than twice the number of youth-led projects it supported in the previous year. These projects improved access to programs, services and employment opportunities for Canadians with disabilities.
The department also funded 504 projects over 2 years through the Investing in Canada Plan. The program has now reached 27% of its goal of supporting an additional 1,800 projects by 2028.
The department increased access to early learning and child care
The government set a target to create up to 40,000 child care spaces in Canada by March 2020. The department supported the government’s negotiations with provinces and territories for bilateral agreements. Results from fiscal year 2017 to 2018 and 2018 to 2019 show that 38,000 more affordable child care spaces have been created through federal investments, which is 95% of the target. Final results for fiscal year 2019 to 2020 will be available in Fall 2020, once annual progress reports are submitted by provinces and territories.
The department also provided $16.4 million to various organizations to explore innovative methods of delivering early learning and child care (ELCC). Examples of these methods include:
- creating simulated environments and training materials for early learning and child care education professionals
- connecting users to resources and services in the community
- facilitating access to resources for parents
The department helped realize the goals and priorities of Indigenous peoples set out in the Indigenous Early Learning and Child Care Framework
The department provided new funding to First Nations, Inuit and Métis Nation communities through agreements with these communities and other federal partner departments. In fiscal year 2019 to 2020, these agreements strengthened services for Indigenous families and resulted in:
- all 634 First Nations receiving new funding for a range of early learning and child care needs
- increased funding to support improved existing early learning and child care services in 73 Inuit communities
- new Métis-specific early learning and child care programs, services and supports
In addition, the Aboriginal Head Start in Urban and Northern Communities program received increased support to transform early learning and child care for Indigenous people. This transformation initiative also funded quality improvement projects to support Indigenous-led best practices. These projects are meant to advance foundational elements of Indigenous early learning and child care.
To ensure clients receive high-quality, timely and efficient services that meet their needs, the department
- met the service standard target for the Social Development program priority service. It processed grants and contributions program payments in the prescribed timeframes, which are:
- 90% of contribution payments are processed within 28 calendar days of receiving completed claim package
- 90% of grant payments are processed within 15 calendar days after the approved grant project start date
- implemented several pilot projects to make it easier to apply to grants and contributions programs. These projects included a simplified grant application form and a targeted promotion for the 2019 call for proposals for the New Horizons for Seniors Program. Results from these projects will be used to make improvements in other programs
- interviewed applicants to the Enabling Accessibility Fund to get their input and feedback on their experience applying to the program. Results from these interviews have helped identify areas for improvements to service delivery for this and other programs. This includes streamlining documents and simplifying applicant requirements
The department helped advance the United Nations 2030 Agenda for Sustainable Development and its 17 Sustainable Development Goals (SDGs)
Following nationwide consultations, the department released Towards Canada’s 2030 Agenda National Strategy in June 2019. This is an important step toward establishing the structures, processes and activities needed to move the 2030 Agenda forward. In the context of the pandemic, the sustainable development goals are of particular importance to help rebuild more inclusive, resilient and sustainable communities.
The department also provided $4.6 M in grant funding to initiatives from 50 not-for-profit organizations, communities and other groups across the country. These initiatives helped increase public awareness of the sustainable development goals. They also supported collaboration across sectors, and drove progress on multiple goals to improve outcomes for Canadians. Among others, these initiatives aim to improve life outcomes for Indigenous communities and vulnerable and marginalized populations.
Finally, the department developed a first draft of the Canadian Indicator Framework. The framework will help track and report on national progress on the 17 sustainable development goals.
Gender-based analysis plus
His section highlights some of the key achievements related to GBA+ for this core responsibility. For more information on GBA+ initiatives in the department, see the Gender-Based Analysis Plus Supplementary Information Table.
The New Horizons for Seniors Program (NHSP) funds various projects aimed at supporting the social well-being and community vitality of Canada’s seniors. Through its community-based projects stream, the program has funded targeted projects focussed on reaching the most vulnerable senior populations. The current call for proposals is the first time these vulnerable populations have been engaged by NHSP in a concerted outreach effort. These senior populations include the socially isolated, low-income earners, persons with disabilities, visible minorities, the geographically isolated, new immigrants, ethno-cultural minorities, indigenous peoples, women, and members of the Lesbian, gay, bisexual, transgender, queer, and 2-spirit (LGBTQ2) community.
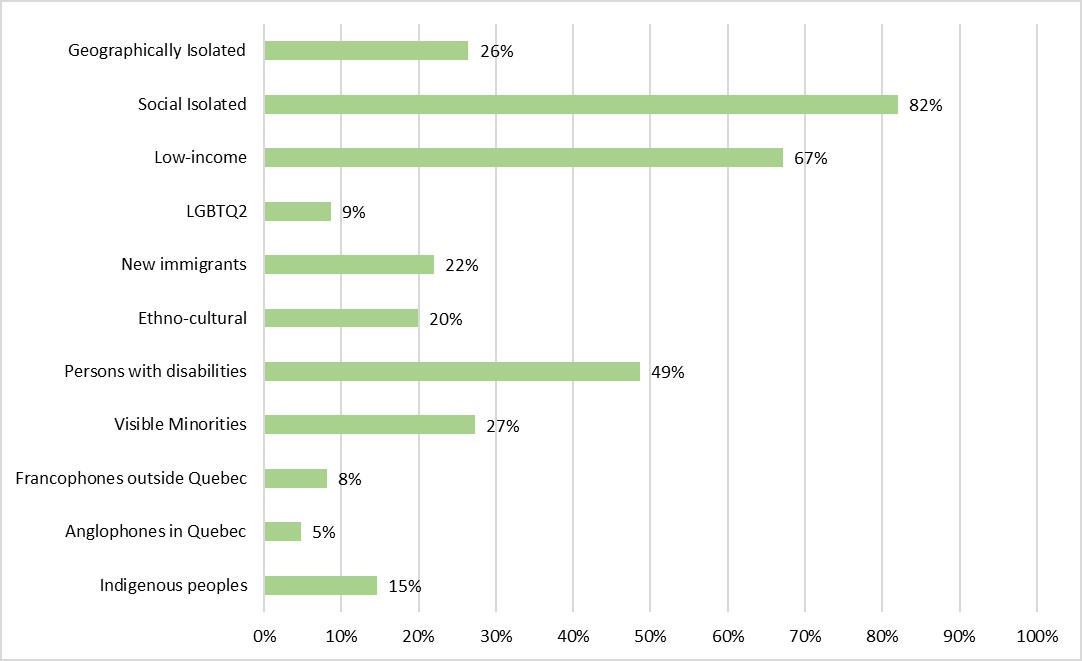
Text description of figure 2:
- Geographically isolated: 26%
- Socially isolated: 82%
- Low-income: 67%
- LGBTQ2: 9%
- New immigrants: 22%
- Ethno-cultural: 20%
- Persons with disabilities: 49%
- Visible minorities: 27%
- Francophones outside Québec: 8%
- Anglophones in Québec: 5%
- Indigenous peoples: 15%
As a result of the 2015 call for proposals, the pan-Canadian stream funded 48 collective impact projects across Canada, which were completed in 2019 to 2020. About 187,400 of the seniors who participated in these projects reported a reduction in their social isolation, 71% of whom were women.
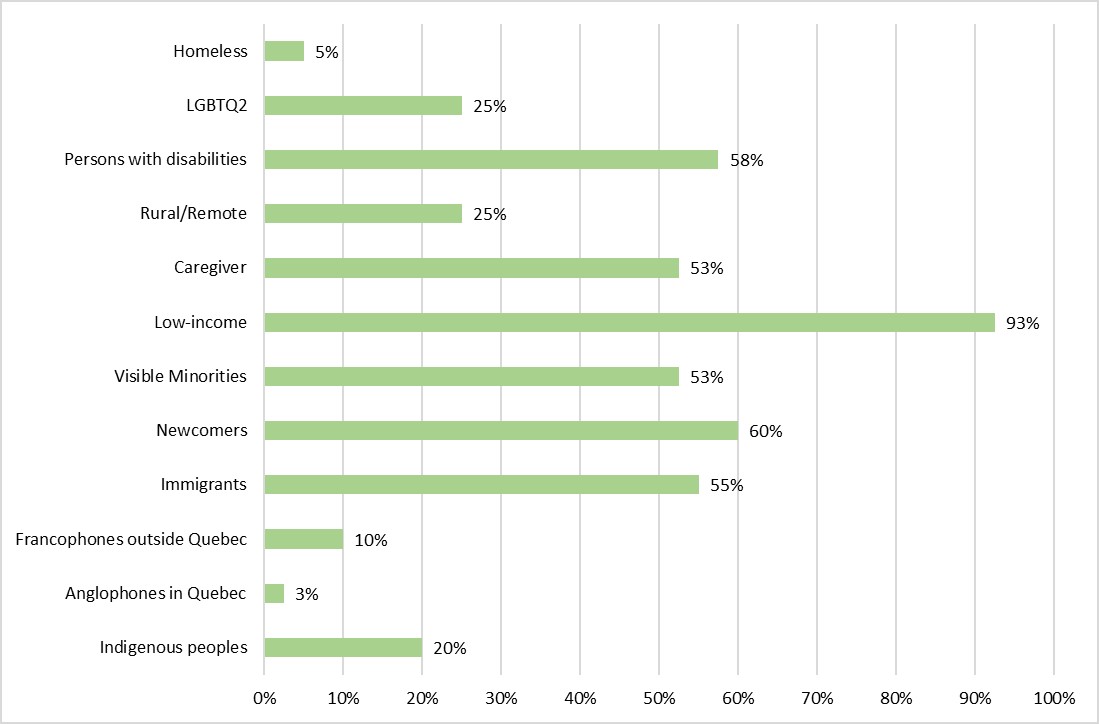
Text description of figure 3:
- Homeless: 5%
- LGBTQ2: 25%
- Persons with disabilities: 58%
- Rural/remote: 25%
- Caregiver: 53%
- Low-income: 93%
- Visible minorities: 53%
- Newcomers: 60%
- Immigrants: 55%
- Francophones outside Québec: 10%
- Anglophones in Québec: 3%
- Indigenous peoples: 20%
In the last call for concepts, applicant organizations had to develop a multi-partner approach, called Collective Impact, to increase seniors’ social inclusion within a specific community. The Collective Impact approach had to address systemic barriers that are known to contribute to the social exclusion of seniors. Organizations had to develop a strategy to address the unmet needs of vulnerable sub-populations of seniors. These sub-populations included women; members of the LGBTQ2+ community; persons with disabilities; Indigenous peoples; persons with lower income; immigrants; visible minorities; and, members of Official Language Minority Communities.
22 collective impact initiatives were approved, all focussing on vulnerable sub-populations of seniors. One project in particular is focussed specifically on seniors who are from the LGBTQ2+ community.
The Gilbert Centre for Social and Support Services will lead the “Georgian 2SLGBTQ Seniors Project” collective impact initiative. It will work in collaboration with not-for-profit community organizations to increase the social inclusion of LGBTQ2+ seniors in Barrie, Sudbury and North Bay. The project will address the social isolation, discrimination and systemic barriers that LGBTQ2+ older adults can face. This will be done by increasing organizational capacity through the “Safer Spaces” program. It will include developing a community engagement strategy based on peer support activities, and building individual capacity through social networks.
Experimentation
The department’s Accessibility Secretariat and Innovation Lab led a project to “co-develop” guidance material with people with disabilities and industry to support the implementation of the Accessible Canada Act. This guidance material will inform the development of accessibility plans, feedback processes and strengthen accessibility for industry. Workshops were fully accessible and co-facilitated by persons with disabilities. The project brought together a diversity of perspectives across industry and persons with disabilities on best practices related to reducing barriers for a more accessible Canada.
An experiment was launched under the Enabling Accessibility Fund. It tested a method to improve the participation of Youth Accessibility Leaders in solving the accessibility issues within their community. These volunteers identify accessibility challenges in their community and work with organizations to submit a proposal to fund a solution. In the first 2 years of the youth stream, few youth successfully worked with organizations to submit completed project applications. Feedback from participants suggested that mentoring and connection with past and current youth accessibility leaders could help them complete their projects. The department then tested a new online platform to engage youth and increase the number of projects submitted. While only 14% of youth used the platform and only 3% helped submit project proposals, the participation rate of youth was its best ever.
Results achieved
Departmental result: Homelessness is prevented and reduced
Performance indicator: Reduction in the estimated number of shelter users who are chronically homeless See note 1
Target: 31% See note 2
Date to achieve target: March 2024
2019 to 2020 actual result: Not available (2019)
2018 to 2019 actual result: Not available (2018)
2017 to 2018 actual result: Increase of 8.7% compared to 2016 baseline See note 3
Departmental result: Not-for-profit organizations, communities and other groups have an enhanced capacity to address a range of social issues such as the social inclusion of people with disabilities, the engagement of seniors and support for children and families
Performance indicator: For every dollar invested through the Social Development Partnerships Program, amount leveraged/invested by non-federal partners See note 4
Target: $0.30
Date to achieve target: March 2020
2019 to 2020 actual result:
- Children and Families component: $0.78
- Disability component: $0.39
2018 to 2019 actual result:
- Children and Families component: $0.78
- Disability component: $0.39
2017 to 2018 actual result:
- Children and Families component: $1.02
- Disability component: $0.22
Departmental result: Barriers to accessibility for people with disabilities are removed
Performance indicator: Number of community spaces and workplaces that are more accessible due to Enabling Accessibility Fund funding
Target: 400 See note 5
Date to achieve target: March 2020
2019 to 2020 actual result: 376 See note 6
2018 to 2019 actual result: 473
2017 to 2018 actual result: 609
Departmental result: Access to early learning and child care is increased
Performance indicator 1 of 2: Number of children in regulated child care spaces and/or early learning programs
Target: 40,000 See note 7
Date to achieve target: March 2020
Performance indicator 2 of 2: Number of children receiving subsidies or other financial supports
Target: To be determined
Date to achieve target: March 2020
2019 to 2020 actual result: Not available See note 8
2018 to 2019 actual result: 38,000 (combined total for both indicators for both fiscal years: 2017 to 2018 and 2018 to 2019)
2017 to 2018 actual result: 21,205 (combined total for both indicators)
Departmental result: Clients receive high-quality, timely and effective services that meet their needs See note 9
Performance indicator: Service standard target for Social Development program priority service, as defined by the Government of Canada’s Policy on Service, was met.
Target: 90% See note 10
Date to achieve target: March 2020
2019 to 2020 actual result: 94%
2018 to 2019 actual result: 1 out of 1
2017 to 2018 actual result:1 out of 1
Notes:
- This indicator is based on the calendar year. There is a 3-year lag in the availability of data. Results for 2018 are anticipated to be available in 2021. Results for 2019 are anticipated to be available in 2022
- 2027 to 2028 target: 50% (Date to achieve target: March 2028). Baselines estimated at 26,900 (2016)
- The 2017 figure uses an enhanced methodology for the cleaning and processing of shelter data. The approach used in 2017 is more inclusive of individual experiences of chronic homelessness and increases the accuracy of the estimate
- Organizations are encouraged to use the Social Development Partnership Program funding to leverage cash and in-kind investments from other non-federal organizations. This allows the pool of investment brought to bear on any given issue to be increased. However, it is no longer mandatory to leverage the Social Development Partnership Program funding. Increased partnerships, through cash and/or in-kind contributions, increases the impact of program funding. It expands the capacity of recipients to build and further their knowledge, understanding and capacity to address complex social issues
- This target was based on the anticipated number of projects for fiscal year 2019 to 2020
- Because of a Budget 2019 commitment, the Enabling Accessibility Fund transferred $1 million to the Social Development Partnerships Program–Disability component. This sum was to help produce new accessible reading materials. While this resulted in a slightly lower number of funded projects than projected, the Enabling Accessibility Fund still achieved 94% of its target
- At the time of the publication of the 2019 to 2020 Departmental Plan, the target was: “To be determined”
- Results for the final year of the bilateral agreements will be available in the Fall 2020 with the submission of provincial and territorial Annual Progress Reports
- Service standards are published on the web
- This indicator’s target was converted to a percentage for fiscal year 2019 to 2020. The target being expressed as a percentage (instead of as a number) is consistent with applicable service standards. As the target (for fiscal year 2019 to 2020) is expressed as a percentage, the actual result (for the aforementioned fiscal year) is also expressed as a percentage
Budgetary financial resources (dollars)
| Spending category | 2019 to 2020 Main Estimates* | 2019 to 2020 Planned spending* | 2019 to 2020 Total authorities available for use | 2019 to 2020 Actual spending (authorities used) | 2019 to 2020 Difference (Actual spending minus Planned spending) |
|---|---|---|---|---|---|
| Gross Spending | 759,435,703 | 759,435,703 | 943,816,344 | 921,816,281 | 162,380,578 |
| Spending in Specified Purpose Accounts | 0 | 0 | 0 | 0 | 0 |
| Revenues netted against expenditures | 0 | 0 | 0 | 0 | 0 |
| Net Spending | 759,435,703 | 759,435,703 | 943,816,344 | 921,816,281 | 162,380,578 |
Variance explanation: The variance can be explained by different new programs and new funds received and consequently actuals spending were more than anticipated.
Notes:
*Amounts do not reflect 2019 Budget Implementation measures included in ESDC's 2019 to 2020 Main Estimates.
“Planned spending” may differ from Main Estimates as they include the amounts to be spent for the Specified Purpose Accounts (such as Employment Insurance and Canada Pension Plan accounts). These amounts include benefits paid to clients and amounts associated with the payment of these benefits.
“Net Spending” excludes amounts spent under Specified purpose accounts.
Refer to the department's financial framework section for a complete description of the departmental financial profile, including explanation of gross actual and planned spending.
Human resources (full-time equivalents)
2019 to 2020 Planned full-time equivalents: 526
2019 to 2020 Actual full-time equivalents: 457
2019 to 2020 Difference (actual full-time equivalents minus planned full-time equivalents): (69)
Variance explanation: The FTE variance captures changes within the program as well as in other areas of social development policy. It includes delays in staffing, leave with income averaging, leave without pay, and unexpected departures.
Financial, human resources and performance information for the Employment and Social Development Canada’s Program Inventory is available in GC InfoBase.
Pensions and benefits
Description
Assist Canadians in maintaining income for retirement, and provide financial benefits to survivors, people with disabilities and their families.
Results
In 2019 to 2020, the department undertook the following initiatives to advance this core responsibility.
The department ensured seniors have income support for retirement
The Old Age Security Act includes what is known as the Guaranteed Income Supplement earnings exemption. It allows recipients who work to exempt a portion of their earnings from the calculation of their benefits. Since July 2020, the enhanced earnings exemption applies to both employment and self‑employment income. It provides a full exemption on up to $5,000 of annual earnings, and a 50% exemption on the next $10,000 of earnings. This means that low-income seniors who work can keep more of their Guaranteed Income Supplement benefits.
The department also introduced legislative amendments to proactively enroll Canada Pension Plan (CPP) eligible seniors who have not applied for their retirement benefit. This amendment was effective in 2020 and applies to CPP contributors aged 70 or older.
The department took measures to better support people with disabilities and their families, through the Canada Disability Savings Program
- expanded outreach activities to increase awareness and take-up of the Registered Disability Savings Plan (RDSP)
- implemented improvements to the RDSP by eliminating the requirement to close it when a beneficiary no longer qualifies for the Disability Tax Credit. Doing so will allow Canada Disability Savings Grants and Canada Disability Savings Bonds to remain in the RDSP. Otherwise, these would have to be repaid to the government
- exempted RDSP from seizure in bankruptcy to better protect the long-term savings of persons with disabilities. This change came into force on November 1, 2019
The department continued to improve the Canada Pension Plan Disability (CPPD) program to better respond to the needs of Canadians with severe and prolonged disabilities
The department implemented the Medical Adjudication Quality Assurance program. This program provides information about the process that medical adjudicators follow to make decisions to grant or deny benefits. The results from this program will allow the department to make recommendations to enhance policy development and improve training.
The department also began implementing a new strategy to address CPPD data quality issues, strengthen evidence-based analysis, and improve program outcomes.
The department expanded external engagement to include non-profit disability organizations and public programs in other jurisdictions. These include provinces, territories and the International Social Security Association. It also consulted on ways to improve the CPPD program through the CPPD Client and Stakeholder Roundtable.
It also initiated a review and analysis of current supports available to CPPD beneficiaries when they attempt to return to work.
The department ensured clients receive high-quality, timely and efficient services that meet their needs
The department continued to modernize the delivery of Canada Pension Plan (CPP) and Old Age Security (OAS). This will ensure that clients receive the benefits to which they are entitled in a timely and accurate manner. This modernization included:
- implementing a new e-Service for OAS pension and Guaranteed Income Supplement (GIS) in November 2019. This online tool combines applications for both the OAS pension and GIS. This makes it easier for some of Canada’s most vulnerable individuals to apply for these benefits
- launching a CPP-Disability (CPP-D) online application to enable clients to apply online through their My Service Canada Account. This online application was developed in consultation with internal and external stakeholders and helps shorten the application process and improves understanding of eligibility. It also gives some of Canada’s most vulnerable individuals the confidence to fill out the application at their own pace
- providing an array of electronic tools and features to help clients get information and submit an application. These proved to be popular as indicated by the following results:
- the ‘‘View My Application Status’’ feature has been used approximately 186,000 times by OAS Clients
- approximately 18,000 clients downloaded the interactive version of the OAS Toolkit and 12,000 clients downloaded the printable version
- approximately 17,000 clients downloaded the interactive version of the CPP Disability Toolkit and 13,000 clients downloaded the printable version
- the CPP online retirement application was used approximately 120,000 times
The department automatically enrolled about 200,000 OAS clients, who did not have to submit an application to receive their benefits.
Gender-based analysis plus
This section highlights some of the key achievements related to GBA+ for this core responsibility. For more information on GBA+ initiatives in the department, see the Gender-Based Analysis Plus Supplementary Information Table.
On average, Canadian women live longer than men, which makes them over-represented in the senior population, particularly in the oldest age groups. Women also have lower lifetime earnings than men on average, and so they are more likely to be lower income. Single senior women account for the majority of low-income seniors in the country.
Income security programs are designed to support low-income seniors and other vulnerable Canadians. Data shows that these programs disproportionately benefitted women.
Old Age Security (OAS) pensions provide income for seniors 65 and older, and are an important financial support especially for those who can no longer work. In 2019 to 2020, 54% of OAS recipients were women, 57% had incomes below $30,000, and 85% had incomes below $50,000.
The Guaranteed Income Supplement (GIS) has provided additional and much needed financial support to some of the most vulnerable low-income seniors. The GIS top-up provides additional income from OAS for single seniors with annual incomes below
$18,600, or couples with a combined income below $24,576. In 2019 to 2020, 60% of GIS recipients were women, and 52% were over the age of 75.
Additionally, the GIS allowance supports spouses, common-law partners, and survivors of GIS recipients who are in low-income situations. In 2019 to 2020, 86% of these allowance beneficiaries were women.
Experimentation
The department completed 3 pilots in the Canada Pension Plan Disability Program. The department is currently analysing data from these pilots to finalize results and develop recommendations.
- The first pilot used predictive analytics to identify files that required more information prior to making a determination. The goal was to obtain this information earlier in the process and reduce the time required to make a decision
- The second pilot involved information sharing from third party disability payers related to CPP-Disability benefits applicants. The purpose was to determine if having complete information earlier in the determination process would reduce the time required to reach a decision
- The third pilot examined ways to reduce the time required to finalize an appeal on a CPP Disability decision
The department used behavioural science to encourage more Canadians to apply to the Canada Pension Plan and to use the online application. As a result, the number of Canadians applying online, instead of using paper forms, doubled.
The department conducted significant remote user research using a third-party user panel. This allowed the department to conduct user research with people across Canada and the globe. It also significantly reduced the time required to recruit and conduct this research. This new approach increases departmental capacity to conduct user research and usability tests. It also diversifies the participant base compared to traditional methods, and heightens the client-centric approach to service design and delivery.
Through its Acceleration Hub, the department continued to promote design thinking and agile methodologies in the development of client solutions. The Hub provides programme design teams a space to experiment and test new program and service design options. It served to drive the design and rapid prototyping of many solutions. These include the Client Centric Playbook, Community Outreach and Liaison Model.
The department’s Innovation Lab co-led a project to better understand the take-up of the Guaranteed Income Supplement among low-income seniors. The goal was to analyze why seniors who qualify for the Guaranteed Income Supplement are not applying to receive it. The department aimed to increase the take-up of the supplement among those seniors who receive the annual take-up letters. These letters are mailed to potentially eligible low-income seniors to encourage them to apply. The project helped the department assess whether these annual letters are useful. It also allowed the identification of factors that prevented or encouraged low-income seniors to apply for the benefit. From the results and key findings of the project, the department identified new approaches to communicate with clients and stakeholders. It also simplified application procedures and strengthened outreach services for vulnerable sectors.
Results achieved
Departmental result: Seniors have income support for retirement
Performance indicator 1 of 4: Percentage of seniors receiving the Old Age Security pension in relation to the estimated total number of eligible seniors
Target: 97%
Date to achieve target: March 2020
2019 to 2020 actual result: 97.2% (2017) See note 1
2018 to 2019 actual result: 97% (2016)
2017 to 2018 actual result: 97% (2015)
Performance indicator 2 of 4: Percentage of seniors receiving the Guaranteed Income Supplement in relation to the estimated total number of eligible seniors
Target: 90%
Date to achieve target: March 2020
2019 to 2020 actual result: 91.1% (2017) See note 1
2018 to 2019 actual result: 91% (2016)
2017 to 2018 actual result: 91% (2015)
Performance indicator 3 of 4: Percentage of Canada Pension Plan contributors aged 70 or more receiving retirement benefits
Target: 99%
Date to achieve target: March 2020
2019 to 2020 actual result: Not available at the time of publishing (2018) See note 2
2018 to 2019 actual result: 99% (2017)
2017 to 2018 actual result: 99% (2016)
Performance indicator 4 of 4: Percentage of seniors living in low income
Target: Not applicable See note 3
Date to achieve target: Not applicable
2019 to 2020 actual result: 3.5% (2018) See note 2
2018 to 2019 actual result: 4.3% (2017)
2017 to 2018 actual result: 4.7% (2016)
Departmental result: People with disabilities and their families have financial support
Performance indicator 1 of 3: Percentage of Canada Pension Plan contributors who have contributory eligibility for Canada Pension Plan disability benefits and therefore have access to financial support in the event of a severe and prolonged disability
Target: 66%
Date to achieve target: March 2020
2019 to 2020 actual result: 65% (2018) See notes 2 and 4
2018 to 2019 actual result: 63% (2017)
2017 to 2018 actual result: 66% (2016)
Performance indicator 2 of 3: Percentage of Canadians eligible for the Disability Tax Credit who have a Registered Disability Savings Plan to encourage private savings
Target: 33%
Date to achieve target: December 2019
2019 to 2020 actual result: 2019 data not available at the time of publishing
2018 to 2019 actual result: 34% (2018)
2017 to 2018 actual result: 31% (2017)
Performance indicator 3 of 3: Percentage of Canadians with disabilities eligible for a Registered Disability Savings Program that have received a grant and/or a bond to assist them and their families to save for their long-term financial security
Target: 84%
Date to achieve target: December 2019
2019 to 2020 actual result: 84%
2018 to 2019 actual result: 83%
2017 to 2018 actual result: 85%
Departmental result: Clients receive high-quality, timely and efficient services that meet their need
Performance indicator: Standard targets for Pensions and Benefits program priority services, as defined by the Government of Canada’s Policy on Service, that are being met
Target: 10
Date to achieve target: March 2020
2019 to 2020 actual result: 5 out of 10 See note 5
2018 to 2019 actual result: 5 out of 10
2017 to 2018 actual result: 3 out of 10
Key measure 1 of 3: Percentage of Canada Pension Plan retirement benefits paid within the first month of entitlement
Target: 90%
Date to achieve target: March 2020
2019 to 2020 actual result: 97%
2018 to 2019 actual result: 96%
2017 to 2018 actual result: 96%
Key measure 2 of 3: Percentage of decisions on applications for a Canada Pension Plan disability benefit within 120 calendar days
Target: 80%
Date to achieve target: March 2020
2019 to 2020 actual result: 54% See note 6
2018 to 2019 actual result: 63%
2017 to 2018 actual result: 77%
Key measure 3 of 3: Percentage of Old Age Security basic benefits paid within the first month of entitlement
Target: 90%
Date to achieve target: March 2020
2019 to 2020 actual result: 91%
2018 to 2019 actual result: 92%
2017 to 2018 actual result: 87%
Notes:
- There is a 3-year lag in the availability of data
- There is a 2-year lag in the availability of data
- The department uses contextual indicators such as this one to monitor overall social trends and inform policy development. Specific outcomes are not actively targeted in the areas measured by these indicators. This contextual indicator is based on the Low Income Cut Off (LICO) after tax. Data is collected by Statistics Canada through the annual Canadian Income Survey
- There is a 2-year lag in the availability of data. This contextual indicator is influenced by the economic situation and employment. The result may be explained by the increase in non-permanent residents in 2018 and the decrease in participation rates among people under 25 years of age
- 2 of the 5 missed targets are related to changes in Pensions call centres. The migration of these call centres to a new telephony platform in May 2019, greatly improved accessibility (to almost 100% post-migration). This allowed more Canadians to wait and speak to a Call Centre Agent. However, an increase in callers waiting to speak to an agent also resulted in an increase in wait times. In fiscal year 2019 to 2020, 96% of clients contacting the Pensions Call Centre were able to speak to an agent. Of those, 48% of callers were able to speak to an agent within 10 minutes. On average, clients waited approximately 12 minutes before speaking to an agent. The other 3 targets were related to the processing of Canada Pension Plan Disability applications
- The target was not met. For initial application decisions, the average time to make a decision was 125 days. Increased inventory resulted in Service Canada having to balance the processing of older applications and the prioritization of files for gravely ill and terminally ill clients. For reference, year-over-year improvements were made in targets for decisions on gravely and terminally ill applications. Applications for a grave medical condition were processed on time 92% of the time compared to 84% last fiscal year. Applications for terminally illness condition were processed in time 92% of the time compared to 91% the previous year
Budgetary financial resources (dollars)
| Spending category | 2019 to 2020 Main Estimates* | 2019 to 2020 Planned spending* | 2019 to 2020 Total authorities available for use | 2019 to 2020 Actual spending (authorities used) | 2019 to 2020 Difference (Actual spending minus Planned spending) |
|---|---|---|---|---|---|
| Gross Spending | 57,353,008,462 | 107,075,411,089 | 106,395,627,770 | 106,337,930,425 | (737,480,663) |
| Spending in Specified Purpose Accounts | 0 | 49,722,402,627 | 48,993,263,077 | 48,993,263,077 | (729,139,550) |
| Revenues netted against expenditures | 183,696,846 | 183,696,846 | 292,251,678 | 260,029,836 | 76,139,990 |
| Net Spending | 57,169,311,616 | 57,169,311,616 | 57,110,113,015 | 57,084,637,513 | (84,674,103) |
Variance explanation: No significant variance
Notes:
*Amounts do not reflect 2019 Budget Implementation measures included in ESDC's 2019 to 2020 Main Estimates.
“Planned spending” may differ from Main Estimates as they include the amounts to be spent for the Specified Purpose Accounts (such as Employment Insurance and Canada Pension Plan accounts). These amounts include benefits paid to clients and amounts associated with the payment of these benefits.
“Net Spending” excludes amounts spent under Specified purpose accounts.
Refer to the department's financial framework section for a complete description of the departmental financial profile, including explanation of gross actual and planned spending.
Human resources (full-time equivalents)
2019 to 2020 Planned full-time equivalents: 3,902
2019 to 2020 Actual full-time equivalents: 5,665
2019 to 2020 Difference (actual full-time equivalents minus planned full-time equivalents): 1,763
Variance explanation: The increase in FTEs reflects additional investments in processing-related activities to ensure that seniors have timely access to the benefits.
Financial, human resources and performance information for the Employment and Social Development Canada’s Program Inventory is available in GC InfoBase.
Learning, skills development and employment
Description
Help Canadians access post-secondary education and get the skills and training they need to participate in a changing labour market, as well as provide support to those who are temporarily unemployed.
Results
The department helped Canadians access education, training and lifelong learning to gain the skills and work experience they need
Supporting post-secondary education students to facilitate labour market transitions
The department expanded the Student Work Placement program so that more students have access to work-integrated learning opportunities. Through new partners, the program now includes students in fields outside of science, technology, engineering and math (STEM), and business. It reaches to students in Arts, Humanities, Fine Arts, Design, Hospitality and Tourism Management, Law, and many other programs.
The department supported the creation of 8,707 student work placements for post-secondary students across Canada, in a wide array of disciplines. This is a significant increase from the previous year’s 2,453 student work placements.
Equipping Canadians with the tools they need to succeed in the changing world of work
The department continued to support provinces and territories in implementing the amended Labour Market Development Agreements (LMDA) and Workforce Development Agreements (WDA). These agreements allow them to help Canadians, including persons with disabilities, get training, develop their skills and gain work experience. The department transferred approximately $2.3 billion in LMDA funding and $872 million in WDA funding to provinces and territories. It also transferred to them an additional $45.5 million in targeted funding through the LMDAs. This additional funding was to assist workers in seasonal industries and workers affected by U.S. tariffs on steel and aluminum products.
The department consulted Canadians on the Canada Training Benefit over the summer of 2019. These consultations are informing program design and implementation.
Through the Future Skills program, the department appointed members of the Future Skills Council. It also established a pan-Canadian, independent Future Skills Research Centre. The Future Skills Council undertook broad engagement across public, private, labour and not-for-profit sectors nationwide. These consultations aimed to inform the development of a report to be released in fiscal year 2020 to 2021. The report will highlight ways to help Canadians develop the skills they need to thrive in a changing labour market. The Future Skills Centre has completed 2 open calls for proposals and funded 46 innovation projects. These projects will test new approaches to skills development for Canadians.
The department led national efforts to improve adult literacy and essential skills for Canadians through a total of 46 projects. These projects supported the testing, replicating and scaling up of effective and innovative training models. Such models address gaps and contribute to making training and service delivery more responsive to worker and employer needs.
Supporting apprenticeship training and access to skilled trades
Under the Union Training and Innovation Program, the department supported union-based apprenticeship training, innovation and enhanced partnerships in the Red Seal trades. The program funded 38 additional equipment cost-sharing projects in fiscal year 2019 to 2020. In total, 128 equipment cost-sharing projects and 19 innovation projects have been approved under the Union Training and Innovation Program.
The Women in Construction Fund, administered by the department, funded organizations that build on proven models to attract women to the trades. The program funded a new project in fiscal year 2019 to 2020 to help engage and enhance women in skilled trades. In total, 4 projects are in progress under the Women in Construction Fund.
The department helped Canadians pursue the skilled trades through the Skilled Trades Awareness and Readiness Program. To date, the program has funded a total of 12 projects, including 2 new projects in fiscal year 2019 to 2020.
The department has also supported apprenticeship learning through the Canada Apprentice Loan. These loans provide additional financial support to apprentices in Red Seal trades during periods of technical training. This helps them complete their apprenticeship. It also encourages more Canadians to consider a career in the skilled trades.
The department issued 3,035 Apprenticeship Incentive Grants for Women for a total amount of $9M.
It also transferred $10M to Skills Canada. This enabled the organization to promote skilled trades and technologies for young people through skills competitions.
The department supported the creation of a national campaign to promote skilled trades as a first-choice career for young people. To date, the Government has announced the campaign co-chairs, and formed an Advisory Committee. This committee is mandated to provide the Minister of Employment, Workforce Development and Disability Inclusion with advice on the requirements of a successful campaign. The committee members provided their advice to the Minister in February 2020. This advice will inform the design and implementation of the strategy.
Supporting students in accessing more education opportunities
The department worked with Universities Canada and Colleges and Institutes Canada to develop a mobility program to help undergraduate university and college students study or work outside of Canada. This program is part of the government’s new International Education Strategy. Once implemented, priority will be given to students who would not otherwise have an opportunity to participate in study or work outside of Canada. These students include students with disabilities, Indigenous students, and students from low-income families. It is expected that these international experiences will better prepare students for the labour market. They will help them gain soft skills, develop intercultural competencies and build international networks. Given concerns about travel and safety abroad during the pandemic, the government has put the program on hold. The program will resume when travel restrictions are lifted and it is safe for students to travel.
The department signed an agreement with Indspire, a non-profit organization, to help support access to post-secondary education for Indigenous students. Funding is mostly directed towards scholarships and bursaries but also supports other activities. These activities include mentorship and annual events for youth and educators. They help promote cultural competency and opportunities for Indigenous students.
The department monitored and assessed the 3-year Skills Boost pilot project. This project is testing new approaches designed to make it easier for adult learners to qualify for financial support. Nearly 65,000 adult learners received the top-up to the Canada Student Grant for Full-Time Students in 2018 to 2019. This exceeded the expected uptake of approximately 43,000 in the first year. As of March 31, 2020, a total of approximately 95,700 students have benefited from this top-up grant. The pilot project is set to expire in July 2021. Insights from monitoring and evaluation will guide future decisions on improving supports for adult learners.
The department ensured Canadians participate in an inclusive and efficient labour market
Improving skills and labour market outcomes for Indigenous people
In April 2019, the department implemented the Indigenous Skills and Employment Training (ISET) program. The department co-developed key policy elements of the program with Indigenous partners. These elements include flexible terms and conditions that take into account distinctions between First Nations, Inuit and Métis. They also include funding allocations, and a new risk assessment model. These new approaches resulted in greater flexibility for Indigenous organizations to respond to client needs.
- In fiscal year 2019 to 2020, the department set up 109 multi-year agreements with Indigenous organizations. These organizations provided skills development and job training programs and services, which helped 41,600 clients across the country. As a result, the program helped 15,284 Indigenous people find employment and 3,753 return to schoolFootnote 2
- The department also provided funding to 52 projects through the Skills and Partnership Fund. These projects support skills development and job training that meet local market demands. In fiscal year 2019 to 2020, Skills and Partnership Fund projects helped 5,324 new Indigenous clients access training. Of these, 1,784 individuals found employment and 285 returned to school
Increasing opportunities for youth
The department launched the Youth Employment and Skills Strategy. The strategy includes youth employment and skills development programming delivered by ESDC and 10 other federal partner departments. It also includes Goal Getters and Canada Summer Jobs. It aims to help all young people, including those who face barriers, to fully participate in an inclusive labour market. It does so through a combination of flexible and tailored supports to gain valuable skills and work experience. This includes, for example, training opportunities, paid work placements and other individual supports, such as mentorship, childcare supports, and access to mental health services. In fiscal year 2019 to 2020, the department served 91,086 youth, as part of the Youth Employment and Skills Strategy.
The department also introduced Goal Getters. This new funding stream aims to reach youth at risk of leaving school at an earlier age (under 15). The goal is to help them complete high school and transition to post-secondary education. In its first year, the department partnered with youth-serving organizations to support more than 2,500 youth.
The department expanded the Canada Summer Job program’s eligibility criteria to include all youth, not just students. The new criteria improved access to employment opportunities for youth who face unique barriers to employment. In total, the program supported the creation of up to 79,279 summer job placements for youth.
Through the Canada Service Corps, the department supported 6,675 youth service placements and funded 1,624 youth-led micro-contribution projects.
Increasing employment opportunities for persons with disabilities
The department supported 4,242 persons with disabilities through employment and training activities delivered under the Opportunities Fund for Persons with Disabilities.
It also supported employers, particularly small and medium enterprises, through 92 projects. This included activities such as job matching and assistance to develop inclusive recruitment and retention strategies for persons with disabilities.
The Opportunities Fund started providing $12 million over 3 years to the Canadian Association for Community Living, in partnership with the Canadian Autism Spectrum Disorders Alliance. This funding is for the Ready, Willing and Able program to improve the employment outcomes for persons with intellectual disabilities and Autism Spectrum Disorders.
The department continued to support an efficient labour market through
Enhancing the service provided to employers under the Temporary Foreign Worker Program:
- it increased its processing capacity for Labour Market Impact Assessment applications and piloted an online platform for this application process
- in December 2019, it initiated a 3-year pilot to reduce processing times and costs for employers. This pilot increases the maximum duration of a Labour Market Impact Assessment to 2 years. This only applies for positions under the low-wage stream of the program
- in July 2019, the Global Talent Stream was established as a permanent stream of the Temporary Foreign Worker Program. This will allow the department to continue helping innovative Canadian firms quickly access highly skilled talent
- continuing to pilot the Migrant Worker Support Network in British Columbia to provide better supports for migrant workers. The network also educates workers and employers on their obligations and rights
Introducing the following improvements to Job Bank:
- a new tool to allow job seekers to locate in-person employment support in their province or territory
- a document uploading tool for employers to submit requested documentation directly through Job Bank
- the establishment of 2 new partnerships and the renewal of 2 previous partnerships with private job boards. This increased the number of jobs displayed on the website at any point in time by 2,000
- the display of all Canada Summer Jobs opportunities, as of Spring 2019
Through the Sectoral Initiatives Program, the department developed tools for jobseekers, educators and employers. One of these tools is a cybersecurity national occupational standard that includes occupational descriptions, skills requirements, and education levels. This enables employers to locate potential employees with in-demand skills, and assist educators, learners, and job seekers to develop these skills.
The department also promoted Inuit participation in the Nunavut labour market, by:
- conducting the annual Nunavut Inuit Labour Force Analysis
- participating in the Nunavut Sivuniksavut Academic Career Development program pilot, which is designed to prepare Inuit students for public administration jobs in Nunavut
The department ensured Canadians received financial support during employment transitions such as job loss, illness or maternity/parental leave
The department continued to enhance the Employment Insurance (EI) program to keep it aligned with the changing labour market. This included:
- monitoring the implementation and preliminary results for the EI Seasonal Worker pilot project, which was introduced in August 2018. This project provides eligible seasonal workers in 13 targeted EI economic regions up to 5 additional weeks of EI regular benefits. Preliminary data for fiscal year 2019 to 2020 includes the number of beneficiaries, EI entitlement, and EI benefit exhaustion rates. It will be available in the EI Monitoring and Assessment Report to be published in 2021
- beginning to monitor results of the EI Parental Sharing Benefit, implemented in March 2019. This monitoring includes the take-up of EI parental benefits by gender. Preliminary data for fiscal year 2019 to 2020 will be available in the EI Monitoring and Assessment Report to be published in 2021. The parental sharing benefit is expected to promote gender equality. It encourages fathers to share the joy and responsibilities of caring for a newborn or newly adopted child. The parental sharing benefit is expected to result in an increase in the take-up of EI parental benefits by men
The department helped more students from low and middle-income families access and participate in post-secondary education
Promoting the use of Registered Education Savings Plans (RESP) and increasing the take-up of the Canada Learning Bond (CLB) and the Canada Education Savings Grant (CESG)
The department implemented amendments to the Canada Education Savings Act. These allow the cohabitating spouse or common law partner of the child’s primary caregiver to apply for the CLB and the additional amount of the CESG. As a result, more than 115,000 beneficiaries have received a total of $59M in CLB and additional CESG.
The department funded community-based organizations to launch 12 projects to increase awareness and take-up of the CLB. By 2021, the department will have provided $5M in funding to these projects, which explore new and innovative approaches to reach potential beneficiaries.
The department developed a multi-year outreach strategy to guide efforts to increase the take-up of the CLB and the CESG. The strategy will raise awareness in communities across Canada through events, social media, and personalized letters to eligible families.
It also continued to work with the Ontario government on the online Education Savings Referral Service. This initiative aims to connect newborn parents with partnered financial institutions to open a Registered Education Savings Plan (RESP). The Education Savings Referral Service provides a seamless, modern service delivery to open an RESP and request the education savings incentives. This made it easier for many parents to start saving early for a child’s post-secondary education. The department is now exploring similar initiatives with other jurisdictions.
Working with Statistics Canada, the department contributed to the development of the 2020 Survey of Approaches to Educational Planning. This survey took place from February to June 2020. The department will review the survey’s findings to better understand the challenges vulnerable populations experience in accessing the CLB.
Facilitating access to financial support
The department lowered interest rates on Canada Student Loans and Canada Apprentice Loans. It also eliminated the interest on loans for the first 6 months after leaving school.
It introduced a new option to help borrowers with Canada Student Loans and Canada Apprentice Loans return their loans in default to good standing. These borrowers can now add unpaid interest to the principal balance of their loans. This one-time per borrower lifetime option removes a significant financial barrier associated with loan repayment. It is expected to make repayment more affordable for borrowers in default. Approximately 40% of the loans in default that were returned to good standing between January 1 and March 31, 2020 used this option.
The department made it easier for students with permanent disabilities to access further funding to return to school, by:
- increasing the cap on the Canada Student Grant for Services and Equipment for Students with Permanent Disabilities up to $20,000
- expanding eligibility for the Severe Permanent Disability Benefit to help more student borrowers with severe permanent disabilities qualify for loan forgiveness
- planning and preparing to implement the interest-free and payment-free leave for a maximum of 18 months
This last measure will apply to borrowers taking temporary leave from their studies for medical or parental reasons, including mental health leave.
To ensure clients receive high-quality, timely and efficient services that meet their needs, the department
- made additional mobile-friendly self-service features available to help student loan borrowers manage their student loans online. This includes allowing clients to view the status of their funding, and update their banking and profile information. Clients can also complete their loan agreement online, including those for part-time studies. Clients can also make one-time payments, receive repayment details in their secure inbox and customize their payment amounts for full-time loans
- continued to improve tailored, proactive communications to help clients through critical transition periods. The department introduced a “Virtual Repayment Counsellor” and implemented financial literacy tools and tips. These tools raise awareness about important subjects, such as credit and debt, savings, and banking. These measures helped clients make informed decisions about their loans and their repayment
- launched an online pilot for submission of Labour Market Impact Assessments. This allows Temporary Foreign Worker Program employers and third party organizations to submit their applications through a secured online system. It also provides them with a modern and simple application process where they can get updates on their application and easily manage their activities throughout the full application process. The department is working closely with users to ensure the pilot meets their needs and to identify more improvements
Gender-based analysis plus
This section highlights some of the key achievements related to GBA+ for this core responsibility. For more information on GBA+ initiatives in the department, see the Gender-Based Analysis Plus Supplementary Information Table.
The department launched a GBA+ Community of Practice with a specific focus on skills programming. This community supports GBA+ knowledge sharing and capacity building activities towards the goal of a more targeted GBA+ analysis for skills programming. An environmental scan of existing skills programming GBA+ administrative data and other data helped to identify gaps and challenges. This will inform the development of concrete initiatives to deal with these gaps and challenges going forward.
The Canada Student Loans Program used GBA+ to inform proposed changes designed to enhance responsiveness, effectiveness and outcomes of key initiatives. While the department used existing data tools and processes in place to assess the key impacts on gender and diversity, the direct impacts and results for measures implemented during the 2019 to 2020 fiscal year are not yet available. However, the results of the initial GBA+ are as follows:
- lowering interest rates on Canada Student Loans and Canada Apprentice Loans and eliminating interest for 6 months after graduating should predominantly benefit women. This is especially true in the population of students with dependants
- increasing supports for students with disabilities and expanding eligibility for the Severe Permanent Disability Benefit should predominantly benefit younger women with a permanent disability. These supports include more opportunities for students with permanent disabilities to access further funding to return to school. The expanded eligibility for the Severe Permanent Disability Benefit will help more student borrowers with severe permanent disabilities qualify for loan forgiveness
- providing interest-free and payment-free leave for a maximum of 18 months for medical or parental reasons should predominantly benefit women
Experimentation
The department’s Innovation Lab developed a workshop series centred on understanding human experiences. The series created opportunities to re-imagine learning for youth who are under-represented in certain educational groups. The series also tested different policy options and recommendations to support program development. It also identified opportunities to expand current youth education programming.
Results achieved
Departmental result: Canadians access education, training and life-long learning supports to gain the skills and work experience they need
Performance indicator 1 of 4: Number of Canadians receiving training and/or employment supports
Target:
- Federally delivered programs: 132,460 See note 1
- Provincially and territorially (PT) delivered programs set their own annual targets
Date to achieve target: March 2020
2019 to 2020 actual result:
- Federally delivered programs: 157,591 See note 2
- Provincially and territorially delivered programs: Not available See note 3
2018 to 2019 actual result:
- Federally delivered programs: 148,228
- Provincially and territorially delivered programs: 670,431
2017 to 2018 actual result:
- Federally delivered programs: 140,771
- Provincially and territorially delivered programs: 695,911
Performance indicator 2 of 4: Employment or returns to school following training/supports
Target:
- Federally delivered programs: 95,774 See note 1
- Provincially and territorially (PT) delivered programs set their own annual targets
Date to achieve target: March 2020
2019 to 2020 actual result:
- Federally delivered programs: 106,980 See note 4
- Provincially and territorially delivered programs: Not available See note 5
2018 to 2019 actual result:
- Federally delivered programs: 115,155
- Provincially and territorially delivered programs: 190,717
2017 to 2018 actual result:
- Federally delivered programs: 110,536
- Provincially and territorially delivered programs: 177,335
Performance indicator 3 of 4: Percentage of Canadians aged 18 to 24 that are enrolled in university or college
Target: Not applicable See note 6
Date to achieve target: Not applicable
2019 to 2020 actual result: 43.9% (2019)
2018 to 2019 actual result: 43.8% (2018)
2017 to 2018 actual result: 43.5% (2017)
Performance indicator 4 of 4: Percentage change in Canadians aged 25 to 64 enrolled in university or college
Target: Not applicable See note 7
Date to achieve target: Not applicable
2019 to 2020 actual result: 5% increase (2019)
2018 to 2019 actual result: 3.2% increase (2018)
2017 to 2018 actual result: 1.2% decrease (2017)
Departmental result: Canadians participate in an inclusive and efficient labour market See note 8
Performance indicator 1 of 10: Employment rate for Canadians
Target: Not applicable
Date to achieve target: Not applicable
2019 to 2020 actual result: 74.1%
2018 to 2019 actual result: 73.9%
2017 to 2018 actual result: 73.4%
Performance indicator 2 of 10: Employment rate for Indigenous people off reserve
Target: Not applicable
Date to achieve target: Not applicable
2019 to 2020 actual result: 63.4%
2018 to 2019 actual result: 62.7%
2017 to 2018 actual result: 62.8%
Performance indicator 3 of 10: Employment rate for Indigenous people on reserve See note 9
Target: Not applicable
Date to achieve target: Not applicable
2019 to 2020 actual result: Not available
2018 to 2019 actual result: Not available
2017 to 2018 actual result: Not available
Performance indicator 4 of 10: Employment rate for recent immigrants See note 10
Target: Not applicable
Date to achieve target: Not applicable
2019 to 2020 actual result: 70.9%
2018 to 2019 actual result: 70.6%
2017 to 2018 actual result: 68.0%
Performance indicator 5 of 10: Employment rate for persons with disabilities See note 11
Target: Not applicable
Date to achieve target: Not applicable
2019 to 2020 actual result: Not available
2018 to 2019 actual result: Not available
2017 to 2018 actual result: 59.3% (2017)
Performance indicator 6 of 10: Employment rate for youth See note 12
Target: Not applicable
Date to achieve target: Not applicable
2019 to 2020 actual result: 56.9%
2018 to 2019 actual result: 56.4%
2017 to 2018 actual result: 56.7%
Performance indicator 7 of 10: Employment rate for women
Target: Not applicable
Date to achieve target: Not applicable
2019 to 2020 actual result: 72.2%
2018 to 2019 actual result: 71.1%
2017 to 2018 actual result: 70.7%
Performance indicator 8 of 10: Employment rate for older Canadians See note 13
Target: Not applicable
Date to achieve target: Not applicable
2019 to 2020 actual result: 36.0%
2018 to 2019 actual result: 35.8%
2017 to 2018 actual result: 35.9%
Performance indicator 9 of 10: Employment rate for lone parents See note 10
Target: Not applicable
Date to achieve target: Not applicable
2019 to 2020 actual result: 75.3% (2019)
2018 to 2019 actual result: 73.3% (2018)
2017 to 2018 actual result: 72.9% (2017)
Performance indicator 10 of 10: Unemployment-to-job vacancies (ratio) See note 14
Target: Not applicable
Date to achieve target: Not applicable
2019 to 2020 actual result: 1.98
2018 to 2019 actual result: 2.08
2017 to 2018 actual result: 2.50
Departmental result: Canadians receive financial support during employment transitions such as job loss, illness or maternity/parental leave
Performance indicator 1 of 2: Percentage of workers losing their job in the previous year that were eligible for Employment Insurance
Target: 83.7%
Date to achieve target: March 2020
2019 to 2020 actual result: Not available (2019) See note 17
2018 to 2019 actual result: 87.4% (2018)
2017 to 2018 actual result: 84.3% (2017)
Performance indicator 2 of 2: Percentage of Employment Insurance claimants finding employment before the end of their benefit entitlement
Target: 73%
Date to achieve target: March 2020
2019 to 2020 actual result: Not available (2019) See note 18)
2018 to 2019 actual result: 65.1% (2018)
2017 to 2018 actual result: 66.3% (2017)
Departmental result: More students from low- and middle-income families access and participate in post-secondary education
Performance indicator 1 of 3: Proportion of low- and middle-income Canadian young adults participating in post-secondary education See note 19
Target: 53%
Date to achieve target: December 2019 See note 20
2019 to 2020 actual result: 52% (2016) See note 21
2018 to 2019 actual result: 52.1% (2015) See note 21
2017 to 2018 actual result: 52% (2014)
Performance indicator 2 of 3: Percentage of beneficiaries with a Registered Education Savings Plan (RESP) withdrawal that have ever received an additional amount of Canada Education Savings Grant (CESG) and/or Canada Learning Bond (CLB), which are available only to children from low- and middle-income families, as compared to the total population of beneficiaries with an RESP withdrawal
Target: Not applicable See note 22
Date to achieve target: Not applicable
2019 to 2020 actual result: 27% (2019)
2018 to 2019 actual result: 25% (2018)
2017 to 2018 actual result: 23% (2017)
Performance indicator 3 of 3: Percentage of full-time students (all ages) who used federal student financial assistance to help finance their participation in Post-Secondary Education
Target: Not applicable See note 23
Date to achieve target: Not applicable
2019 to 2020 actual result: 59% (all ages)
2018 to 2019 actual result: 60% - Previously 55% (ages 15 to 29)
2017 to 2018 actual result: 57% - Previously 53% (ages 15 to 29)
Departmental result: Clients receive high-quality, timely and efficient services that meet their needs See note 24
Performance indicator 1 of 4: Number of service standard targets for Learning, Skills Development and Employment program priority services, as defined by the Government of Canada’s Policy on Service, that are being met
Target: 23 out of 23
Date to achieve target: March 2020
2019 to 2020 actual result: 13 out of 23
2018 to 2019 actual result: 16 out of 23
2017 to 2018 actual result: Not available
Performance indicator 2 of 4: Percentage of Employment Insurance benefit payments or non-benefit notifications issued within 28 days of filing
Target: 80%
Date to achieve target: March 2020
2019 to 2020 actual result: 80%
2018 to 2019 actual result: 80%
2017 to 2018 actual result: 82%
Performance indicator 3 of 4: Percentage of Employment Insurance requests for reconsideration reviewed within 30 days of filing
Target: 70%
Date to achieve target: March 2020
2019 to 2020 actual result: 76%
2018 to 2019 actual result: 71%
2017 to 2018 actual result: 67%
Performance indicator 4 of 4: Percentage of Social Insurance Numbers applied for through the Newborn Registration Service issued within 10 business days
Target: 95%
Date to achieve target: March 2020
2019 to 2020 actual result: 100%
2018 to 2019 actual result: 100%
2017 to 2018 actual result: 100%
Notes:
- The 2019 to 2020 fiscal year baseline target has not been established for the modernized Youth Employment and Skills Strategy Program (YESSP)
- The results include participants under the following federally delivered programs: Indigenous Skills and Employment Training (ISET), Skills and Partnership Fund (SPF), Opportunities Fund for Persons with Disabilities (OFPWD), Student Work Placement program (SWP), Youth Employment and Skills Strategy Program (YESSP) - which excludes Goal Getters (GG) and Canada Summer Jobs (CSJ), Youth Employment and Skills Strategy – GG, and Youth Employment and Skills Strategy – CSJ. YESS - GG is a new funding stream introduced in fiscal year 2019 to 2020
- These P/T delivered program results are for LMDAs only and do not include WDAs. LMDA results for fiscal year 2019 to 2020 will be available in spring 2021 with the release of the fiscal year 2019 to 2020 Employment Insurance Monitoring Assessment Report. Results for WDAs, which consolidated CFJA, LMAPD and TIOW are not available. Under the WDAs, provinces and territories are working towards fully implementing the new performance measurement strategy by fiscal year 2020 to 2021. Until that time, provinces and territories provide information on clients served under these agreements in reports provided to Employment and Social Development Canada in the fall of the subsequent fiscal year. The report on information for fiscal year 2019 to 2020 should be available in fall and winter 2020
- The results include the number of participants returning to work or to school under the following federally delivered programs: ISET, SPF, OFPWD, YESSP, and YESS – CSJ
- The P/T delivered program results are for the LMDAs but do not include WDAs. The results include returns to work only. LMDA results for fiscal year 2019 to 2020 will be available in spring 2021 with the release of the 2019 to 2020 Employment Insurance Monitoring and Assessment Report. Results for the WDAs, which consolidated CJFA, LMAPD and TIOW, are not available. Under the WDAs, provinces and territories are working towards fully implementing the new performance measurement strategy by fiscal year 2020 to 2021. Until that time, provinces and territories provide information on clients served under these agreements in reports provided to Employment and Social Development Canada in the fall of the subsequent fiscal year. The report on information for fiscal year 2019 to 2020 should be available in fall and winter 2020
- This contextual indicator is meant to measure aspects of demand for post-secondary education. It is based on internal calculations using Statistics Canada's Labour Force Survey (LFS). The LFS data, collected by Statistics Canada on a monthly basis, are annualized internally in order to provide annual results that meet the department's annual reporting cycle
- This contextual indicator is meant to capture interest in life-long learning. It is based on internal calculations using Statistics Canada's Labour Force Survey (LFS). The LFS data, collected by Statistics Canada on a monthly basis, are annualized internally in order to provide results that meet the department's annual reporting cycle
- These contextual indicators are employment rates for particular groups, representing the number of persons employed expressed as a percentage of the population unless otherwise noted. These rates are based on internal calculations using Statistics Canada's Labour Force Survey, and reflect annual averages of monthly observations corresponding to the department's fiscal years, unless noted otherwise. The conceptual policy targets to these contextual indicators were set in the 2019 to 2020 Departmental Plan using ages 15 to 64, unless noted otherwise
- The most recent data available at the time of publication was extracted from the 2016 Census. This survey is administered every 5 years; as a result, information is not available every year. The next result will be available following the release of Census 2021
- Among those 15 years of age and over
- Employment rate for persons with disabilities for ages 25 to 64 was calculated using the 2017 Canadian Survey on Disability. This survey is administered every 5 years; as a result, information is not available each year
- Among those 15 to 24 years of age
- Among those 55 years of age and over
- Based on internal ESDC calculations using the Labour Force Survey (Statistics Canada) unemployment levels for workers aged 15 to 64 and the job vacancy levels from Job Vacancy and Wage Survey (Statistics Canada)
- Data will be available in December 2020
- Data will be available in April 2021
- There is a 3-year lag in data availability. Data for this indicator is derived from annual income tax data. This can contribute to a reporting delay of up to an additional year. As such, the actual result for fiscal year 2019 to 2020 uses 2016 data. Furthermore, the actual result for fiscal year 2018 to 2019 uses 2015 data, and the actual result for fiscal year 2017 to 2018 uses 2014 data
- Actual results for 2019 will be available for reporting in December 2022
- The actual result was 1 percentage point lower than the target and is therefore considered within an acceptable range despite being below the target. Actual results for 2016 and subsequent years will be calculated using Statistics Canada’s Longitudinal Administrative Databank (LAD)
- This contextual indicator is based on internal calculations using ESDC’s administrative database. The data is extracted on a yearly basis and is calculated based on calendar year transactions
- This contextual indicator measures aspects of the demand for federal student financial assistance. It is based on internal calculations from the Canada Student Loans Program’s administrative database and the Report on the Canada Student Loans Program by the Office of the Chief Actuary. Prior to this report, the indicator was “Percentage of full-time students (age 15 to 29) who used federal student financial assistance to help finance their participation in post-secondary education.”
- ESDC/Service Canada uses its resources to provide the best services possible, and meet its services standards, with particular priority given to starting payment of benefits to clients as quickly as possible. Service standards are published on the web
Budgetary financial resources (dollars)
| Spending category | 2019 to 2020 Main Estimates* | 2019 to 2020 Planned spending * | 2019 to 2020 Total authorities available for use | 2019 to 2020 Actual spending (authorities used) | 2019 to 2020 Difference (Actual spending minus Planned spending) |
|---|---|---|---|---|---|
| Gross Spending | 6,629,816,970 | 27,402,184,747 | 33,874,524,018 | 33,778,359,238 | 6,376,174,491 |
| Spending in Specified Purpose Accounts | 0 | 20,772,367,777 | 21,767,753,884 | 21,767,753,884 | 995,386,107 |
| Revenues netted against expenditures | 805,565,446 | 805,565,446 | 1,006,117,284 | 962,248,816 | 156,683,370 |
| Net Spending | 5,824,251,524 | 5,824,251,524 | 11,100,652,850 | 11,048,356,538 | 5,224,105,014 |
Variance explanation: The variance between gross planned and actual spending is mainly due to the Canada Emergency Response Benefits for an amount of $6,517 million in the 2019 to 2020, which is partially offset by a decrease of $706 million in regular benefits payments and a decrease of $229 million in parental benefit payments.
Notes:
*Amounts do not reflect 2019 Budget Implementation measures included in ESDC's 2019 to 2020 Main Estimates.
“Planned spending” may differ from Main Estimates as they include the amounts to be spent for the Specified Purpose Accounts (such as Employment Insurance and Canada Pension Plan accounts). These amounts include benefits paid to clients and amounts associated with the payment of these benefits.
“Net Spending” excludes amounts spent under Specified purpose accounts.
Refer to the department's financial framework section for a complete description of the departmental financial profile, including explanation of gross actual and planned spending.
Human resources (full-time equivalents)
2019 to 2020 Planned full-time equivalents: 9,066
2019 to 2020 Actual full-time equivalents: 10,954
2019 to 2020 Difference (actual full-time equivalents minus planned full-time equivalents): 1,888
Variance explanation: The increase in full-time equivalents mainly reflects additional staff hired to process Employment Insurance claims as well as to improve call centre accessibility.
Financial, human resources and performance information for the Employment and Social Development Canada’s Program Inventory is available in GC InfoBase.
Working conditions and workplace relations
Description
Promotes safe, healthy, fair and inclusive work conditions and cooperative workplace relations.
Results
The department undertook several initiatives to ensure workplaces are safe and healthy
The department introduced new regulations to help employers prevent incidents of harassment and violence. These regulations will help employers to respond effectively to these incidents when they occur, and support affected employees.
The department also established the Workplace Harassment and Violence Prevention Fund. The fund will support the culture change needed to reduce workplace harassment and violence. It will provide financial support to federally regulated industries and workplaces (see the list of regulated industries and workplaces) to develop tools and resources. The department held a forum for partners to present their projects on harassment and violence prevention. This allowed parties to learn about initiatives across different sectors.
The department introduced new measures under the Canada Labour Code to enhance compliance with labour standards, especially from repeat offenders.
Part XII of the Canada Occupational Health and Safety Regulations was amended. These amendments provide measures to enhance the use of safety materials, equipment, devices and clothing.
The department has made progress in the regulatory process aiming to establish an Administrative Monetary Penalties regime. This regime will provide penalties under Parts II and III of the code. The objective is to ensure that employees in federally regulated industries suffer fewer accidents and injuries at work. The final regulations are expected to be published in the Canada Gazette, Part II in the 2020 to 2021 fiscal year.
The department ensured working conditions were fair and inclusive
The department amended the Wage Earner Protection Program Act. These amendments improved eligibility for the Wage Earner Protection Program. They also increased the maximum payment from 4 to 7 weeks of insurable earnings under the Employment Insurance Act. In addition, they transferred adjudicative functions to the Canada Industrial Relations Board.
The department supported the implementation of amendments to the Canada Labour Code. These amendments introduced new measures to enhance compliance to labour standards, which contributed to:
- improving employee eligibility for entitlements (for example medical leave, maternity and parental leave)
- enhancing the leave of absence for members of the Canadian Reserve Force
- improving work-life balance
The department undertook consultations on regulations to support the implementation of recent legislative amendments. These amendments will ensure:
- employees in precarious work are paid and treated fairly and have access to labour standards
- employees receive sufficient notice and compensation when their jobs are terminated
Part III of the Parliamentary Employment and Staff Relations Act deals with occupational health and safety in parliamentary workplaces. As per Bill C-65, the department amended it to incorporate the provisions of Part II of the Canada Labour Code.
The department developed regulatory amendments that give employees in federally regulated workplaces the right to request flexible work arrangements. They also give them access to new types of paid leave. In addition, the amendments improve access and eligibility to existing types of both paid and unpaid leave.
The department amended the Employment Equity Act to introduce new pay transparency measures. These measures will show and address wage gaps for designated group workers. They will also provide Canadians with more information on the pay practices of employers in the federally regulated sector.
The department drafted regulations that will limit unpaid internships to only those associated with an educational program. The regulations will also extend certain labour standards to student interns.
In May 2019, the department organized and hosted a 2-day Symposium on Women and the Workplace. The symposium aimed to encourage and provide tools for Canadian employers to address issues faced by women in the workplace. It brought together speakers and participants from across the private sector. These people gave information and shared learning experiences on improving and promoting diversity in the workplace. In particular, tools were provided to employers to reduce wage gaps and harassment.
In June 2019, the government published a report summarizing the findings of public consultations on a modern fair wages policy. Employment and Social Development Canada held these consultations in collaboration with the department of Public Services and Procurement and Treasury Board Secretariat. They consulted stakeholders about how a modern fair wages policy could help to ensure that workers on contracts with government are paid fairly.
On October 16, 2019, the government appointed a new full-time member of the Canadian Human Rights Commission. This member will assume the role of Pay Equity Commissioner effective the day the legislation comes into force. The department has begun to support this new member by assisting with the drafting of a legislative guide. This guide will help workplace parties understand the act. The department will also draft other education materials.
The department addressed issues of national importance through cooperation with provincial and territorial governments and with partner countries
The department assisted partner countries in improving respect for international labour standards. It did this through multilateral initiatives and the negotiation and implementation of labour provisions of free trade agreements.
The department drafted labour provisions for an agreement on improvements to the Canada-United States-Mexico Agreement. It also drafted a new labour chapter for the modernized Canada-Israel Free Trade Agreement, which came into force on
September 1st, 2019.
The department actively participated in the negotiations and development of the International Labour Organization’s Centenary Declaration for the Future of Work. It also collaborated with the organization on various measures regarding forced labour, labour inspection, and violence and harassment. This led to the adoption of various official statements by the organization.
Following consultations with Vietnamese stakeholders, the department and the International Labour Organisation (ILO) entered into a funding arrangement. The goal is to fund a project that aims at building effective industrial relations practices in Vietnam. This initiative is in line with ILO’s Declaration on Fundamental Principles and Rights at Work. It also aligns with the requirements of the labour chapter of the Comprehensive and Progressive Agreement for Trans-Pacific Partnerships.
The department supported the release of a report from an expert panel on 5 key issues related to modern federal labour standards. The 5 issues were:
- the federal minimum wage
- labour standards protections for non-standard workers
- disconnecting from e-communications outside of work hours (“the right to disconnect”)
- access to and portability of benefits
- collective voice for non-unionized workers
The report contained 39 recommendations covering all 5 issues. It also raised 3 cross-cutting issues the panel wished to highlight: enforcement and compliance; data; and monitoring and review.
The department introduced initiatives to support cooperative workplace relations
Through the Federal Mediation and Conciliation Service, the department offered dispute prevention and relationship development services to its clients. These services included grievance mediation, joint training, and facilitation of workplace issues and other joint labour-management initiatives. The department made a total of 109 interventions in fiscal year 2019 to 2020.
In order to facilitate discussions and support negotiations between parties, it also appointed 55 mediators and 128 conciliators through the year.
A preliminary consultation was also completed on a proposal to extend equal remuneration provisions in the Canada Labour Code to more workers at Canadian airports.
The department ensured that clients received high quality, timely and efficient services
The department consistently met its service standards and provided Canadians and employers with timely and reliable services throughout the year.
The department continued to implement its Integrated Labour System. This system will modernize departmental services and responses to client expectations, by consolidating functions currently supported by individual applications. This will increase efficiency, enable online services as well as help department employees effectively manage client relationships.
Gender-based analysis plus
his section highlights some of the key achievements related to GBA+ for this core responsibility. For more information on GBA+ initiatives in the department, see the Gender-Based Analysis Plus Supplementary Information Table.
The department annually tables the Employment Equity Act Annual Reporting Parliament. The 2019 report included an analysis of employment and salary data of employees based on the 4 designated groups. These groups are women, Indigenous peoples, persons with disabilities and members of visible minorities. The analysis resulted in the ongoing work to implement pay transparency measures through proposed amendments to the Employment Equity Regulations. Once implemented, this will require employers to report wage gaps and show if there are differences for the 4 designated groups. This will contribute to better informing Canadians on any demographic inequalities in the pay practices of employers.
Experimentation
The department conducted 2 experiments to improve efficiency and deliver better results. The first tested if a streamlined letter and process would improve the response rate for the annual Survey of Labour Organizations of Canada. The department ran a randomized control trial in the spring of 2019 to test new survey designs. These designs (online and by mail) were based on behavioural economics principles. All options tested resulted in similar response rates and were not significantly different from the reference. Based on feedback from some participants, the department is considering designing further experiments. These complementary experiments would involve behavioural sciences and would explore other improvements to future online surveys.
The second experiment ran from 2017 to 2020. It tested the use of a statistical model to set occupational health and safety proactive inspections in high-risk workplaces. The model measured how effective these inspections were in preventing workplace injuries. The study found a small impact on injury reduction directly associated with these proactive inspections. The department also noticed an increase in complaints and requests from the workplaces’ health and safety committee following proactive inspections. These types of requests and complaints have been found, in an independent study, to significantly reduce injuries. Given the success of the project, the department is considering options to build on what was learned from this first stage. These lessons will be taken into consideration when designing future experiments in cooperation with stakeholders across the department.
Results achieved
Departmental result: Workplaces are safe and healthy
Performance indicator: Number of health and safety violations identified under the Canada Labour Code (Part II) per 1,000 federally regulated employees
Target: 9 or less See note 1
Date to achieve target: March 2021
2019 to 2020 actual result: 12.6
2018 to 2019 actual result: 11.1
2017 to 2018 actual result: 9.6
Departmental result: Work conditions are fair and inclusive
Performance indicator 1 of 3: Percentage of Legislated Employment Equity Program employers whose representation equals or surpasses Canadian labour market availability for 2 or more designated groups or who demonstrated progress towards representation since the previous reporting period
Target: 65%
Date to achieve target: September 1, 2019
2019 to 2020 actual result: 73%
2018 to 2019 actual result: 68%
2017 to 2018 actual result: 63%
Performance indicator 2 of 3: 3 year average number of founded violations identified under Part III of the Canada Labour Code per 1,000 federally regulated employees
Target: 4 or less See note 1
Date to achieve target: March 2020
2019 to 2020 actual result: 2.9 (2017 to 2020)
2018 to 2019 actual result: 2.9 (2016 to 2019)
2017 to 2018 actual result: 2.6 (2015 to 2018)
Performance indicator 3 of 3: Percentage of activities or instruments undertaken to strengthen respect for international labour standards that met expected outcomes
Target: 95%
Date to achieve target: March 2020
2019 to 2020 actual result: 100%
2018 to 2019 actual result: 100%
2017 to 2018 actual result: 95%
Departmental result: Labour relations are cooperative
Performance indicator: Percentage of labour disputes settled under the Canada Labour Code (Part 1) without work stoppages, where parties were assisted by Labour Program officers
Target: 95%
Date to achieve target: March 2020
2019 to 2020 actual result: 93% See note 2
2018 to 2019 actual result: 97%
2017 to 2018 actual result: 94%
Departmental result: Clients receive high quality, timely and efficient services that meet their needs See note 3
Performance indicator: Number of service standard targets for Working Conditions and Workplace Relations program priority services, as defined by the Government of Canada’s Policy on Service, that are being met
Target: 4 out of 4 See note 4
Date to achieve target: March 2020
2019 to 2020 actual result: 4 out of 4
2018 to 2019 actual result: 2 out of 4
2017 to 2018 actual result: Not available
Key measure 1 of 4: Percentage of occupational health and safety cases each fiscal year that are finalized within 120 days (excluding prosecutions, appeals, and technical surveys)
Target: 70%
Date to achieve target: March 2021
2019 to 2020 actual result: 83%
2018 to 2019 actual result: 79%
2017 to 2018 actual result: 80%
Key measure 2 of 4: Percentage of unjust dismissal complaints that are finalized within 180 days
Target: 75%
Date to achieve target: March 2020
2019 to 2020 actual result: 80%
2018 to 2019 actual result: 73%
2017 to 2018 actual result: 70%
Key measure 3 of 4: Percentage of conciliators assigned under the Canada Labour Code within 15 calendar days of receiving requests that are compliant with Canada Industrial Relations Regulations
Target: 100%
Date to achieve target: March 2020
2019 to 2020 actual result: 100%
2018 to 2019 actual result: 100%
2017 to 2018 actual result: 100%
Key measure 4 of 4: Percentage of initial Wage Earner Protection Program payments and non-payment notifications issued within 35 calendar days
Target: 80%
Date to achieve target: March 2020
2019 to 2020 actual result: 98%
2018 to 2019 actual result: 73%
2017 to 2018 actual result: 97%
Notes:
- As a result of changes to legislation, particularly due to compliance and enforcement measures, this indicator will fluctuate. It will most likely increase over the short term. This is because as the department improves its service delivery, it is able to reach a larger number of employers
- In 2019 to 2020, the actual result was slightly under the target of 95%. The Federal Mediation and Conciliation Service actively assists the parties in their negotiations by providing conciliation and mediation assistance. However, collective bargaining outcomes are affected by multiple factors that are beyond the department’s control
- Service standards are published on the web
- Target is to meet 4 of a possible 4 priority service standards for Working Conditions and Workplace Relations programs
Budgetary financial resources (dollars)
| Spending category | 2019 to 2020 Main Estimates* | 2019 to 2020 Planned spending* | 2019 to 2020 Total authorities available for use | 2019 to 2020 Actual spending (authorities used) | 2019 to 2020 Difference (Actual spending minus Planned spending) |
|---|---|---|---|---|---|
| Gross Spending | 298,909,369 | 298,909,369 | 175,463,200 | 169,857,913 | (129,051,456) |
| Spending in Specified Purpose Accounts | 0 | 0 | 0 | 0 | 0 |
| Revenues netted against expenditures | 125,900,000 | 125,900,000 | 900,000 | 685,012 | (125,214,988) |
| Net Spending | 173,009,369 | 173,009,369 | 174,563,200 | 169,172,901 | (3,836,468) |
At net Spending no significant variance: The variance in revenues is due to a change in presentation, as the item presents was presented at gross as a statutory authority, rather than a netted, as it was in the previous year.
Notes:
*Amounts do not reflect 2019 Budget Implementation measures included in ESDC's 2019 to 2020 Main Estimates.
“Planned spending” may differ from Main Estimates as they include the amounts to be spent for the Specified Purpose Accounts (such as Employment Insurance and Canada Pension Plan accounts). These amounts include benefits paid to clients and amounts associated with the payment of these benefits.
“Net Spending” excludes amounts spent under Specified purpose accounts.
Refer to the department's financial framework section for a complete description of the departmental financial profile, including explanation of gross actual and planned spending.
Human resources (full-time equivalents)
2019 to 2020 Planned full-time equivalents: 691
2019 to 2020 Actual full-time equivalents: 690
2019 to 2020 Difference (actual full-time equivalents minus planned full-time equivalents): (1)
Variance explanation: No significant variance
Financial, human resources and performance information for the Employment and Social Development Canada’s Program Inventory is available in GC InfoBase.
Information delivery and services for other departments
Description
Provide information to the public on the programs of the Government of Canada and the department, and provide services on behalf of other government departments.
Results
The department undertook the following initiatives to advance this core responsibility:
The department took measures to provide clients with high quality, timely and accurate government information and services that meet their needs
The department continued to make its web content more user friendly, easy to understand, mobile and accessible to all users by:
- ensuring its 150 most visited pages (90%) were written at a grade 8 reading level
- training over 175 program employees on how to write for the web. This will improve the understandability, accessibility and overall quality of its web content
- improving Canada Pension Plan (CPP) and EI program web pages, including testing voice and search techniques for CPP content
- optimizing content of web pages for CPP-Disability, Old Age Security and the Guaranteed income Supplement programs. These changes will make it easier to find and use information on Government of Canada websites. These web pages will be released in fiscal year 2020 to 2021 because of COVID-related pressures on the Web and program functions
The department identified solutions to support outreach in communities with limited or no access to the Internet. This is a significant barrier in serving these communities. This work involved the procurement and testing of satellite and cellular hub technology. This solution will result in the ability to provide equal access to services and benefits to all Canadians.
The department collaborated with territorial Government Services Officers to provide support to 2,418 Service Canada clients in 15 remote communities in the Northwest Territories. Of those clients, 464 were served in an Indigenous language. This led to clients providing 100% positive feedback on the service in their communities.
The department ensured service standards were comprehensive and meaningful and published them regularly on Canada.ca. It also published 1 800 O-Canada wait times in real time on Canada.ca beginning April 1st, 2019. This allowed clients to know exactly what to expect before they dialed. It improved their client experience and helped them make the best use of their time.
The department continued to update recorded messaging for 1 800 O-Canada and customized information services to answer some frequently asked questions. By actively managing recorded messages, the department delivered relevant and accurate information without requiring the caller to wait to speak to an agent.
The department supported Canadians in obtaining a passport within Canada in a timely manner
The department collaborated with Immigration, Refugees and Citizenship Canada (IRCC) to provide Service Canada staff with direct access to Passport information technology systems. This enabled better service to Canadians.
It also collaborated closely with IRCC on modernizing the Passport Program. This included the ePassport Next Generation Project, which aims to deliver new passport printers and a new booklet design in 2022. It also included the development of a new application intake tool to be piloted in 2021. This tool will be integrated with a secure, case management processing solution.
The department implemented several measures with a view to constantly improve its services to Canadians
The department conducted a second Client Experience Survey, which found that 85% of Service Canada clients remain satisfied with their service experience. They found it easy to apply (85%) and reported that they moved smoothly through the steps to access programs and services (84%). The service delivery experience met the needs of youth, seniors and people with a lower education. The satisfaction rates with the service experience were at 86% for youth, 87% for seniors and 85% for people with a lower education. Clients who experienced restrictions when trying to access services and clients with disabilities were the least satisfied with their service experience. The satisfaction rates were at 79% for people experiencing restrictions and 62% for clients with disabilities. These findings are being used to inform service improvements.
The department also uses the results of the Client Experience Survey to inform outreach initiatives such as the Community Outreach and Liaison Services. These activities support the department’s commitment to provide full access to federal government programs and services to vulnerable Canadians.
The department started the in-person data collection pilot, but suspended it following the closure of Service Canada Centres due to the pandemic. Regularly collecting client experience data allows the department to respond to the changing needs of clients with the goal of improving the level of service. Further data collection is planned in fiscal year 2020 to 2021.
It reactivated the Passport General Inquiries Chatbot pilot in November 2019. The Chatbot was used nearly 2,000 times per week. Over 30% of these sessions were conducted outside normal Service Canada Centre and 1 800 O-Canada office hours. The Chatbot successfully answered questions 70% of the time before referring users to 1 800 O-Canada.
The department also took measures to improve the accessibility of Service Canada Centres. It installed devices to help people with vision impairment find their way in large Service Canada Centres. This was done after recommendations from the Canadian National Institute for the Blind. Installation was completed in 6 of the 13 designated centres prior to the closure of the service network because of the pandemic. Installation in the remaining centres will be planned once they reopen.
The department also initiated the roll-out of sign language interpretation services through video conferencing for clients with hearing impairment. It also installed counter loops in 145 Service Canada Centres. These devices amplify the voice, while eliminating background noise, and transmit it directly to hearing aids. This was done in collaboration with Canadian Hearing Service.
It prepared other accessibility improvements for the department’s 2,800 Client Access Work Stations. All these activities to improve accessibility will restart as regional conditions permit.
Regional offices
Service Canada regions support key government commitments and respond to the unique service delivery needs of citizens in the areas they serve.
Western Canada and Territories
Under its Northern Strategy, the region started promoting visits on Facebook pages of the respective communities. Using new ways of communicating enhanced outreach visits to remote communities. This ensured the most vulnerable Canadians could take advantage of Service Canada’s offerings and receive the benefits to which they are entitled.
The region also procured 7 portable satellite internet receivers for use in the North. These allowed clients and outreach teams to access the internet in remote areas, enabling faster access to benefits.
Through a partnership with the Government of Nunavut and Immigration, Refugees and Citizenship Canada, the region provided passport photo services in 3 Nunavut communities. Clients in Taloyoak, Arviat and Pond Inlet could have their passport photo taken by trained Nunavut Government Liaison Officers. This allowed those clients to save about $4,000 each in potential travel costs.
Video chat services in the Western Canada and Territories region were expanded, making services more widely available to support clients. The video chat (Digital Assist) allows clients to receive immediate virtual assistance from an agent located in a different Service Canada Centre. In 2019 to 2020, 10 “virtual” sites in the region provided client support from 6 “host” sites using Skype through the Digital Assist pilot.
Western Canada and Territories regional employees almost doubled their number of outreach visits to remote Indigenous communities compared to the previous year. They visited 1,600 communities, where 11,435 service requests were addressed up from 10,500 last year. In over 550 of these visits, regional staff were accompanied by officers from a service delivery partner. The Canada Revenue Agency was the most frequent partner (461). These visits increase access to federal benefits for people that cannot easily go to our offices.
Ontario
The region hired 8 local Indigenous people, who provided services in 28 remote communities. This facilitated access to enhanced service offerings and information on government programs and services. In addition, those services were provided in traditional Indigenous languages by members of the community.
It also launched innovative service delivery methods in the Toronto North York Flagship Service Canada Centre, such as Video Remote Interpretation. This on-demand sign language translation service assists clients through video chat.
The region continued to build on Community Outreach and Liaison Services through 41 visits to fly-in communities. It also worked to expand these services to reach Canadians through digital services. This included work to prepare for the following new initiatives that will launch in fiscal year 2020 to 2021:
- the E-Community Outreach Liaison Service provides community outreach to support people with barriers in accessing services online. For example, community organizations that have internet connectivity issues can be assigned a contact person to get information on programs and services
- the Virtual Labour Market Partners’ Liaison Service offers services for employers, unions, and associations in times of labour force adjustment. For example, the department offers information sessions on government supports such as Employment Insurance and labour market information. Employers, unions, and associations can contact Service Canada via telephone or a regional General Delivery email for a coordinated inter-governmental response
The region also expanded Community Based Virtual Services by using a digital service delivery method. This method connects clients to the next available Citizen Service Officer through video chat, allowing the region to serve more clients. It was initially piloted in the Kingston Service Canada Centre and is now available in London, Barrie, Sudbury, and North Bay. This approach ensures clients (including vulnerable members) receive timely and seamless service from staff that understand and can anticipate their needs.
Québec
The region held mobile clinics at 11 universities and colleges to issue Social Insurance Numbers to foreign students. Starting in Winter 2020, clients could make an appointment, which eased access to the service and reduced waiting times. In total, the region issued 3,639 Social Insurance Numbers through this initiative, which is 24% more than in the previous fiscal year.
The region also set up many activities to help vulnerable populations access programs and services, including victims of Spring 2019 flooding. Whenever relevant, the region delivered outreach sessions adapted to specific audiences, such as Indigenous people, anglophones in minority situations, and LGBTQ2.
In November 2019, the region participated in the second open house about government services for First Nations and Inuit. Held in Montreal, the event gathered 15 government and non-government organizations, including Service Canada, providing services directly to Indigenous people.
The department implemented more than 7 initiatives to improve the passport network in the region. These reduced processing times to less than 10 days in some cases. They also shortened wait times for citizens in our in-person service centres.
The passport processing centers in Mississauga, Ontario and Gatineau, Quebec developed a new strategy to redistribute Passport applications from Service Canada Centers across the country. The goal of this collaboration was to balance workload and improve national processing times.
Atlantic
Regional staff successfully completed the Record of Employment scanning pilot, which resulted in recommendations for full implementation across the country. The efficiencies of the new procedure improved the timeliness of services.
A new National Identity Services office in St. John’s, Newfoundland and Labrador opened sooner than anticipated. For the first time, new employees of this service were trained virtually.
The region continued to improve access to services by expanding outreach in Indigenous communities on the northeast coast of Labrador. In partnership with the Nunatsiavut government, the regional staff used services such as in-person visits and phone calls. It also explored other virtual services.
The Atlantic Region piloted a monthly virtual service delivery model in Grand Manan, New Brunswick in collaboration with Service New Brunswick. Recommendations from the pilot are being considered as a permanent solution is explored.
Regional staff initiated conversations and established working groups with Veterans Affairs Canada to explore joint initiatives and service improvement opportunities.
In-person service network
The department put a vast network of in-person offices at the disposal of Canadians. As of March 15, 2020, Canadians were able to access our services at 606 in-person points of service across the country. These included 317 Service Canada Centres, 247 scheduled outreach sites, 27 Service Canada Centre Passport Service sites, and 15 Service Delivery Partner Sites. Passport services were offered in 316 Service Canada Centres and in all 27 Service Canada Centre Passport Service sites. In the 15 Service Delivery partner sites, employees of the Government of Northwest Territories provide services on behalf of Service Canada.
The number of Service Canada Centres Passport Service sites have decreased due to the consolidation of the Calgary Sundance; St. John’s; Fredericton; Victoria; and Halifax offices.
Text description of figure 4:
Service Canada Centres
- Western Canada and Territories: 98
- Ontario: 88
- Québec: 74
- Atlantic: 57
- Total: 317
Scheduled Outreach Sites
- Western Canada and Territories: 127
- Ontario: 75
- Québec: 18
- Atlantic: 27
- Total: 247
Service Canada Centres - Passport Service Sites
- Western Canada and Territories: 8
- Ontario: 13
- Québec: 6
- Atlantic: 0
- Total: 27
Service Delivery Partner Sites
- Western Canada and Territories: 15
- Ontario: 0
- Québec: 0
- Atlantic: 0
- Total: 15
Gender-based analysis plus
This section highlights some of the key achievements related to GBA+ for this core responsibility. For more information on GBA+ initiatives in the department, see the Gender-Based Analysis Plus Supplementary Information Table.
The Government of Canada Telephone General Enquiry Service is designed to provide services to all Canadians, including clients in vulnerable groups. These are the clients that rely more heavily on the telephone to access the department’s and Government of Canada programs. This ensures all clients have equal access to information.
Seniors, people with lower education levels, rural and remote clients, Indigenous clients, low-income households, and some clients with disabilities continue to access government benefits and services through the telephone. Service by phone also supports clients having problems accessing our services by the Internet.
The approach to partnerships for the delivery of other government department programs took into account key GBA+ considerations. The department will confirm with partners whether they assessed the impacts of a proposed program on gender (or other factors). This will ensure that all service delivery partnerships are implemented in a gender-equitable manner.
The partners will be accountable for their programs. This includes aligning the program with the Gender Results Framework pillars and goals and setting performance indicators and targets accordingly. Partners will also be accountable for results achieved, as well as impact of the program on gender and/or intersecting factors. The department will deliver the partner’s program in light of the outcomes of their GBA+ assessment. It will provide the requested service data in order to assist the partner in its GBA+ requirements. It will also ensure that services are delivered in a gender-equitable manner.
The department has tested user experience to improve web content. When conducting this testing, the department used a group of participants that reflects the broader audience who will access the program. Members of vulnerable and equity-seeking groups may have participated in such testing if they met characteristics for a given test. Members of these groups may also have been specifically recruited to test web content targeting them directly.
Experimentation
The department collaborated with Immigration, Refugees and Citizenship Canada to implement a pilot project on Canada.ca. This pilot will enable specific content to be displayed to the public according to their geographic location. This is a first step in providing more personalized content.
The department conducted pilots in 6 locations across the country to better understand the needs of urban Indigenous communities. The results will be used to inform the expansion of outreach to other vulnerable urban populations, including seniors and racialized Canadians.
The Québec Region led a pilot on the processing of passport applications in the Québec-Chaudière-Appalaches-Saguenay-Lac-Saint-Jean area. The pilot ran from August 2018 to March 2020. Applications received in a Service Canada Centre located in these sectors were forwarded to Passport offices in Québec and Saguenay. Upon reviewing applications, Passport officers could better detect inconsistencies as they had some knowledge about the residency area of applicants. This pilot had positive impacts for clients since applications were processed faster by the local Passport office. The 2 Passport offices were able to handle all applications received from the Service Canada Centres in addition to their own cases.
Results achieved
Departmental result: Clients receive high-quality, timely and accurate government information and services that meet their needs
Performance indicator 1 of 3: 1 800 O-Canada information completeness, relevancy and accuracy assessment
Target: 85%
Date to achieve target: March 2020
2019 to 2020 actual result: 91%
2018 to 2019 actual result: 93%
2017 to 2018 actual result: 94%
Performance indicator 2 of 3: Percentage of clients served in person who received assistance within 25 minutes
Target: 80%
Date to achieve target: March 2020
2019 to 2020 actual result: 84%
2018 to 2019 actual result: 85%
2017 to 2018 actual result: 79%
Performance indicator 3 of 3: Number of program services that meet their service standard targets
Target: 5
Date to achieve target: March 2020
2019 to 2020 actual result: 4 See note 1
2018 to 2019 actual result: 4
2017 to 2018 actual result: 5
Departmental result: Canadians can obtain a passport within Canada in a timely manner
Performance indicator: Percentage of travel documents and other passport services processed within standards
Target: 90% See note 2
Date to achieve target: March 2020
2019 to 2020 actual result: 100% See note 3
2018 to 2019 actual result: 100%
2017 to 2018 actual result: 100%
Notes:
- The only service standard that did not meet its target was “General enquiry calls are answered by a 1 800 O-Canada agent within 18 seconds” (Target = 80%). The target was met until the end of February, but was not met for the month of March, because of the impacts of the pandemic on the department’s telephone enquiry service. The unanticipated extraordinary high volume of calls for this one month resulted in only meeting the service standard 70% of the time for the year
- This target is part of a Memorandum of Understanding between the department and Immigration, Refugees and Citizenship Canada
- Data has been rounded to the nearest full number - in this case, 100%. Actual result is 99.7%
Budgetary financial resources (dollars)
| Spending category | 2019 to 2020 Main Estimates* | 2019 to 2020 Planned spending* | 2019 to 2020 Total authorities available for use | 2019 to 2020 Actual spending (authorities used) | 2019 to 2020 Difference (Actual spending minus Planned spending) |
|---|---|---|---|---|---|
| Gross Spending | 225,074,106 | 225,074,106 | 228,604,364 | 228,440,413 | 3,366,306 |
| Spending in Specified Purpose Accounts | 0 | 0 | 0 | 0 | 0 |
| Revenues netted against expenditures | 0 | 0 | 0 | 0 | 0 |
| Net Spending | 225,074,106 | 225,074,106 | 228,604,364 | 228,440,412 | 3,366,306 |
Variance explanation: No significant variance
Notes:
*Amounts do not reflect 2019 Budget Implementation measures included in ESDC's 2019 to 2020 Main Estimates.
“Planned spending” may differ from Main Estimates as they include the amounts to be spent for the Specified Purpose Accounts (such as Employment Insurance and Canada Pension Plan accounts). These amounts include benefits paid to clients and amounts associated with the payment of these benefits.
“Net Spending” excludes amounts spent under Specified purpose accounts.
Refer to the department's financial framework section for a complete description of the departmental financial profile, including explanation of gross actual and planned spending.
Human resources (full-time equivalents)
2019 to 2020 Planned full-time equivalents: 2,507
2019 to 2020 Actual full-time equivalents: 2,086
2019 to 2020 Difference (actual full-time equivalents minus planned full-time equivalents): (421)
Variance explanation: The difference is mainly due to the decrease in volume.
Financial, human resources and performance information for the Employment and Social Development Canada’s Program Inventory is available in GC InfoBase.
Internal services
Description
Internal services are those groups of related activities and resources that the federal government considers to be services in support of programs and/or required to meet corporate obligations of an organization. Internal services refer to the activities and resources of the 10 distinct services that support program delivery in the organization, regardless of the internal services delivery model in a department. These services are Management and Oversight Services; Communications Services; Legal Services; Human Resources Management Services; Financial Management Services; Information Management Services; Information Technology Services; Real Property Management Services; Materiel Management Services; and Acquisition Management Services. Highlights of the department’s results in internal services can be found below, along with key corporate risks and related mitigation measures.
Results
Human Resources Management - In order to strengthen its workforce, the department implemented a number of measures
The department implemented the final year of its 5-year Workforce Strategy and its 2019 to 2020 Workforce Action Plan. These helped the department to ensure it had the right people, in the right place, at the right time. It also supported the development of employees and fostered a productive workplace.
It continued the development of a talent management model and invested in the development of various solutions. These included a Talent Management Marketplace and talent management plans for eligible non-executive employees. These solutions will help employees grow in their careers.
The department advanced the talent management program for executives. This will ensure the leadership team has the right skills and competencies to evolve with the department’s business needs.
It also hosted the 2019 to 2020 Leadership Forum. The goal was to support department executives in better equipping their teams for excellence and to create a positive employee experience.
The department also explored new ideas and innovative technologies in key areas of human resources. These include artificial intelligence and video software to expand its ability to recruit.
Awards: The department was recognized as a top employer in fiscal year 2019 to 2020. ESDC was named one of:
- Canada’s Top 100 Employers
- Canada’s Top Employers for Young People
- Canada’s Best Diversity Employers
- Canada’s Top Family-Friendly Employers
- National Capital Region’s Top Employers
Following these awards and recognition, departmental communications and job posters spotlighted our “Top Employer” status to attract candidates and retain our employees.
To foster a healthy, respectful and inclusive workplace, the department achieved the following results:
The department implemented year 2 of its 2018 to 2020 Workplace Mental Health Action Plan. The plan engaged, empowered and educated employees in the area of psychological health in the workplace.
The department implemented phase I of its harassment awareness and prevention campaign. It also took measures to better address harassment and violence in the workplace, in accordance with new laws and regulations.
In addition, the department implemented year 3 of the Diversity and Employment Equity Action Plan. It also collaborated with disability networks and government programs to enhance the hiring of persons with disabilities.
The department advanced the recruitment, development and retention of Indigenous people in support of the Government of Canada’s commitment to reconciliation. The department also collaborated on government-wide initiatives to provide tools for First Nations, Inuit and Métis students and Indigenous-specific training for all employees.
It also revised the Duty to Accommodate Guidelines to promote a culture of collaboration and inclusivity in the workplace.
Information Management Services - The department continued to implement its Data Strategy and achieved the following results:
The department developed the first departmental Data Policy. This policy provides direction and guidance on how to better use data to serve citizens and to modernize privacy protection.
It expanded data stewardship pilots to improve data governance, data discovery and access to data.
The department also developed its first Artificial Intelligence Strategy. This will help the department understand what artificial intelligence is and how it works. It will support the exploration of the ethical use of artificial intelligence.
In addition, the department continued development and implementation of its data literacy plan. This plan will ensure employees have the skills and tools to use data while protecting the personal information of Canadians. The department has started to implement the plan, which will continue in fiscal year 2020 to 2021.
Information Technology Services - The department undertook various initiatives to improve information management and information technology:
The department made progress on the implementation of its information management strategy and roadmap. It also developed its Information Management Policy in alignment with the new government Policy on Service and Digital.
The department successfully delivered on projects to facilitate access to emerging technologies. These projects include the creation of a Research and Development team to track and experiment with emerging technologies. In addition, the department created a Grassroots Innovation Program to assist with the creation and implementation of modern IT solutions. The department also progressed on the procurement of cloud services, which have been used for the Benefits Finder and Whitelist applications.
The department implemented Microsoft Teams. This application gave all employees an access to modern tools that increase collaboration within the department, and across the government of Canada.
The department improved mobility and teleworking capabilities through connection optimizations and large scale distribution of laptops for employees across the country. This allowed the department to maintain its operations and react quickly to continue to support Canadians, while ensuring the safety of its employees.
The department collaborated with Library and Archives Canada to modernize the way the department gets rid of information and records that are not required anymore.
In addition, the department increased the speed and stability of the network and upgraded its online collaboration tools. This allowed for increased remote access capacity to deliver essential services to Canadians when offices were shut down.
The department put in place cloud-based access to virtual environments. These allow for faster and more effective implementation of solutions that support Canadians.
The department also laid the foundation to connect the department's cloud environment with the Government of Canada’s data centres. This will make the department’s data environment more secure.
The department promoted a safe working environment for its employees, enhanced its security program and fostered a strong security culture that protects the integrity, security, assets and information of employees
To support this, the department began refreshing its security policy and aligning it to the revised Policy on Government Security. The new policy reflects the changing security landscape and the increasingly modern and mobile environments in which the department operates.
It consolidated business continuity, building emergency and evacuation, information technology, disaster recovery, and emergency management planning in a Cloud-based software.
The department developed internal tools and processes to monitor and report on departmental emergency preparedness, management activities and requirements. These tools included business continuity plans maintenance and exercises.
It established the Security Awareness, Communications, Education and Outreach (SATEO) plan, which outlines how employees will be engaged and trained. It also indicates how key security information will be communicated to promote a strong security culture across the department. As a result, employees were provided with security messaging, awareness products and training throughout the year. Over time, security training will be adapted to specific functions and risk profiles to be even more relevant to employees.
The department emphasized collaboration and consultation with external partners in responding to emergency events such as a pandemic. This strengthens the department's ability to prevent, prepare, respond to, and recover from disasters. It also allows it to do so while maintaining delivery of critical programs and services to Canadians.
Real Property and Project Management - The department strengthened its project management and investment planning in various ways
The department designed various policies, directives, and guides to help direct resources to strategic priorities and areas of greatest benefit to Canadians.
It continued to advance the Project Management Competency Development program to enhance capabilities of its project management community.
It also developed a framework and business model that aligns planning, portfolio management, risk management and benefit management. These tools measure the effectiveness of various risk mitigation strategies across the department. They also help strengthen risk management processes throughout the organization.
The department also received Treasury Board approval for a rent price protection regime. This regime will allow the department to adjust its reference levels to respond to fluctuations in rent increases for real property.
In addition, the department developed sustainable and nationally consistent real property strategies and plans. These improved the use of existing spaces, improved efficiencies, minimized costs and increased flexibility to respond to business needs.
The department also continued collaborating with the Canada Revenue Agency to modernize existing business processes and systems. This included improving the integrity and quality of accounts receivable data for the department. Measures put in place to respond to the pandemic delayed the implementation of the Departmental Accounts Receivable System until April 2021.
Key risks and mitigation strategies
Taking risks
The department recognizes that one of the biggest risks it faces is a failure to take risks. As a result, it continued to pursue innovation and experimentation. This allowed the department to learn from the successes and failures that come from testing new and different approaches. For example, the department’s Innovation Lab involved groups of Canadians and stakeholder organizations in the co-development of solutions. These experiments led to improvements for the Youth Employment Strategy, Employment Insurance information sessions and the development of guidance materials on the Accessible Canada Act.
Information technology
Information technology (IT) systems are critical to the department’s ability to meet the demand Canadians have for service delivery. The department continued to work on initiatives to modernize its existing IT systems to address the risk of failure. It took the following measures to mitigate potential impacts on benefits and service delivery to Canadians:
- establishing and funding the Technical Debt Remediation initiative, as of July 2019. This initiative addresses the gaps and risks associated with the department’s aging IT infrastructure
- advancing the establishment of a modern IT environment through the Cloud
- continuing to detect and monitor cybersecurity incidents within the department
- increasing collaboration with the Canadian Centre for Cybersecurity, Canada Revenue Agency and Shared Services Canada in conducting and sharing Security Assessments
- continuing to work towards the consolidation of existing data centers to new, more modern centres. These new centres have significantly more capacity, power back-up capabilities and are designed to never have an outage. Continuing to conduct ongoing maintenance to improve system stability and reliability
- making important progress on the continuity of IT services during a disaster. For example, the department can recover more quickly from a disruption, which mitigates the risk of losing data
Privacy
The department holds a high volume of information. Since cyber-attacks are increasing and getting more sophisticated, there is a risk of an information breach at the department. This risk is mitigated using a range of strategies. These include education and training, as well as mandatory reviews of program compliance with privacy requirements. These strategies create a privacy-respectful culture within the labour force. This year, for example, the department:
- improved the guide that helps employees ensure that the minimum safeguards to protect privacy of information are adequate. The guide is easily available to all employees on the department’s intraweb
- continued to require that all employees participate in mandatory training on the safeguarding of information
- held promotional events such as Privacy Awareness Week and Data Privacy Day
- continued to assess the impact on privacy of departmental initiatives and programs involving personal information
- conducted almost 500 reviews to ensure that new or modified departmental initiatives and programs complied with privacy requirements
Information management
There is a risk that information management practices may create barriers to access data and information. This may unintentionally hinder the development of responsive policies, programs and services. To mitigate this risk, employees must have a clear understanding of their responsibilities when it comes to information management. They also have to apply sound information management practices consistently across the department. Specific risk response strategies included:
- progressing on the implementation of an Information Management Strategy for the department, including the development of an Information Management policy
- developing communication materials to increase employee awareness about the importance of information management, including mandatory training
Fraud
The department also faces a risk of fraud, wrongdoing and error against and within its programs, services, and operations. Having mechanisms to share information between departments and jurisdictions is critical to safeguarding the integrity of our programs.
In fiscal year 2019 to 2020, the department developed an information sharing agreement with the Canada Border Services Agency. The goal of the initiative is to mitigate risks of fraud to Employment Insurance and Old Age Security benefits for Canadians who travel to the United States.
The risk of fraud is also greater during emergency situations. With the onset of the COVID-19 pandemic, the department significantly increased its information-sharing activities with other departments and jurisdictions. These increased efforts focused on areas such as the Temporary Foreign Worker Program and the development of the Canada Emergency Response Benefit. The department was aware that the circumstances under which the CERB was implemented could have led to fraud towards the program. Therefore, it collaborated with the Canada Revenue Agency to implement a plan focusing on ensuring Canadians received the benefits they needed and were entitled to, while pursuing measures that would protect their identity and privacy.
Disruption of operations
The department faces external threats to keeping its facilities open and critical systems online. These risks are outside of its control and can include natural disasters, cyber-attacks, workplace violence and terrorism. In March 2020, pandemic was added to this list of risks that are outside of the department’s control. Given the uncontrollable nature of these threats, being prepared to respond to and recover is key to mitigating the risks. This includes putting in place procedures that are tested and known. It also includes ensuring that employees are trained adequately and have the tools and resources necessary to reduce the risks.
These risks were mitigated through various risk response strategies including:
- testing and validating emergency plans on a regular basis. The department also created a centralized inventory of all emergency management exercises planned and completed during the year
- developing security awareness and training for employees, while testing new training concepts and improving internal communications
- modernizing the mandatory security training curriculum for employees
- communicating security best practices while teleworking and developing awareness of the need to report security incidents occurring when working from home
- monitoring and reporting security incidents, then implementing measures to prevent future incidents
Human resources
Human resources management influences all of the department strategic objectives. It is a common issue and source of risk across every branch and region. More specifically, there have been changes in demographics and skill sets. Therefore, the department may lack the workforce skills, competencies and distribution needed to meet current and future needs. In particular, the department has identified a lack of project management capabilities within its workforce. This is a risk, as it may prevent the department from meeting its commitments. To address this risk, the department developed a number of strategies. These are meant to retain and attract people, develop the competencies of employees and help them grow in their careers. These strategies included specific actions to minimize pay challenges and develop project management skills. Specifically, the department:
- continued to use annual action plans to implement and monitor progress towards workforce objectives. It also continued to use governance committees to ensure the strategic management of human resources
- prioritized the development of project management capabilities
- increased its capacity to understand, prevent and resolve pay issues
- introduced dedicated compensation services for employees and developed tools to help them better understand the accuracy of their pay
Sound management of financial resources
The department delivers a variety of programs and benefits. This puts it at risk of ineffectively allocating financial resources to projects, assets and acquired services needed to deliver programs. This may result in insufficient funding to meet the department’s transformation agenda. To mitigate this risk the department implemented various strategies including:
- improving the management of investments by:
- introducing a Review Board to oversee how decisions are made about investments and ensure adequate use of resources
- enhancing the focus on demonstrating the outcomes of projects and managing their risks
- strengthening governance and oversight of these investments
- implementing procurement modernization initiatives to ensure timely and accessible services for Canadians
Budgetary financial resources (dollars)
| Spending category | 2019 to 2020 Main Estimates* | 2019 to 2020 Planned spending* | 2019 to 2020 Total authorities available for use | 2019 to 2020 Actual spending (authorities used) | 2019 to 2020 Difference (Actual spending minus Planned spending) |
|---|---|---|---|---|---|
| Gross Spending | 841,778,820 | 841,778,820 | 1,033,721,094 | 1,019,312,762 | 177,533,942 |
| Spending in Specified Purpose Accounts | 0 | 0 | 0 | 0 | 0 |
| Revenues netted against expenditures | 556,276,194 | 556,276,194 | 652,472,403 | 642,973,282 | 86,697,088 |
| Net Spending | 285,502,626 | 285,502,626 | 381,248,691 | 376,339,480 | 90,836,854 |
Variance explanation: The variance in gross spending can be explained by the recording for temporary costs of overpayments in relation with the Phoenix pay issues and increases to spending in Innovation, Information and Technology to support programmes operations.
Notes:
*Amounts do not reflect 2019 Budget Implementation measures included in ESDC's 2019 to 2020 Main Estimates.
“Planned spending” may differ from Main Estimates as they include the amounts to be spent for the Specified Purpose Accounts (such as Employment Insurance and Canada Pension Plan accounts). These amounts include benefits paid to clients and amounts associated with the payment of these benefits.
“Net Spending” excludes amounts spent under Specified purpose accounts.
Refer to the department's financial framework section for a complete description of the departmental financial profile, including explanation of gross actual and planned spending.
Human resources (full-time equivalents)
2019 to 2020 Planned full-time equivalents: 4,462
2019 to 2020 Actual full-time equivalents: 4,855
2019 to 2020 Difference (actual full-time equivalents minus planned full-time equivalents): 393
Variance explanation: No significant variance
Analysis of trends in spending and human resources
This section presents an overview of the department’s financial and human resource expenditures for fiscal year 2019 to 2020 compared with previous years.
This section contains the following subsections:
- actual expenditures
- actual human resources
- expenditures by vote
- financial statements and financial statements highlights
Actual expenditures
Departmental spending trend
ESDC expenditures on programs and services total $144.4 billion in fiscal year 2019 to 2020. Of this, $136.0 billion, or more than 94 %, directly benefits Canadians through Employment Insurance (EI), the Canada Pension Plan (CPP), Old Age Security (OAS), Canada Emergency Response Benefits (CERB) and other statutory transfer payment programs. Departmental expenditures were $3.0 billion in voted grants and contributions and $3.5 billion in gross operating expenditures.
Gross departmental operating expenditures were less than 3% of departmental budget. This low figure speaks to the efficiency and effectiveness of the department. It also illustrates its focus on helping Canadians, especially those most in need. Through its activities, the department has distributed well over $100 billion to Canadians in need and their families. This has improved their situation, reduced inequality and increased GDP by increasing Canadians’ disposable income and spending.
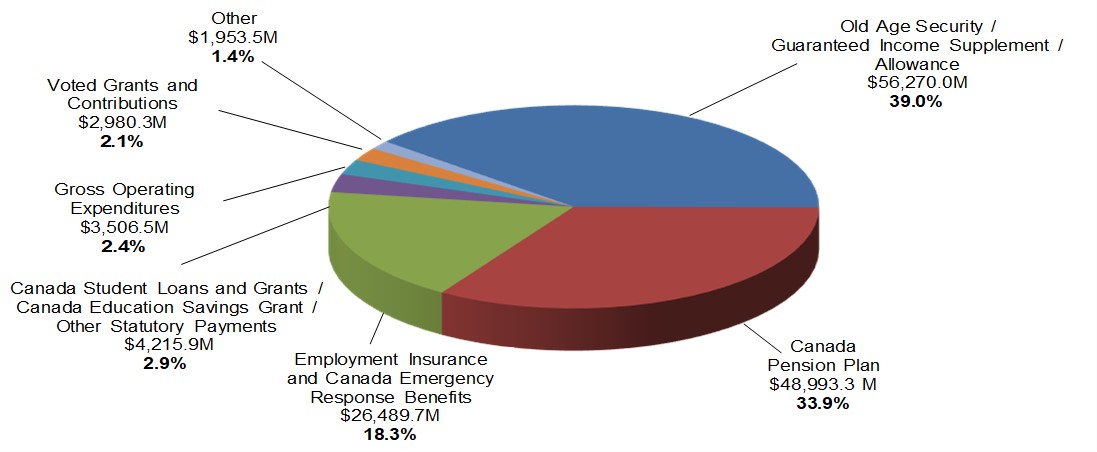
Text description of figure 5:
Consolidated total: $144,409.2 M
- Old Age Security / Guaranteed Income Supplement / Allowances: $56,270.0 M (39.0%)
- Canada Pension Plan: $48,993.3 M (33.9%)
- Employment Insurance and Canada Emergency Response Benefits: $26,489.7 M (18.3%)
- Canada Student Loans and Grants / Canada Education Savings Grant / Other statutory payments: $4,215.9 M (2.9%)
- Gross Operating Expenditures: $3,506.5 M (2.4%)
- Voted Grants and Contributions: $2,980.3 M (2.1%)
- Other: $1,953.5 M (1.4%)
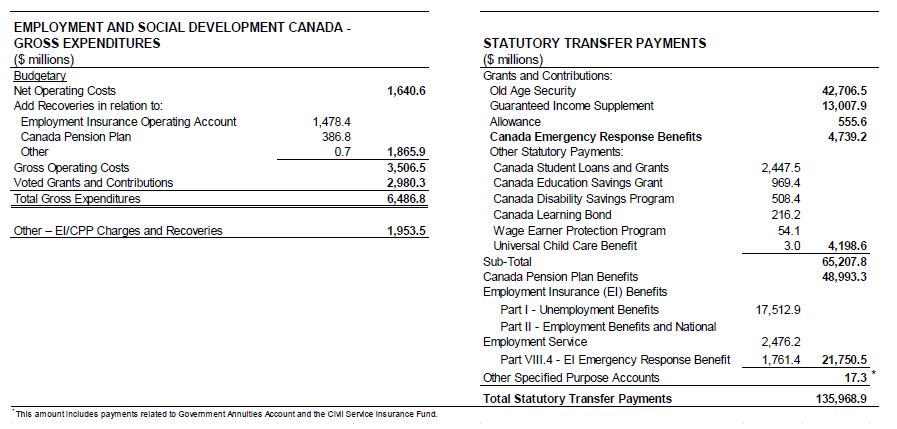
Text description of figure 6:
GROSS EXPENDITURES ($ millions)
Budgetary
Net operating costs: 1,640.6
Add recoveries in relation to:
- Employment Insurance Operating Account: 1,478.4
- Canada Pension Plan: 386.8
- Other: 0.7
- Total - recoveries: 1865.9
Gross operating costs: 3,506.5
Voted Grants and Contributions: 2,980.3
Total gross expenditures: 6,486.8
Other – EI/CPP Charges and recoveries: 1,953.5
Statutory transfer payments ($ millions)
Grants and Contributions:
- Old Age Security: 42,706.5
- Guaranteed Income Supplement: 13,007.9
- Allowance: 555.6
- Canada Emergency Response Benefit: 4,739.2
- Other statutory payments:
- Canada Student Loans and Grants: 2,447.5
- Canada Education Savings Grant: 969.4
- Canada Disability Savings Program: 508.4
- Canada Learning Bond: 216.2
- Wage Earner protection Program: 54.1
- Universal Child Care Benefit: 3.0
- Total – Other Statutory payments: 4,198.6
- Sub-total – Grants and Contributions: 65,207.8
Canada Pension Plan Benefits: 48,993.3
Employment Insurance Benefits:
- Part I – Unemployment Benefits: 17,512.9
- Part II – Employment Benefits and National Employment Service: 2,476.2
- Part VIII.4 – EI Emergency Response Benefit: 1,761.4
- Total – EI Benefits: 21,750.5
Other Specified Purpose Accounts: 17.3 (see note)
Total – Statutory transfer payments: 135,968.9
Note: This amount includes payments related to Government Annuities Account and the Civil Service Insurance Fund.
| Core responsibilities and internal services | 2019 to 2020 actual gross spending | Less: 2019 to 2020 actual gross spending in specified purpose accounts | Less: 2019 to 2020 actual revenues netted against expenditures | 2019 to 2020 actual net spending |
|---|---|---|---|---|
| Core responsibility 1: Social Development | 921,816,281 | 0 | 0 | 921,816,281 |
| Core responsibility 2: Pensions and benefits | 106,337,930,426 | 48,993,263,077 | 260,029,836 | 57,084,637,513 |
| Core responsibility 3: Learning, skills development and employment | 33,778,359,238 | 21,767,753,884 | 962,248,816 | 11,048,356,538 |
| Core responsibility 4: Working conditions and workplace relations | 169,857,914 | 0 | 685,012 | 169,172,902 |
| Core responsibility 5: Information delivery and services for other departments | 228,440,412 | 0 | 0 | 228,440,412 |
| Sub-total | 141,436,404,271 | 70,761,016,961 | 1,222,963,664 | 69,452,423,646 |
| Internal services | 1,019,312,762 | 0 | 642,973,282 | 376,339,480 |
| Other costs See note | 1,953,487,716 | 1,953,487,716 | 0 | 0 |
| Total | 144,409,204,749 | 72,714,504,677 | 1,865,936,946 | 69,828,763,126 |
Notes:
Refer to the departmental financial framework for a complete description of the departmental financial profile, including explanation of gross planned spending.
“Other Costs” include administrative costs of other government departments charged to the Employment Insurance Operating Account and the Canada Pension Plan. They also include Employment Insurance doubtful accounts and recoveries from other government departments.
ESDC’s financial framework
The department has a complex financial structure, with various funding mechanisms used to deliver its mandate. The department is financed by 4 main sources of funds:
- appropriated funds from the Consolidated Revenue Fund (CRF)
- the Employment Insurance Operating Account
- the Canada Pension Plan
- other government departments and Crown corporations
Some expenditures are excluded from the department’s Main and Supplementary Estimates and from net actual and planned spending because they are not voted by Parliament. These are:
- actual expenditures related to the Employment Insurance Operating Account and the Canada Pension Plan
- planned expenditures that are recovered from other government departments and Crown corporations for the delivery of programs and services on their behalf
EI and CPP benefits and related administrative costs are charged against revenues set aside in separate specified purpose accounts as revenues netted against expenditures under the department.
Departmental costs related to the delivery of programs and services on behalf of other government departments are also reported as revenues netted against the department’s expenditures. These costs are mainly for passport services and the administration of the Government Employee Compensation Act.
These items are included in the department’s gross actual and planned spending. This provides readers with the full cost to government of the department’s programs and services. It also presents a complete picture of the resources the department manages to deliver its mandate. But these expenditures are ultimately recorded under separate legal entities.
The government amended the Department of Employment and Social Development Act in June 2018. The goal was to broaden the department’s mandate to include the ability to deliver services to the public on behalf of partners, such as other government organizations. As a result, departmental costs related to the delivery of programs and services on behalf of other government departments were reported under a statutory authority. An example of this would be passport services, reported as revenues netted against the department’s expenditures.
The sources of funds, including specified purpose accounts, for each of the department’s core responsibilities are as follows:
Core responsibility 1: Social Development
- Consolidated Revenue Fund
Core responsibility 2: Pensions and Benefits
- Consolidated Revenue Fund
- Canada Pension Plan (in gross actual spending only for Canada Pension Plan benefits and related administrative costs)
Core responsibility 3: Learning, Skills Development and Employment
- Consolidated Revenue Fund
- Employment Insurance Operating Account (in gross actual spending only for Employment Insurance benefits and related administrative costs)
Core responsibility 4: Working Conditions and Workplace Relations
- Consolidated Revenue Fund
- Crown corporations and other departments (in gross actual spending only for the administration of the Government Employee Compensation Act)
Core responsibility 5: Information Delivery and Services for Other Departments
- Consolidated Revenue Fund
- Other departments (in gross actual spending mainly for passport services)
Internal Services
- Consolidated Revenue Fund
- Canada Pension Plan (in gross actual spending only for Canada Pension Plan administrative costs)
- Employment Insurance Operating Account (in gross actual spending only for Employment Insurance administrative costs)
- Other departments (in gross actual spending mainly for passport services)
Financial highlights
The department is responsible for the direct delivery of programs such as the OAS, CPP, EI and other statutory transfer payments. These programs can be affected by variances in the average number of beneficiaries and variances in the average benefit rates. This is the case for the Old Age Security and Guaranteed Income Supplement (OAS/GIS) and for the CPP. For EI, spending can be influenced by many factors such as the number of eligible individuals establishing claims for EI benefits. This number varies with the economy, the benefit rates and the implementation of any new initiatives. The combined effect of those programs explains the main increase in statutory spending in addition to the CERB and the EI Emergency Response Benefit.
In fiscal year 2019 to 2020, the overall actual gross expenditures were $14.1 billion higher than in fiscal year 2018 to 2019. This is mainly the result of an increase in statutory payments and the COVID-19 measures.
Statutory payments include an EI benefits increase by $2.9 billion from fiscal year 2018 to 2019 to fiscal year 2019 to 2020. This increase is mainly due to the EI Emergency Response Benefit ($1.8 billion). In addition, EI Part I benefits have also increased by $0.9 billion. This follows from the increase of regular benefits ($492.1 million) and the increase of parental benefits ($201.5 million). Employment Benefits and Support Measures expenditures increased by $168 million, following new investments in Labour Market Development Agreements.
The statutory payments followed their usual trend in 2019 to 2020. There were increases to OAS/GIS payments ($2.9 billion) and to CPP benefits ($2.5 billion) caused by the aging population and the changes in average monthly benefits. There was also an increase in the maximum monthly OAS pension due to indexation. The maximum monthly OAS pension amount reached an average of $608.99 in 2019 to 2020, representing an increase of 2.0% over the previous fiscal year. There was also an increase for the average number of OAS pension beneficiaries. This number grew from 6.2 million in fiscal year 2018 to 2019 to 6.4 million in fiscal year 2019 to 2020. However, the CERB measures affected the statutory payments by an additional $4.7 billion.
There were other spending increases for Grants and Contributions programs (Vote 5) and other statutory programs from fiscal year 2018 to 2019 to fiscal year 2019 to 2020. These increases were mainly related to the Workforce Development Agreements ($291 million), Canada Education Savings Program (Grant and Bonds) ($109 million), Indigenous Early Learning and Child Care Transformation Initiative ($108 million), and the Youth Employment and Skills Strategy ($73 million).
The figure below illustrates the department’s spending trend from fiscal year 2017 to 2018 to fiscal year 2020 to 2021. In the fiscal year 2019 to 2020, the department spent a net amount of $69.9 billion in achieving its expected results. Planned spending presented from fiscal year 2020 to 2021 to fiscal year 2022 to 2023 corresponds to planned spending presented in the fiscal year 2020 to 2021 Departmental Plan.
| Core responsibilities and internal services | 2019 to 2020 Main Estimates See note 1 | 2019 to 2020 planned spending | 2020 to 2021 planned spending See note 2 | 2021 to 2022 planned spending See note 2 | 2019 to 2020 total authorities available for use | 2019 to 2020 actual spending (authorities used) | 2018 to 2019 actual spending (authorities used) | 2017 to 2018 actual spending (authorities used) See note 3 |
|---|---|---|---|---|---|---|---|---|
| Core responsibility 1: Social Development | 759,435,703 | 759,435,703 | 953,560,319 | 603,256,887 | 943,816,344 | 921,816,281 | 716,719,128 | 695,357,869 |
| Core responsibility 2: Pensions and benefits | 57,353,008,462 | 107,075,411,089 | 113,898,809,509 | 120,348,679,461 | 106,395,627,769 | 106,337,930,426 | 100,963,229,259 | 96,051,202,359 |
| Core responsibility 3: Learning, skills development and employment | 6,629,816,970 | 27,402,184,747 | 28,487,016,224 | 29,632,393,590 | 33,874,524,018 | 33,778,359,238 | 25,597,959,995 | 26,086,783,929 |
| Core responsibility 4: Working conditions and workplace relations | 298,909,369 | 298,909,369 | 306,797,291 | 308,138,072 | 175,463,201 | 169,857,914 | 320,589,879 | 262,029,434 |
| Core responsibility 5: Information delivery and services for other departments | 225,074,106 | 225,074,106 | 260,513,398 | 249,094,389 | 228,604,364 | 228,440,412 | 203,136,512 | 228,253,902 |
| Sub-total | 65,266,244,610 | 137,761,075,014 | 143,906,696,741 | 151,141,562,399 | 141,618,035,696 | 141,436,404,271 | 127,801,634,773 | 123,323,627,493 |
| Internal services | 841,778,820 | 841,778,820 | 908,717,800 | 881,519,360 | 1,033,721,094 | 1,019,312,762 | 897,483,438 | 925,244,173 |
| Other costs See note 4 | 0 | 1,690,372,657 | 1,873,588,211 | 1,849,321,030 | 1,953,272,728 | 1,953,487,716 | 1,564,951,081 | 1,380,064,755 |
| Vote netted revenues | (1,671,438,486) | 0 | 0 | 0 | 0 | 0 | 0 | 0 |
| Sub-total | (1,671,438,486) | 1,690,372,657 | 1,873,588,211 | 1,849,321,030 | 1,953,272,728 | 1,953,487,716 | 1,564,951,081 | 1,380,064,755 |
| Total | 64,436,584,944 | 138,293,166,491 | 146,689,002,752 | 153,872,402,789 | 144,605,029,518 | 144,409,204,749 | 130,264,069,292 | 125,628,936,421 |
Refer to the department’s financial framework for a complete description of the departmental financial profile, including explanation of gross actual and planned spending.
Notes:
- Amounts do not reflect 2019 Budget implementation measures included is ESDC’s 2019 to 2020 Main Estimates
- Planned spending for 2020 to 2021 and 2021 to 2022 is presented as per ESDC’s 2020 to 2021 Departmental Plan
- For comparative purposes, 2017 to 2018 actual spending has been restated as per the 2019 to 2020 Departmental Results Framework
- “Other Costs” include administrative costs of other government departments charged to the Employment Insurance Operating Account and the Canada Pension Plan. It also includes Employment Insurance doubtful accounts and recoveries from other government departments, mainly related to Federal Workers’ Compensation and passport services delivery
There was an overall increase of $18.8 billion from fiscal year 2017 to 2018 to fiscal year 2019 to 2020 actual gross spending. It was mainly due to an increase related to CERB paid at the end of March 2020. It also follows from an increase to the CPP and OAS benefits caused by the aging population and changes in the average monthly benefits.
In Core Responsibility 1 - Social Development, there was an increase of $0.2 billion from fiscal year 2017 to 2018 to fiscal year 2019 to 2020 actual spending. This is mostly the result of the introduction of the new Indigenous Early Learning and Child Care Transformation Initiative implemented in fiscal year 2018 to 2019.
There was an overall gross increase of $10.3 billion under Core Responsibility 2 - Pensions and Benefits from fiscal year 2017 to 2018 to fiscal year 2019 to 2020 actual spending. This can mainly be explained by increases in the number of beneficiaries and the average monthly benefits payments to Old Age Security ($4.2 billion), the Guaranteed Income Supplement ($1.3 billion) and the Canada Pension Plan ($4.5 billion).
Under Core Responsibility 3 - Learning, Skills Development and Employment, there was an increase of $7.7 billion from fiscal year 2017 to 2018 to fiscal year 2019 to 2020 actual spending. This is mainly due to the Canada Emergency Response Benefits (CERB) program actuals spending at the end of March 2020 ($4.7 billion) and to EI COVID-19 benefits payments ($1.8 Billion) in fiscal year 2019 to 2020.
There was a decrease of $92 million at gross related to Core Responsibility 4 - Working Conditions and Workplace Relations from fiscal year 2017 to 2018 to fiscal year 2019 2020 actual spending. This is mostly attributable to revenues due to a change in presentation. As a result, the revenues related to Government Employees’ Compensation Act were deducted from expenses for the delivery of this program and for presentation purposes.
In addition, the Wage Earner Protection Program (WEPP) actual spending for fiscal year 2019 to 2020 was $54 million. This represents an increase of $38 million when compared to fiscal year 2017 to 2018. This increase is largely attributable to 2 factors. First, Budget 2018 increased the maximum WEPP payment from $3,977 to $7,148, and the increase was applied retroactively to February 27, 2018. Second, Sears Canada entered into receivership, and as a result, close to 10,000 former Sears Canada employees received a WEPP payment in fiscal year 2018 to 2019. In total, 18,165 Canadians received a WEPP payment in fiscal year 2018 to 2019, more than double the total number of WEPP recipients in fiscal year 2017 to 2018.
The increase of $0.2 million from fiscal year 2017 to 2018 to fiscal year 2019 to 2020 actual spending under Information Delivery and Services for Other Departments is not materiel.
There was an increase of $93.9 million from fiscal year 2017 to 2018 to fiscal year 2019 to 2020 actual spending under Core Responsibility 5 - Internal Services. This can be explained by the recording of temporary costs of overpayments in relation with the Phoenix pay issues and increases to spending in Innovation, Information and Technology to support program operations.
There is a variance of $573 million in actual spending under Other Costs from fiscal year 2017 to 2018 to fiscal year 2019 to 2020. This is mainly due to the revenues related to Government Employees’ Compensation Act. These were deducted from expenses for the delivery of this program and for presentation purposes. The variance is also due to increased charges from other government departments to the CPP. Finally, it is due to the amendment of the Department of Employment and Social Development Act in June 2018. As a result, departmental costs related to the delivery of programs and services on behalf of other government departments were reported under a statutory authority.
| Core responsibilities and internal services | 2019 to 2020 Main Estimates See note 1 | 2019 to 2020 planned spending | 2020 to 2021 planned spending See note 2 | 2021 to 2022 planned spending See note 2 | 2019 to 2020 total authorities available for use See note 3 | 2019 to 2020 actual spending (authorities used) | 2018 to 2019 actual spending (authorities used) See note 4 | 2017 to 2018 actual spending (authorities used) See note 4 |
|---|---|---|---|---|---|---|---|---|
| Core responsibility 1: Social Development | 759,435,703 | 759,435,703 | 953,560,319 | 603,256,887 | 943,816,344 | 921,816,281 | 716,719,128 | 695,357,869 |
| Core responsibility 2: Pensions and benefits | 57,169,311,616 | 57,169,311,616 | 60,680,473,422 | 64,283,806,547 | 57,110,113,015 | 57,084,637,513 | 54,181,915,121 | 51,362,618,315 |
| Core responsibility 3: Learning, skills development and employment | 5,824,251,524 | 5,824,251,524 | 6,263,128,549 | 6,209,350,804 | 11,100,652,850 | 11,048,356,538 | 5,773,734,933 | 5,416,434,813 |
| Core responsibility 4: Working conditions and workplace relations | 173,009,369 | 173,009,369 | 180,897,291 | 182,238,072 | 174,563,200 | 169,172,902 | 175,398,724 | 126,251,634 |
| Core responsibility 5: Information delivery and services for other departments | 225,074,106 | 225,074,106 | 260,513,398 | 249,094,389 | 228,604,364 | 228,440,412 | 74,870,918 | 78,751,918 |
| Sub-total | 64,151,082,318 | 64,151,082,318 | 68,338,572,979 | 71,527,746,699 | 69,557,749,773 | 69,452,423,646 | 60,922,638,824 | 57,679,414,549 |
| Internal services | 285,502,626 | 285,502,626 | 303,172,409 | 296,956,539 | 381,248,691 | 376,339,480 | 279,511,995 | 291,833,073 |
| Total | 64,436,584,944 | 64,436,584,944 | 68,641,745,388 | 71,824,703,238 | 69,938,998,464 | 69,828,763,126 | 61,202,150,819 | 57,971,247,622 |
Refer to the department’s financial framework for a complete description of the departmental financial profile, including explanation of gross actual and planned spending.
Notes:
- Amounts do not reflect 2019 Budget implementation measures included is ESDC’s 2019 to 2020 Main Estimates
- Planned spending for 2020 to 2021 and 2021 to 2022 is presented as per ESDC’s 2020 to 2021 Departmental Plan
- Does not include the remaining Budget Implementation Vote authorities in the amount of $44,472,878
- For comparative purposes, 2018 to 2019 and 2017 to 2018 actual spending have been restated as per the 2019 to 2020 Departmental Results Framework
Departmental spending trend: total net consolidated expenditures (dollars)
The figure below illustrates ESDC’s spending trend from fiscal year 2017 to 2018 to fiscal year 2022 to 2023. In the 2019 to 2020 fiscal year, the department spent a net amount of $69.8 billion in achieving its expected results. Planned spending presented from fiscal year 2020 to 2021 to fiscal year 2022 to 2023 corresponds to planned spending presented in the fiscal year 2020 to 2021 Departmental Plan.
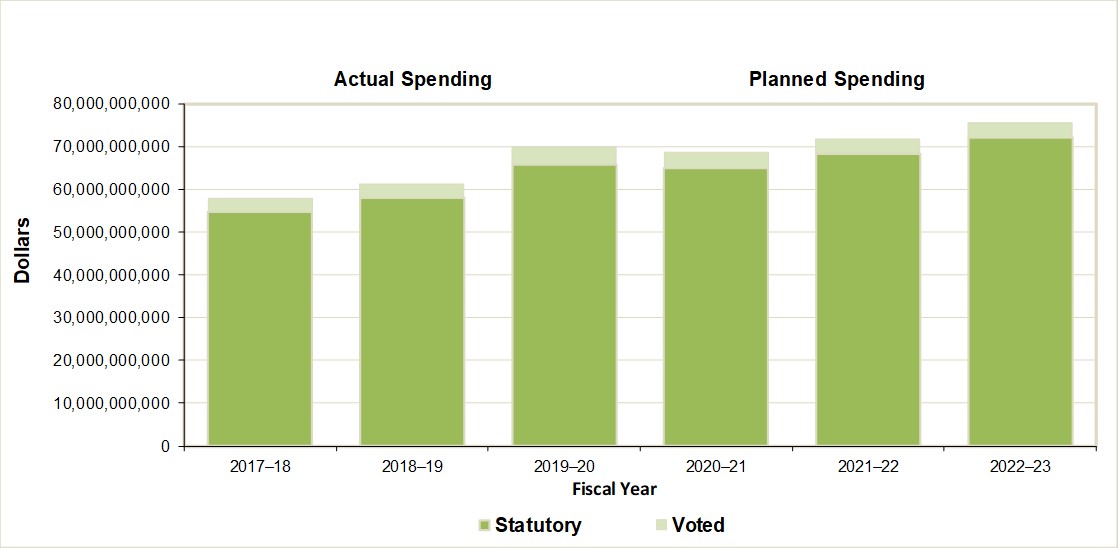
Text description of figure 7:
Actual spending
- 2017 to 2018
- Statutory: 54,607,489,480
- Voted (see note): 3,363,758,142
- Total: 57,971,247,622
- 2018 to 2019
- Statutory : 57,839,469,633
- Voted: 3,362,681,186
- Total: 61,202,150,819
- 2019 to 2020
- Statutory: 65,760,590,856
- Voted: 4,068,172,270
- Total: 69,828,763,126
Planned spending
- 2020 to 2021
- Statutory: 64,817,042,155
- Voted: 3,824,703,233
- Total: 68,641,745,388
- 2021 to 2022
- Statutory: 68,363,332,748
- Voted: 3,461,370,490
- Total: 71,824,703,238
- 2022 to 2023
- Statutory: 72,081,966,061
- Voted: 3,458,702,857
- Total: 75,540,668,918
Note: Voted expenditures include debt write-offs in 2017 to 2018, 2018 to 2019 and 2019 to 2020.
Actual human resources
| Core responsibilities and internal services | 2017 to 2018 actual* | 2018 to 2019 actual | 2019 to 2020 planned | 2019 to 2020 actual | 2020 to 2021 planned** | 2021 to 2022 planned** |
|---|---|---|---|---|---|---|
| Core responsibility 1: Social Development | 349 | 382 | 526 | 457 | 559 | 544 |
| Core responsibility 2: Pensions and benefits | 5,076 | 5,333 | 3,902 | 5,665 | 5,530 | 4,357 |
| Core responsibility 3: Learning, skills development and employment | 10,600 | 10,779 | 9,066 | 10,954 | 10,263 | 9,654 |
| Core responsibility 4: Working conditions and workplace relations | 651 | 668 | 691 | 690 | 782 | 780 |
| Core responsibility 5: Information delivery and services for other departments | 2,316 | 2,036 | 2,507 | 2,086 | 2,513 | 2,411 |
| Sub-total | 18,992 | 19,198 | 16,692 | 19,852 | 19,647 | 17,746 |
| Internal services | 4,114 | 4,598 | 4,462 | 4,855 | 4,745 | 4,552 |
| Total | 23,106 | 23,796 | 21,154 | 24,707 | 24,392 | 22,298 |
Notes:
* For comparative purposes, 2017 to 2018 actual full-time equivalents has been restated as per the 2019 to 2020 Departmental Results Framework
** Planned full-time equivalents for 2020 to 2021 and 2021 to 2022 are presented as per the 2020 to 2021 Departmental Plan
The overall increase of 1,601 in actual full-time equivalents from fiscal year 2017 to 2018 to fiscal year 2019 to 2020 is mainly explained by the following items:
- under Pensions and Benefits, there was an overall increase of 589 FTEs from fiscal year 2017 to 2018 to fiscal year 2019 to 2020 actual FTEs. This can essentially be explained by the spending of additional funds and FTEs to address CPP and OAS workload. There was an increase in the variance between the fiscal year 2019 to 2020 planned and actual FTEs. This is mainly due to additional funding for investments in processing-related activities. These ensure that seniors have timely access to OAS benefits. These were approved during the fiscal year and therefore had not been factored in the fiscal year 2019 to 2020 planned FTEs
- under Learning, Skills Development and Employment, there was an overall increase in actual FTEs of 354 from fiscal year 2017 to 2018 to fiscal year 2019 to 2020. This is mainly due to Employment Insurance (EI) measures to address increased EI workload and other EI-related needs. There was a variance between fiscal year 2019 to 2020 planned and actual FTEs. It is due to additional funding approved during the fiscal year, that was therefore not factored in the fiscal year 2019 to 2020 planned FTEs. This was to support EI measures, such as changes to EI special benefits, support to increase call centre service standards and for transformation
- under Internal Services, there was an increase of 741 FTEs from fiscal year 2017 to 2018 to fiscal year 2019 to 2020 actual FTEs. This increase is mainly attributable to the increased responsibilities of the Strategic and Service Policy Branch. This branch must advise on strategic and horizontal policy in support of ESDC’s mandate. It was also attributed to increased responsibilities of the Innovation, Information and Technology Branch to support program operations
Estimates by vote
For information on Employment and Social Development Canada’s organizational Votes and statutory expenditures, consult the Public Accounts of Canada 2019 to 2020.
Government of Canada spending and activities
Information on the alignment of the Employment and Social Development Canada’s spending with the Government of Canada’s spending and activities is available in GC InfoBase.
Financial statements and financial statements highlights
The financial highlights are intended to serve as a general overview of Employment and Social Development Canada’s (ESDC’s) financial position and operations.
The following condensed consolidated financial statements are prepared in accordance with the government’s accounting policies. These are based on Canadian public sector accounting standards. They are therefore different from reporting on the use of authorities, reflected in the rest of this report. Reconciliation between authorities used and the net cost of operations is set out in Note 3 of the department’s consolidated financial statements.
These consolidated financial statements include the transactions of the Employment Insurance Operating Account, a sub-entity under the control of ESDC. The accounts of this sub-entity have been consolidated with those of ESDC and all inter-organizational balances and transactions have been eliminated. The Canada Pension Plan (CPP) is excluded from ESDC’s reporting entity because it is managed by both the Government of Canada and the provinces. Changes to the Canada Pension Plan require the agreement of at least two-thirds of the provinces, representing at least two-thirds of the population of all the provinces.
Financial statements
The Employment and Social Development Canada’s financial statements (unaudited) for the year ended March 31, 2019, are available on the departmental website.
Financial statement highlights
| Financial information | 2019 to 2020 planned results* | 2019 to 2020 actual results | 2018 to 2019 actual results | Difference (2019 to 2020 actual results minus 2019 to 2020 planned results) | Difference (2019 to 2020 actual results minus 2018 to 2019 actual results) |
|---|---|---|---|---|---|
| Total expenses | 87,760,048,887 | 94,183,295,515 | 82,531,201,906 | 6,423,246,628 | 11,652,093,609 |
| Total revenues | 23,184,304,891 | 23,105,015,386 | 23,284,835,475 | (79,289,505) | (179,820,089) |
| Net cost of operations before government funding and transfers | 64,575,743,996 | 71,078,280,130 | 59,246,366,431 | 6,502,536,134 | 11,831,913,699 |
* The unaudited departmental future-oriented statement of operations can be found on ESDC’s website.
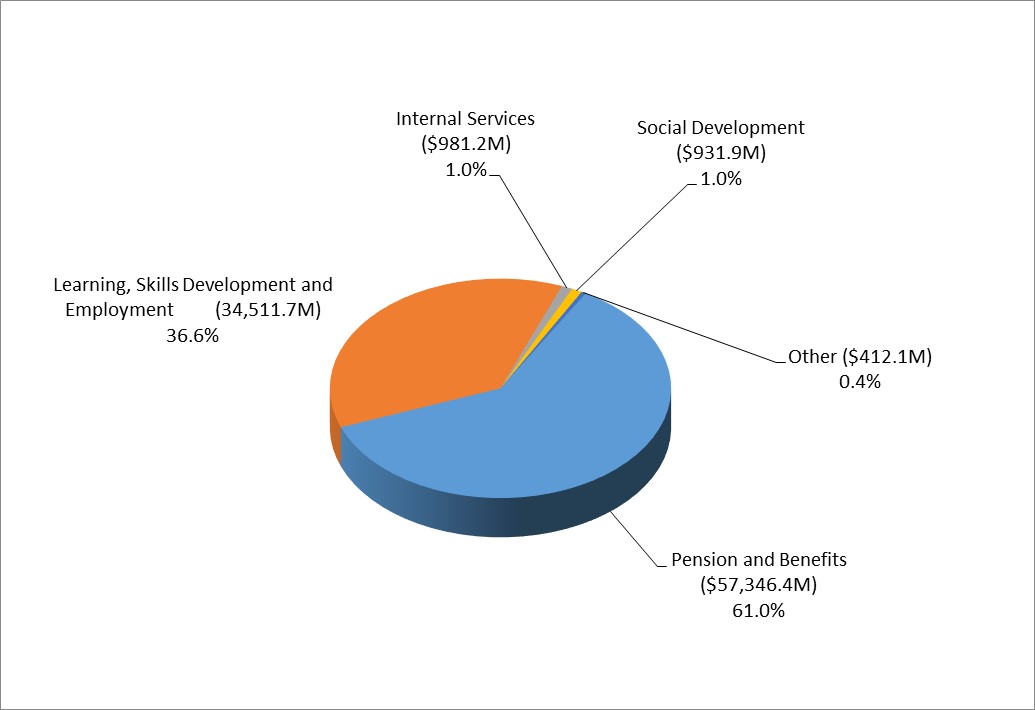
Text description of figure 8:
- Pensions and Benefits: $57,346.4 M (61.0%)
- Learning, Skills Development and Employment: $34,511.7 M (36.6%)
- Internal Services: $981.2 M (1.0%)
- Social Development: $931.9 M (1.0%)
- Other: $412.1 M (0.4%)
Actual over Planned
The fiscal year 2019 to 2020 expenses were $6,423.2 million higher than planned. The variance is mainly attributable to the Canada Emergency Response Benefit.
Actual Year over Year
Total expenses for the fiscal year 2019 to 2020 year amounted to $94,183.3 million. This is an increase of $11,652.1 million over the previous year’s total expenses of $82,531.2 million. The increase in expenses is mainly explained by:
- an increase of $8,373.1 million in Learning, Skills Development and Employment expenses. This increase is mainly due to the Canada Emergency Response Benefit as well as increases to the regular and special benefit amounts for Employment Insurance
- an increase of $2,937.8 million in Pension and Benefits. This increase is mainly due to the increase in the eligible population for OAS and GIS, caused by the growing aging population. The increase in the amount is also due to the increase in the maximum monthly benefit amount
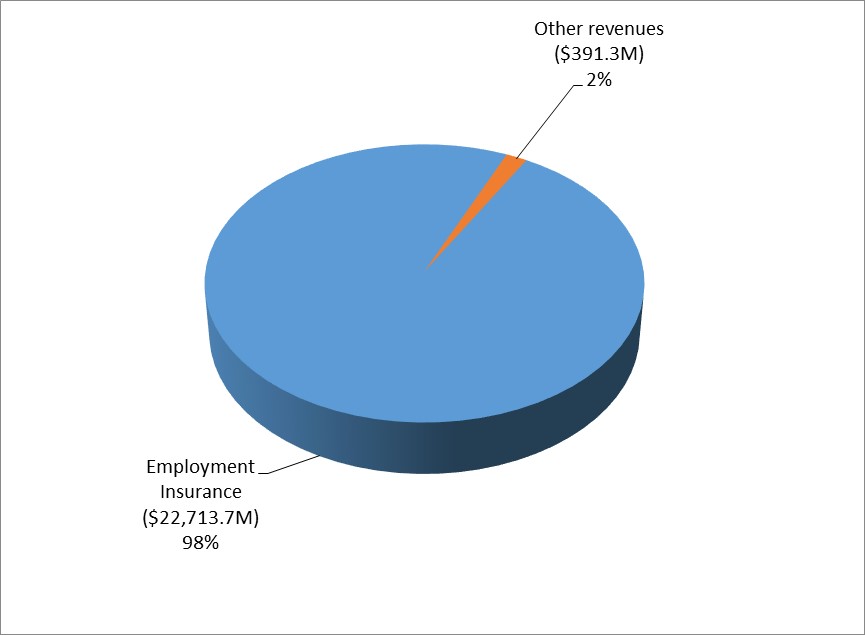
Text description of figure 9:
- Employment Insurance: $22,713.7 M (98%)
- Other revenues: $391.3 M (2%)
Actual over Planned
The fiscal year 2019 to 2020 revenues were $79.3 million lower than planned. The variance is mainly attributable to a reduction in interest revenues on student loans. This reduction is due to a decrease in the prime interest rate and the elimination of interest charged during the 6-month grace period.
Actual Year over Year
Total revenues for the 2019 to 2020 fiscal year amounted to $23,105.0 million. This is a decrease of $179.8 million over the previous year's total revenues of $23,284.8 million. The majority of this decrease can be explained by:
- a reduction in interest revenues on student loans. This reduction is due to a decrease in the prime interest rate and the elimination of interest charged during the 6-month grace period
- a reduction in Employment Insurance premiums revenues. This reduction is mainly due to a decrease in the premium rate in 2020 compared to 2019
| Financial information | 2019 to 2020 | 2018 to 2019 | Difference (2019 to 2020 minus 2018 to 2019 |
|---|---|---|---|
| Total net financial assets | 26,618,268,081 | 22,588,197,082 | 4,030,070,999 |
| Total net liabilities | 9,333,970,307 | 3,291,795,610 | 6,042,174,697 |
| Department net financial assets | 17,284,297,773 | 19,296,401,472 | (2,012,103,699) |
| Total non-financial assets | 301,056,088 | 254,441,007 | 46,615,081 |
| Department net financial position | 17,585,353,861 | 19,550,842,479 | (1,965,488,618) |
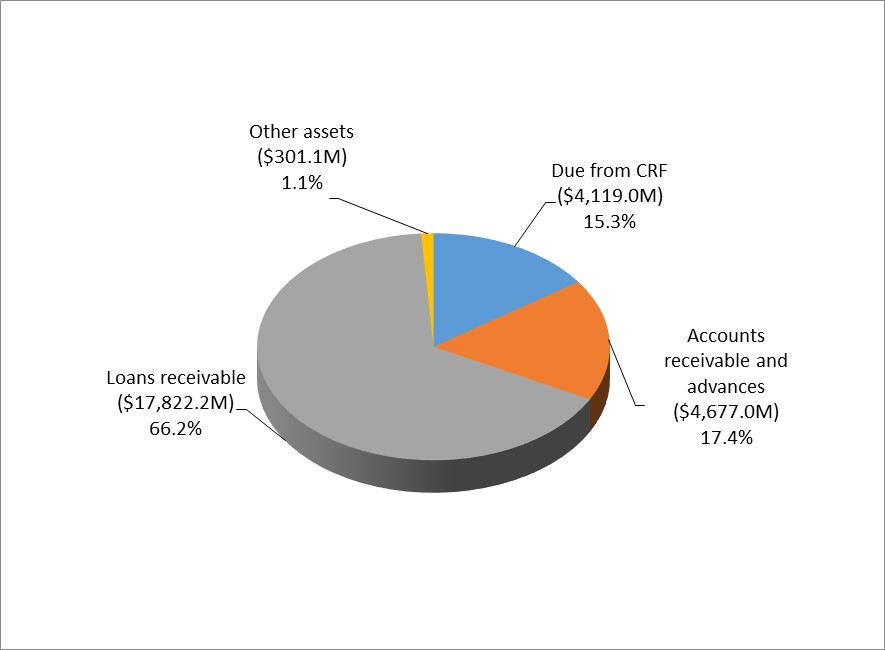
Text description of figure 10:
- Loans receivable: $17,822.2 M (66.2%)
- Accounts receivable and advances: $4,677.0 M (17.4%)
- Due from CRF: $4,119.0 M (15.3%)
- Other assets: $301.1 M (1.1%)
Total assets (including financial and non-financials assets) amounted to $26,919.3 million as at March 31, 2020. This is an increase of $4,715.9 million over the previous year's total assets of $22,203.4 million. The increase in assets is mainly attributable to an increase in the amount due from the Consolidated Revenue Fund (CRF) due to the Canada Emergency Response Benefit. The amount due from the CRF represents the timing difference between when expenses are charged against Parliamentary authorities and when the payments are made.
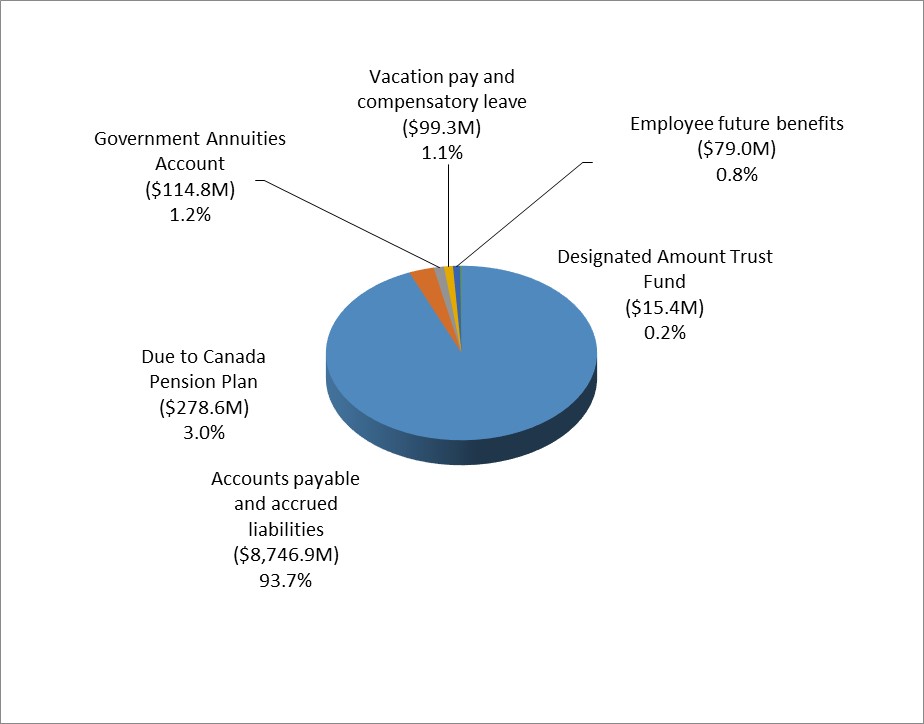
Text description of figure 11:
- Accounts payable and accrued liabilities: $8,746.9 M (93.7%)
- Due to Canada Pension Plan: $278.6 M (3.0%)
- Government Annuities Account: $114.8 M (1.2%)
- Vacation pay and compensatory leave: $99.3 M (1.1%)
- Employee future benefits: $79.0 M (0.8%)
- Designated amount trust fund: $15.4 M (0.2%)
Total liabilities amounted to $9,334.0 million as at March 31, 2020. This is an increase of $6,681.4 million over the previous year's total liabilities of $2,652.6 million. The increase is mainly due to an increase in accounts payable to individuals for the Canada Emergency Response Benefit.
Additional information
Organizational profile
Appropriate ministers
The Honourable Carla Qualtrough
The Honourable Ahmed Hussen
The Honourable Filomena Tassi
The Honourable Deb Schulte
Ministerial portfolio
Minister of Employment, Workforce Development and Disability Inclusion
Minister of Families, Children and Social Development
Minister of Labour
Minister of Seniors
Enabling instrument[s]
Department of Employment and Social Development Act (S.C. 2005, c. 34); additional information on acts and regulations can be found on the Employment and Social Development Canada website.
Year of incorporation / commencement
2005
Other
For more information on the department’s role, please visit the Employment and Social Development Canada website
Raison d’être, mandate and role: who we are and what we do
“Raison d’être, mandate and role: who we are and what we do” is available on the Employment and Social Development Canada’s website.
For more information on the department’s organizational mandate letter commitments, see the Ministers' mandate letters.
Reporting framework
Employment and Social Development Canada’s Departmental Results Framework and Program Inventory of record for fiscal year 2019 to 2020 are indicated below.
Core responsibility 1: Social Development
Description: Increase inclusion and opportunities for participation of Canadians in their communities.
Departmental Result 1: Homelessness is prevented and reduced.
Indicator: Reduction in the estimated number of shelter users who are chronically homeless.
Departmental Result 2: Not-for-profit organizations, communities, and other groups have an enhanced capacity to address a range of social issues such as the social inclusion of people with disabilities, the engagement of seniors and support for children and families.
Indicator: For every dollar invested through the Social Development Partnerships Program, amount leveraged/invested by non-federal partners.
Departmental Result 3: Barriers to accessibility for people with disabilities are removed.
Indicator: Number of community spaces and workplaces that are more accessible due to Enabling Accessibility Fund funding.
Departmental Result 4: Access to early learning and child care is increased.
Indicator 1: Number of children in regulated child care spaces and/or early learning programs.
Indicator 2: Number of children receiving subsidies or other financial supports.
Departmental Result 5: Clients receive high quality, timely and efficient services that meet their needs.
Indicator: Service standard target for Social Development program priority service, as defined by the Government of Canada’s Policy on Service, was met.
Program inventory
- Reaching Home
- Social Development Partnerships Program
- New Horizons for Seniors Program
- Enabling Accessibility Fund
- Early Learning and Child Care
- Indigenous Early Learning and Child Care Transformation Initiative
- Canadian Benefit for Parents of Young Victims of Crime
- Accessible Canada Initiative
- Sustainable Development Goals Funding Program
Core responsibility 2 : Pensions and Benefits
Description: Assist Canadians in maintaining income for retirement, and provide financial benefits to survivors, people with disabilities and their families.
Departmental Result 1: Seniors have income support for retirement.
Indicator 1: Percentage of seniors receiving the Old Age Security pension in relation to the estimated total number of eligible seniors.
Indicator 2: Percentage of seniors receiving the Guaranteed Income Supplement in relation to the estimated total number of eligible seniors.
Indicator 3: Percentage of Canada Pension Plan contributors aged 70 or more receiving retirement benefits.
Indicator 4: Percentage of seniors living in low income.
Departmental Result 2: People with disabilities and their families have financial support.
Indicator 1: Percentage of Canada Pension Plan contributors who have contributory eligibility for Canada Pension Plan disability benefits and therefore have access to financial support in the event of a severe and prolonged disability.
Indicator 2: Percentage of Canadians eligible for the Disability Tax Credit who have a Registered Disability Savings Plan to encourage private savings.
Indicator 3: Percentage of Canadians with disabilities eligible for a Registered Disability Savings Program that have received a grant and/or a bond to assist them and their families to save for their long-term financial security.
Departmental Result 3: Clients receive high-quality, timely and efficient services that meet their.
Indicator : Number of service standard targets for Pensions and Benefits program priority services, as defined by the Government of Canada’s Policy on Service, that are being met.
Key measure 1: Percentage of Canada Pension Plan retirement benefits paid within the first month of entitlement.
Key measure 2: Percentage of decisions on applications for a Canada Pension Plan disability benefit made within 120 calendar days.
Key measure 3: Percentage of Old Age Security basic benefits paid within the first month of entitlement.
Program inventory
- Old Age Security.
- Canada Pension Plan.
- Canada Disability Savings Program.
Core responsibility 3: Learning, Skills Development and Employment
Description: Help Canadians access post-secondary education, obtain the skills and training needed to participate in a changing labour market and provide supports to those who are temporarily unemployed.
Departmental Result 1: Canadians access education, training and lifelong learning supports to gain the skills and work experience they need
Indicator 1: Number of Canadians receiving training and/or employment supports.
Indicator 2: Employment or returns to school following training/supports.
Indicator 3: Percentage of Canadians aged 18 to 24 that are enrolled in university or college.
Indicator 4: Percentage change in Canadians aged 25 to 64 enrolled in university or college.
Departmental Result 2: Canadians participate in an inclusive and efficient labour market.
Indicator 1: Employment rate for Canadians.
Indicator 2: Employment rate for Indigenous people off reserve.
Indicator 3: Employment rate for Indigenous people on reserve.
Indicator 4: Employment rate for recent immigrants.
Indicator 5: Employment rate for persons with disabilities.
Indicator 6: Employment rate for youth.
Indicator 7: Employment rate for women.
Indicator 8: Employment rate for older Canadians.
Indicator 9: Employment rate for lone parents.
Indicator 10: Unemployment-to-job vacancies (ratio).
Departmental result 3: Canadians receive financial support during employment transitions such as job loss, illness, or maternity/parental leave.
Indicator 1: Percentage of workers losing their job in the previous year that were eligible for Employment Insurance.
Indicator 2: Percentage of Employment Insurance claimants finding employment before the end of their benefit entitlement.
Departmental Result 4: More students from low- and middle-income families access and participate in post-secondary education.
Indicator 1: Proportion of low- and middle-income Canadian young adults participating in Post-Secondary Education.
Indicator 2: Percentage of beneficiaries with a Registered Education Savings Plan (RESP) withdrawal that have ever received an additional amount of Canada Education Savings Grant (CESG) and/or Canada Learning Bond (CLB), which are available only to children from low- and middle-income families, as compared to the total population of beneficiaries.
Indicator 3: Percentage of full-time students (all ages) who used federal student financial assistance to help finance their participation in Post-Secondary Education.
Departmental Result 5: Clients receive high-quality, timely and efficient services that meet their needs.
Indicator 1: Percentage of Employment Insurance benefit payments or non-benefit notifications issued within 28 days of filing.
Indicator 2: Percentage of Employment Insurance requests for reconsideration reviewed within 30 days of filing.
Indicator 3: Percentage of Social Insurance Numbers applied for through the Newborn Registration Service issued within 10 business days.
Program inventory
- Employment Insurance
- Labour Market Development Agreements
- Workforce Development Agreements
- Opportunities Fund for Persons with Disabilities
- Job Bank
- Youth Employment and Skills Strategy
- Skills and Partnership Fund
- Literacy and Essential Skills
- Indigenous Skills and Employment Training Program
- Student Work Placement Program
- Union Training and Innovation Program
- Sectoral Initiatives Program
- Foreign Credential Recognition Program
- Temporary Foreign Workers Program
- Enabling Fund for Official Language Minority Communities
- Canada Student Loans Program and Canada Apprentice Loans
- Canada Education Savings Program
- Apprenticeship Grants
- Skilled Trades and Apprenticeship (Red Seal) Program
- Canada Service Corps
- Skilled Trades Awareness and Readiness Program
- Future Skills
Core responsibility 4 : Working Conditions and Workplace Relations
Description: Promotes safe, healthy, fair and inclusive work conditions and cooperative workplace relations..
Departmental Result 1: Workplaces are safe and healthy.
Indicator: Number of health and safety violations identified under the Canada Labour Code (Part II) per 1,000 federally regulated employees.
Departmental Result 2: Work conditions are fair and inclusive.
Indicator 1: Percentage of Legislated Employment Equity Program employers whose representation equals or surpasses Canadian labour market availability for 2 or more designated groups or who demonstrated progress towards representation since the previous reporting period.
Indicator 2: 3 year average number of founded violations identified under Part III of the Canada Labour Code per 1,000 federally regulated employees.
Indicator 3: Percentage of activities or instruments undertaken to strengthen respect for international labour standards that met expected outcomes.
Departmental Result 3: Labour relations are cooperative.
Indicator: Percentage of labour disputes settled under the Canada Labour Code (Part I) without work stoppages, where parties were assisted by Labour Program officers.
Departmental Result 4: Clients receive high quality, timely and efficient services that meet their needs.
Indicator 1: Number of service standard targets for Working Conditions and Workplace Relations program priority services, as defined by the Government of Canada’s Policy on Service, that are being met.
Key measure 1: Percentage of occupational health and safety cases each fiscal year that are finalized within 120 days (excluding prosecutions, appeals, and technical surveys).
Key measure 2: Percentage of unjust dismissal complaints that are finalized within 180 days.
Key measure 3: Percentage of conciliators assigned under the Canada Labour Code within 15 calendar days of receiving requests that are compliant with Canada Industrial Relations Regulations.
Key measure 4: Percentage of initial Wage Earner Protection Program payments and non-payment notifications issued within 35 calendar days.
Program inventory
- Labour Relations
- Federal Workers’ Compensation
- Occupational Health and Safety
- Workplace Equity
- Labour Standards
- Wage Earner Protection Program
- International Labour Affairs
Core responsibility 5: Information Delivery and Services for Other Departments
Description: Provide information to the public on the programs of the Government of Canada and the department, and provide services on behalf of other government departments.
Departmental Result 1: Clients receive high quality, timely and accurate government information and services that meet their needs.
Indicator 1: 1 800 O-Canada information completeness, relevancy and accuracy assessment.
Indicator 2: Percentage of clients served in person who received assistance within 25 minutes.
Indicator 3: Number of program services that meet their service standard targets.
Departmental Result 2: Canadians can obtain a passport within Canada in a timely manner.
Indicator: Percentage of travel documents and other passport services processed within standards.
Program inventory
- Government of Canada Telephone General Enquiries Services
- Government of Canada Internet Presence
- In-Person Points of Service
- Passport
- Other Government Department Programs
Supporting information on the program inventory
Financial, human resources and performance information for Employment and Social Development Canada’s Program Inventory is available in GC InfoBase.
Supplementary information tables
The following supplementary information tables are available on Employment and Social Development Canada’s website:
Federal tax expenditures
The tax system can be used to achieve public policy objectives through the application of special measures such as low tax rates, exemptions, deductions, deferrals and credits. The department of Finance publishes cost estimates and projections for these measures each year in the Report on Federal Tax Expenditures. This report also provides detailed background information on tax expenditures, including descriptions, objectives, historical information and references to related federal spending programs. The tax measures presented in this report are the responsibility of the Minister of Finance.
Organizational contact information
Portage IV
140 Promenade du Portage
Gatineau QC K1A 0J9
Telephone: 1-800-622-6232
Toll-free: 1-800-622-6232
Website: www.canada.ca/en/employment-social-development.html
Appendix: definitions
appropriation (crédit)
Any authority of Parliament to pay money out of the Consolidated Revenue Fund.
budgetary expenditures (dépenses budgétaires)
Operating and capital expenditures; transfer payments to other levels of government, organizations or individuals; and payments to Crown corporations.
core responsibility (responsabilité essentielle)
An enduring function or role performed by a department. The intentions of the department with respect to a core responsibility are reflected in one or more related departmental results that the department seeks to contribute to or influence.
Departmental Plan (plan ministériel)
A report on the plans and expected performance of an appropriated department over a 3‑year period. Departmental Plans are usually tabled in Parliament each spring.
departmental priority (priorité)
A plan or project that a department has chosen to focus and report on during the planning period. Priorities represent the things that are most important or what must be done first to support the achievement of the desired departmental results.
departmental result (résultat ministériel)
A consequence or outcome that a department seeks to achieve. A departmental result is often outside departments’ immediate control, but it should be influenced by program-level outcomes.
departmental result indicator (indicateur de résultat ministériel)
A quantitative measure of progress on a departmental result.
departmental results framework (cadre ministériel des résultats)
A framework that connects the department’s core responsibilities to its departmental results and departmental result indicators.
Departmental Results Report (rapport sur les résultats ministériels)
A report on a department’s actual accomplishments against the plans, priorities and expected results set out in the corresponding Departmental Plan.
experimentation (expérimentation)
The conducting of activities that seek to first explore, then test and compare the effects and impacts of policies and interventions in order to inform evidence-based decision-making, and improve outcomes for Canadians, by learning what works, for whom and in what circumstances. Experimentation is related to, but distinct from innovation (the trying of new things), because it involves a rigorous comparison of results. For example, using a new website to communicate with Canadians can be an innovation; systematically testing the new website against existing outreach tools or an old website to see which one leads to more engagement, is experimentation.
full‑time equivalent (équivalent temps plein)
A measure of the extent to which an employee represents a full person‑year charge against a departmental budget. For a particular position, the full‑time equivalent figure is the ratio of number of hours the person actually works divided by the standard number of hours set out in the person’s collective agreement.
gender-based analysis plus (GBA+) (analyse comparative entre les sexes plus [ACS+])
An analytical process used to assess how diverse groups of women, men and gender-diverse people experience policies, programs and services based on multiple factors including race ethnicity, religion, age, and mental or physical disability.
government-wide priorities (priorités pangouvernementales)
For the purpose of the 2019 to 2020 Departmental Results Report, those high-level themes outlining the government’s agenda in the 2019 Speech from the Throne, namely: Fighting climate change; Strengthening the Middle Class; Walking the road of reconciliation; Keeping Canadians safe and healthy; and Positioning Canada for success in an uncertain world.
horizontal initiative (initiative horizontale)
An initiative where 2 or more federal organizations are given funding to pursue a shared outcome, often linked to a government priority.
non‑budgetary expenditures (dépenses non budgétaires)
Net outlays and receipts related to loans, investments and advances, which change the composition of the financial assets of the Government of Canada.
performance (rendement)
What an organization did with its resources to achieve its results, how well those results compare to what the organization intended to achieve, and how well lessons learned have been identified.
performance indicator (indicateur de rendement)
A qualitative or quantitative means of measuring an output or outcome, with the intention of gauging the performance of an organization, program, policy or initiative respecting expected results.
performance reporting (production de rapports sur le rendement)
The process of communicating evidence‑based performance information. Performance reporting supports decision making, accountability and transparency.
plan (plan)
The articulation of strategic choices, which provides information on how an organization intends to achieve its priorities and associated results. Generally, a plan will explain the logic behind the strategies chosen and tend to focus on actions that lead to the expected result.
planned spending (dépenses prévues)
For Departmental Plans and Departmental Results Reports, planned spending refers to those amounts presented in Main Estimates.
A department is expected to be aware of the authorities that it has sought and received. The determination of planned spending is a departmental responsibility, and departments must be able to defend the expenditure and accrual numbers presented in their Departmental Plans and Departmental Results Reports.
program (programme)
Individual or groups of services, activities or combinations thereof that are managed together within the department and focus on a specific set of outputs, outcomes or service levels.
program inventory (répertoire des programmes)
Identifies all the department’s programs and describes how resources are organized to contribute to the department’s core responsibilities and results.
result (résultat)
A consequence attributed, in part, to an organization, policy, program or initiative. Results are not within the control of a single organization, policy, program or initiative; instead they are within the area of the organization’s influence.
statutory expenditures (dépenses législatives)
Expenditures that Parliament has approved through legislation other than appropriation acts. The legislation sets out the purpose of the expenditures and the terms and conditions under which they may be made.
target (cible)
A measurable performance or success level that an organization, program or initiative plans to achieve within a specified time period. Targets can be either quantitative or qualitative.
voted expenditures (dépenses votées)
Expenditures that Parliament approves annually through an appropriation act. The vote wording becomes the governing conditions under which these expenditures may be made.