
Evaluation of the Guaranteed Income Supplement
Official title: Evaluation of the Guaranteed Income Supplement. Phase 1 summary report
On this page
- Executive summary
- 1.0 Introduction
- 2.0 Methodology
- 3.0 Findings
- 3.1 Changes in Guaranteed Income Supplement take-up, 2006 to 2015
- 3.2 Changes in the population of eligible non-recipients since 2006
- 3.3 Changes in barriers to take-up of the Guaranteed Income Supplement
- 3.4 Barriers to take-up specific to vulnerable populations and barriers common to all groups
- 3.5 The effectiveness of actions taken to reach different groups
- 3.6 The impact of the different measures to increase take-up
- 3.7 Take-up rate among all eligible seniors between 2006 to 2015
- Annexes
- Annex A: Methods and data limitations
- Annex B: International take-up rates of Guaranteed Income Supplement-like programs
- Annex C: Guaranteed Income Supplement take-up rates for low income tax filers receiving the OAS
- Annex D: Take-up rates, 2006 to 2015
- Annex E: Evaluation matrix for the Guaranteed Income Supplement take-up evaluation
- Annex F: Barriers to take-up of the Guaranteed Income Supplement
- Annex G: OAS/GIS Program logic model
- Annex H: Additional findings from the Longitudinal Administrative Databank
Alternate formats

Evaluation of the Guaranteed Income Supplement - Phase 1 Summary Report January 2019 [PDF - 908 KB]
Large print, braille, MP3 (audio), e-text and DAISY formats are available on demand by ordering online or calling 1 800 O-Canada (1-800-622-6232). If you use a teletypewriter (TTY), call 1-800-926-9105.
List of tables
List of figures
- Figure 1: Overall take-up rate of the Guaranteed Income Supplement, 2006 to 2015
- Figure 2: Guaranteed Income Supplement take-up rate by region, 2006 to 2015 (T1 and Old Age Security data)
- Figure 3: Distribution of the number of Guaranteed Income Supplement potentially eligible non-recipients in 2015 and 2006
- Figure 4: Comparison of GIS take-up rates, 2006 to 2015
Executive summary
The Old Age Security program is the largest statutory program of the Government of Canada, and consists of the Old Age Security pension, the Guaranteed Income Supplement, and the Allowance. The Guaranteed Income Supplement is provided to low-income seniors aged 65 years and over who receive the Old Age Security pension and are below a low-income cut-off level. In 2017 to 2018, an average of 1.9 million seniors (about 32% of Old Age Security pensioners) received Guaranteed Income Supplement payments in addition to their monthly Old Age Security pension.
The 2016 evaluability assessment determined that the program conducts activities regarding the Supplement take-up rate, including its calculation. Enhanced data in this evaluation allowed for an additional estimation of take-up rates by key demographic characteristics such as gender, income, age, region and marital status.
Phase 1 of the evaluation examines take-up by various socioeconomic groups, the characteristics of those who are eligible for the Supplement but do not receive it, and barriers faced by vulnerable groups. Phase 2 of the evaluation will address barriers to take-up among non tax-filing seniors by speaking to them directly.
The objective of this evaluation was not to determine the impact of the Guaranteed Income Supplement on program outcomes, such as the reduction of poverty among the elderly vulnerable population. As per the mandate from the Performance Management and Evaluation Committee, this evaluation covers the period between 2006 and 2015Footnote 1 and examined the following:
- changes in Guaranteed Income Supplement take-up rates by demographic characteristics, particularly among vulnerable groups
- changes in the population of potentially eligible non-recipients
- changes in barriers to take-up of the Guaranteed Income Supplement
- barriers specific to vulnerable populations and barriers common to all groups
- the effectiveness of actions taken to reach different groups
- the impact of the different measures to increase take-up
- Guaranteed Income Supplement take-up rate among all eligible seniors between 2006 and 2015
Key evaluation findings in this evaluation are as follows:
- take up rates for the Guaranteed Income Supplement recipients are higher for women, those with incomes below $15,000 per year, seniors 80 years of age and older, and those who are single or widowed. Men, seniors with relatively higher incomes, those 65 to 69 years old, and seniors living as a couple have relatively lower rates of take-up
- the characteristics of potentially eligible non-recipients of the Guaranteed Income Supplement have remained fairly constant between 2006 and 2015. Care should be taken to assess the needs of younger seniors who may have less knowledge of income supports. In addition, seniors with relatively higher income levels may not be aware of their possible eligibility for the Supplement even if it is just a small amountFootnote 2
- among tax-filers, take-up rates for immigrants and those who live in rural areas have remained stable between 2006 and 2015. Take-up rates were higher for immigrants than for non-immigrants. Barriers still exist for immigrants and those who live in rural areas, including language and difficulty understanding the application processFootnote 3
- according to key informants, actions seen as most useful for increasing take-up are either in place (tax clinics or assisted application sessions) or under development at the time of the evaluation (the integrated Old Age Security/Guaranteed Income Supplement application and Guaranteed Income Supplement automatic enrolment for Old Age Security pensioners)
- despite small variations over the evaluation period, the Guaranteed Income Supplement take-up rate has remained essentially unchanged at 90% when comparing 2006 to 2015 Footnote 4
This evaluation acknowledged that the Department continues to find ways to increase the take-up of the Guaranteed Income Supplement with the development and implementation of a Take-Up Action Plan in 2016.
ESDC uses the most recent data available from Statistics Canada for estimating the take-up rates for the Guaranteed Income Supplement. This data has a 2 and a half year lag from 2018.Footnote 5
Formal recommendations will be made once Phase 2 of the evaluation is completed.
1.0 Introduction
This report presents findings from Phase 1 of the evaluation of estimated take-up of the Guaranteed Income Supplement.Footnote 6 Take-up is defined as the percentage of seniors who are eligible for the Guaranteed Income Supplement who actually received the Supplement. The report includes background information on the program, findings, and conclusions. Phase 2 of this evaluation is scheduled for completion in 2019 and will further analyze barriers to take-up rates.
This evaluation addresses 7 issues over the 2006 to 2015 period:
- changes in Guaranteed Income Supplement take-up rates by demographic characteristics, particularly among vulnerable groups
- changes in the population of potentially eligible non-recipients
- changes in barriers to take-up of the guaranteed income supplement
- barriers to take-up specific to vulnerable populations and barriers common to all groups
- the effectiveness of actions taken to reach different groups
- the impact of the different measures to increase take-up
- Guaranteed Income Supplement take-up rate among all eligible seniors
Program description
The Guaranteed Income Supplement is a component of the Old Age Security program, which is the Government of Canada's largest statutory pension program. The benefits under the Old Age Security program include the Old Age Security pension, the Guaranteed Income Supplement, the Allowance, and the Allowance for the Survivor.Footnote 7
The Old Age Security pension is provided to seniors aged 65 years and over who meet the legal status and residence requirements. Seniors with 40 years of residence in Canada after age 18 receive a full pension; a minimum of 10 years of residence is required for a partial pension.Footnote 8 The income-tested Guaranteed Income Supplement is provided to low-income Old Age Security pensioners residing in Canada.Footnote 9 The Guaranteed Income Supplement, which became operative in January 1967 after an amendment to the Old Age Security Act,Footnote 10 provides a monthly non-taxable benefit to Old Age Security pension recipients who have a low level of income.
In 2017 to 2018, an average of 1.9 million seniors (about 32% of Old Age Security pensioners) received Guaranteed Income Supplement payments in addition to their monthly Old Age Security pension; the total number of Old Age Security pensioners was approximately 6 million seniors.Footnote 11 Total Guaranteed Income Supplement payments were $11.7 billion for 2017 to 2018, while total Old Age Security pension payments were $38 billion for the same period.
The monthly Guaranteed Income Supplement payment is based on the pensioner’s marital status and the individual income for singles, and joint income in the case of couples, reported by the pensioner in the previous calendar year. From July to September 2018, the maximum monthly benefit was $891.18 for single seniors and $536.48 for each member of a pensioner couple. The income-level cut-off amounts were $18,096 for single persons and $23,904 for couples, representing the amount of income at which the Guaranteed Income Supplement ceased to be payable.Footnote 12
2.0 Methodology
This evaluation used a mixed method approach based on the following 7 lines of evidence to address the evaluation questions: document review; key informant interviews; 3 quantitative data analyses; stakeholder discussion groups; and a Service Canada Survey. All of the lines of evidence were triangulated to increase the validity of the findings. For more detailed information, see Annex A.
3.0 Findings
3.1 Changes in Guaranteed Income Supplement take-up, 2006 to 2015Footnote i
The estimate of the number of Guaranteed Income Supplement recipients in 2015 is 2,103,020.Footnote 13 The estimate of the number of seniors eligible for the Supplement but not receiving it in 2015 is 240,000. Thus, the estimated total number of eligible seniors in 2015 is 2,343,020.Footnote 14
Figure 1 presents the overall take-up rates between 2006 and 2015. According to the Old Age Security/Canada Revenue Agency linked data, the lowest rates were in 2011 to 2014, when the rates ranged between 87.4% and 87.8%.Footnote 15 The data shows an increase in take-up to 90% in 2015.
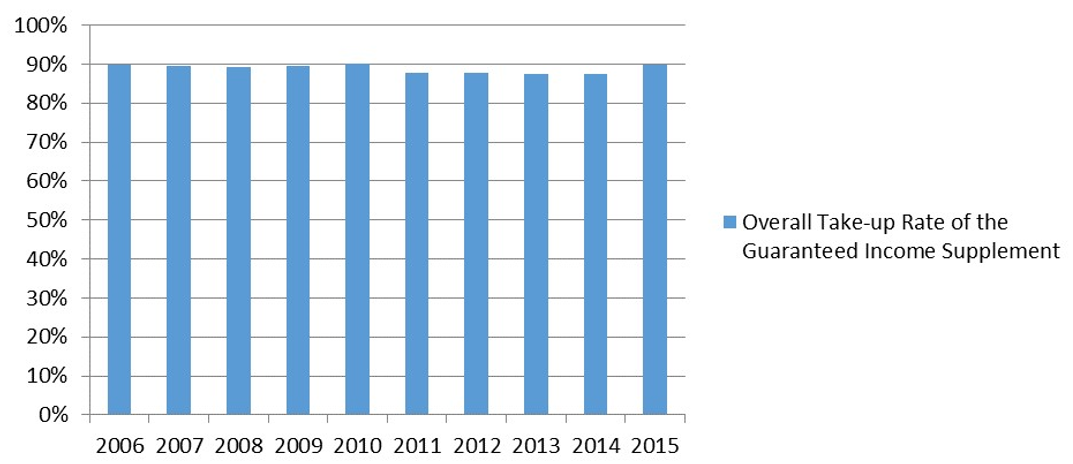
Figure 1 – Text version
| Year | Overall Take-up Rate of the Guaranteed Income Supplement |
|---|---|
| 2006 | 89.8% |
| 2007 | 89.4% |
| 2008 | 89.1% |
| 2009 | 89.4% |
| 2010 | 90% |
| 2011 | 87.8% |
| 2012 | 87.8% |
| 2013 | 87.4% |
| 2014 | 87.4% |
| 2015 | 89.8% |
- Sources: 10% sample of linked Canada Revenue Agency T1-Old Age Security databases, 2006 to 2015
When examining the take-up rates disaggregated by demographic characteristics, the overall take-up rate has been fairly stable between 2006 and 2015 (89.8% for both years), despite a small drop to just under 88% in 2011.Footnote 16
The following analysis explains changes in the Supplement take up rate between 2006 and 2015 amongst vulnerable populationsFootnote 17 and other characteristics.
Immigrants: As with the overall take-up trends, rates for immigrants have been stable between 2006 and 2015. Immigrants who came to Canada between 10 and 25 years ago had a take-up rate for the Supplement of 95% in 2006 and 96% in 2015.Footnote 18 Immigrants have a higher take-up rate (94%) than those born in Canada (87%).Footnote 19
Rural versus urban: Overall, urban individuals in Canada had slightly lower take-up than rural individuals (90% vs. 91% in 2015). The difference in take-up between both groups remained steady throughout the 2006 to 2015 period.Footnote 20
Indigenous: Take-up rates among Indigenous communities are currently only available for 2010.Footnote 21 The take-up was 91% for Indigenous compared to 89% for non-Indigenous.Footnote 22
Gender: Take-up is higher among women than men. The difference in take-up between men and women has been steady at around 5 percentage points. For women, take-up varied through the period of observation (particularly between 2010 and 2015) but remained at 92% for both 2006 and 2015.Footnote 23 Take-up for men was 88% in 2006 and 87% in 2015. See graph in Annex D.
Age: There was a lower take-up rate among people aged 65 to 69 years in 2006 (85% and 90%, respectively) compared to older cohorts (90%, 91%, and 92% for those aged 75 to 79, 80 to 84 and 85+, respectively). From 2006 to 2014, there was a slight decrease in take-up among all age groups, with an increase in 2015. It was most apparent among individuals between 65 and 69, where take-up declined by about 2 percentage points during the period.Footnote 24 See graph in Annex D.
Marital status: Take-up varies by marital status, with higher take-up among single and widowed individuals. They have an average 5 percentage points higher than take-up among married individuals. Take-up has been fairly steady among single and widowed seniors during this period. For example, it was 92% for both single and widowed seniors in 2015.Footnote 25 See graph in Annex D.
For married individuals, take-up decreased slightly from 88% in 2006 to 87% in 2015.Footnote 26
Region: As shown in Figure 2, the variation in take-up is quite significant. Take-up is lower in the Ontario, Western and Northern regions of Canada than in the Atlantic and Quebec regions. In 2015, take-up was 94% in the Atlantic and Quebec regions, while it was 88% and 87% in Ontario and Western regions, respectively. Finally, the lowest take-up rate was 85% in the Northern region.Footnote 27, Footnote 28
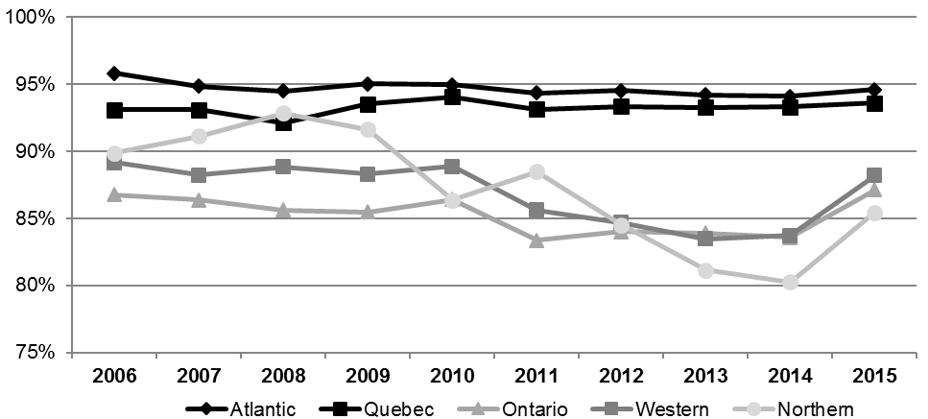
Figure 2 – Text version
| Year | Atlantic | Quebec | Ontario | Western | Northern |
|---|---|---|---|---|---|
| 2006 | 95.8% | 93.1% | 86.8% | 89.1% | 89.9% |
| 2007 | 94.8% | 93.1% | 86.4% | 88.2% | 91.1% |
| 2008 | 94.5% | 92.1% | 85.6% | 88.8% | 92.8% |
| 2009 | 95.0% | 93.5% | 85.5% | 88.3% | 91.6% |
| 2010 | 95.0% | 94.1% | 86.4% | 88.9% | 86.4% |
| 2011 | 94.4% | 93.1% | 83.4% | 85.6% | 88.5% |
| 2012 | 94.5% | 93.3% | 84.0% | 84.7% | 84.5% |
| 2013 | 94.2% | 93.3% | 83.9% | 83.5% | 81.2% |
| 2014 | 94.1% | 93.3% | 83.6% | 83.7% | 80.2% |
| 2015 | 94.6% | 93.6% | 87.1% | 88.2% | 85.4% |
- Source: 10% sample of taxfilers in linked T1-Old Age Security databases (5.1M observations)
Family income and employment: Guaranteed Income Supplement take-up decreases with higher family income. For individuals whose family income is below $10,000, take-up was 96% in both 2006 and 2015. Finally, take-up was lowest at 71% and 72% in 2006 and 2015 for individuals with incomes above $20,000. Take-up rates were almost flat for those who earned less than $10,000 per year.Footnote 29 See chart in Annex D.
Canada and Quebec Pension Plan benefits: Take-up was similar for seniors who received Canada or Quebec Pension Plan benefits and for those who did not receive any of those benefits, but diverged slightly between 2014 and 2015. Specifically, those who received the Canada or Quebec Pension Plan benefits in 2015 had a take-up rate for the Guaranteed Income Supplement of 90.5% compared to a take-up of 86.7% for those not receiving either of these pensions.Footnote 30 See graph in Annex H.
Eligibility rate for the Guaranteed Income Supplement: Finally, the proportion of seniors whose income fell below the income cut-off for the Guaranteed Income Supplement declined virtually each year, from 42% in 2006 to 37% in 2015. This result most likely indicates that the incomes of seniors have increased more rapidly than the Guaranteed Income Supplement income cut-offs.Footnote 31
3.2 Changes in the population of eligible non-recipients since 2006Footnote ii
In 2015, most Guaranteed Income Supplement potentially eligible non-recipients were tax filers receiving the Old Age Security pension (77%, or about 186,000 seniors). Another 18% of Guaranteed Income Supplement potentially eligible non-recipients were tax filers who were not receiving the Old Age Security pension (or about 43,000 seniors). Finally, 5% were non-tax filers that were clients of the Old Age Security program (or about 11,000 seniors).
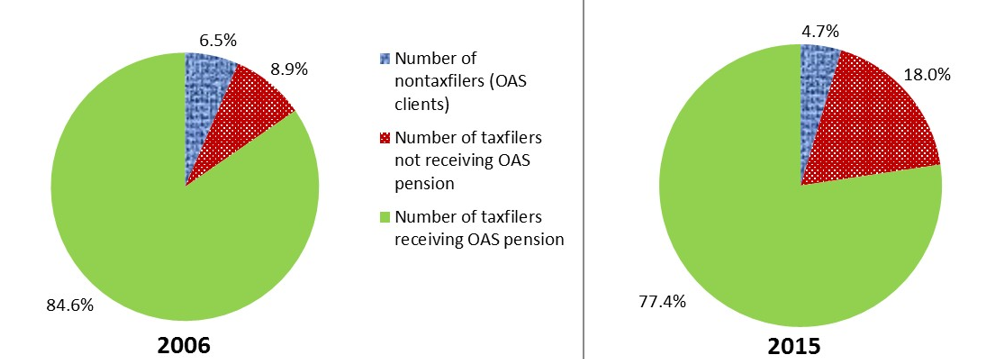
Figure 3 – Text version
| Type of recipients | Percentage |
|---|---|
| Non-tax filers | 6.5% |
| Tax filers not receiving Old Age Security pension | 8.9% |
| Tax filers receiving Old Age Security pension | 84.6% |
| Type of recipients | Percentage |
|---|---|
| Non-tax filers | 4.7% |
| Tax filers not receiving Old Age Security pension | 18% |
| Tax filers receiving Old Age Security pension | 77.4% |
- Source: 10% sample of linked T1-Old Age Security databases (5.2M observations).
Figure 1 indicates that over the 2006 to 2015 evaluation period, the proportion of potentially eligible non-recipients who received the Old Age Security pension had decreased from 85% to 77%. While it is not clear what caused this decrease, it does suggest that receipt of the Old Age Security pension is a key factor among the eligible non-recipient population.Footnote 32
| Characteristic | Guaranteed Income Supplement Eligible non-recipientsFootnote 34 | ||
|---|---|---|---|
| 2006 | 2010 | 2015 | |
| Gender: | |||
| Women | 51.5 | 48.5 | 47.1 |
| Men | 48.5 | 51.5 | 52.9 |
| Marital status: | |||
| Single | 48.8 | 47.8 | 45.7 |
| In couple | 51.2 | 52.2 | 54.3 |
| Age: | |||
| 65 to 69 | 35.2 | 39.0 | 44.1 |
| 70 to 74 | 21.9 | 21.9 | 19.6 |
| 75 to 79 | 16.3 | 14.3 | 12.5 |
| 80 to 84 | 13.2 | 11.8 | 10.4 |
| 85+ | 13.4 | 13.0 | 13.4 |
| Regions: | |||
| Atlantic | 4.1 | 4.9 | 5.0 |
| Quebec | 21.4 | 18.8 | 19.5 |
| Ontario | 43.2 | 45.3 | 43.5 |
| WesternFootnote 35 | 31.2 | 30.8 | 31.7 |
| Northern | 0.1 | 0.2 | 0.2 |
| Urban | 80.5 | 80.5 | 81.4 |
| Rural | 19.5 | 19.5 | 18.6 |
| Real family income (2015 dollars), used to assess Guaranteed Income Supplement eligibility:Footnote 36 | |||
| Less than $10,000 | 17.6 | 20.9 | 22.8 |
| $10,000 to $14,999 | 14.0 | 13.9 | 12.2 |
| $15,000 to $19,999 | 18.7 | 17.1 | 15.3 |
| $20,000 and up | 49.6 | 48.2 | 49.8 |
| Getting Old Age Security pension: | |||
| Yes | 90.5 | 87.8 | 81.2 |
| No | 9.5 | 12.2 | 18.8 |
- Source: 10% sample of tax filers in linked T1- Old Age Security databases (5.1M observations)
Key observations derived from Table 1 include the following:
- there are only slight differences by gender in 2015 (52.9% male; 47.1% female). This is a change from 2006 where 52% of females were among the potentially eligible non-recipients compared to 49% of men
- more potentially eligible non-recipients were living as a couple than as singles in 2006 (51% versus 49%), a difference that has become more pronounced by 2015 (54% versus 46%)
- a higher proportion of seniors between age 65 and 69 were potentially eligible non-recipients in 2006 (35.2%) than those in the older age groups, a difference that has become more pronounced in 2015, where 44% of this age group were among the potentially eligible non-recipients. At the same time, 38% those aged 70 to 79 were also among the potentially eligible non-recipients, declining to 32% in 2015
- Ontario, and to a lesser extent the western provinces, have the highest proportion of potentially eligible non-recipients, both in 2006 and 2015 (43% and 31%)
- the vast majority (80% to 81%) of potentially eligible non-recipients live in urban settings, a finding that has not changed from 2006 to 2015
- the majority (49% to 50%) of potentially eligible non-recipients have family incomes of $20,000 and up, a finding that has not changed from 2006 to 2015Footnote 37, Footnote 38
- finally, the majority of potentially eligible non-recipients are, nonetheless, receiving an Old Age Security pension, although this proportion has diminished from 2006 (91%) to 2015 (81%)
3.3 Changes in Barriers to Take-up of the Guaranteed Income SupplementFootnote iii
Data from the previous section indicate that frequently marginalized groups of seniors such as Indigenous people and those who live in rural areas have rates of take-up for the Guaranteed Income Supplement on par with seniors who are not members of these groups. Despite this, take-up rates still fall below 100%, suggesting that there may still be barriers to be addressed. Therefore, a more in depth examination of barriers particular to these groups were undertaken.Footnote 39
The following barriers to take-up of the Guaranteed Income Supplement were seen by key informants as most noteworthy:Footnote 40
- lack of awareness of the Guaranteed Income Supplement, such as a poor understanding of the amount of the potential benefit
- not filing income tax is seen as hampering a person’s take-up or ongoing receipt of the Guaranteed Income SupplementFootnote 41
- language and literacy barriers that make the application process overwhelming for seniors
- lack of understanding of how the Guaranteed Income Supplement works
- lack of sufficient in-person services to assist people in understanding the program
- barriers unique to Indigenous seniors such as an historical mistrust of government and government programs
Due to the qualitative nature of the evidence, it was difficult to ascertain the level of change; in particular, if there are more barriers since the last evaluation or whether or not their effect has worsened over time. In most cases, respondents provided a very broad assessment of change based on their experiences.
Employment and Social Development Canada policy and program staff at national headquarters, as well as some frontline Service Canada Staff, were more likely to indicate that the barriers to application were diminishing while regional outreach staff and non-governmental stakeholders were more likely to note that barriers are increasing or remaining the same (such as confusion about the Guaranteed Income Supplement and its relation to the Old Age Security pension).Footnote 42
However, many of these same key informants noted that the government’s response to addressing these potential barriers had improved as a result of the following initiatives:
- widespread access to online information (although not all seniors might understand the content due to language and literacy constraints)
- the new Old Age Security toolkit
- mobile outreach for isolated seniors in remote and rural communities
- partnerships with the Canada Revenue Agency for automatic Guaranteed Income Supplement renewalFootnote 43
Where reductions in take-up barriers were noted, they were due primarily to current and upcoming improvements to services such as automatic enrolment.
Some process barriers appear to be ongoing, according to key informants who were interviewed. These include:
- seniors who do not file their income taxes and have no automated transmission of income tax data, making it necessary for clients to provide additional information on their Statement of Income in order for Service Canada to adjust the amount of their Guaranteed Income Supplement as their income changes; and
- seniors who, in rare cases, consider the Guaranteed Income Supplement to be a form of welfare which they do not wish to collectFootnote 44
While these are not direct barriers to take-up, they may have an indirect impact on the take-up rate of the Guaranteed Income Supplement.
Among the factors that were noted as getting worse since the previous evaluation were the following:
- a general lack of awareness of the Guaranteed Income Supplement among some organizations that provide support for seniorsFootnote 45
- a reduction in the number of community site visits by Service Canada staffFootnote 46
In addition, contextual factors are seen to have become more challenging since the last evaluation. While these factors are not the responsibility of the program, they do point to the need to plan for future challenges with regard to demand for the Guaranteed Income Supplement. These factors include the following:
- the increase in the number of individuals reaching the age of 65, thus requiring additional resources to determine eligibility, conduct outreach, and assist in overcoming the multiple barriers to take-up of that benefitFootnote 47
- a perceived increase in the number of homeless or near-homeless seniors as well as the number of seniors who are living alone or who are otherwise socially isolatedFootnote 48
Efforts to remove barriers
Key informants from Employment and Social Development Canada and Service Canada also indicated how barriers were being addressed. Much of the improvements were already underway with the implementation of the department’s Service Improvement Strategy. These include such things as:
- better outreach to seniors’ organizations
- an integrated Old Age Security/Guaranteed Income Supplement application (so that applicants do not have to wait for and fill out a separate application for the Guaranteed Income Supplement)Footnote 49
- easier access to client income information (to assess eligibility changes)
- automatic enrolment for the Guaranteed Income Supplement for those who are automatically enrolled into the Old Age Security pensionFootnote 50
3.4 Barriers to take-up specific to vulnerable populations and barriers common to all groupsFootnote iv
Barriers specific to immigrant seniors
Quantitative evidence indicates that immigrants have a higher take-up rate. The most recent data indicate that, in 2015, immigrants who immigrated 10 to 25 years ago had a rate of 96% compared to 89% for those who immigrated more than 25 years ago or who were non-immigrants.Footnote 51 In addition, data from the 2010 National Household Survey indicates that immigrants had a take-up rate of 94% compared to 87% for those born in Canada. Footnote 52Despite this, qualitative data indicates that barriers still exist.
These barriers include such issues as, language, isolation (for example, living alone), not having sufficient networks to help with application procedures, cultural norms preventing seniors from applying for, or knowing about, government assistance, and lack of supporting documentation with regard to residence in Canada.
Organizations working with immigrant seniors in Vancouver report that seniors are becoming more isolated, there are fewer adult children living with their senior parents, and those children may not live in Canada. Organizations in Ottawa and Vancouver indicated that some immigrant seniors are at risk of becoming homeless because of the rising cost of living in these cities.
In addition, application problems can arise among seniors who are not fluent in English or French or who rely on relatives who, themselves, have trouble understanding the application process. Indeed, organizations that serve seniors in Vancouver indicated that they often have problems finding interpreters. Finally, immigrant widows are also more vulnerable to a lack of support as they often have little knowledge about their financial situation, if their partner handled their finances.Footnote 53
Many immigrant seniors, particularly men, are not willing to request income assistance because of pride and fear it may damage their reputation, and it may cause them to choose not to apply for the Guaranteed Income Supplement. Cultural norms may also dictate that they rely on their children to support them financially; hence, they are not aware or interested in income assistance programs.Footnote 54
Organizations that support seniors noted that immigrant seniors may have a lower level of awareness of Canadian social programs and benefits. In many cases, they are not familiar with this concept as their home countries may not have equivalent programs. There is also confusion regarding different government programs (such as, Canada Pension Plan, Old Age Security program) and whether or not the application process is integrated for all of them. Immigrant seniors who have a certain amount of institutional integration (for example, live in social housing or frequent religious institutions) often have better awareness of these programs. Footnote 55However, seniors and their relatives may not be aware of the various programs that are available to seniors, including the Guaranteed Income Supplement.
Another barrier unique to immigrant seniors is their lack of documentation regarding the number of years of residence in Canada, such as re-entry documentation and history of residence.Footnote 56 Community organizations serving this client base indicated that they needed to contact agencies such as Service Canada or the Canada Revenue Agency in order to fill in information gaps or enquire regarding proper documentation. For example, they may have to request official income informationFootnote 57 from Service Canada or Canada Revenue Agency, as appropriate.Footnote 58, Footnote 59
Focus group participants noted that filing income tax on time may be an issue for immigrant seniors who travel abroad for extended periods and may forget to file their income tax in Canada and miss the opportunity to renew the Guaranteed Income Supplement while they are abroad.Footnote 60, Footnote 61
Barriers specific to Indigenous seniors
The most recent data indicates that, in 2010, Indigenous seniors had rate of 91% compared to 89% for non-Indigenous seniors.Footnote 62, Footnote 63
According to key informant interviews, Indigenous seniors may not be well informed about government supports to which they are entitled and their associated programs. This is most likely related to language, literacy and cultural/historical context. This is particularly a concern among Indigenous seniors who live on reserves, where band offices were seen by key informants interviewed as not being as well informed about services to seniors.Footnote 64
Stakeholders interviewed noted that a key challenge for Indigenous seniors is often proper identification that is frequently lost. For example, some community organizations, such as shelters, have arrangements to hold on to identification for some of their clients. Some interviewees indicated that identification is required to open a bank account, which they thought was a requirement to apply for the Guaranteed Income Supplement (in fact, a bank account is not required to apply for the Guaranteed Income Supplement).Footnote 65, Footnote 66
Some Indigenous seniors may have difficulty with the application process, according to organizations that provide them support. One key informant underlined that Indigenous seniors may not understand government terms in their native language.Footnote 67
A mistrust of government was also noted, by service staff, among Indigenous seniors who are residential school survivors, or have had other negative experiences with government. It may manifest itself as reluctance for providing information to government, or a fear of giving up something or some part of themselves.Footnote 68 This can also be a factor in filing income taxes since Indigenous seniors may not wish to communicate with government out of concern that they owe the government money, or believe they should not have to pay taxes on income because of their status as Indigenous peoples.Footnote 69
Finally, some Indigenous seniors cannot provide the documentationFootnote 70 that is required to prove Canadian residency as many travelled back and forth to the United States. As 1 stakeholder noted:
“The feedback I get from clients is that [this] is discrimination because there is no respect for our right to live in North America. Service Canada has no respect for the fact that we have dual citizenship so we can live in Canada and the U.S [since]…..for us, as Native American people, there is no border”.Footnote 71
Barriers specific to homeless or near-homeless seniors
Homelessness among seniors is difficult to quantify. Estimates of this population range from 6% of visible homeless in Canada for those over the age of 65 and 9% for those over the age of 55.Footnote 72
Beyond not having a fixed address, homeless or near homeless seniors experience barriers such as lack of awareness or understanding of the Guaranteed Income Supplement, low literacy skills, or lack proper identification, according to organizations that work with them. These seniors do not have a reliable way for information to reach them, instead relying on homeless shelters. Similarly, it is difficult for homeless and near homeless individuals to file income taxes. For them, daily life is not structured, they may not be sufficiently organized, and tax filing is not a priority.Footnote 73, Footnote 74
Finally, homeless and transient individuals often do not have a bank account, which in many cases is linked to a lack of proper identification. This can make it difficult for them to receive government benefits (with the exception of those who have a trustee).
Regional Outreach staff indicated that outreach activities designed to help seniors are delivered by service delivery personnel who are generalists and are not responsible for processing applications. Homeless/near-homeless seniors not only want to know about the benefit, they want to know how to go about applying for it.
Finally, organizations that work with the homeless or near homeless indicated that their clients sometimes like to delay applying for the Guaranteed Income Supplement to receive a larger, lump sum. However, they sometimes delay for too long, as the retroactive payment can only be for 12 months.Footnote 75
Other barriers
- A sense of stigma among seniors who are separated (due to differing care needs) and, as a result, find it difficult to seek financial assistance.Footnote 76
- Not understanding that an application to the Old Age Security did not (at the time of the interview) mean an automatic application to the Guaranteed Income Supplement.Footnote 77
- LGBTQ seniors may experience difficulty filing as a couple due to past stigma associated with the definition of a couple (married or otherwise) or because they may still not be ‘out’.Footnote 78
Barriers common across different groups
Benefit renewal issue
- Despite the fact that Service Canada will continue to review a client’s file for annual benefit entitlement, it is still important that income taxes are filed on time, each year.Footnote 79 As noted above, there is a small percentage of seniors who do not file timely income tax information.
Awareness/accuracy of information
- Stakeholders noted that the abbreviated title “GIS” does not convey the purpose of the program well, and seniors may think it is not applicable to them.Footnote 80
- Inaccurate information may circulate within personal networks about who is eligible for the Guaranteed Income Supplement and under what circumstances. Incorrect perceptions may arise that the Guaranteed Income Supplement might put other social benefits provided by different levels of government in jeopardy.
- 44% of eligible non-recipients were not aware of the Guaranteed Income Supplement, according to a Service Canada Survey.Footnote 81
Application process issues
- Seniors often find the application process challenging (for example, having to look for and provide supporting information) and the forms difficult to follow.
- Low literacy (including low financial literacy) can make understanding the benefit and the application process difficult. This was noted as more common among men.
- Difficulties with understanding forms available online, long waits for telephone services, or not having sufficient experience with internet technology, make the access of forms available online a challenging process.
- Difficulty getting to Service Canada offices (for example, lack of reliable transportation).
- Insufficient amount of one-on-one assistance/in-person service with regard to filling out application forms.
One of the issues heard most often from front-line service staff with regard to Guaranteed Income Supplement-eligible seniors was their decision to not file income taxes. Income tax returns are a key source of information for a person’s income. While it is not a requirement for applicants or recipients to file income tax, as they are able to declare their income in their application, it is important information used to automatically assess entitlement. However, administrative data indicate that only about 1.5% of seniors are non-tax filers (an estimated 11,000, or 5%, of Guaranteed Income Supplement-eligible non-recipients). Thus, while the problem is small in numerical terms, the effects of not filing income tax can put some eligible seniors at a disadvantage.Footnote 82, Reasons for non-filing among seniors include a sense that the process is overwhelming (a common finding among those with low literacy skills) or the belief that filing an income tax return is not relevant if one does not owe any taxes.Footnote 83,
3.5 The effectiveness of actions taken to reach different groupsFootnote v
Automatic renewal was seen as an important step toward increasing take-up of the Guaranteed Income Supplement since the last evaluation was begun in 2006. Prior to 2007, the Old Age Security Act required individuals to reapply for the GIS if there was a break in eligibility (for example, because the annual income was too high). Amendments to the Act in 2007 remedied this situation such that an individual would not need to reapply even if they became ineligible one year. However, the 2007 amendments were not fully implemented until 2015.Footnote 84, Footnote 85, Footnote 86
The program has conducted regular Guaranteed Income Supplement Take-up mailings targeting potentially eligible seniors. These were effective at reaching potentially eligible seniors who file their taxes.Footnote 87
Other evidence specifies the utility of current efforts. For example, a survey of low-income seniors by Service Canada asked what could be done to better reach seniors and provide important information about the Guaranteed Income Supplement. Findings include the following:
- 40% had no suggestion
- 28% indicated they would like to receive more mail outs sent with information about benefits
- 5% indicated they would like a stronger partnership between Employment and Social Development Canada and the Canada Revenue Agency to help share information related to eligibility
- 2% indicated that correspondence should be simplifiedFootnote 88
On the other hand, stakeholders that were interviewed for the evaluation noted that, on their own, mail-outs were not the best way to reach seniors; low literacy, language issues, lack of fixed addresses and difficulty with understanding government documents were noted as barriers.Footnote 89
However, mail-outs were still seen as useful initiatives overall, insofar as they can provide general awareness of the existence of the Guaranteed Income Supplement. Mail-outs were seen as most useful when coupled with targeted, in-person outreach activities, particularly in the case of Indigenous and homeless or near-homeless seniors.
Community organizations noted the utility of outreach to those who help deliver services to seniors. Group information sessions to seniors were seen as useful, particularly when it is experienced as an opportunity for seniors to interact with one another.Footnote 90 In addition, representatives of community organizations noted that including Guaranteed Income Supplement information with Old Age Security and T4 mail-outs was helpful.
Finally, mail-outs were seen as more beneficial than either telephone calls or emails, due to limited use of such technologies by seniors and suspicion of potential fraud.
Key informants noted that the groups most often facing challenges with regard to the Guaranteed Income Supplement were non-tax filers. However, seniors with language, literacy, mobility, mental health, and income barriers, including the homeless, were seen as the most challenging subgroup of non-tax filers. While these seniors might benefit from free tax clinics, pilot projects or outreach and information sessions, it is unclear whether they actually use the information to file Guaranteed Income Supplement applications since no follow up is done.
Information sessions were considered least effective in reaching vulnerable seniors with low literacy skills since they often do not have the capacity or knowledge to understand the information provided and are less likely to act on it. Almost all respondents felt that what was preferable was information with personal assistance to complete an application.
While technological improvements were seen as enhancing the distribution of information and awareness of the program, it was seen as benefiting more educated, computer literate seniors.
However, these initiatives were seen as being most beneficial for people already in the broader system (for example, income tax filers and Old Age Security recipients). It was not seen as potentially beneficial for vulnerable groups who may not already be in the system, such as the homeless or near-homeless.
3.6 The impact of the different measures to increase take-upFootnote vi
Since the last evaluation, the program has taken the following key measures with a view to improving the program:
- automated the renewal process for the Guaranteed Income Supplement
- creation of an “Increase the Take-up of the Guaranteed Income Supplement Action Plan”
Interviews with key informants with direct contact with seniors indicated a number of activities that were seen as effective at increasing take-up. These included:
- information sessions on seniors’ benefits for low income clients and First Nation clients on reserve
- Free Tax clinics especially in First Nation communities where low income seniors lack finances to file taxes
- partnerships with the Canada Revenue Agency to permit auto-renewal for the Guaranteed Income Supplement
- a pilot project in which a toolkit was provided to organizations or partners who help vulnerable seniors file pension forms
- Canada Revenue Agency outreach encouraging community groups to sign up as volunteer tax preparation centers. This will result in more tax filers and potentially more eligible recipients
- allowing homeless people the opportunity to apply using third party due to mental health or physical disability
- hands-on application sessions
- outreach to seniors facing language or geographic barriers (including those in care facilities)
By and large, the initiatives seen by key informants as having the most positive effects are activities that are being implemented or are already in place, including:
- the Guaranteed Income Supplement automatic enrolment
- partnering with the Canada Revenue Agency to permit automatic renewal
- the integrated Old Age Security/Guaranteed Income Supplement application
- Guaranteed Income Supplement simplification initiatives and data sharing with the Canada Revenue AgencyFootnote 91
Initiatives undertaken after the evaluation began may have contributed to an increase in Guaranteed Income Supplement take-up. In July 2015, as a result of the Old Age Security online system improvements, over 2 million Old Age Security pensioners had their Guaranteed Income Supplement entitlement automatically calculated and their benefits automatically paid. The clients received a Guaranteed Income Supplement reward letter informing them of their new entitlement.Footnote 92
As of August 2017, 48,993 Guaranteed Income Supplement applications have been approved and the applicants had been declared “Guaranteed Income Supplement for Life,” as a result of a November 2016 Guaranteed Income Supplement take-up mailing.
It is likely that automatic enrolment and the integrated Old Age Security-Guaranteed Income Supplement application will result in significant increases in future take-up. Recent (2015) estimates of take-up for the Guaranteed Income Supplement do not include changes to the program that have recently been implemented (such as, automatic enrolment)Footnote 93 or had not yet been fully implemented at the time of the evaluation (for example, integrated Old Age Security-Guaranteed Income Supplement application).Footnote 94 However, evidence from Old Age Security administrative data and key informant interviews suggest that efforts to increase the take-up rate are successful. Despite the overall constancy of take-up rates between 2006 and 2015, there has been an increase observed between 2014 and 2015 among most demographic groups but particularly among those who live in Ontario as well as the western and northern regions and for those with annual incomes of $15,000 and over.
One key informant reported outreach for specific subgroups of seniors (who were in the tax system) has already begun. Recent figures, provided by the key informant for December 2016, show outreach to 9,449 single individuals; 5731 individuals whose spouse or common-law partner receive the Old Age Security pension; and 2,872 individuals whose spouse or common-law partner does not receive the Old Age Security pension but are eligible for the Allowance.Footnote 95
3.7 Take-up rate among all eligible seniors between 2006 to 2015
Challenges exist in estimating the take-up rate because, on its own, the program administrative data is not capable of providing a clear picture of the seniors who are eligible for the Guaranteed Income Supplement but, nevertheless, do not receive it. For this reason, the evaluation uses complementary sources of data, such as income tax data from the Canada Revenue Agency, to better understand this population (further elucidated in Section 3.2).
The take-up rateFootnote 96 has remained fairly constant over the period 2006 to 2015, averaging 89%, with a mean deviation of less than 1 percentage point.Footnote 97 The only exception was between the 2 last years, during which there was a more noticeable uptick in the take-up rate (from 87% in 2014 to 90% in 2015).Footnote 98 Figure 4 shows the official rates, calculated using the Longitudinal Administrative Databank and take-up rates calculated from the Old Age Security administrative data/Canada Revenue Agency linked data used for this evaluation. The official rates only include tax-filers. We present rates 2 ways: for tax-filers only and for tax-filers and non-tax filers combined.
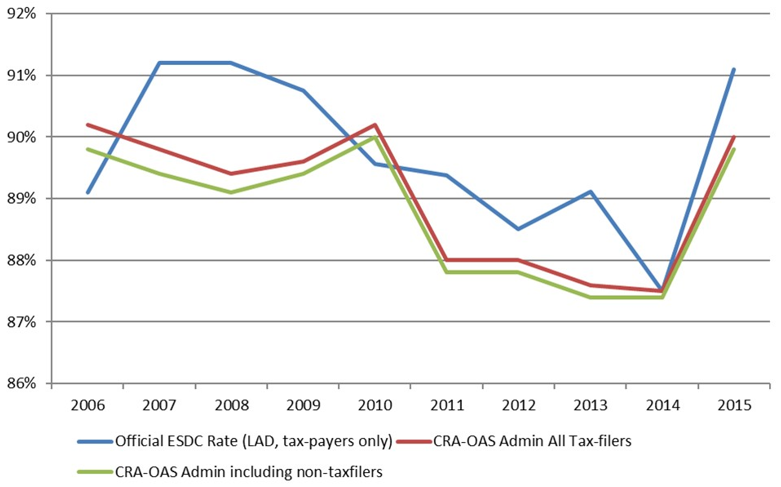
Figure 4 – Text version
| Year | Official ESDC Rate (LAD, tax-payers only) | CRA-OAS Admin All Tax-filers | CRA-OAS Admin including non-taxfilers |
|---|---|---|---|
| 2006 | 89.1% | 90.2% | 89.8% |
| 2007 | 91.2% | 89.8% | 89.4% |
| 2008 | 91.2% | 89.4% | 89.1% |
| 2009 | 90.7% | 89.6% | 89.4% |
| 2010 | 89.6% | 90.2% | 90.0% |
| 2011 | 89.4% | 88.0% | 87.8% |
| 2012 | 88.5% | 88.0% | 87.8% |
| 2013 | 89.1% | 87.6% | 87.4% |
| 2014 | 87.5% | 87.5% | 87.4% |
| 2015 | 91.1% | 90.0% | 89.8% |
- All estimates include both Old Age Security pension recipients and non-recipients
To better understand what would be an ideal take-up rate, it is useful to have a benchmark for comparison. Annex B shows take-up rates of comparable programs among countries that have economic and social characteristics comparable to those of Canada; United States, United Kingdom, and New Zealand.
Several comparisons are noteworthy. First, the take-up of the Guaranteed Income Supplement in Canada is higher for almost all comparable benefits from the countries selected, with the exception of New Zealand. Second, New Zealand’s pension is not income tested, unlike the Guaranteed Income Supplement. These findings suggest that the take-up rate in Canada is quite high compared to other countries.
Despite this comparatively high take-up rate, there are still an estimated 10% of eligible seniors who did not receive the Guaranteed Income Supplement in 2015. To address this, the Longitudinal Administrative Databank analysis was used to include the impact of people’s income.Footnote 99
Analysis using data from 2015 (the last period of observation for this evaluation) showed that seniors who are eligible for the Guaranteed Income Supplement, but who do not receive it, are mostly in one of the 4 categories:
- seniors whose spouse did not receive the Old Age Security because the spouse is still under 65 (27.7%)Footnote 100
- recent Old Age Security pensioners (it is possible that they may not yet be aware of the Guaranteed Income Supplement) (28.2%)
- seniors with rental or self-employment income whose income tends to be more variable and, therefore, exclusion from the Guaranteed Income Supplement may be temporary (20.9%), and
- pensioners (6.8%) whose income is just under the income cut-off level, in which case ineligibility may be temporary and the supplement not significant (less than $250 per year)Footnote 101
Finally, the majority of tax filing seniors who are eligible for the Guaranteed Income Supplement but do not receive it still receive the Old Age Security pension; take-up of the Old Age Security pension among this group was estimated to be above 81% in 2015 (although there is a decline from 87% in 2014).Footnote 102
Annexes
Annex A: Methods and data limitations
Document review: A review of program and service delivery documentation such as, internal research conducted for the Department on the topic of Guaranteed Income Supplement take-up, Service Delivery Bulletins related to Guaranteed Income Supplement take-up initiatives, Departmental Performance Reports, and documents related to initiatives to improve take-up of the Supplement.
Key informant interviews: Interviews with Employment and Social Development Canada and Service Canada National Headquarters staff, regional outreach staff, Service Canada Processing Centre senior staff, current and potential outreach partners, and advocacy groups who serve seniors. The purpose of these interviews was to add further context to recent Guaranteed Income Supplement take-up initiatives and to provide information related to the difficulties some people face in accessing the benefit.
Data analyses: The evaluation used a linked database of Old Age Security/Guaranteed Income Supplement program administrative data and Canada Revenue Agency T1 income tax data to examine trends in Guaranteed Income Supplement take-up among tax filers and non-tax filers. This analysis represents the most direct information on those eligible for the Guaranteed Income Supplement and provided data for the entire period that the evaluation covers (2006 to 2015).
The evaluation also used 2 separate Statistics Canada data sources – the 2011 National Household Survey and the Longitudinal Administrative Databank. These sources provided further take-up information on tax filers not receiving the Guaranteed Income Supplement as well as information on Indigenous seniors. The Longitudinal Administrative Databank also provided information for immigrants.Footnote 103
Stakeholder discussion groups: Focus groups were held with representatives of organizations that work with Indigenous people, immigrant populations and homeless or near-homeless seniors to better understand why some Guaranteed Income Supplement-eligible seniors are not receiving the benefit.
Service Canada Survey: This survey was part of the “Increasing Guaranteed Income Supplement Take-Up Action Plan”. The survey interviewed a random sample of clients who received Guaranteed Income Supplement application packages. Participants were asked why they had not previously applied for the Guaranteed Income Supplement, their awareness of the program, the ease of completing the application, and who they turned for assistance.
Data limitations
The objective was not to determine the ultimate program outcomes such as the reduction of poverty among the elderly vulnerable population. The focus in this evaluation was to assess barriers to the take-up rate and examine various changes in the demographics of GIS recipients over a specified period of time. There were limitations to the data used to provide evidence to this evaluation. These limitations were sufficiently mitigated to ensure that the findings from the evaluation could be confidently used for future policy and program development.
Document review: Information available was limited and the evaluation would have benefited from additional information, including on the following:
- the most recent reports on Old Age Security/Guaranteed Income Supplement administrative data and statistics
- internal data to identify areas with a high proportion of vulnerable seniors’ populations and areas with low Guaranteed Income Supplement take-up among eligible seniors. In several cases, it was possible to extract relevant information from other lines of evidence, such as the key informant interviews
Key informant interviews: As these are qualitative interviews using availability sampling, they are not meant to be generalized to their respective populations. In addition, some key informants had not been in their current job for the entire period of this evaluation. This means that responses to specific questions assessing changes in barriers between 2006 and 2015 were less comprehensive. However, using administrative data that spanned this period to complement the qualitative information helped to address this limitation.
Old Age Security/Guaranteed Income Supplement/Canada Revenue Agency T1 income tax data: These data sources contained limited information on immigrant seniors.
National Household Survey: This was a substitute for the initially planned long-form census that was scheduled to be undertaken by Statistics Canada in 2010. Census data is far more reliable as it obtains information from the full population and achieves a more representative sample.Footnote 104
Stakeholder discussion groups: These were limited to the extent that they did not directly interview Guaranteed Income Supplement recipients or potentially eligible non-recipients. Potentially eligible non-recipients were interviewed for the Service Canada Survey and will be further studied in Phase 2.
Annex B: International take-up rates of Guaranteed Income Supplement-like Programs
| CountryFootnote 105 | Benefit | Main features | Requirements for enrolment | Take-up rate |
|---|---|---|---|---|
| New Zealand | New Zealand Superannuation | Not income tested pension. Can be applied for two weeks before an applicant turns 65. |
|
90.1% in 2013.Footnote 106 |
| United Kingdom | Pension Credit – Guarantee Credit | Weekly top up payment for seniors with a low weekly income. |
|
61% in 2015/16.Footnote 107 |
| United States | Supplemental Security Income | Monthly payments to Social Security recipients who have a low income and few resources. |
|
57.9% in 2015 for seniors.Footnote 108 |
Annex C: Guaranteed Income Supplement take-up rates for low income tax filers receiving the OAS
| Year | Take-up rate (%) |
|---|---|
| 1993 | 84.2 |
| 1994 | 84.1 |
| 1995 | 86.1 |
| 1996 | 86.7 |
| 1997 | 86.9 |
| 1998 | 86.1 |
| 1999 | 86.9 |
| 2000 | 87.0 |
| 2001 | 87.3 |
| 2002 | 91.3 |
| 2003 | 91.6 |
| 2004 | 91.0 |
| 2005 | 93.2 |
| 2006 | 91.5 |
Annex D: Take-up rates, 2006 to 2015
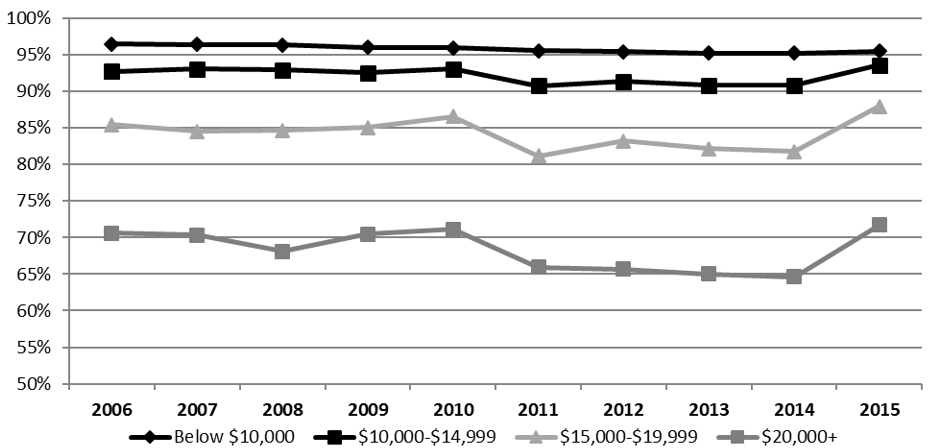
Figure 5 – Text version
| Year | Below $10,000 | $10,000-$14,999 | $15,000-$19,999 | $20,000+ |
|---|---|---|---|---|
| 2006 | 96.5% | 92.7% | 85.5% | 70.6% |
| 2007 | 96.4% | 93.0% | 84.5% | 70.4% |
| 2008 | 96.3% | 92.9% | 84.6% | 68.1% |
| 2009 | 96.0% | 92.5% | 85.0% | 70.5% |
| 2010 | 95.9% | 93.0% | 86.6% | 71.1% |
| 2011 | 95.6% | 90.8% | 81.2% | 66.0% |
| 2012 | 95.4% | 91.4% | 83.2% | 65.7% |
| 2013 | 95.2% | 90.8% | 82.2% | 65.0% |
| 2014 | 95.2% | 90.8% | 81.8% | 64.6% |
| 2015 | 95.5% | 93.6% | 87.9% | 71.7% |
- Source: 10% sample of taxfilers in linked T1-OAS databases (5.1M observations)
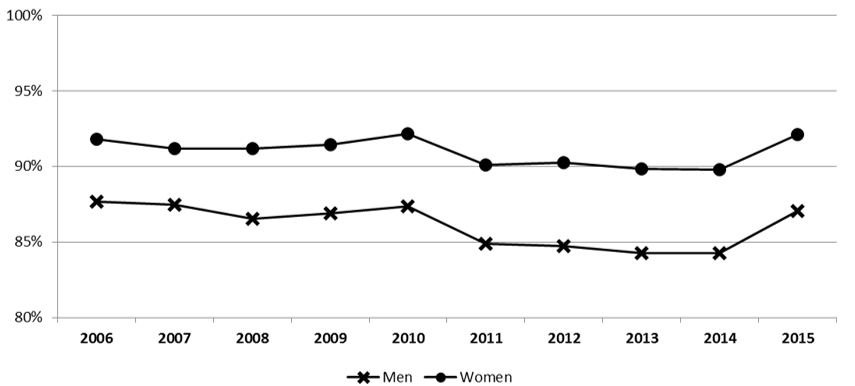
Figure 6 – Text version
| Year | Men | Women |
|---|---|---|
| 2006 | 87.7% | 91.8% |
| 2007 | 87.5% | 91.2% |
| 2008 | 86.5% | 91.2% |
| 2009 | 86.9% | 91.4% |
| 2010 | 87.3% | 92.1% |
| 2011 | 84.9% | 90.1% |
| 2012 | 84.7% | 90.2% |
| 2013 | 84.3% | 89.8% |
| 2014 | 84.3% | 89.8% |
| 2015 | 87.1% | 92.1% |
- Source: 10% sample of taxfilters in linked T1-OAS databases (5.1M observations
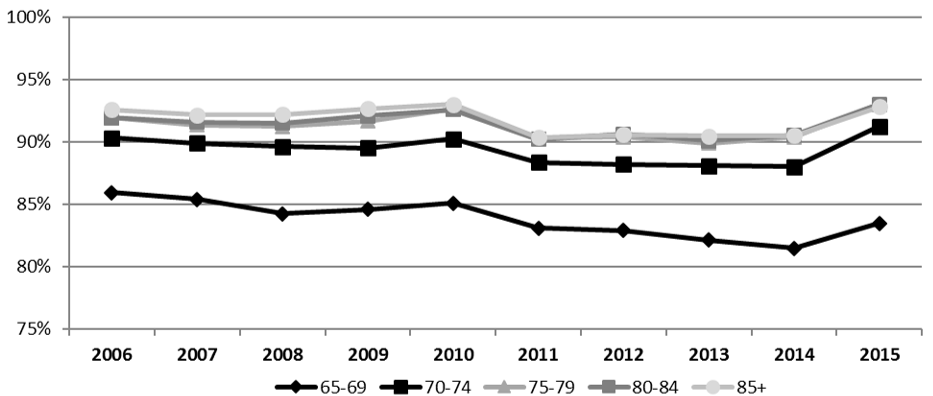
Figure 7 – Text version
| Year | 65 to 69 | 70 to 74 | 75 to 79 | 80 to 84 | 85 or more |
|---|---|---|---|---|---|
| 2006 | 85.9% | 90.3% | 91.9% | 91.9% | 92.6% |
| 2007 | 85.4% | 89.9% | 91.4% | 91.6% | 92.2% |
| 2008 | 84.3% | 89.6% | 91.2% | 91.5% | 92.2% |
| 2009 | 84.6% | 89.5% | 91.7% | 92.1% | 92.7% |
| 2010 | 85.1% | 90.2% | 92.6% | 92.6% | 93.0% |
| 2011 | 83.1% | 88.4% | 90.3% | 90.2% | 90.4% |
| 2012 | 82.9% | 88.2% | 90.4% | 90.6% | 90.6% |
| 2013 | 82.1% | 88.1% | 89.9% | 90.1% | 90.5% |
| 2014 | 81.5% | 88.0% | 90.4% | 90.6% | 90.5% |
| 2015 | 83.5% | 91.2% | 93.0% | 93.0% | 92.8% |
- Source: 10% sample of taxfilers in linked T1-OAS databases (5.1M observations)
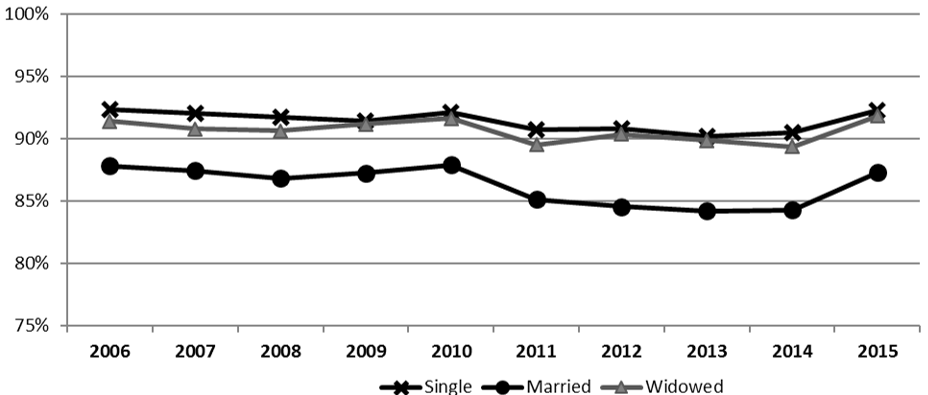
Figure 8 – Text version
| Year | Single | Widowed | Married |
|---|---|---|---|
| 2006 | 92.4% | 91.4% | 87.8% |
| 2007 | 92.0% | 90.8% | 87.4% |
| 2008 | 91.7% | 90.6% | 86.8% |
| 2009 | 91.4% | 91.2% | 87.2% |
| 2010 | 92.1% | 91.6% | 87.9% |
| 2011 | 90.7% | 89.5% | 85.2% |
| 2012 | 90.8% | 90.3% | 84.6% |
| 2013 | 90.2% | 89.9% | 84.2% |
| 2014 | 90.5% | 89.4% | 84.3% |
| 2015 | 92.3% | 91.8% | 87.3% |
- Source: 10% sample of taxfilers in linked T1-OAS databases (5.1 observations)
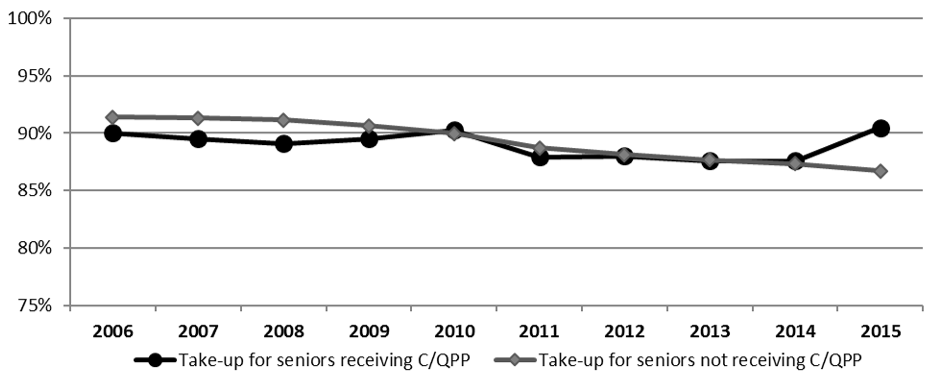
Figure 9 – Text version
| Year | Take-up for seniors receiving C/QPP | Take-up for seniors not receiving C/QPP |
|---|---|---|
| 2006 | 90.0% | 91.4% |
| 2007 | 89.5% | 91.3% |
| 2008 | 89.1% | 91.1% |
| 2009 | 89.5% | 90.6% |
| 2010 | 90.3% | 90.0% |
| 2011 | 87.9% | 88.7% |
| 2012 | 88.0% | 88.1% |
| 2013 | 87.6% | 87.7% |
| 2014 | 87.6% | 87.3% |
| 2015 | 90.5% | 86.7% |
- Source: 10% sample of taxfilers in linked T1-OAS databases (5.1M observations)
Annex E: Evaluation matrix for the Guaranteed Income Supplement take-up evaluation
- How have the types of potentially eligible non-recipients of the Guaranteed Income Supplement evolved since 2006?
- Phase 1:
- SIR-CRA-OASFootnote 109
- LAD
- Phase 2:
- Census
- Phase 1:
- How has Guaranteed Income Supplement take-up changed since 2006 and, in particular, how has it changed for vulnerable populations (for example, immigrants, Indigenous people, those living in remote communities, etc.)?
- Phase 1:
- NHS
- SIR-CRA-OAS
- LAD
- Phase 2:
- Census
- Phase 1:
- Have the barriers to take-up among Guaranteed Income Supplement-eligible seniors changed since the previous Guaranteed Income Supplement take-up evaluation?
- Phase 1:
- Service Canada survey
- Key informants
- Discussion groups
- Phase 2:
- Evaluation survey
- a. Which barriers are common to all and which barriers are specific to certain vulnerable populations (for example immigrants, Indigenous people, those living in remote communities, etc.)?
- Phase 1:
- Service Canada survey
- Key informants
- Discussion groups
- Phase 2:
- Evaluation survey
- Phase 1:
- How effective were actions taken to reach different groups?
- Phase 1:
- Doc review
- Key informants
- Discussion groups
- Phase 2:
- Evaluation survey
- a. What was the impact (for example on take-up, awareness, understanding, etc.) of the different measures?
- Phase 1:
- Doc review
- Key informants
- Discussion groups
- Phase 2.
- Evaluation survey
- Phase 1:
Annex F: Barriers to take-up of the Guaranteed Income Supplement
Barriers to take-up are both quantitative (such as, how much change) and qualitative (such as, what kind of change). Qualitative barriers noted in the lines of evidence fall into 4 overall categories: structural barriers, skills barriers, process barriers, application barriers. Of these, structural barriers are probably the most noteworthy change since the last evaluation, given that they point to major changes in demographics or economic situation that has affected the number of seniors and their level of need.
Structural factors
As noted above, these are factors that, if they affect take-up, do so indirectly. In addition, given that they are structural in nature, they cannot be addressed by the Department. However, we report them because they were seen as important contextual issues, particularly by front-line service providers.
Key informants noted a number of issues that made income support for low-income seniors a more pressing issue. These issues exist at the demographic, economic or sociological level, such as increases in the number of seniors in Canada. Stakeholders who provided services to seniors indicated that our aging population requires additional resources to determine eligibility, conduct outreach, and assist in overcoming other barriers to take-up. For example, stakeholders in Vancouver indicated that the city’s rapid influx of immigrant seniors was noted as a challenge for community organizations currently to serve.Footnote 110 In addition, organizations working with Indigenous, immigrant, and homeless or transient seniors in Toronto, Winnipeg, and Vancouver also indicated that the cost of living has caused increased housing insecurity in recent years, forcing seniors to move more frequently, and forcing more seniors into homelessness.Footnote 111 Indeed, increases in the number of homeless seniors with addiction and mental health issues resulted in a greater demand for help in ensuring that forms are filled out and Guaranteed Income Supplement entitlement is reassessed. Finally, key informants who worked with seniors indicated that more seniors live by themselves, particularly among immigrants and Indigenous; they contend that this tends to negatively affect program awareness among those who are potentially eligible for the Guaranteed Income Supplement.
Key informants also noted that, regardless of eligibility, people cannot be put into pay for the Guaranteed Income Supplement unless they actually apply.Footnote 112 Even when applications are made, lack of staff and heavy workloads tended to delay payments (although this does not affect take-up, as payments are retroactive).
Finally, there were instances where, despite knowledge of the program and its requirements, some seniors chose not to apply for the Guaranteed Income Supplement despite their eligibility. In most cases, this decision related to social or cultural reasons, such as when people chose to take vows of poverty (for example, religious orders) or when people associated the Guaranteed Income Supplement with a form of social welfare payment that they wanted to avoid due to their own sense of stigma.Footnote 113
Skills barriers
These barriers are those, such as language, that make it difficult for individuals to apply for, or even comprehend the details of, the Guaranteed Income Supplement. However, unlike structural barriers, these are factors that can potentially be addressed by the program itself via education and outreach.
As mentioned above, key informants noted that the increase of immigrant seniors to cities like Vancouver produces barriers to Guaranteed Income Supplement take-up, often because of language barriers. Non-governmental organizations serving seniors have noted that an influx of seniors from other countries makes it difficult to provide information and services when translators may be difficult to acquire.Footnote 114 Language and literacy problems can make it difficult for potential clients to fill out forms necessary for applying for the Guaranteed Income Supplement.Footnote 115 Outreach agencies that provide services to seniors suggested that communication and information tools should strive more to address the varied cultural experience of many seniors; information could be more accessible if it were presented as “case scenarios” that might make the information more accessible to a wider audience.Footnote 116 That said, data collected in 2010 show that immigrants report a higher rate of Guaranteed Income Supplement take-up (93.5%) compared to those born in Canada (87.0%).Footnote 117 Whether key informants are speaking about more recent events, or that they are focussing on the most difficult cases, is difficult to ascertain. Certainly, both findings – higher take-up among immigrants and greater challenges reaching immigrants - can both be true.
Other barriers relate to potential recipients lack of understanding of the specifics of the Guaranteed Income Supplement program. Program staff noted things such as lack of knowledge regarding the Canada Revenue Agency’s Voluntary Disclosure Program (which allows people to correct previous tax filings);Footnote 118 misunderstandings regarding the income threshold and how it affects one’s entitlement, not understanding how income changes can be claimed immediately rather than waiting for official confirmation via income tax assessments; and not understanding how involuntary separation (as when spouses need to live apart due to differing care needs) can change entitlement status due to changes in how income status is assessed.Footnote 119 In some cases, seniors will not apply for the Guaranteed Income Supplement because they perceive the amount of the benefit to be too low for them to bother.
Living in remote areas was seen as having a detrimental effect on access to, and understanding of, the Guaranteed Income Supplement. Accessing Guaranteed Income Supplement information online was seen as difficult for some who live in remote areas, particularly for those in First Nations communities. Program staff noted that the move to put information online has resulted in reduced availability of printed material, which they often saw as deleterious to those who lived in remote areas.Footnote 120 Perhaps related is the observation, by Service Canada staff, that seniors often prefer to come into service centres in person rather than to use specialized call centres and online resources, although the specific reasons behind this preference were unknown by interviewees. Interestingly, in-person staff may, themselves, need to consult with call centres at times to search for more specific information required to solve a client’s problem.
Process barriers
These are barriers that exist on the side of the service provider, be it Service Canada, Employment and Social Development Canada, or the Canada Revenue Agency. They are not related to the performance of any one person or group but are more systemic in structure.
Perhaps the most commonly noted barrier occurs when a Guaranteed Income Supplement-eligible senior does not file his or her income tax; as a result, it is difficult to track changes in their income which would make them entitled (or not) for the Supplement.Footnote 121 Key informants also noted that irregular tax filers may experience disruptions of their benefits. Even so, applicants do not need income tax data to apply for the Guaranteed Income Supplement; they can declare their income. However, informants noted that the statement of income form is not easy to find and/or requires knowledge of its existence.Footnote 122
Representative of community organizations noted that telephone wait times for call centre assistance are longer today than in the past. They also noted less site visits by Service Canada representatives.Footnote 123
Barriers still appear to exist for many Indigenous seniors who experience specific challenges, such as providing proof of residency information for those bands whose territory straddle the Canada/U.S. border, or having to sign a consent form to represent a third party who is having problems navigating the system.
Other factors included the complexity of forms (for example, the need to use more plain language on application forms was noted) as well as the length of time it takes to process applications once they are submitted to Service Canada. This was associated, by one key informant, with the need to increase the number of processing staff; despite improvements in technology, “person review” is still seen as necessary. Related issues included the complexity of internal processes that were seen as “complicated and tedious” by front-line staff. One example of this complexity is where married seniors receive separate forms despite the fact that benefits are determined for the couple; one form was seen as sufficient. In addition, complex and lengthy internal processes (for example, when applications are put on hold pending income information)Footnote 124 were seen as delaying the process among low-income seniors.Footnote 125
Other examples of process barriers noted by front-line key informants include: lack of clarity on whether Guaranteed Income Supplement payment rates are for single or married couples, and a delay in moving from Canada Pension Plan-Disability benefits to Old Age Security/Guaranteed Income Supplement after someone turns 65 and the “cumbersome” nature of reports generated to track beneficiaries. In addition, Service Canada has not set up online application processes for the Guaranteed Income Supplement. Interviewees anticipated the changes coming with automatic Guaranteed Income Supplement enrolment.
Application process barriers
Overall, most applicants did not find the application process to be particularly difficult; a survey by Service Canada of Guaranteed Income Supplement-eligible seniors who had not applied for the Supplement indicated that 57% of respondents found the application process easy while 62% indicated that they did not need assistance to fill out the application. That said, there were those who found the application process to be “not easy” (5%) or only “somewhat easy” (34%).Footnote 126 Interestingly, interviews with key informants showed mixed results; almost all of the NHQ and Service Canada Processing Staff indicated that it is now less difficult to apply for the Guaranteed Income Supplement, while the majority of Service Canada Regional Outreach Staff, Outreach Partners and Advocacy Group respondents indicated that it is now more difficult.
There was acknowledgment, by some key informants, of people’s trepidation with filling out forms and applying for services, particularly with regard to fear of making a mistake on the forms (such as putting in incorrect income information) and the perceived penalties of doing so. Indeed, some interviewees from senior stakeholder organizations noted a higher demand for trustee services for seniors who are unable to manage their own financial affairs; this can complicate application for, and receipt of, any benefits.
Finally, some advocates that were interviewed indicated that Indigenous seniors may not understand the language in the forms, particularly regarding the need to annually reapply to maintain benefits (despite receiving reminder letters).Footnote 127 Documents, required for application (such as proof of residence) are also seen as a barrier to Indigenous seniors.
Annex G: OAS/GIS Program logic modelFootnote 128
Ultimate Outcome
- Social and economic inclusion of seniors in Canadian Society.
Shared Outcomes
- Income security for seniors.
- Responsive and current legislation/policy that reflects current and future needs of seniors.
- Responsible stewardship of the OAS program.
Direct Outcomes
- Seniors receive a lifetime benefit in recognition of their contribution to Canadian society.
- Eligible low-income seniors receive a minimum income.
- Quality program and policy direction to all partners in the administration of OAS program.
Outputs
- Policy direction to Service Canada in the administration of the OAS program.
- Litigation preparation/strategy.
- Policy, Legislation and Regulation.
Activities
- Policy, Legislation and Litigation Development and Analysis.
- Correspondence, Communication and Information.
- Horizontal linkages with others Departments, Governments and stakeholders.
Annex H: Additional findings from the Longitudinal Administrative Databank
Guaranteed Income Supplement take-up rates were calculated differently than both the rates calculated by Statistics Canada for Employment and Social Development and the rates calculated for this evaluation using the merged Old Age Security/Canada Revenue Agency linked data base. Most notable is the Longitudinal Administrative Databank rates calculated for this evaluation used a more conservative definition of eligibility, where only those receiving the Old Age Security pension are eligible for the Guaranteed Income Supplement. This is a more literal definition of eligibility than other source noted in this evaluation, which included also those who were eligible but not receiving the Old Age Security pension.
In addition, to be considered eligible for the Guaranteed Income Supplement, the following restrictions were made:
- only those over age 65 years were included (eligibility requirement)
- only those who filed income tax in 2014 and 2015
- only those whose spouse filed taxes
- those who had died in 2015, were immigrants with less than 10 years residency in Canada (eligibility requirement), or whose marital status was not known, were also excluded
- finally, those whose who were single in 2014 and married in 2015 were excluded due to the difficulty assessing a new spouse’s income
Due to these restrictions, the analysis of the Longitudinal Administrative Databank for this evaluation produced a smaller sample size than the sample size published by the program.
| Beneficiaries | Program estimates | Longitudinal Administrative Databank estimates | Longitudinal Administrative Databank – Program estimates |
|---|---|---|---|
| Number of Old Age Security Beneficiaries | 5,597,062 | 5,017,335 | -10.4% |
| Number of Guaranteed Income Beneficiaries | 1,798,142 | 1,655,805 | -7.9% |
With this in mind, we present the following additional findings using the Longitudinal Databank.
The take-up rate has remained fairly flat over the period 2006 to 2015, averaging 87.5%, with a mean deviation of less than 1 percentage point. Despite this, there is an uptick from 2014 (85.9%) to 2015 (89.7%).Footnote 129 These rates are lower than the official rates calculated by Statistics Canada and the rates calculated using the Old Age Security Administrative data.
Take-up rates were also calculated by demographic characteristics.
Gender: Take-up rates are higher for women than for men by roughly 5% points across the entire period of observation.Footnote 130 These findings are similar to those using the Old Age Security Administrative data. Mean deviation across the entire period of observation was 0.9% for women and 0.8% for men.Footnote 131
Age: The Longitudinal Administrative Databank used different age categories but the trends were similar to those from the Old Age Security Administrative Data. Rates were lowest for those 65 and 66 (75% and 71% in 2006 and 2015, respectively) and there was there was stability among the older age groups with a slight uptick from 2014 to 2015 (85% to 90%, 89% to 93%, and 91% to 94% for those aged 67 to 74, 75 to 84, and 85 plus, respectively).Footnote 132
Marital status: The Longitudinal Administrative Databank presents information for married individuals by the Old Age Security status of their spouse. Among those whose spouse received Old Age Security, take-up rates were 86% in 2006 and 92% in 2015 (mean deviation was 1.3% for the period). Among those whose spouse did not receive the Old Age Security, take-up was 70% in 2006 and 65% in 2015 (mean deviation was 1.7% for this period).Footnote 133
Region: Figure 5 shows data disaggregated by province (the Old Age Security data only disaggregates rates by region).Footnote 134 Nonetheless, a similar trend is evident where Ontario and the Western provinces all have lower take-up rates and more variation across the period of observation.
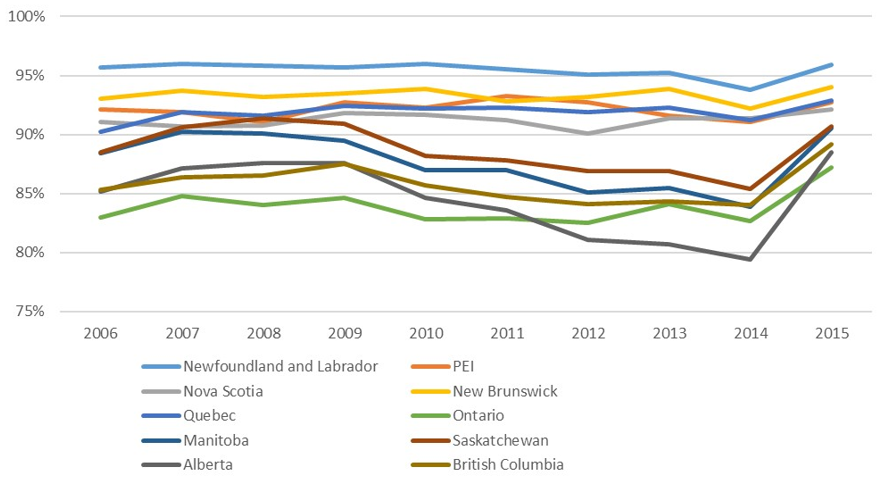
Figure 10 – Text version
| Province | GIS Take-up rate | |||||||||
|---|---|---|---|---|---|---|---|---|---|---|
| 2006 | 2007 | 2008 | 2009 | 2010 | 2011 | 2012 | 2013 | 2014 | 2015 | |
| Newfoundland and Labrador | 95.7% | 96.0% | 95.8% | 95.7% | 96.0% | 95.5% | 95.1% | 95.2% | 93.8% | 95.9% |
| PEI | 92.1% | 91.9% | 91.1% | 92.7% | 92.3% | 93.3% | 92.7% | 91.6% | 91.1% | 92.7% |
| Nova Scotia | 91.1% | 90.7% | 90.8% | 91.8% | 91.7% | 91.2% | 90.1% | 91.4% | 91.4% | 92.1% |
| New Brunswick | 93.0% | 93.7% | 93.2% | 93.5% | 93.9% | 92.8% | 93.2% | 93.9% | 92.2% | 94.0% |
| Quebec | 90.2% | 91.9% | 91.6% | 92.4% | 92.2% | 92.3% | 91.9% | 92.3% | 91.2% | 92.9% |
| Ontario | 83.0% | 84.8% | 84.0% | 84.6% | 82.8% | 82.9% | 82.5% | 84.1% | 82.7% | 87.2% |
| Manitoba | 88.4% | 90.2% | 90.1% | 89.5% | 87.0% | 87.0% | 85.1% | 85.5% | 83.9% | 90.5% |
| Saskatchewan | 88.5% | 90.6% | 91.4% | 90.9% | 88.2% | 87.8% | 86.9% | 86.9% | 85.4% | 90.7% |
| Alberta | 85.2% | 87.1% | 87.6% | 87.6% | 84.6% | 83.6% | 81.1% | 80.7% | 79.4% | 88.5% |
| British Columbia | 85.3% | 86.4% | 86.5% | 87.5% | 85.7% | 84.7% | 84.1% | 84.3% | 84.0% | 89.2% |
- Source: 10% sample of taxfilers in linked T1-OAS databases (5.1M observations)
Family income and employment: Eligible individuals whose income is close to the income threshold (and whose expected monthly Guaranteed Income Supplement benefit would be relatively low) have a lower take-up rate. For example, the Guaranteed Income Supplement take-up rate of those whose eligible income is no more than $500 below the eligibility income threshold is 62.1%, compared to the national average of 89.7%Footnote 135.