
Horizontal Evaluation of the Youth Employment and Skills Strategy
On this page
- List of abbreviations
- List of charts
- List of figures
- List of tables
- Executive summary
- Management response
- Introduction
- Youth Employment and Skills Strategy
- Evaluation approach
- Youth labour market status in Canada
- Summary of effective labour market programs, services and supports to assist youth
- Evaluation findings
- YESS federal partners' evaluation findings
- Youth Digital Gateway
- Strategic Collaboration projects
- Conclusion
- Appendix A: Annual YESS funding allocation by partner
- Appendix B: YESS logic model (2021)
- Appendix C: Description of the estimation method for the incremental impacts
- Appendix D: ESDC Horizontal Initiatives - Departmental Results Report for YESS by partner (between 2020 to 2021 and 2022 to 2023)
- Appendix E: Additional incremental impact results for CSJ subgroups of participants
- Appendix F: Additional incremental impact results for YESSP subgroups
- Appendix G: Youth Digital Gateway
Alternate formats

Horizontal Evaluation of the Youth Employment and Skills Strategy [PDF - 1,530 KB]
Large print, braille, MP3 (audio), e-text and DAISY formats are available on demand by ordering online or calling 1 800 O-Canada (1-800-622-6232). If you use a teletypewriter (TTY), call 1-800-926-9105.
List of abbreviations
- AAFC
- Agriculture and Agri-Food Canada
- CMHC
- Canada Mortgage and Housing Corporation
- CSJ
- Canada Summer Jobs
- ECCC
- Environment and Climate Change Canada
- ESDC
- Employment and Social Development Canada
- FNIYES
- First Nations and Inuit Youth Employment Strategy
- GAC
- Global Affairs Canada
- HIIY
- Housing Internship for Indigenous Youth
- IRAP
- Industrial Research Assistance Program
- IRCC
- Immigration, Refugees and Citizenship Canada
- ISC
- Indigenous Services Canada
- ISED
- Innovation, Science and Economic Development Canada
- NEET
- Not in Employment, Education, or Training
- NRC
- National Research Council of Canada
- NRCan
- Natural Resources Canada
- QEO
- Quality Employment Opportunity
- QEOST
- Quality Employment Opportunity and Skills Training
- ST
- Skills Training
- YCW
- Young Canada Works
- YDG
- Youth Digital Gateway
- YES
- Youth Employment Strategy
- YESS
- Youth Employment and Skills Strategy
- YESSP
- Youth Employment and Skills Strategy Program
List of charts
- Chart 1: Employment rates for non-student male and female youth (ages 15 to 24) and young adults (ages 25 to 34) in Canada in 2023
- Chart 2: Employment rates for non-student immigrant youth (ages 15 to 24) and young adults (ages 25 to 34) versus non-immigrant youth and young adults in Canada in 2023
- Chart 3: Employment rates of racialized, non-racialized and Black youth (ages 15 to 24) in Canada in 2023
- Chart 4: Employment rate of off-reserve Indigenous and non-Indigenous youth (ages 15 to 24) in Canada, 2007 to 2023
- Chart 5: Proportion of ESDC's Strategy participants who identified as youth facing barriers versus the overall Canadian population of youth (2021 Census)
- Chart G1: YDG client satisfaction levels
List of figures
List of tables
- Table 1: Annual CSJ funding allocation (in millions)
- Table 2: Annual YESSP funding allocation by federal partner (in millions)
- Table 3: Departmental Results Report for YESS for 2022 to 2023
- Table 4: Profile of CSJ participants who began their participation between April 1, 2019 to December 31, 2020 and of CSJ participants during the summer of 2018
- Table 5: Outcome trends for CSJ participants (analyses without comparison groups)
- Table 6: Incremental impacts for CSJ participants (n=52,172)
- Table 7: Incremental impacts for CSJ participants who did not return to school following participation (n=18,812)
- Table 8: Incremental impacts for female CSJ participants (n=32,281)
- Table 9: CSJ male participants (n=18,712)
- Table 10: Incremental impacts for female CSJ participants with disabilities (n=925)
- Table 11: Incremental impacts for male CSJ participants with disabilities (n=544)
- Table 12: Profile of ESDC's YESSP participants who began their participation between April 1, 2020 and December 31, 2020 and Skills Link participants who began their participation in 2010 to 2011
- Table 13: Number of ESDC participants per YESSP intervention type (began participation from April 2020 to December 2020)
- Table 14: Outcome trends for QEO participants (no comparison group)
- Table 15: Outcome trends for ST participants (no comparison group)
- Table 16: Outcome trends for QEOST participants (no comparison group)
- Table 17: Incremental impacts for QEO participants (n=312)
- Table 18: Incremental impacts for YESSP ST (n=976)
- Table 19: Incremental impacts for QEOST (n=1,742)
- Table 20: Number of jobs and internships funded between 2019 to 2020 and 2022 to 2023
- Table 21: Program participation for underrepresented groups during the period of 2014 to 2017 compared to 2018 to 2021
- Table A1: Annual YESS funding allocation by Strategy partner
- Table D1: Departmental Results Report by YESS partner (between 2020 to 2021 and 2022 to 2023)
- Table E1: Incremental impacts for CSJ participants aged 20 to 24 (n=22,643)
- Table E2: Incremental impacts for CSJ participants aged 25 to 30 (n=6,756)
- Table E3: Incremental impacts for CSJ participants who had not yet completed high school (n=6,097)
- Table E4: Incremental impacts for CSJ participants who live in rural areas (n=9,107)
- Table E5: Incremental impacts for CSJ participants who live in urban areas (n=43,065)
- Table E6: Incremental impacts for CSJ participants who returned to school follow CSJ participation (n=33,360)
- Table E7: Incremental impacts for CSJ male participants aged 20 to 24 (n=7,125)
- Table E8: Incremental impacts for CSJ female participants aged 25 to 30 (n=4,381)
- Table E9: Incremental impacts for CSJ male participants aged 25 to 30 (n=2,375)
- Table F1: Incremental impacts for QEOST female participants (n=908)
- Table F2: Incremental impacts for ST female participants (n=511)
- Table F3: Incremental impacts for male participants in QEOST (n=769)
- Table F4: Incremental impacts for ST male participants (n=428)
- Table F5: Incremental impacts for QEOST participants with disabilities (n=488)
- Table F6: Incremental impacts for ST participants with disabilities (n=291)
- Table F7: Incremental impacts for QEOST participants aged 15 to 19 (n=459)
- Table F8: Incremental impacts for QEOST participants aged 20 to 24 (n=693)
- Table F9: Incremental impacts for ST participants aged 20 to 24 (n=396)
- Table F10: Incremental impacts for QEOST participants aged 25 to 30 (n=549)
- Table F11: Incremental impacts for ST participants aged 25 to 30 (n=292)
Executive summary
The Youth Employment and Skills Strategy (YESS or the Strategy) helps young people (between the ages of 15 and 30), particularly those facing barriers to employment, get the information and gain the skills, work experience and abilities they need to make a successful transition into the labour market. The YESS began in June 2019 as the successor to the Youth Employment Strategy (YES).
The objective of the Strategy is to help youth facing barriers develop their skills along a continuum to become more job ready. Ultimately, the Strategy aims to help youth to advance in the labour market so that individuals, families and communities mutually benefit from the participation of youth in the Canadian economy.
The Department of Employment and Social Development Canada (ESDC) is the lead of this horizontal Strategy, which involves 11 other federal departments, agencies, and Crown corporations (hereafter, referred to as federal partners).
The Strategy has 2 main components.
Canada Summer Job (CSJ) component targets youth to participate in summer work placements, supported by mentorship. It has one intervention that provides wage subsidies to employers for small businesses, not-for-profit organizations and the public sector.Footnote 1 ESDC is the only federal department involved in CSJ.
Youth Employment and Skills Strategy Program (YESSP) component consists of employment skills interventions and support measures, includingFootnote 2:
- Quality Employment Opportunity (QEO): through the YESSP, the contribution recipient provides employers with funding for wage subsidies to create quality job placements for youth in safe, inclusive, and healthy work environments
- Skills Training (ST) includes:
- Employment Skills Training: a pre-employment activity for youth who need some additional skills development before advancing to a work experience
- Accredited Skills Training: enables youth to participate in courses that fill specific, identified gaps in their education and skill development, taking into consideration labour market needs
- Entrepreneurship Skills Training: provides entrepreneurial skills within an activity where youth are given exposure to the world of self-employment
- Employment Services: relates to helping a youth secure employment, including resume writing, interview advice and job placement support
- Support measures: includes mentorship or coaching, case management or client assessment, and other supports (such as, access to mental health services and childcare)
Between fiscal yearsFootnote 3 2019 to 2020 and 2024 to 2025, approximately $5.2 billion in funding has been allocated to the Strategy. Overall, YESSP represents 55% of total Strategy funding, while CSJ is 45%. Under YESSP, ESDC receives 49.5% of funding, while the remaining federal partners collectively receive 50.5%. As the only partner involved in CSJ, ESDC is allocated 100% of funding.
The COVID-19 pandemic caused sharper employment losses in youth than in all other age groups. From March to May 2020, the unemployment rate of Canadian youth increased from 17.1% to 28.8%, representing an increase of 11.7 percentage points.Footnote 4 In response to the challenges of the pandemic, increased flexibilities and temporary measures were introduced to the Strategy to assist youth and possibly prevent long-term labour market scarring. A total of $249.4 million in additional funding was advanced to the Strategy in response to the pandemic (between 2020 to 2021 and 2022 to 2023). Temporary COVID-19 pandemic relief funds allocated to YESS annual funding ended on March 31, 2023.
Evaluation objectives
The horizontal evaluation of the YESS examines the period from the start of modernization (June 2019) to fiscal year 2023 to 2024.
The purpose of the evaluation is to:
- determine the early results achieved by the Strategy's 2 main components: YESSP and CSJ
- examine issues pertaining to governance, implementation and performance measurement
- examine how the Youth Digital Gateway and the Strategic Collaboration Projects have supported the Strategy
Overall, the evaluation seeks to help inform future cycles of program and policy development, and to support the evaluation of the Strategy's performance measurement strategy and data collection.
Information available to evaluate the horizontal Strategy
The evaluation uses multiple lines of qualitative and quantitative evidence to examine the Strategy. At the horizontal level, the evaluation has access to information from:
- key informant interviews
- questionnaires completed by federal partners
- documents provided by federal partners describing the design of their YESS programs
- evaluation reports and internal reviews conducted by 6 of 11 federal partners
- participants' publicly reported aggregate immediate labour market and return to education outcomes
Challenges to evaluating the impact and effectiveness of the horizontal StrategyFootnote 5
The examination of the impact and effectiveness of the Strategy (that is, the ability to attribute participants' post-program labour market outcomes directly to having participated in YESS programs and services) is limited to ESDC participants. Based on a data assessment conducted, the following information was found for YESSP (the horizontal component of the Strategy).
Due to challenges in accessing federal partners' disaggregate participant data, the quantitative analysis for YESSP participants is limited to ESDC participants (representing only 49.5% of allocated YESSP funding). This represents a limitation in informing the impact and effectiveness of each federal partners' program under the Strategy. The reasons for this include the lack of centralized data collection system at ESDC for the secure transfer of federal partners' disaggregate participant data. Previously, some federal partners uploaded select data to ESDC through the Data Collection System, which has since been decommissioned.Footnote 6
Since modernization of the Strategy, no new agreements have been put in place that allow for federal partners to transfer their YESS participants' disaggregated data (through Information Sharing Agreements)Footnote 7 to ESDC for analysis, reporting and evaluation purposes. Prior to modernization, Information Sharing Agreements were in place between ESDC and federal partners.
The previous YES was evaluated 4 times (2005, 2009, 2015, and 2020). Due to data limitations, which were highlighted in these evaluation reports, none of the previous YES evaluations were able to examine incremental impacts for federal partners' participants. Going forward, governance discussions are encouraged to address the horizontal challenges related to data access.
Key evaluation findings
Implementation
Federal partners highlighted implementation changes made to their programs in response to Strategy modernization, including expanding their programs' reach to target youth facing employment barriers. Implementation challenges identified by federal partners include funding related challenges, such as late funding decisions and difficulties in recruiting youth experiencing barriers to employment.
Governance
Federal partners acknowledge the importance of ESDC's role in coordinating and providing guidance on budget proposals, policy changes, and implementation of the new Performance Measurement Framework. Federal partners also identified areas for improvement, such as ESDC playing a bigger role in promoting collaboration and fostering horizontal information sharing.
Performance measurement
During fiscal year 2022 to 2023, approximately 115,000 youth participated in CSJ, while an estimated 26,260 youthFootnote 8 participated in YESSP (with 17,241 from ESDC and 9,018 from federal partners). An examination of targets and results found that almost all Strategy federal partners achieved or surpassed their targeted outputs and outcomes.Footnote 9 The evaluation also found that demand for CSJ and YESSP exceeds the annual budget available to fund all applications received.
Data collection and reporting challenges were identified by federal partners, including the lack of a centralized data collection system to upload participant data to ESDC and issues with data completeness (for example, the inability to link surveys to administrative data).
Canada Summer Jobs results
Outcome trends (analysis without a comparison group) show increases in participants' employment levels and employment earnings from before to after participation.
On average, incremental impacts (analysis using a comparison group) demonstrate that, in the short-term, CSJ participation strengthens the labour market attachment of youth participants relative to similar non-participants through increases in incidence of employment and employment earnings (second year post-program). In addition, CSJ participants decrease their dependence on government income supports (that is the combination of social assistance and Employment Insurance benefits).
Overall, CSJ is a good policy tool to assist youth in integrating into the labour market, as it makes some contribution to facilitating the transition from school to employment.
Youth Employment and Skills Strategy Program results
Labour market outcome trends (analysis without the use of comparison groups) for YESSP participants shows increases in employment levels and earnings from before to after the program. The outcome trends point to the importance of offering a work experience to participants, especially participants with lower levels of education.
The estimation of incremental impacts (analysis using a comparison group) shows that in the short-term, receiving a work experience through a subsidized work placement, either alone or in combination with skills training, increases the probability of being employed for youth. Participating in skills training alone, on average, does not strengthen the labour market attachment of youth. Examination of incremental impacts over the medium-term is needed to fully understand the impacts of YESSP interventions on participants.
Partners' evaluations and reviews
Results of evaluations and internal reviews were provided by 6 partners for inclusion in the horizontal evaluation report. Overall, evidence points to program participation assisting youth in developing skills to help them in finding employment. Programs aim to support youth facing barriers to integrate into the labour market. High levels of satisfaction with the program are reported by both participants and employers/sponsors. Some federal partners point to challenges in administering the program due to late funding decisions.
Youth Digital Gateway
Launched in July 2021, the purpose of Youth Digital Gateway is to deliver holistic, client-centric digital services for youth, with a focus on youth employment, skills, and services. Challenges were experienced in the design and delivery of the Youth Digital Gateway, in part due to the pre-launch period being interrupted by the COVID-19 pandemic. As the project approaches its completion date, a comprehensive, lessons learned exercise will be conducted by the project team.
Strategic Collaboration projects
The YESS Strategic Collaboration projects aim to strengthen the connections between key actors across the youth employment ecosystem (service delivery, employers and industry, and/or educational or training sectors), and to promote the adoption of innovative and effective practices. Between March 2019 and fiscal year 2023 to 2024, ESDC invested nearly $33 million in 9 Strategic Collaboration projects with a total number of 13,000 participants.
Given that most projects are still operating as of September 2023, it is too early to provide a comprehensive assessment of the extent to which all strategic collaboration projects achieved their intended objectives.
Recommendations and observations
From the main findings of the evaluation, the following observations and key recommendations emerge.
Observation: Due to data limitations and the lag period to access personal income tax information from the Canada Revenue Agency, incremental impacts were estimated for a short post-program period of 2 years. It may be appropriate, if there is an interest within ESDC prior to the Strategy's next Financial Administration Act evaluation requirement, to conduct a follow-up assessment of the medium-term incremental impacts (up to 5 years post-program) and efficiency (cost-benefits) of YESSP participation.
Recommendation 1: It is recommended that ESDC and YESS federal partners clarify roles and responsibilities in terms of data collection and evaluation. This includes the responsibility of ESDC regarding the scope of the horizontal evaluation and that of all federal partners when it comes to evaluate and publicly report on the impacts and effectiveness of their programs and services.
Recommendation 2: It is recommended that ESDC's Skills and Employment Branch pursue efforts to maintain and strengthen data collection provisions in support of YESS reporting, performance measurement and data-driven evaluations. To that regard, ESDC should:
- establish a new YESS data collection system with appropriate privacy and legal provisions, and information sharing agreements
- ensure that proper data elements are collected by all partners to allow for contacting participants for the conduct of qualitative lines of evidence (including surveys) and linking responses to administrative data
- prioritize data integrity, including validating data uploads and documenting changes over time
Management response
Overall management response
Employment and Social Development Canada's (ESDC) Skills and Employment Branch and Program Operations Branch would like to thank the Evaluation Directorate, Youth Employment and Skills Strategy (YESS) partner programs, and youth, who participated in YESS programs and shared their feedback through participant forms, surveys, and focus groups.
The evaluation findings for the ESDC YESS program (YESSP) and Canada Summer Jobs (CSJ) are positive. The objective of the horizontal strategy (Strategy) is to help youth, especially youth facing barriers, develop their skills along a continuum to become more job ready and participate in the Canadian economy. The evaluation, while limited to the ESDC YESSP and CSJ programs, did conclude that these interventions result in better employment outcomes for participants.
For the YESSP quantitative data, labour market outcome trends (analysis without the use of comparison groups) for YESSP participants showed increases in employment levels and earnings from before to after the program. The outcome trends pointed to the importance of offering a work experience to participants, especially participants with lower levels of education. The estimation of incremental impacts (analysis using a comparison group) showed that in the short-term, receiving a work experience through a subsidized work placement, either alone or in in combination with skills training, increases the probability of being employed for youth.
For the CSJ quantitative data, outcome trends (analysis without a comparison group) showed increases in participants' employment levels and employment earnings from before to after participation. On average, incremental impacts (analysis using a comparison group) demonstrated that, in the short-term, CSJ participation strengthened the labour market attachment of youth participants relative to similar non-participants.
Qualitative data for YESSP stemmed from ESDC post-program group interviews conducted across Canada in Winter 2024. Overall, the focus groups revealed that youth had high levels of satisfaction with their YESSP placement. Focus groups were broken down into separate sessions with Indigenous (First Nations, Inuit, Métis), Francophone, racialized, Black, immigrant, rural youth, and youth with disabilities. Most youth reported that their programs focused on job readiness and job search skills, as well as providing additional social support (e.g. childcare and transportation support).
While the findings overall are positive, a needed improvement area for all YESS programs and the Strategy is comprehensive data quality. The evaluation report makes two recommendations for improving data quality for the Strategy.
Recommendation 1: It is recommended that ESDC and YESS federal partners clarify roles and responsibilities in terms of data collection and evaluation. This includes the responsibility of ESDC regarding the scope of the horizontal evaluation and that of all federal partners when it comes to evaluate and publicly report on the impacts and effectiveness of their programs and services.
Management response
Management agrees with this recommendation.
In 2022 to 2023, ESDC led the review of the Performance Measurement Framework (PMF) in collaboration with all YESS federal partners. In January 2023, YESS Director Generals endorsed the revised PMF, which included new data collection requirements, necessary for public reporting, ongoing policy analyses, and future evaluation reports. Data requirements remain a standing item for the YESS Director General Working Group and ESDC will continue to work through this forum, alongside the working-level committee, to ensure roles and responsibilities of all YESS partners are understood with respect to evaluating and publicly reporting the impacts and effectiveness of their programs and services. Note: Indigenous Services Canada commitments are subject to data sovereignty and capacity limits.
Management action plan 1.1.
ESDC is working with strategy partners at the working level and YESS Director General Working Group to clarify the roles and responsibilities of all partners in terms of data collection and evaluation responsibilities. ESDC is collaborating with YESS partners to ensure that each YESS program can meet the expectations outlined in PMF for public reporting and future evaluations. ESDC will work bilaterally at regular intervals with YESS partners to identify and resolve potential data and reporting issues.
Planned completion date: December 2025
Action status: In progress
Accountable lead(s):
Lead: Director General, Youth and Skills Innovation Directorate, ESDC
Supporting: YESS Director General Working Group
Recommendation 2: It is recommended that ESDC's Skills and Employment Branch pursue efforts to maintain and strengthen data collection provisions in support of YESS reporting, performance measurement and data-driven evaluations. To that regard, ESDC should:
- establish a new YESS data collection system with appropriate privacy and legal provisions, and information sharing agreements
- ensure that proper data elements are collected by all partners to allow for contacting participants for the conduct of qualitative lines of evidence (including surveys) and linking responses to administrative data
- prioritize data integrity, including validating data uploads and documenting changes over time
Management response
Management agrees with this recommendation.
ESDC will continue to work with Strategy partners, through existing governance structures, to maintain and strengthen data collection in support of YESS reporting, program analyses, and data-driven evaluations. The scope of the evaluation report did not include the improved YESS Performance Measurement Framework, which was endorsed in January 2023 by all YESS partners and is targeted to be fully implemented by March 2025. The successful implementation of the revised PMF will result in improved Strategy reporting through qualitative improvements, global data disaggregation, data standardization, and data linking at the participant-level. In addition, ESDC is working on the development of a new horizontal Data Collection System in 2025-26, with operationalization expected by March 2026. Note: Indigenous Services Canada commitments are subject to data sovereignty and capacity limits.
Management action plan 2.1. (I)
ESDC will develop a new horizontal YESS data collection system.
Planned completion date: March 2026
Action status: In progress
Accountable lead(s):
Lead: Director General, Youth and Skills Innovation Directorate, ESDC
Support: YESS Director General Working Group
Management action plan 2.1 (II)
ESDC and YESS partners will update the horizontal YESS information sharing agreements, ensuring legal and privacy requirements are reflected, to align with the needs of the future data collection system.
Planned completion date: March 2026
Action status: Yet to commence
Accountable lead(s):
Lead: Director General, Youth and Skills Innovation Directorate, ESDC
Support: YESS Director General Working Group
Management action plan 2.2 (I)
ESDC will collaborate with YESS partners to move towards ensuring the collection of contact data for participants, which are necessary for conducting qualitative lines of evidence, such as surveys and focus groups.
Planned completion date: March 2025
Action status: In progress
Accountable lead(s):
Lead: Director General, Youth and Skills Innovation Directorate, ESDC
Support: YESS Director General Working Group
Management action plan 2.2 (II)
ESDC is working with Strategy partners to ensure all YESS partners understand and move towards ensuring the requirement for data linking between all PMF administrative data, such as linking skills surveys to participant-level administration data for YESSP. PMF data linking will be subject to each program's privacy requirements. ESDC has established a PMF working group that will be the main vehicle for moving towards ensuring the delivery of linked PMF data.
Planned completion date: March 2025
Action status: In progress
Accountable lead(s):
Lead: Director General, Youth and Skills Innovation Directorate, ESDC
Support: YESS Director General Working Group
Management action plan 2.3.
The Strategy is advancing on improved horizontal data integrity by using three interrelated PMF data dictionaries, which will help ensure improved horizontal data quality when the YESS data collection system is completed and ready to receive data in March 2026.
Where required, each partner is implementing two YESS PMF data dictionaries, along with a YESS PMF data reporting template, to advance horizontal PMF implementation and horizontal data quality.
One PMF data dictionary is the "YESS PMF Logic Model Backgrounder," which will standardize data for PMF indicators.
The second YESS PMF data dictionary is the "YESS PMF Data Disaggregation Guide," which is helping all partner programs collect better data of youth from equity-deserving communities. YESS partners are also improving horizontal PMF data integrity through the use of the "YESS PMF Standard Reporting Template," which standardizes how each YESS partner program will share required PMF indicators with ESDC.
In accordance with each program's available resources and technical capacity, YESS partners will seek to update and launch their data collection tools to reflect the updated YESS PMF by March 2025. Most programs will have a year or more lag between launching their new data tools and receiving data from funding recipients. To provide needed flexibility for YESS partners with varying capacities and program cycles, the intended date for sharing PMF data with ESDC is the end of summer 2026.
Planned completion date: August 2026
Action status: In progress
Accountable lead(s):
Lead: Director General, Youth and Skills Innovation Directorate, ESDC
Support: YESS Interdepartmental Director General Working Group
Introduction
The horizontal evaluation of the Youth Employment and Skills Strategy (hereafter referred to as YESS or the Strategy) builds on and complements previous evaluation work conducted on the predecessor strategy, the Youth Employment Strategy (YES). The evaluation is conducted in compliance with the Federal Administration Act and the 2016 Policy on Results.
The present evaluation uses multiple lines of qualitative and quantitative evidence to examine the early results of the Strategy since its modernization in 2019. Key informant interviews with senior federal government officials, along with a document review and a literature review provide contextual insight into the Strategy's implementation, governance, and performance measurement. Focus groups conducted with recent participants from targeted subgroups under the Strategy, and an analysis of participants' post-program surveys, help to provide information about skills acquisition, satisfaction, and challenges.
The report includes an incremental impact analysis for Employment and Social Development Canada (ESDC) participants using linked administrative data for Canada Summer Jobs (CSJ) and YESS Program (YESSP) participants. The analysis examines CSJ participants who began their intervention in 2019 or 2020 and YESSP participants who began their interventions from April 1, 2020 to December 31, 2020. Incremental impacts are estimated by comparing the outcomes of participants with those of similar non-participants using peer reviewed advanced causal analysis methods.
Youth Employment and Skills Strategy
Background
In 1997, the Government of Canada introduced YES to assist youth to prepare for, obtain, and maintain employment and to make a successful transition from school to work. In 2003, YES underwent a realignment from its 5 original components to 3 components (that is, Career Focus, Skills Link and Summer Work Experience) with an emphasis on skills development for youth.
In 2019, YES was modernized and became YESS. The main impetus for the Strategy's modernization was to broaden both the scope of available interventions and the requirements for eligibility, as well as to add flexibilities.
Strategy description
The objective of the Strategy is to support youth (between the ages of 15 to 30) to get the information and gain the skills, work experience and abilities they need to make a successful transition into the labour market. At the same time, the Strategy recognizes the need for more tailored interventions to better support youth, with a focus on those facing barriers, especially youth who are furthest away from employment opportunities.Footnote 10
The Strategy has 2 components:
- YESSP provides employment skills interventions and support measures to youth with barriers to employment
- CSJ provides short-term work experience for youth
CSJ is delivered by ESDC-only, and provides wage subsidies to employers from not-for-profit organizations, private sector organizations with 50 of fewer full-time employees, and the public sector to create summer work experiences for youth. It represents close to 45% of the Strategy's funding envelope and is meant to:
- provide youth with opportunities to develop and improve their skills
- responds to national and local priorities
- improve access to the labour market for youth including those who face unique barriers
YESSP provides funding to organizationsFootnote 11 to deliver a range of interventions that aim to help youth overcome barriers to employment and develop a broad range of skills and knowledge to participate in the current and future labour market. YESSP represents approximately 55% of the Strategy's total funding envelope. ESDC, as the Strategy's horizontal lead, works in partnership with 11 federal departments, agencies, and Crown corporations (hereafter referred to as the partners):
- Agriculture and Agri-Food Canada (AAFC)
- Canadian Heritage
- Canada Mortgage and Housing Corporation (CMHC)
- Environment and Climate Change Canada (ECCC)
- Global Affairs Canada (GAC)
- Immigration, Refugees and Citizenship Canada (IRCC) Footnote 12
- Indigenous Services Canada (ISC)
- Innovation, Science and Economic Development Canada (ISED)
- National Research Council of Canada (NRC)
- Natural Resources Canada (NRCan)
- Parks Canada
YESS programs across Strategy partners
The following section presents the description, including the focus and goals of each Strategy partners' programs. For the purposes of this report, the names of the 2 components, YESSP and CSJ, will be used to refer to findings (unless otherwise indicated).
AAFC Youth Employment and Skills Program provides a wage subsidy to agricultural employers to hire youth, particularly those facing barriers to employment, and helping them to gain the skills, work experience and abilities they need to make a successful transition to the labour market.
Canadian Heritage Young Canada Works Initiatives (YCW) (including YCW in Heritage Organizations; YCW in Both Official Languages; YCW at Building Careers in Heritage; and, YCW at Building Careers in English and French) provide wage subsidies supporting short-term job placements, summer jobs placements and internships in the heritage, arts and cultural sectors, and official languages environments, as well as wrap-around services to accommodate youth in the workplace.
CMHC Housing Internship for Indigenous Youth provides funding to organizations to assist Indigenous youth in gaining work experience and pursuing long-term employment in the housing sector, or a related field.
ESDC YESS:
- CSJ creates quality summer employment opportunities through wage subsidies for employers.
- YESSP provides funding to organizations to support youth facing barriers through individualized supports including skills development and training, mentorship, and wrap-around services (such as dependent care support, mental health counselling).
ECCC Science Horizons Youth Internship Program creates work experiences related to green jobs through wage subsidies to employers and supports companies and organizations grow their green workforce and contribute to Canada's green economic growth in environmental and clean technology sectors.
GAC International Youth Internship Program supports:
- professional experience abroad (or, in some cases, virtually) in the field of international development
- projects that offer internship opportunities to Canadian youth aged 18 to 30 facing barriers to employment, helping them gain professional experience abroad and acquire skills in the field of international development
IRCC Settlement Program provides funding to organizations for programming that is designed to meet the unique needs of newcomer youth through employment-related services with wrap-around supports.
ISC First Nations and Inuit Youth Employment Strategy:
- Skills Link - First Nations and Inuit youth provides funding to organizations for initiatives that help First Nations and Inuit youth acquire essential employability and job-related skills, learn about job and career options and prepare for employment and career development
- Summer Work Experience provides funding to organizations to provide summer work experiences that help First Nations and Inuit youth acquire skills, prepare for full-time employment and earn income to support post-secondary education
ISC Income Assistance First Nations Youth Employment Strategy Pilot helps on-reserve and Yukon First Nations youth between the ages of 18 and 30 who are receiving Income Assistance transition to the workforce or return to school, reducing long term dependency on Income Assistance. It provides funding to First Nations and organizations for initiatives that help First Nations youth acquire essential employability and job-related skills, learn about job and career options and prepare for employment and career development.
ISED Computers for Schools Intern and Digital Skills for Youth:
- Computers for Schools Intern provides funding to organizations to support youth from diverse backgrounds and genders gain work experience and develop advanced digital and soft skills such as project management, teamwork, and communications
- Digital Skills for Youth creates employment opportunities to help youth build the digital skills needed for the digital economy and emerging areas of work
NRC Industrial Research Assistance Program - Youth Employment Program offers financial assistance to offset the cost of hiring youth to work with innovative small and medium enterprises on projects with research and development, engineering, multimedia or market analysis components or to help develop a new product or process.
NRCan Science and Technology Internship Program - Green Jobs kick-starts careers in the energy, forestry, mining, earth sciences, and clean technology sectors by providing funding to employers across Canada to hire, train, and mentor youth in the natural resources sector and create quality and inclusive work experiences that improve environmental outcomes.
Parks Canada Youth Experience Employment Program helps youth, particularly those facing barriers and under-represented youth, get the information and gain the skills, work experience and abilities they need to make a successful transition into the labour market. Approximately 50% of youth are hired directly by Parks Canada.
Eligible activities
While some activities are distinct to a particular program component, others overlap.
CSJ eligible activities include:
- tools and resources to support employers to hire and retain youth, including those facing barriers
- employer wage subsidies supporting work placements, career-specific internships and on-the-job mentorship and training
YESSP eligible activities include:
- supports to enable youth to participate in work and training opportunities
- skills training, employment services, networking and liaison services
- tools and resources to support employers to hire and retain youth, including those facing barriers
- employer wage subsidies supporting work placements, career-specific internships and on-the-job mentorship and training
Most partners provide employer wage subsidies supporting work placements or career specific internships that may be accompanied by on-the job mentorship and training. Some partners provide pre-employment training, skills training and other supports.
Delivery
ESDC (through Service Canada) provides wage subsidies directly to selected employers.
Most federal partners deliver YESSP interventions through third-party organizations (10 federal partners). The third-party organizations deliver the YESSP programming directly (4 federal partners) or redistribute funding to employers to create job-placement and internship opportunities (4 federal partners) or use a mixed model (2 federal partners). One federal partner delivers YESSP directly by hiring youth.
Intervention types
The main intervention under CSJ is the wage subsidy provided to employers to provide a short-term work experience opportunity for youth.
Under YESSP, the following main types of interventions are offered to youth:
- Quality Employment Opportunity (QEO): work experience providing skills and training, a salary above minimum wage, and opportunities for advancement
- Skill Training (ST) comprised of:
- Employment Skills Training: provides pre-employment activities for youth who need additional development before advancing to a work experience
- Accredited Skills Training: pre-employment courses provided by an institution registered with the province/territory that fill specific, identified gaps in their education and skill development
- Entrepreneurship Skills Training: provides entrepreneurial skills in an activity where youth are given exposure to the world of self-employment
- Employment Services: activities related to helping a youth secure employment, including resume writing, interview advice and job placement support
- Support measures: includes mentorship or coaching, case management or client assessment, and others support
Program funding
In the 6 fiscal yearsFootnote 13 between 2019 to 2020 and 2024 to 2025, approximately $5.2 billion in funding has been allocated to the Strategy. Tables 1 and 2 provide an overview of the Strategy's funding by component and federal partner.
Overall, YESSP represents 55% of total Strategy funding, while CSJ is 45%. Under YESSP, ESDC receives 49.5% of funding, while the remaining partners collectively receive 50.5%. As the only partner involved in CSJ, ESDC is allocated 100% of funding.
| YESS Partner | 2019 to 2020 | 2020 to 2021 | 2021 to 2022 | 2022 to 2023 | 2023 to 2024 | 2024 to 2025 | 6-year total | % of total CSJ funding |
|---|---|---|---|---|---|---|---|---|
| ESDC CSJ | $296.4 | $339.9 | $569 | $494.6 | $322.8 | $323.3 | $2,346.0 | 100% |
- Source: Financial information from ESDC Departmental Results Reports for Horizontal Initiatives, as well as internal ESDC documents; Fall Economic Statements and Budgets. The figures in this table have been rounded to the nearest decimal point meaning that the totals may not be exact.
| YESS Partner | 2019 to 2020 | 2020 to 2021 | 2021 to 2022 | 2022 to 2023 | 2023 to 2024 | 2024 to 2025 | 6-year total | % of total YESSP funding |
|---|---|---|---|---|---|---|---|---|
| ESDC YESSP | $194.6 | $263.6 | $361 | $281.4 | $142.9 | $149.9 | $1,393.4 | 49.5% |
| ISC | $55.7 | $57.7 | $107.0 | $89.4 | $87.6 | $87.6 | $485.0 | 17.2% |
| ISED | $13.9 | $59.9 | $71.3 | $16.4 | $10.8 | $10.9 | $183.0 | 6.5% |
| NRC | $15.4 | $20.4 | $66.5 | $15.4 | $22.7 | $22.7 | $162.9 | 5.8% |
| ECCC | $14.5 | $14.5 | $38.3 | $14.6 | $18.6 | $18.6 | $119.1 | 4.2% |
| NRCan | $9.4 | $16.4 | $44.6 | $9.8 | $15.6 | $15.6 | $111.5 | 4.0% |
| Canadian Heritage | $14.2 | $22.1 | $23.7 | $14.2 | $16.2 | $16.2 | $106.6 | 3.8% |
| Parks Canada | $9.0 | $2.0 | $47.4 | $8.9 | $14.9 | $14.9 | $97.2 | 3.5% |
| AAFC | $3.8 | $10.4 | $22.7 | $3.7 | $13.5 | $13.5 | $67.4 | 2.4% |
| GAC | $6.4 | $6.4 | $6.4 | $6.4 | $6.4 | $6.4 | $38.4 | 1.4% |
| CMHC | $5.9 | $5.0 | $8.9 | $5.8 | $4.7 | $4.7 | $34.9 | 1.2% |
| IRCC | - | - | $1.1 | $15.8 | - | - | $16.9 | 0.6% |
| Total YESSP funding | $342.8 | $478.4 | $798.9 | $481.8 | $353.9 | $361.0 | $2,816.3 | - |
- Source: Financial information from ESDC Departmental Results Reports for Horizontal Initiatives, as well as internal ESDC documents; Fall Economic Statements and Budgets. The figures in this table have been rounded to the nearest decimal point meaning that the totals may not be exact. For a more detailed breakdown of annual funding allocation by YESS partner please refer to Appendix A.
The COVID-19 pandemic caused sharper employment losses in youth than in all other age groups. From March to May 2020, the unemployment rate of Canadian youth increased from 17.1% to 28.8%, representing an increase of 11.7 percentage points.Footnote 15,Footnote 16 In response to the challenges of the pandemic, increased flexibilities and temporary measures were introduced to the Strategy to assist youth and possibly prevent long-term labour market scarring. A total of $249.4 million in additional funding was advanced to the Strategy in response to the pandemic (between 2020 to 2021 and 2022 to 2023).Footnote 17 Temporary COVID-19 pandemic relief funds allocated to YESS annual funding ended on March 31, 2023.
Expected Strategy outcomes
The Strategy has 1 strategic outcome shared by all federal partners: Footnote 18
- youth, particularly youth facing barriers, access programs that allow them to acquire the skills, learning experience and opportunities they need to find and maintain employment or return to (or remain in) school
The following outcomes may be shared by some, but not all, federal partners.
Immediate outcomes (shared by some federal partners):
- job readiness: youth attain skills, knowledge, and supports necessary to acquire employment
- career advancement: youth attain skills to advance in their careers
- employer readiness: employers are able to hire and retain youth
Intermediate outcome (shared by some federal partners):
- acquire employment: youth attain and retain quality employment (employers hire and retain youth)
Ultimate outcome (ESDC specific):
- youth successfully participate in an inclusive labour market
The logic model from the 2021 Program Information Profile can be found in Appendix B.
Evaluation approach
Evaluation objectives and scope
This horizontal evaluation examines the period from the modernized Strategy's implementation in June 2019 to fiscal year 2023 to 2024. ESDC, as the Strategy's horizontal lead, is responsible for conducting the horizontal evaluation, which was completed in collaboration with all YESS federal partners.
The aim of the horizontal evaluation is to determine the early results achieved by the Strategy's 2 main components: YESSP and CSJ. In addition, the evaluation examines issues pertaining to the Strategy's governance and examine how the Youth Digital Gateway (YDG)Footnote 19 and Strategic Collaboration ProjectsFootnote 20 have supported the Strategy. Where available, federal partners' specific evaluation results have been included in this report.
Overall, the evaluation seeks to help inform future cycles of program and policy development, and to support the evaluation of the Strategy's performance measurement and data collection.
Evaluation issues and questions
The evaluation addresses issues relating to program relevance, outcomes, impacts, governance, reporting and data collection. Specifically, the evaluation addresses the following questions:
Reaching targeted population
- To what extent is the Strategy reaching the targeted population of youth (for example, youth facing barriers who are furthest from the labour market)?
Strategy's early performance
- What are the early outcomes and incremental impacts (6 to 15 months after participation) of the interventions on the YESSP participants under the modernized Strategy who began participation between April and December 2020?
- What are the early outcomes and incremental impacts (1 to 2 years after participation) for the CSJ participants who began participation between June 2019 and December 2020?
- To what extent have the supports and services offered under the Strategy contributed to acquisition of skills and employment amongst youth?
- What was achieved through the Strategic Collaboration projects as part of YESSP? What are the lessons learned?
- How has the Youth Digital Gateway supported the Strategy to assist youth with accessing resources related to information regarding employment, education, and skills development?
Implementation and Governance of the modernized Strategy
- What are the lessons learned and challenges experienced by individual participating departments and agencies regarding the implementation of the modernized Strategy?
- To what extent does the current governance structure for the modernized horizontal Strategy support accountability, collaboration, and decision making? What are the lessons learned and/or challenges associated with it?
Evaluation methods
The horizontal evaluation draws from multiple lines of qualitative and quantitative evidence, including a literature review, a document review, key informant interviews, questionnaire to ESDC and YESS partners, focus groups, administrative data assessment, and analysis of labour market outcomes and incremental impacts. Where feasible and relevant, data from multiple lines of evidence are triangulated to validate and deepen evaluation findings. Where possible, a Gender-based Analysis Plus is applied.
Horizontal Strategy reporting requirements
As the YESS is a horizontal initiative, Treasury Board requires all YESS federal partners to track a minimum of one shared strategic outcome. The shared strategic outcome for the Strategy is:
"Youth, particularly youth facing barriers, access programs that allow them to acquire the skills, learning experience and opportunities they need to find and maintain employment or return to (or remain in) school".
This shared strategic outcome is positioned as both an output and an outcome because it encompasses both the key output of the program (access) and outcomes of the Strategy (employment and school outcomes).
Specifically, this shared strategic outcome is tracked by all Strategy federal partners through 4 indicators, and shared in aggregate form to ESDC for reporting in its Departmental Results Report for Horizontal Initiatives:Footnote 21
- number of youth served
- percentage of youth employed or self-employed
- percentage of youth returned to school
- percentage of youth facing barriers to employment
Qualitative lines of evidence
Literature review
A literature review synthesises findings from relevant literature on youth, including evaluations of youth labour market programs. The review provides an overview of youth's educational attainment, employment and unemployment rates. It also includes a summary of labour market barriers and challenges faced by various subgroups of youth, including those furthest away from the labour market.
Document review
A document review examining administrative documents and monitoring reports provides a thorough overview of the design, delivery, governance, and early results of the modernized Strategy. Reviewed documents include meeting records of discussions,Footnote 22 project status reports,Footnote 23 memorandums on the annual CSJ results to ESDC's Deputy Minister, program performance measurement documents (including PIP and participant in-take forms), and, where available, reports and evaluations provided by members of the YESS Horizontal Evaluation Advisory Committee.
Key informant interviews
A total of 17 semi-structured interviews with 34 individuals were conducted across all YESS federal partners. Interviews were conducted with program representatives and senior level officials to discuss topics including:
- federal partners' experience with respect to the implementation of the modernized Strategy including challenges encountered, potential solutions and lessons learned
- horizontal performance measurement and reporting
- strategy's governance
Interviews were also conducted with 5 program representatives of the Youth Digital Gateway.
Questionnaire to all YESS federal partners
Questionnaires were designed and shared with federal partners to reduce the burden on key informants by gathering comprehensive information about:
- implementation of the modernized YESS
- perceptions of ESDC's leading role in the modernized Strategy
- horizontal collaboration and decision-making
All federal partners completed a questionnaire for their respective department, agency, or Crown corporation.
Focus groups
A total of 13 semi-structured focus groups were conducted with 100 participants from ESDC's YESSP. Focus groups were conducted, either in-person or virtually, with youth from various sociodemographic groups targeted by the Strategy, to learn about their experiences with the program, skills acquired, challenges, and outcomes. Discussions were held with the following targeted groups of YESSP participants:
- 3 Indigenous youth focus groups (Inuit, First Nations off-reserve, and Métis) (n=20)
- Black youth (n=8)
- Francophone youth (n=6)
- racialized female youth (n=8)
- racialized male youth (n=7)
- recent female immigrants youth (n=8)
- recent male immigrants youth (n=7)
- youth living in rural communities (n=6)
- multi-barriered youth (secondary school not completed and additional barrier(s) identified) (n=6)
- youth with disabilities (secondary school not completed) (n=14)
- youth with disabilities (post-secondary school attendance) (n=10)
Quantitative lines of evidence
Administrative data assessment
The quality and integrity of the Strategy's data held at ESDC for YESSP and CSJ since 2019 was assessed. The purpose of the assessment was to determine the extent to which the data could be used to assess the Strategy's impact and effectiveness.
Labour market outcome and incremental impact analysis
Program effectiveness is assessed by estimating incremental impacts from YESSP and CSJ participation on participants' labour market experience, through post-program:
- earnings from employment and self-employment
- incidence of employment
- use of Employment Insurance
- use of social assistance
- dependence on government income (that is, the combination of Employment Insurance and social assistance benefits receipt).
The role of the incremental impact analysis is to isolate the effects of participation from other factors. To achieve this, the incremental impact analysis compares the labour market experience of participants before and after their participation with that of similar non-participants. The difference in results between the 2 groups is then attributed to the impact of program participation (the incremental impact).
The reference period and post-program periods correspond with the COVID-19 pandemic. However, as participants and non-participants are matched based on pre-program sociodemographic characteristics, and both groups are experiencing the pandemic at the same time, differences found as part of the estimation of incremental impacts can be interpreted as the impact of program participation.
Figure 1 presents an example of incremental impact calculation.
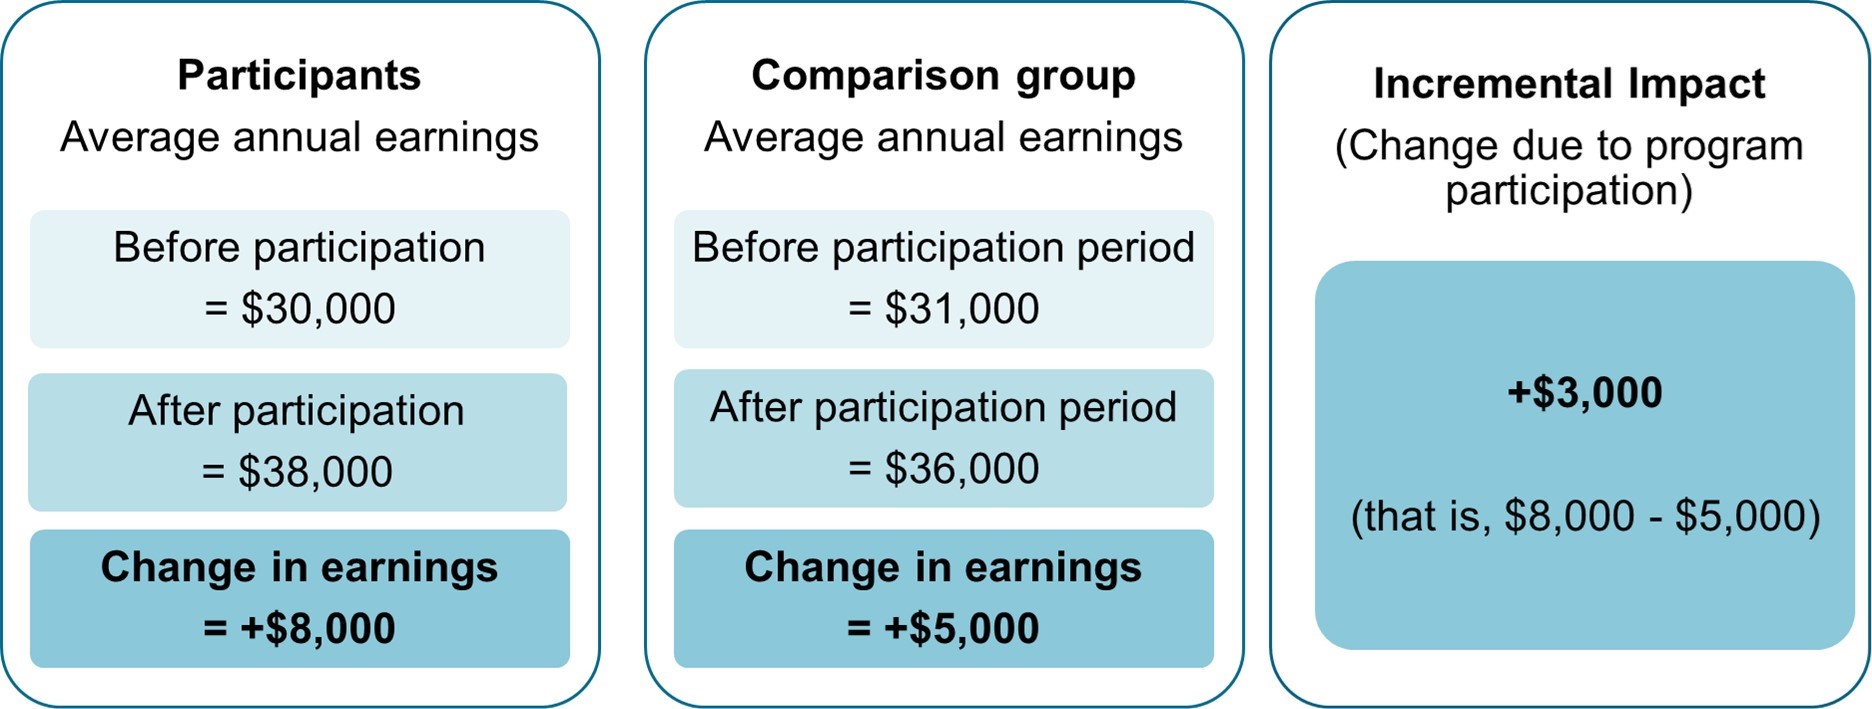
Text description: Figure 1
Incremental impacts are the difference in the pre-post participation outcomes between participants and similar non-participants.
For example:
- if the average annual earnings of participants are $30,000 before participation and $38,000 after participation, the change in earning for participants is an increase of $8,000
- if the average annual earnings in the comparison group are $31,000 before participation and $36,000 after participation, the change in earnings for the comparison group is an increase of $5,000
- the incremental impact, that is the change attributed to program participation, is $8,000 minus $5,000, which equals an increase of $3,000
For more details about the methods used for the estimation of the incremental impacts, as well as its limitations, please refer to Appendix C.
One of the key strengths of the quantitative analysis is that it is based on administrative data rather than survey responses. Compared to survey data, administrative data are not subject to recall errors or response bias.
Methodological limitations
Challenges to evaluating the impact and effectiveness of the horizontal Strategy
The examination of the impact and effectiveness of the Strategy (that is, the ability to attribute participants' post-program labour market outcomes to having participated in YESS programs and services) is limited to ESDC participants.
No data limitations are identified for CSJ as data are available for the period between 2019 to 2020 and 2022 to 2023, covering 100% of participants.
For YESSP, the data assessment revealed important gaps that limits the ability to fully assess the impact and effectiveness of YESSP for ESDC and all federal partners.
Due to challenges in accessing federal partners' disaggregate participant data, the quantitative analysis for YESSP participants is limited to ESDC participants (representing 49.5% of allocated YESSP funding). This is due to the absence of a centralized data collection system to secure the transfer of disaggregate participant data from YESS federal partners to ESDC. Previously, some federal partners uploaded select data to ESDC through the Data Collection System, which has since been decommissioned.Footnote 24 As a result, the evaluation was unable to access federal partners' participant level data for inclusion into the estimation of incremental impacts.
Since modernization of the Strategy, no new agreements have been put in place that allow for federal partners to transfer YESS participants' disaggregate data (through Information Sharing Agreements)Footnote 25 to ESDC for analysis, reporting and evaluation purposes. Prior to modernization, Information Sharing Agreements were in place between ESDC and federal partners. The lack of up-to-date Information Sharing Agreements between ESDC and federal partners also prevents access to non-ESDC participants' contact information for inclusion in opinion based activities (such as focus groups and surveys).
The analysis of YESSP incremental impacts for ESDC participants is limited to those who began their interventions between April and December 2020. The lack of participant records for the first year of YESSP (fiscal year 2019 to 2020) is due to the lack of signed agreements in the first year of the Strategy. This limits the post-program examination of incremental impacts to the most recent year for which personal income tax information is available (up to 2022, 2 years post-program).
Intervention start dates are not uniquely captured in the data; only the start of the first intervention and the end of the last intervention is recorded. Because of this data collection approach and the way intervention dates are captured, there are challenges to assigning outcomes to a "main" intervention type, as is traditionally examined in other ESDC labour market program evaluations (for example, the Labour Market Development Agreements).
This lack of start and end dates per intervention presents a challenge in terms of identifying the duration, sequencing and intensity of each intervention received. This has an impact on informing upskilling activities as reflected by successive interventions of various intensity and duration.
The incremental impact analysis does not include the regional stream of Quebec participants. There is a Canada-Québec agreement with the Ministère de l'emploi et de la solidarité sociale for the regional (YESSP) component. Aggregate information is provided to ESDC for inclusion in the Departmental Results Report.
The previous YES was evaluated 4 times (in 2005, 2009, 2015, and 2020). Due to data limitations, which were highlighted in these evaluation reports, none of the previous YES evaluations were able to examine the incremental impacts for federal partners. Going forward, governance discussions are encouraged to clarify expectations about the horizontal aspects of the YESS evaluation.
Focus groups
Focus groups provide a unique opportunity to capture the perspectives of recent youth participants from targeted subgroups about their YESSP participation, including successes and challenges.
The lack of up-to-date Information Sharing Agreements between ESDC and federal partners prevents access to non-ESDC participant contact information. As a result, the focus groups were conducted solely with ESDC's YESSP participants. While every attempt was made to ensure representation from across Canada, accessing participants' contact information (specifically mailing address) proved challenging, as this information is no longer collected by ESDC.
A total of 13 semi-structured focus groups were conducted with 100 participants from diverse socio-demographic backgrounds. Most focus groups contained 6 to 8 participants composed of a similar target group (for example, racialized female participants, Francophone youth, First Nations youth, Black youth). Due to the small number of participants per focus group, the findings are not representative of the target subgroup. As a result, most findings are presented across focus groups and not by individual subgroup.
Youth labour market status in Canada
Summary: In 2023, youth and young adults (between the ages of 15 and 34 years of age) represent approximately 25% of the total population in Canada. During this period, the full-time, permanent employment rate of non-student youth (15 to 24 years of age) is 50.7%, which is lower than that of both young adults (25 to 34 years of age) at 66.2% and adults aged 35 to 64 (57.4%). Under-represented youth and young adults in the labour market are more likely to experience lower employment rates, as they are more likely to face additional barriers to employment.
The proportion of youth Not in Employment, Education, or Training (NEET) is an indicator of the risk of social and economic disconnection and exclusion during their transition from education to employment. In 2024, 10.8% (or 815,000) of young people aged 15 to 29 were NEET. As NEET youth are less likely to be economically self-sufficient and are at greater risk of social disengagement, engaging with them and supporting their transition to the labour market can help address growing labour shortages and improve their broader social and economic outcomes.
Youth and young adult population in CanadaFootnote 26,Footnote 27
In 2023, individuals between the ages of 15 to 34 years represent approximately 25% of the total Canadian population.Footnote 28 Of this total, youth (15 to 24 years of age) represent 11.5% (4.5 million) of the total Canadian population, with 7.2% (2.9 million) being students and 4.3% (1.7 million) non-students. Of the non-students, three-quarters are employed. Young adults (25 to 34 years of age) represent 13.5% (5.4 million) of the total Canadian population, with 10.1% (4 million individuals) being post-secondary graduates. Approximately 3.4% (1.3 million) of young adults do not hold any post-secondary credentials.Footnote 29
School attendance rates by age
Over the past 2 decades (2001 to 2021), school attendance rates have risen for both those in the 15 to 19 year age range (from 77% to 86.2%) and the 20 to 24 year age range (from 48.4% to 51.9%).Footnote 30 During this period, the proportion of youth with post-secondary credentials increased (from 39.5% to 45.8%) particularly for individuals with a bachelor's degree or above (from 11.1% to 18.9%).Footnote 31 According to the 2021 Canadian Census, approximately 170,600 individuals (between 20 to 24 years of age) did not have a high school diploma.
Full-time permanent employment rate
In 2023, the full-time permanent employment rate of non-student young adults (25 to 34 years of age) is 66.2%, while non-student youth (15 to 24 years of age) have a full-time permanent employment rate of 50.7%.Footnote 32 During the same period, the adult (35 to 64 years of age) full-time employment rate is 57.4%.
Under-represented groups in the labour market
Under-represented youth and young adult groups in the labour market are more likely to experience lower employment rates, as they are more likely to face additional barriers to employment.Footnote 33
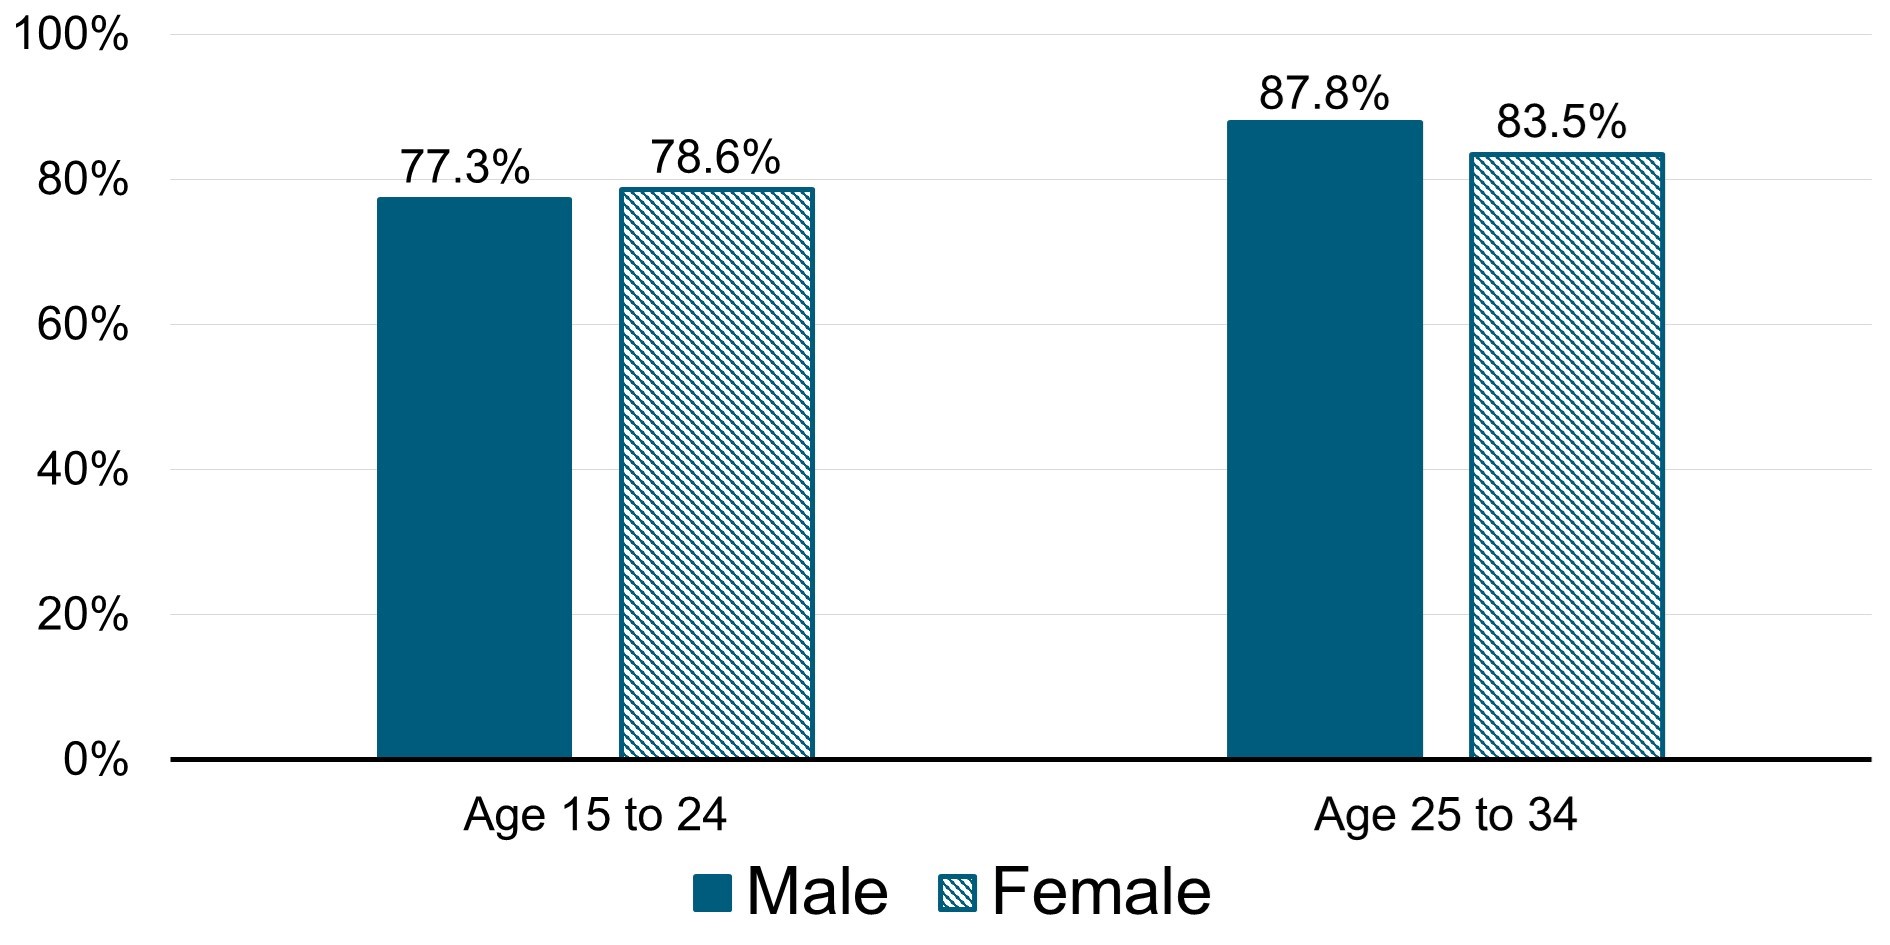
While the data show that women are narrowing the gender gap in employment, the wage gap persists, despite women being more likely to have a post-secondary diploma.Footnote 34,Footnote 35 In 2022, young adult women earned 93 cents on the dollar compared to young adult men ($28 versus $30 hourly for non-student, full time employees).Footnote 36 Chart 1 details the 2023 overall employment rate of young adults and youth in Canda by gender.
- Source: Statistics Canada, Labour Force Survey, Table 14-10-0081-01 and Public Use Microdata File Collection.
Text description: Chart 1
| Socio-demographic characteristics of non-students | Employment rate of youth ages 15 to 24 in 2023 | Employment rate of young adults ages 25 to 34 in 2023 |
|---|---|---|
| Male | 77.3% | 87.8% |
| Female | 78.6% | 83.5% |
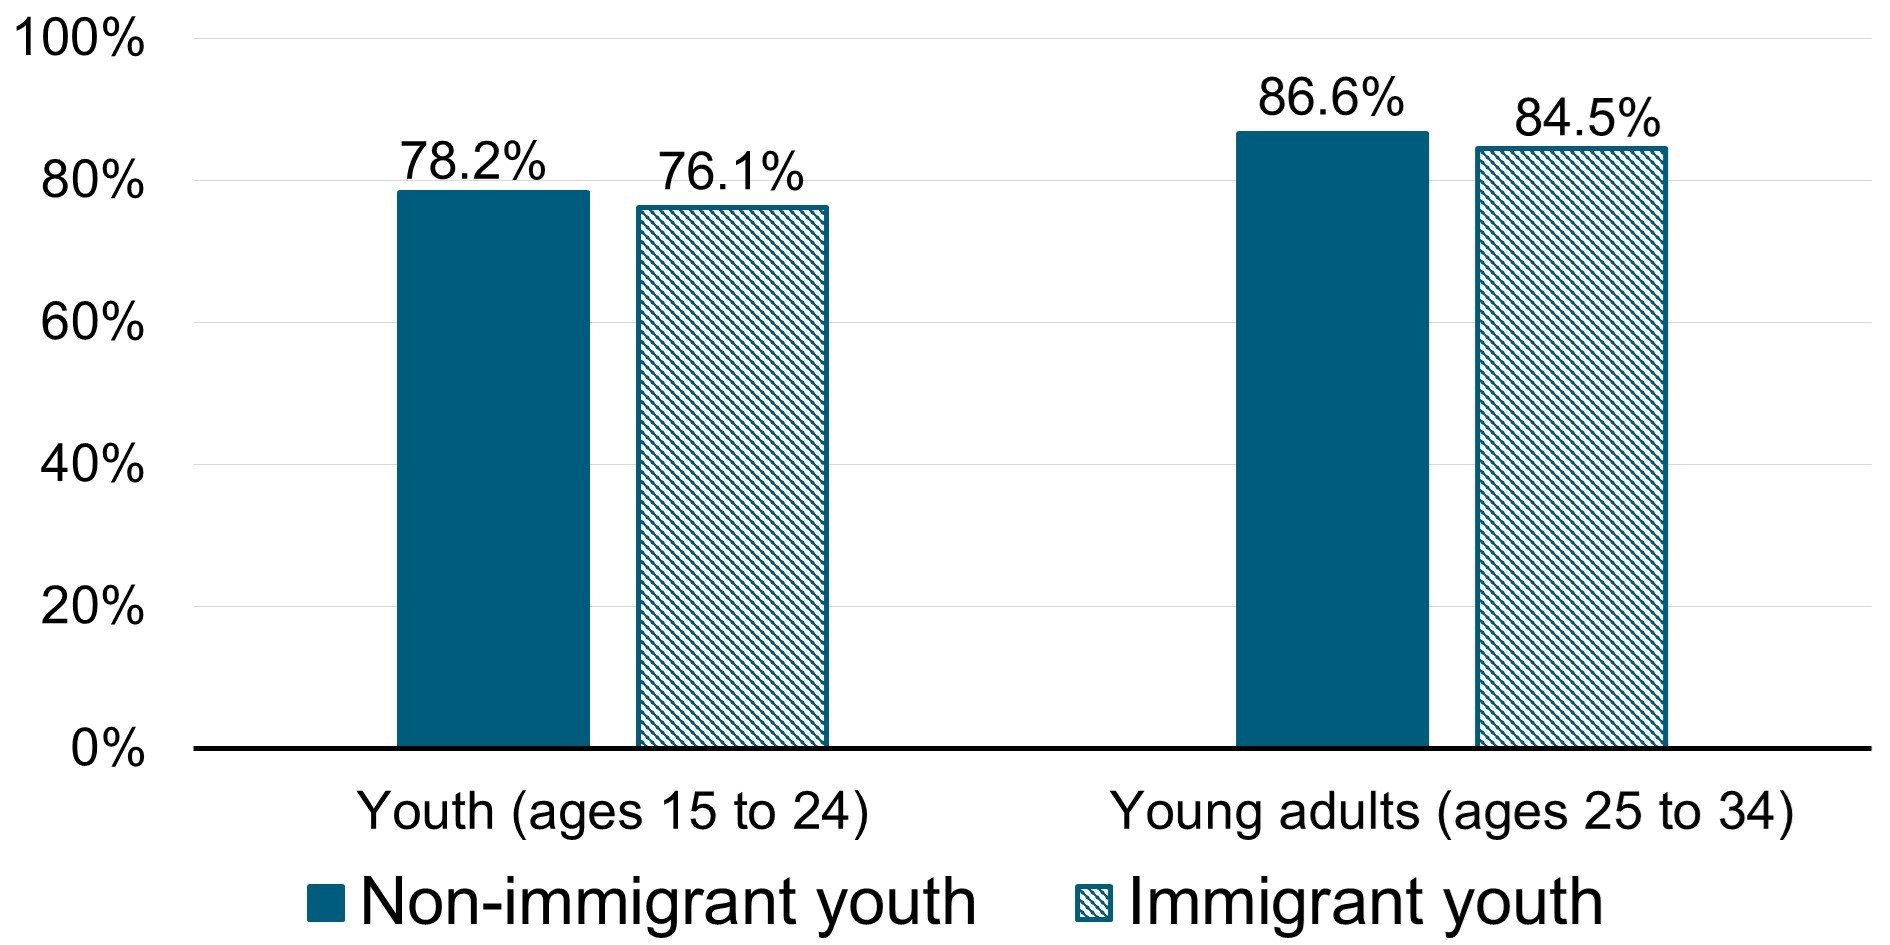
The gap persists in the employment rates between immigrant youthFootnote 37 and non-immigrant youth, which is detailed in Chart 2. Immigrant youth and young adults also have higher unemployment rates (11.7% and 6.2% respectively) than similarly aged non-immigrant youth and young adults (10.7% and 5.4% respectively).Footnote 38 This gap may be partially explained by cultural and language barriers as well education certification obtained outside of Canada, lack of Canadian work experience and professional networks.
- Source: Statistics Canada, Labour Force Survey Public Use Microdata File, Table 14-10-0440-01.
Text description: Chart 2
| Socio-demographic characteristics of non-students | Employment rate of youth ages 15 to 24 in 2023 | Employment rate of young adults ages 25 to 34 in 2023 |
|---|---|---|
| Non-immigrant youth | 78.2% | 86.6% |
| Immigrant youth | 76.1% | 84.5% |
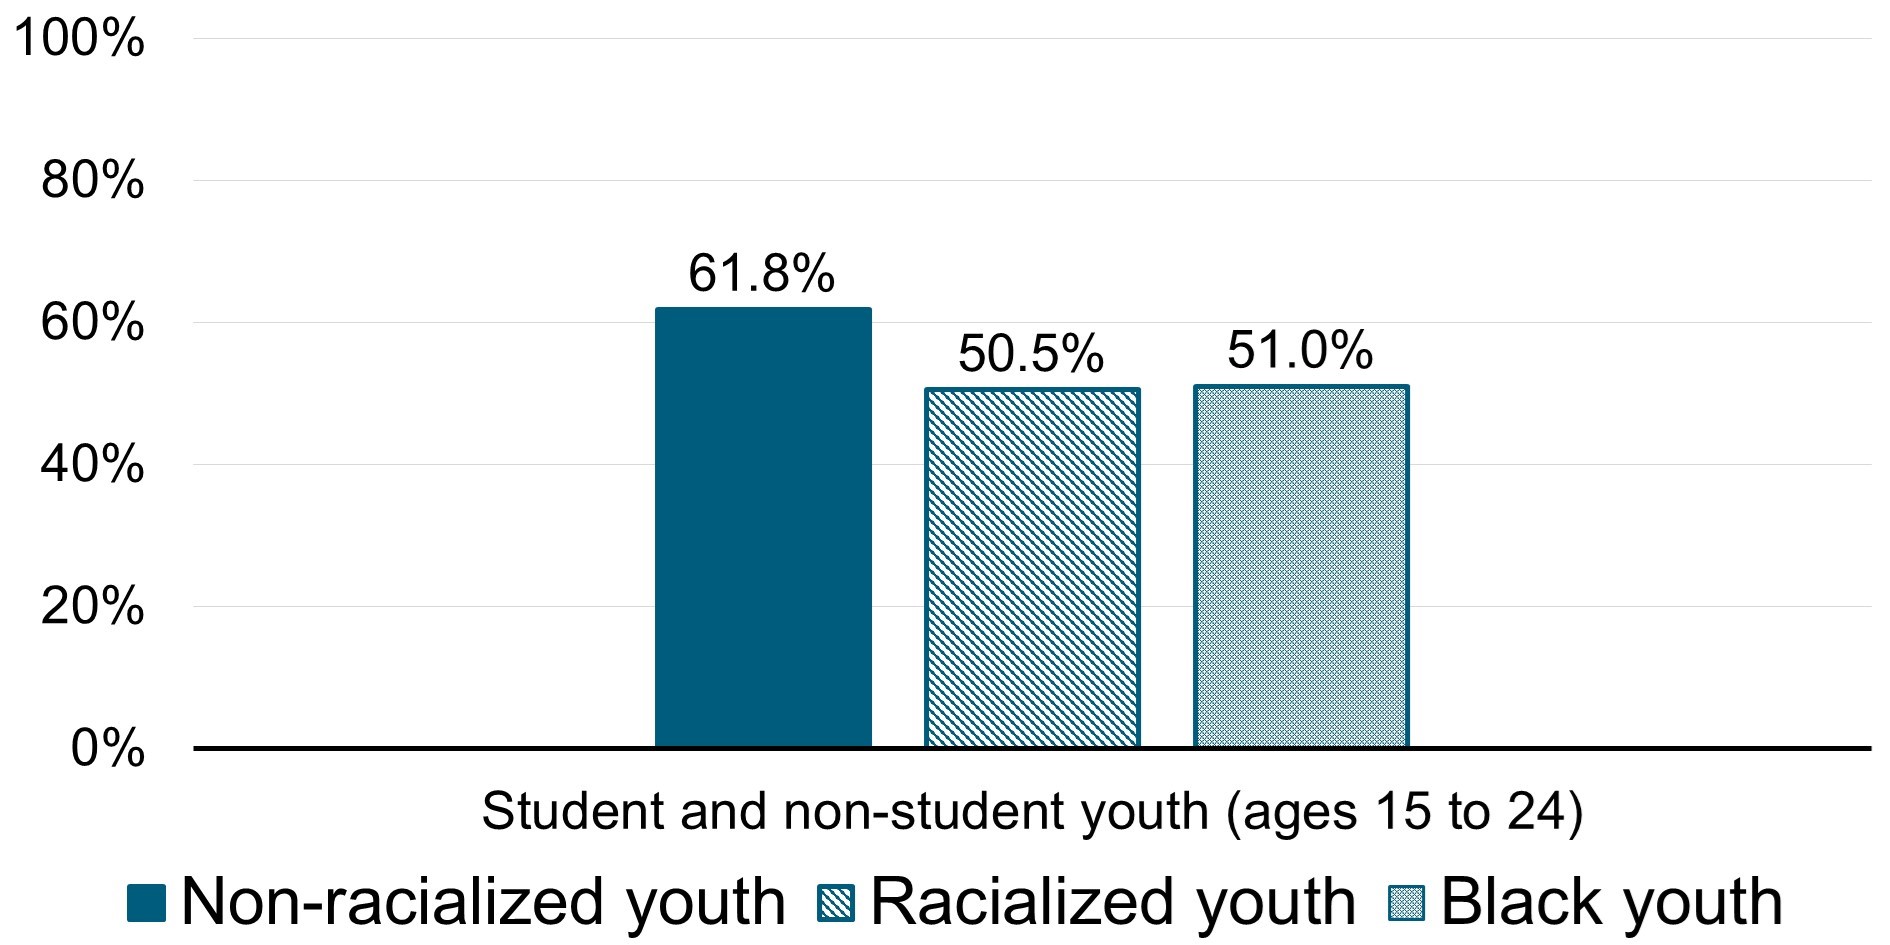
In 2023, one-third of Canadian youth (15 to 24 years of age) are racialized.Footnote 39,Footnote 40 Racialized youth generally experience lower employment rates and higher unemployment rates than non-racialized youth, in part due to systemic discrimination, racism and unequal access to resources and supports.Footnote 41,Footnote 42 Chart 3 details the employment rates for racialized youth and Black youth versus non-racialized youth. As well, the unemployment rate is higher for racialized youth (13.2%) and Black youth (16.2%) than non-racialized youth (9.7%).
- Source: Statistics Canada, Labour Force Survey, Table 14-10-0440-01
Text description: Chart 3
| Socio-demographic characteristics of student and non-student youth ages 15 to 24 | Employment rate in 2023 |
|---|---|
| Non-racialized youth | 61.8% |
| Racialized youth | 50.5% |
| Black youth | 51.0% |
In some cases, the lower employment rates may be, in part, attributed to being in education longer. In 2021, 43.5% of racialized youth attended postsecondary schoolFootnote 43 compared to 32.4% of non-racialized youth.Footnote 44However, racialized youth are less likely to find jobs that offer the same pay and benefits following graduation than non-racialized youth.Footnote 45
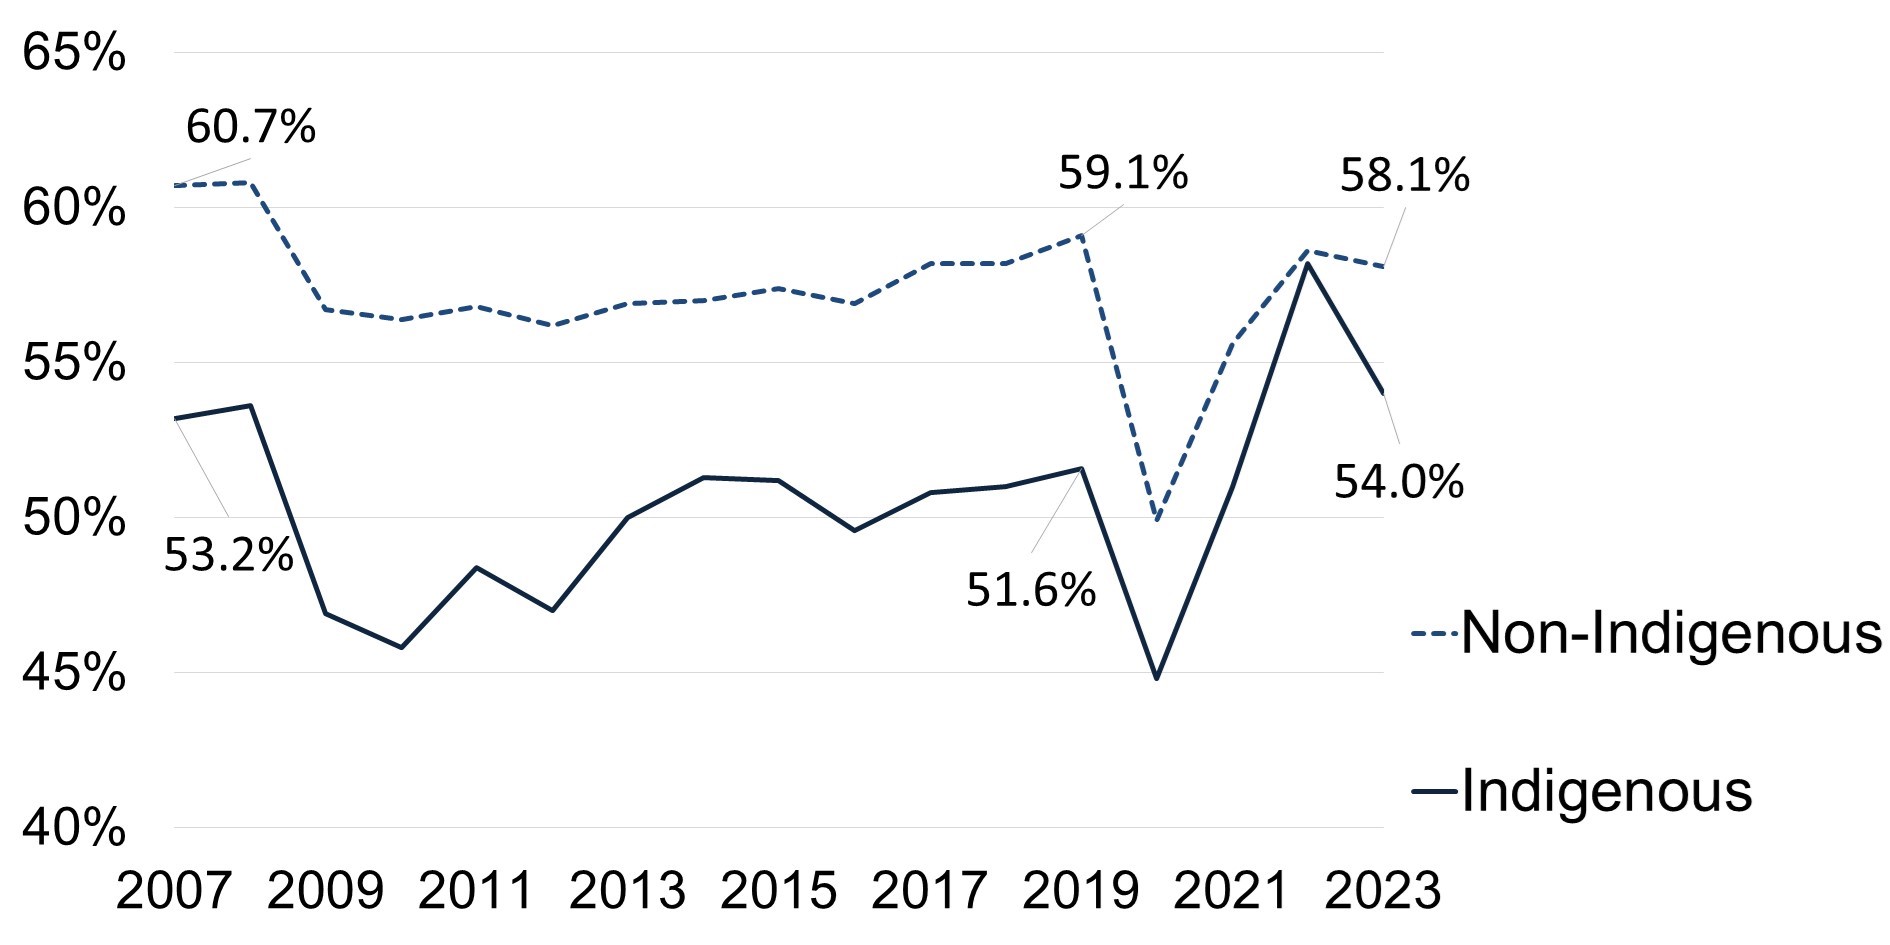
In 2023, a greater percent of off-reserve Indigenous youth attended school (+2.4 percentage points) than in 2019, however, they still have lower school attendance rates (45.1%) than non-Indigenous youth (53.2%).Footnote 46 Chart 4 details the unemployment rates of off-reserve Indigenous youth and non-Indigenous youth from. 2007 to 2023.
- Source: Statistics Canada, Labour Force Survey PUMF.
Text description: Chart 4
| Year | Employment rate for non-Indigenous youth ages 15 to 24 | Employment rate for off reserve Indigenous youth ages 15 to 24 |
|---|---|---|
| 2007 | 60.7% | 53.2% |
| 2008 | 60.8% | 53.6% |
| 2009 | 56.7% | 46.9% |
| 2010 | 56.4% | 45.8% |
| 2011 | 56.8% | 48.4% |
| 2012 | 56.2% | 47.0% |
| 2013 | 56.9% | 50.0% |
| 2014 | 57.0% | 51.3% |
| 2015 | 57.4% | 51.2% |
| 2016 | 57.9% | 49.6% |
| 2017 | 58.2% | 50.8% |
| 2018 | 58.2% | 51.0% |
| 2019 | 59.1% | 51.6% |
| 2020 | 49.9% | 44.8% |
| 2021 | 55.6% | 51.0% |
| 2022 | 58.6% | 58.2% |
| 2023 | 58.1% | 54.0% |
Off-reserve Indigenous youth also have higher unemployment rates than non-Indigenous youth (13.9% versus 10.6% respectively). Barriers to education and living in remote and underserved areas with limited economic opportunities, continue to limit labour market outcomes for Indigenous youth and contribute to socioeconomic disadvantages.Footnote 47
Between 2017 and 2022, youth in Canada experienced the largest increase in disability rate of any age group (increase from 13% to 20%).Footnote 48 Youth with disabilities are at a higher risk of not being in school or employed, which increases with severity of the disability.Footnote 49
Not in Employment, Education, or Training (NEET)
The proportion of NEET youth is an indicator of the risk of social and economic disconnection and exclusion during their transition from education to employment. The NEET population is comprised of non-students who are either unemployed (that is, looking for work and available to work) or inactive (that is, not in the labour force). In general, NEET youth face additional challenges, such as poorer mental health, the risk of falling behind peers in terms of work experiences or face challenging entering or re-entering the labour force.Footnote 50,Footnote 51
Since the 1980s, increasing postsecondary attendance and improved labour market outcomes have contributed to declining youth NEET rates in Canada. In 2024, 10.8% (or 815,000) of young people aged 15 to 29 were NEET, edging up from the record low reached in the previous year (9.9%). Footnote 52
In general, young men (15 to 24 years of age) are more likely to be NEET than young women, as more women attend school and enrol in postsecondary education.Footnote 53 Furthermore, some under-represented groups may be at higher risk of being NEET, including youth with disabilities, youth with lower levels of education, Indigenous youth and Black youth.Footnote 54,Footnote 55,Footnote 56,Footnote 57,Footnote 58,Footnote 59 As NEET youth are less likely to be economically self-sufficient and are at greater risk of social disengagement, engaging with them and supporting their transition to the labour market can help address growing labour shortages and improve their broader social and economic outcomes.Footnote 60
Comparison of ESDC's YESS participants proportional to the Canadian youth population
The Strategy has the stated objective of assisting youth, particularly those facing barriers to employment, to make a successful transition to the labour market. As shown in Chart 5, to determine whether the Strategy is reaching youth with barriers proportional to the overall Canadian youth population,Footnote 61 the evaluation compares the 2021 Census to the profile of ESDC's YESSP and CSJ participants.Footnote 62 In particular, the following sociodemographic characteristics, targeted by the Strategy, are examined:
- Indigenous youthFootnote 63
- racialized youthFootnote 64
- youth with disabilitiesFootnote 65
- recent immigrantsFootnote 66
- youth living in rural and remote areasFootnote 67
- female youthFootnote 68

- *Note: Rural and remote category represents all ages, not just youth, based on the 2021 Canadian Census.
Text description: Chart 5
| Socio-demographic characteristics | Youth in Canada | YESSP participants | CSJ participants |
|---|---|---|---|
| Indigenous | 7% | 20% | 7% |
| Racialized | 34% | 42% | 21% |
| Disability | 20% | 24% | 3% |
| Recent immigrant | 12% | 12% | 2% |
| Rural and remote | 18%* | 9% | 19% |
| Female | 49% | 48% | 61% |
- *Note: Rural and remote category represents all ages, not just youth, based on the 2021 Canadian Census.
Compared to the overall Canadian youth population, on average YESSP is reaching a greater proportion of many under-served or barriered youth populations. For example, while the overall Canadian population of racialized youth is 34%, approximately 42% of YESSP participants identified as being racialized.
When comparing the CSJ participants to the overall Canadian youth population, CSJ component reaches an equal or greater proportion of Indigenous youth, youth in rural or remote areas, and female youth. However, CSJ has a lower proportion of participants who are racialized, have a disability, or are recent immigrants compared to the overall youth population.
Summary of effective labour market programs, services and supports to assist youth
Summary: A review of academic literature and ESDC's labour market program evaluations examined which types of programs, services, and support can assist youth with finding employment.
According to the literature, the most successful labour market programs for youth rely on a holistic approach to service delivery, providing a set of tailored interventions that address specific needs of the youth participants within a single program offering. This delivery model recognizes that, in addition to a lack of skills and work experience, youth may face additional structural or individual barriers that prevent them from improving their labour market attachment.
Previous ESDC evaluations of labour market programs found the following positive results for youth. The 2020 YES Evaluation reports point to a stronger labour market attachment, even for participants who are further away from the labour market, when youth receive interventions that include a form of subsidized work experience. The 2022 Horizontal Evaluation of the Labour Market Development Agreements found that youth participants in interventions providing skills training or a wage subsidy have higher annual earnings, higher incidence of employment and are less dependent on government income supports compared to similar non-participant youth.
Programs, services, and supports that assist youth with finding employmentFootnote 69
Studies show that adverse early labour market experiences (such as unemployment), can result in long-term scarring effects for youth, including increased likelihood of unemployment later in life, lower lifetime employment earnings, and poorer health and well-being outcomes.Footnote 70,Footnote 71 Labour market programs that seek to provide youth with positive employment experiences have been found to positively influence labour market outcomes for youth into adulthood.Footnote 72
According to the literature, most successful labour market programs for youth rely on a holistic approach to service delivery, providing a set of tailored interventions that address specific needs of the youth participants within a single program offering. Footnote 73,Footnote 74,Footnote 75 This delivery model recognizes that, in addition to a lack of skills and work experience, youth may face additional structural or individual barriers that prevent them from improving their labour market attachment.
The literature points to the following interventions as assisting youth to find employment.
Skills training programs are the most widely used labour market interventions for youth, and are increasingly used in combination with other interventions, such as wage subsidies.Footnote 76,Footnote 77 The types of skills targeted by programs depend on the specific needs of youth and their distance from the labour market.Footnote 78 Furthermore, the employer and sector-based training that addresses the skills requirements of a given employer, sector or industry are also shown to facilitate the transition of youth from school to employment.Footnote 79,Footnote 80
Wage subsidies encourage employers, through financial incentives or tax credits that help reduce labour costs and risks, to provide employment opportunities for youth with limited employment experience or skills. The literature points to the effectiveness of wage subsidies in combatting youth unemploymentFootnote 81,Footnote 82 if the demand-side exists in the local labour market after the subsidized employment opportunity ends.Footnote 83,Footnote 84,Footnote 85 The literature advises about monitoring to diminish the risks associated with substitution or displacement of existing workers with those who qualify for the subsidy.Footnote 86,Footnote 87,Footnote 88,Footnote 89
Entrepreneurship programs aim to equip young people with entrepreneurial skills and encourage the transition to the labour market through self-employment. Studies show positive, however limited, results in terms of employment earnings for youth.Footnote 90
Employment services, often described as "light touch interventions" (such as, job search and resume writing assistance), may prove to be ineffective for highly-barriered individuals when offered without additional supports, as these individuals require greater assistance and supports.Footnote 91
For youth facing barriers, early interventions such as counselling, tutoring, social support and financial support are effective and are linked to positive labour market outcomes.Footnote 92 Other effective interventions include providing them with labour market information and assistance in making education decisions to help address and potentially overcome their barriers.Footnote 93 In addition, the use of labour market information to help youth enter and succeed in the labour market is of increasing importance, as youth experience frequent changes in employment in their early labour market experience.Footnote 94
Evidence from evaluations of ESDC labour market programs
Limited incremental impact analyses have been conducted as part of evaluations of active labour market programs for youth. Select findings from recent ESDC labour market program evaluations that include youth participants are presented below.
YES evaluations (2020)
The former YES was evaluated 4 times between 2005 and 2020. In 2020, 3 separate evaluations were carried out for each of the 3 YES streams. Findings point to the inherent challenges associated with helping youth facing barriers to employment. The following is a summary of the 2020 evaluation findings and considerations by stream.
Skills LinkFootnote 95
Skills Link provided short work placements and training opportunities for youth facing barriers to employment. The main findings emerged from the evaluation include:
- the magnitude of the incremental impact of Skills Link interventions on participants' labour market attachment was limited Footnote 96
- this points to inherent challenges associated with helping youth facing barriers to employment who generally require more comprehensive range of interventions
- youth who received interventions in the form of subsidized work experiences had stronger labour market attachment, relative to youth who received group-based workshops
- although the incremental impact of interventions involving a workshop approach was generally negative, analysis at the subgroup level suggests that this type of intervention was relatively more effective for youth who had a lower level of education
- in addition, impacts were relatively better for older youth (over the age of 19), particularly for interventions with a work experience component
These main findings led to the following observation:
- evidence pointed to the benefits of better tailoring interventions in line with the needs of the different segments of participating youth
Summer Work ExperienceFootnote 97,Footnote 98
Summer Work Experience provided short-term summer work experiences to students:
- the program had a very high level of satisfaction from organizations (79%) and students (89%)
- over 90% of students indicated that their experience helped them develop key competencies and traits linked to addressing complex challenges and adapting to a changing environment
- most summer students felt that participation helped pay for school expenses
Career FocusFootnote 99
Career Focus provided funding for employers and organizations to design and deliver a range of employment activities that enable post-secondary graduates to make more informed career decisions and develop their skills.
Three main findings drawn from this evaluation include:
- immediately after the completion of their respective interventions, a larger share of participants were still employed as opposed to having returned to school
- for ESDC participants, Career Focus had a positive and lasting impact on their labour market attachment
- over the 5-year post-participation period, the average annual earnings of participants were $5,535 higher than non-participants with similar characteristics
- positive impacts were relatively larger for men
- over a 10-year period, Career Focus (ESDC participants) yielded a positive return on investment for individuals and society
From these main findings, the following observations were drawn:
- youth interventions taking the form of a wage-subsidy can play a role in facilitating the entry of post-secondary graduates into the labour market, with associated positive long-term impacts
- youth targeted by Career Focus typically face lesser barriers to employment relative to youth targeted by Skills Link. This may explain, in part, the more positive outcomes found for Career Focus relative to Skills Link
Labour Market Development Agreements (2023)Footnote 100
The 2023 Horizontal Evaluation of the Labour Market Development Agreements uses administrative data to conduct statistical analysis on the impacts of programming on active and former Employment Insurance recipients, including those in the under 30 years of age category (youth participants).
The evaluation found that youth participants in skills training or a wage subsidy have higher annual earnings, higher incidence of employment and are less dependent on government income supports compared to similar non-participant youth. These positive results for youth participants are consistent with the 2017 findings from the Evaluation of the Labour Market Development Agreements.
Evaluation findings
The following section details the evaluation findings for the implementation, governance, and performance measurement of the modernized Strategy. The immediate outcomes and short-term impacts (up to 2 years post-program) of participation in CSJ and YESSP are examined relative to similar non-participants. As well, the findings from the examination of the Youth Digital Gateway and Strategic Partnership programs are reported.
Implementation of the modernized Strategy
Main findings: In response to the Strategy's modernization, federal partners made changes to existing programs, including expanding their programs' reach to target youth facing employment barriers. Implementation challenges were also identified, such as difficulties caused by funding instability due to fluctuations in annual incremental funding and late funding decisions.
The following discusses federal partners' and ESDC's experiences regarding the Strategy's modernization. Findings are drawn from questionnaires to federal partners and ESDC/Service Canada officials, a document review and interviews with 34 key informants representing all YESS federal partners.
Changes to YESS programs implemented by federal partners as a part of the modernization process
The modernized Strategy acknowledges the need for more tailored interventions to effectively support youth, particularly those facing barriers to employment. To achieve this goal, partners have implemented various changes in their YESS programs, including:
- expanding the reach of youth programs to those facing employment barriers through targeting (5 federal partners) and promotional and awareness activities (3 federal partners)
- reducing or removing educational requirements for program participants (5 federal partners)
To better support youth with barriers to employment, partners reported implementing changes, such as:
- increasing maximum contribution amounts per participant or placement (5 federal partners)
- providing additional financial support for wrap-around supports (4 federal partners), including, introducing more flexibility in terms of eligible costs to provide wrap-around services for youth (2 federal partners)
- removing their own organization-specific length limits for work placements (2 federal partners)
Challenges regarding the implementation of the modernized Strategy and partners' suggested solutions
Partners identified challenges with respect to recruitment of the targeted youth population, funding, horizontal dimension of the Strategy, and suggested potential solutions.
Funding related challenges include:
- lack of predictable funding due to the fluctuations in annual incremental funding (outside of the additional temporary funding provided for COVID-19 pandemic relief between 2020 to 2021 and 2022 to 2023) (6 federal partners)
- administrative burden associated with budget renewals and Treasury Board submissions (5 federal partners and ESDC)
- short-term funding (5 federal partners)
- late funding decisions (4 federal partners and ESDC)
- low funding levels (4 federal partners)
Federal partners stressed the importance of increased, predictable, longer-term funding to enable better planning of program implementation, more efficient use of resources (6 federal partners) and a reduction in the associated administrative burden (5 federal partners)
Please refer to Appendix A which details per federal partner the annual ongoing funding amounts, as well as the fluctuations in annual incremental funding experience between 2019 to 2020 and 2024 to 2025.
Evidence from documents reviewed and key informant interviews confirm that annual demand for CSJ and YESSP exceeds the budget available to fund all applications received by ESDC and federal partners.
Some federal partners report contribution recipients having difficulties recruiting youth experiencing barriers to employment (5 federal partners) and suggest the following:
- federal partners encouraging their contribution recipients to work closer with organizations that support youth facing employment barriers for advertisement and recruitment purposes (6 federal partners)
- federal partners conducting targeted promotional and awareness initiatives (2 federal partners and ESDC)
Some federal partners raised concerns about the horizontal dimension of the YESS, noting instances where the Strategy may not fully consider the different mandates and objectives of participating departments, agencies, and Crown corporations (3 federal partners). For example, the types of interventions offered by partners may not align with all of the Strategy's common output and outcome reporting requirements (3 federal partners). ESDC acknowledged the diversity of programs within the Strategy and stressed the importance of maintaining a horizontal policy objective and to focus on tracking the common results.
Governance
Main findings: Strategy federal partners acknowledge the importance of ESDC's role as the Strategy's horizontal lead department responsible for coordinating corporate activities, including the implementation of the new Performance Measurement Framework. Federal partners also identified areas for improvement, including the need for more horizontal collaboration, information sharing, and decision making.
The following discusses findings with respect to Strategy's governance structure and processes. The findings are drawn from the questionnaires completed by 11 YESS federal partners and ESDC, interviews with 32 key informants representing YESS federal partners and document review.
Governance structure
At the time of the evaluation, the YESS governance structure consisted of:
- Assistant Deputy Minister Interdepartmental Steering Committee is responsible for setting strategic priorities, ensuring coordinated and efficient implementation, and approving and overseeing reporting on results
- Director General Interdepartmental Committee supports the Assistant Deputy Minister committee by coordinating the implementation of the modernized YESS, including reporting on results
- Interdepartmental Working GroupFootnote 101 is responsible to assist the Director General committee in planning, implementing, and reporting on the modernized YESS. It also addresses Central Agencies requests, facilitates the sharing of best practices and leverages relationships among YESS partners
According to ESDC, the Strategy's governance structure has been revised to establish working-level committees, enabling a transition from the high-level discussions to a horizontal decision-making. ESDC confirmed that these committees meet as required.
Governance process
According to ESDC, its role as the lead department of the Strategy consists of:
- gathering input from YESS federal partners for central agencies and for reporting purposes
- supporting YESS federal partners in implementing the modernized strategy through the development of key documents, such as Memorandum to Cabinet, Treasury Board Submissions, Performance Measurement Framework, as well as tracking implementation progress
- facilitating coordination and information sharing among YESS partners
- implementation of a centralized data collection system to improve data collection and storage
Federal partners acknowledge the importance of ESDC's role in coordinating and providing guidance on Treasury Board submissions, budget proposals and policy changes (8 federal partners) and guiding partners in implementing the Performance Measurement Framework and Strategy reporting (6 federal partners).
However, partners also note areas for improvement, including the need for:
- ESDC to play a bigger role in promoting collaboration, fostering horizontal information sharing and strategic discussions (11 federal partners)
- greater interdepartmental sharing (on program features, federal partners' programs contact information, challenges and best practices) to fully leverage the benefits of YESS partnerships (8 federal partners)
- greater opportunity for working-level discussions that promote better horizontal decision-making opportunities among partners (5 federal partners)
- although there is limited documented evidence of committee meetingsFootnote 102 held between 2019 and 2024, available records show meetings mainly focused on one-way information sharing from ESDC to federal partnersFootnote 103
- some federal partners noted that there were limited opportunities to have strategic discussions (4 federal partners)
- although there is limited documented evidence of committee meetingsFootnote 102 held between 2019 and 2024, available records show meetings mainly focused on one-way information sharing from ESDC to federal partnersFootnote 103
- working with federal partners to establish realistic timelines for milestones (for example, providing input into corporate documents, just as Treasury Board Submissions) and clearly specifying the required approval levels (7 federal partners)
Performance measurement and reporting
Main findings: During fiscal year 2022 to 2023, approximately 115,000 youth participated in CSJ, while an estimated 26,260 youth participated in YESSP. Almost all Strategy federal partners achieved or surpassed their targeted outputs and outcomes. Data collection and reporting challenges were identified by federal partners, including the lack of a centralized data collection system to upload participant data to ESDC and that the shared outcomes and indicators may not capture unique information about federal partners' programs and participants.
The following section discusses findings on the extent to which a performance framework was developed and implemented, as well as challenges with respect to data collection and reporting. Findings are drawn from questionnaires to federal partners and ESDC and Service Canada officials, a document review and interviews with 34 key informants representing all federal partners.
Performance measurement requirements
The Strategy's Performance Measurement Framework, initially developed in 2019 and detailed in the 2021 Performance Information Profile, underwent updates in 2023 following revisions to the logic model.Footnote 104 ESDC subsequently created tools to ensure consistency in data collection and reporting as per the updated Performance Measurement Framework.Footnote 105
At the time of the evaluation, Strategy federal partners are required to annually report to ESDC on 4 shared output and outcome indicators, which are publicly released through ESDC's Departmental Results Report for Horizontal Initiatives:
- number of youth served
- percentage of youth employed/self-employed
- percentage of youth returned to school
- percentage of youth served who are facing barriers to employment (including women, Indigenous youth, racialized youth, youth with disabilities and rural and remote youth)
Table 3 presents results for the output and outcome indicators by Strategy partner and ESDC for fiscal year 2022 to 2023.Footnote 106 During this period, approximately 115,000 youth participated in CSJ, while an estimated 26,260 youthFootnote 107participated in YESSP (with 17,241 from ESDC and 9,018 from federal partners). The results indicate that some participants are employed/self-employed while attending school (for example, under ESDC CSJ participants employed or self-employed is 47% and returned to school is 79%). Departmental Results Report from previous fiscal years (that is, period between 2021 to 2022 and 2022 to 2023) can be found in Appendix D.
An examination of targets and achieved results found that almost all Strategy federal partners achieved or surpassed their targeted output and outcomes.Footnote 108
| Strategy partner | Youth served (n) | Employed or self-employed (%) | Returned to school (%) |
|---|---|---|---|
| ESDC: CSJ | 115,003 | 47% | 79% |
| ESDC: YESSP | 17,241 | 55% | 18% |
| AAFC | 249 | 73% | 41% |
| Canadian Heritage | 1,747 | - | - |
| CMHC | 417 | 35% | 15% |
| ECCC | 578 | 87% | 3% |
| GAC | 183 | 30% | 25% |
| IRCC | 3,225 | 75% | - |
| ISC | 3,473 | Not available | Not available |
| ISED: Computers for Schools Intern Program | 187 | 4% | 21% |
| ISED: Digital Skills for Youth | 468 | 63% | - |
| NRC | 725 | 86% | - |
| NRCan | 594 | 74% | 12% |
| Parks Canada | 645 | - | - |
- Source: Horizontal Initiatives Departmental Results Report for fiscal year 2022 to 2023
Proportion of youth participants facing barriers to employment in fiscal year 2022 to 2023 by Strategy partner:
ESDC CSJ:
- Indigenous youth = 4.2%
- racialized youth = 20.5%
- youth with disabilities = 9.1%
- female youth = 62.4%
ESDC YESSP:
- Indigenous youth = 17.6%
- racialized youth = 38.8%
- youth with disabilities = 25.3%
AAFC:
- Indigenous youth = 28.9%
- racialized youth = 29.7%
- youth with disabilities = 28.9%
- youth living in rural and remote areas = 62.5%
Canadian Heritage Youth Canada Works - Official Languages and Youth Canada Works - Heritage (respectively):
- Indigenous youth = 5% and 6.9%
- racialized youth 24% and 13.1%
- youth with disabilities: 5% and 12.7%
- youth living in Official Language Minority Community = 49% and 5.9%
- female youth = 67% and 71.4%
CMHC:
- Indigenous youth = 100%
ECCC:
- Indigenous youth = 4.5%
- racialized youth = 24.1%
- youth with disabilities = 6.4%
GAC:
- Indigenous youth = 0.5%
- racialized youth = 43%
- youth with disabilities = 3.8%
IRCC:
- newcomers to Canada = 100%
ISC: Not available
ISED Computers for Schools Intern Program:
- Indigenous youth = 5.9%
- Racialized youth = 39.6%
- Youth with disabilities = 13.4%
ISED Digital Skills for Youth:
- Indigenous youth = 5.6%
- racialized youth = 42.7%
- youth with disabilities = 6%
NRC:
- Indigenous youth = 3.9%
- racialized youth = 27%
- youth with disabilities = 3.3%
- youth living in rural areas = 3.6%
- youth living in Official Language Minority Community = 2.9%
NRCan:
- Indigenous youth = 33.5%
- racialized youth = 25.8%
- youth with disabilities = 8.3%
- female youth = 46.8%
Parks Canada:
- Indigenous youth = 15.2%
- racialized youth = 18.6%
- youth with disabilities = 12.6%
ESDC officials confirm that almost all federal partners consistently share data on the shared output and outcome indicators.Footnote 109 Federal partners also noted that they collect additional data, including skills related outcomes as per the 2021 Performance Measurement Framework (11 federal partners).
Data collection and reporting challenges
ESDC and federal partners identified the following challenges with respect to data collection and reporting.
Performance output and outcome indicators
Federal partners note that the Performance Measurement Framework does not fully account for their own departmental, agency or Crown corporation specific objectives (4 federal partners). Federal partners also explained that shared outcome and output indicators are high level and do not capture all valuable data about the unique context for their programs and participants (6 federal partners).
Federal partners also clarify that the indicator definitions leave space for interpretations and limit the comparability of data (5 federal partners). ESDC representatives note that standardizing data across all federal partners has been a challenge and acknowledged that each federal partner has its own mandate, goals, and reporting structures. In 2023, ESDC created toolsFootnote 110 to guide federal partners with standardizing the implementation of the 2023 YESS Performance Measurement Framework indicators.
Lack of centralized data collection system
ESDC confirms that the lack of a horizontal data collection system poses a challenge in collecting and transferring disaggregate data on all Strategy participants from federal partners to ESDC. Federal partners and ESDC note that the lack of a data collection system leads to manual processing of aggregate data (5 federal partners and ESDC), which can be labour intensive (2 federal partners and ESDC).
Data completeness
Federal partners and ESDC identified challenges in reporting on the outcomes of participation due to:
- low response rates to post-participation youth surveys (5 federal partners)
- a relatively low proportion of program participants agreeing to share personal and sociodemographic information (4 federal partners)
- participants' post-participation surveys not being linked to their administrative data, preventing in-depth analysis (1 federal partner and ESDC).
Canada Summer Jobs results
Main findings: Overall, CSJ participants and employers report high levels of satisfaction with participation in the program and they confirm that participants develop skills to assist them in the labour market.
Outcome trends (analysis with no comparison group) show increases in CSJ participants' employment levels and employment earnings from before to after participation.
Incremental impacts results (using comparison group analysis) found that relative to non-participants, CSJ participants strengthen their labour market attachment. Results by subgroups are consistent with the overall CSJ findings.
Between fiscal years 2019 to 2020 and 2022 to 2023, approximately 386,750 youth participated in CSJ.Footnote 111
Outcomes
An Employer Questionnaire and Participant Exit Questionnaire are conducted annually for CSJ.Footnote 112 The survey is mandatory for employers and voluntary for CSJ youth participants. Approximately 23,259 CSJ youth participants (33%) and 28,606 employers completed the questionnaires for 2023.Footnote 113 According to the Participant Exit Questionnaire, the CSJ placement was the first work experience for 12% of participants.
Through the questionnaires, employers and youth were asked to indicate their level of satisfaction with the CSJ 2023 program, as well as any challenges encountered.
Employers:
- a combined 96.1% of employers reported being very satisfied (76.3%) or somewhat satisfied (19.8%) with their experience
- additionally, 78.5% of employers were motivated to hire through CSJ due to a past positive experience with the program, and 97.4% of employers reported that they would be interested in applying for CSJ in 2024
- the main challenges identified by employers were that approved job duration was too short (30.3%) and notifications of approval for funding were provided too late (25.3%)
- approximately, 44.6% of employers reported having no challenges at all
Youth participants:
- combined 93.9% of youth participants reported being very satisfied (72.4%) or somewhat satisfied (21.5%) with their experience
- 49.2% of youth participants reported that they would have preferred to work more, with 32.2% of youth preferring more weeks and 17% preferring more hours per week
One of the main objectives of the CSJ program is to provide opportunities for youth to develop and improve their skills. For several skills, the youth participants were asked how confident they were, compared to how they felt at the beginning of the CSJ job placement, that they had the skills needed for future employment. The top 5 rated skills acquired are:
- adaptability (86%)
- collaboration (84%)
- communication (83%)
- problem-solving (81%)
- technical skills (68%)
CSJ profile and short-term outcomes trends (without comparison group analyses)
CSJ provides a short-term subsidized work experience to youth participants. Labour market literature shows that youth generally experience a maturation effect where their labour market outcomes improve due to school completion and building work experience. CSJ does make some contribution to facilitate the integration of youth into the labour market.
Table 4 presents the profile of CSJ participants who began their participation between April 1, 2019 to December 31, 2020 and of CSJ participants during the summer of 2018Footnote 114. Between April 1, 2019, and December 31, 2020, more youth participated in CSJ (115,800) than in the summer of 2018 (69,000).
During the 2 reference periods, female participants represented approximately two-thirds of participants (66% and 62% respectively). The more recent cohort of participants are on average younger, with 44% in the 15 to 19 years old category (compared with 27% in 2018). Where similar categories of sociodemographic characteristic information is available for comparison, similar proportions of participants are found.
The average duration of a CSJ placement is approximately 11 weeks, while the average cost per participant is approximately $5,020.Footnote 115
| Categories | CSJ participants who began their participation between April 1, 2019 to December 31, 2020 | CSJ participants during the summer of 2018Footnote 116 |
|---|---|---|
| Number of participants | 115,798 | 68,967 |
| Gender: Female | 62% | 66% |
| Gender: Male | 36% | 34% |
| Gender: Other | <1% | <1% |
| Age: 15 to 19 | 44% | 27% |
| Age: 20 to 24 | 43% | 60% |
| Age: 25 to 30 | 13% | 13% |
| Sociodemographic group: Person with disability | 3% | 2% |
| Sociodemographic group: Racialized youth | 20% | 18% |
| Sociodemographic group: Recent immigrant | 2% | not available |
| Sociodemographic group: Youth living in rural or remote area: | 20% | not available |
| Indigenous status: Inuit | <1% | not available* |
| Indigenous status: Métis | 1% | not available* |
| Indigenous status: Non-Status | 3% | not available* |
| Indigenous status: Registered off-reserve | 1% | not available* |
| Indigenous status: Registered on-reserve | 1% | not available* |
| Highest level of education or skills level at start of CSJ: Elementary | <1% | not available |
| Highest level of education or skills level at start of CSJ: Secondary incomplete | 12% | not available |
| Highest level of education or skills level at start of CSJ: Secondary complete | 21% | not available |
| Highest level of education or skills level at start of CSJ: Post-secondary incomplete | 12% | not available |
| Highest level of education or skills level at start of CSJ: Post-secondary complete | 7% | not available |
| Highest level of education or skills level at start of CSJ: University incomplete | 30% | not available |
| Highest level of education or skills level at start of CSJ: University complete | 18% | not available |
- Source: ESDC's Common System for Grants and Contributions
- *The Indigenous status of CSJ participants during the summer of 2018 is not fully available; however, data indicates that 9% of participants have self-identified as Indigenous.
For CSJ, the unit of analysis is the individual youth who began participated in the CSJ program during the reference period (April 2019 to December 2020).
The evaluation examines the labour market outcomes of Strategy participants (that is, the average changes that occurred for participants from the period before to the period after program participation). It is noted that outcomes only examine participants' results, and do not provide proof of program effectiveness. Program effectiveness is examined through incremental impacts, which are detailed in the following section.
The outcome trends for all CSJ participants (n=115,798) are presented in Table 5 below. On average, 88% of participants were employed in the 2 years following their CSJ placement, representing an increase of 29 percentage points from before to after CSJ participation. In addition, during the post-program period, participants earned on average $19,487 annually, representing an average increase of $12,641 from the pre-program period.
| CSJ participants | Percent employed - annual 2 year average post-program | Change in employment between pre- and post-program periods | Employment earnings - annual average post-program | Employment earnings - change between pre- and post-program periods |
|---|---|---|---|---|
| All participants (n=115,798) | 88% | +29 percentage points | $19,487 | +$12,641 |
Incremental impact results for CSJ participants (with comparison group) Footnote 117
In the case of the April 2019 to December 2020 cohort of CSJ youth participants, 87% of participants had a high school diploma or higher and most of them were returning to school following their CSJ placement (64%). In this context, it is important to situate the incremental impacts based on the unique characteristics of youth participants and their education levels.
It is noted that estimating the incremental impacts for CSJ over 2 post-program years may be the limit of what should be examined given the short length of the intervention (11 weeks on average) and the changes that youth are experiencing in their lives (including returning to school, completion of education credentials, or accessing other training programs). As a results, after 2 post-program years, the participants and non-participants may start to differ for reasons other than the effects of the program.
As shown in Table 6 (below) participating in CSJ strengthens the labour market attachment of youth participants relative to non-participants. Throughout the post-program period, CSJ participants increase their incidence of employment (ranging from 3.8 to 10.9 percentage points difference). While participants on average experience lower employment earnings in the first post-program year (by a difference of -$536), they increase their earnings in the second post-program year (by a difference of $2,321). Participants also decrease their dependence on government income supports due to their lower receipt of Employment Insurance and social assistance benefits.
| Indicators | In-program | First year post-program | Second year post-program |
|---|---|---|---|
| Incidence of employment (percentage points) | 9.3*** | 3.75*** | 10.87*** |
| Employment earnings ($) | -91 | -536*** | 2,321*** |
| Employment Insurance benefits ($) | 96*** | -831*** | -1,239*** |
| Social assistance benefits ($) | -319*** | -283*** | -266*** |
| Dependence on income support (percentage points) | -3.27*** | -6.98*** | -7.93*** |
- Significance level ***1% **5% *10%
The negative employment earnings experienced by CSJ participants in the first-year post-program is to be expected as the majority of participants return to school following participation. According to participant exit surveys, almost two-thirds of CSJ participants (64%) intended to return to school following their work experience, while just over a quarter (28%) of participants did not intent to return to school full-time.
CSJ participants who did not return to school following participation
As shown in Table 7, participants who did not return to school following their CSJ placements had, on average, higher employment earnings in both the first and second post-program years than non-participants. Overall, relative to non-participants, CSJ participants strengthen their labour market attachment through post-program increases in employment earnings and incidence of employment, while decreasing their dependence on government income supports.
| Indicators | In-program | First year post-program | Second year post-program |
|---|---|---|---|
| Incidence of employment (percentage points) | 11.27*** | 9.35*** | 15.97*** |
| Employment earnings ($) | 1,529*** | 2,634*** | 4,594*** |
| Employment Insurance benefits ($) | 136*** | -544*** | -1321*** |
| Social assistance benefits ($) | -371*** | -328*** | -267*** |
| Dependence on income support (percentage points) | -3.21*** | -7.04*** | -4.37*** |
- Significance level ***1% **5% *10%
CSJ female participants
Table 8 provides the results of the incremental impacts for CSJ female participants relative to non-participants. Female CSJ participants strengthen their labour market attachment throughout the post-program period with increases in employment earnings (second post-program year only) and incidence of employment, and decreases in reliance on government income supports, due to lower Employment Insurance and social assistance benefits receipt.
| Indicators | In-program | First year post-program | Second year post-program |
|---|---|---|---|
| Incidence of employment (percentage points) | 8.58*** | 3.83*** | 10.34*** |
| Employment earnings ($) | 142 | -91 | 3,168*** |
| Employment Insurance benefits ($) | 22 | -1,015*** | -1,446*** |
| Social assistance benefits ($) | -332*** | -290*** | -289*** |
| Dependence on income support (percentage points) | -3.77*** | -8.0*** | -9.38*** |
- Significance level ***1% **5% *10%
CSJ male participants
Table 9 provides the results for CSJ male participants relative to non-participants. As with female participants, male participants strengthen their labour market attachment following participation, however, as with the overall CSJ results, they experience lower employment earnings (statistically significant) in the first post-program year.
| Indicators | In-program | First year post-program | Second year post-program |
|---|---|---|---|
| Incidence of employment (percentage points) | 10.72*** | 3.95*** | 11.25*** |
| Employment earnings ($) | -371** | -1,840*** | 761* |
| Employment Insurance benefits ($) | 161*** | -498*** | -794*** |
| Social assistance benefits ($) | -273*** | -274*** | -242*** |
| Dependence on income support (percentage points) | -2.64*** | -5.12*** | -5.36*** |
- Significance level ***1% **5% *10%
Additional findings for subgroups of CSJ participants (that is, participants living in rural areas, participants living in urban areas, youth who had not yet completed secondary education, 20 to 24 years of age, and 25 to 30 years of age) can be found in Appendix E. The results for most subgroups show similar trends as the CSJ overall participants.
Intersectionality analysis
Incremental impact analysis of CSJ participants were also conducted using a Gender-based Analysis Plus lens to examine intersectionality factors. Where the numbers of participants and statistical model supported it, the findings for intersectionality of sociodemographic characteristics are presented.
Female CSJ participants with disabilities
As shown in Table 10 (below), CSJ female participants with disabilities strengthen their labour market attachment following participation. Relative to non-participants, CSJ female participants experience higher employment earnings during the post-program period and increase their incidence of employment (second year post-program only). Participants decrease their dependence on government income supports in the post-program due to their lower use of Employment Insurance and social assistance benefits.
| Indicators | In-program | First year post-program | Second year post-program |
|---|---|---|---|
| Incidence of employment (percentage points) | 9.47*** | -2.61 | 11.34*** |
| Employment earnings ($) | 1,911*** | 2,245*** | 3,382*** |
| Employment Insurance benefits ($) | 137 | -1,545*** | -1,663*** |
| Social assistance benefits ($) | -785*** | -740*** | -590** |
| Dependence on income support (percentage points) | -8.57*** | -13.75*** | -11.07*** |
- Significance level ***1% **5% *10%
Male CSJ participants with disabilities
Table 11 presents the detailed incremental impacts for male participants with disabilities. Relative to the comparison group, male participants with disabilities experience statistically significant increases in incidence of employment in the second-year post-program. Male participants also decrease their dependence on government income supports mainly due to their lower use of Employment Insurance.
| Indicators | In-program | First year post-program | Second year post-program |
|---|---|---|---|
| Incidence of employment (percentage points) | 15.85*** | 1.37 | 9.5*** |
| Employment earnings ($) | 680 | -900 | 582 |
| Employment Insurance benefits ($) | 385** | -235 | -1,799** |
| Social assistance benefits ($) | -412 | -60 | 519 |
| Dependence on income support (percentage points) | -4.24* | -4.26 | -9.97** |
- Significance level ***1% **5% *10%
Additional findings for intersectionality of subgroups of CSJ participants can also be found in Appendix E. The results show similar trends as the CSJ participants overall.
Youth Employment and Skills Strategy
Main findings
Evidence from the focus groups found that participants report high levels of satisfaction with the overall programs and the services received:
- most youth report that their programs focused on job readiness and job search skills, and providing additional financial supports (for example, to assist with childcare and transportation costs)
- most participants identified that they received indirect assistance in networking with employers for job placements as part of the program, while direct referrals were not as frequently reported
- few participants secured employment immediately after completing the program, but most found it beneficial for enhancing job search skills, career direction, and understanding workplace expectations
Labour market outcome trends (analyses without the use of comparison groups) for YESSP participants show:
- increases in participants' employment levels and employment earnings from before to after program participation
- the importance of educational attainment prior to QEO, ST, and QEOST participation, as participants with higher levels of education are more likely to be employed and have higher employment earnings post-program
- when participants who have not completed secondary education are examined across the 3 intervention types, programs that offer a work experience component (QEO and QEOST) show higher short-term average employment levels and employment earnings outcomes, than when participants only receive a skills training intervention
Evidence from the estimation of incremental impacts (comparison group analysis) found differences in results based on the main intervention received. The incremental impacts demonstrate that relative to non-participants, over the 2-year post-program period:
- Quality Employment Opportunity (QEO) participants strengthen their labour market attachment through higher employment earnings and incidence of employment, and lower reliance on government income supports in the short-term
- subgroup analysis is not possible due to the low numbers of participants
- Skills Training (ST) participants experience lower employment earning over the 2-year post-program period. No statistically significant results are found for incidence of employment or dependence on government income support
- results at the subgroup level are consistent with the overall ST findings
- Quality Employment Opportunity and Skills Training combined (QEOST) participants show increases in incidence of employment; however, they also experience lower employment earnings. These participants depend less on government income supports in the short-term
- most subgroups of participants increase their incidence of employment and decrease their dependence on government income supports
- increases in employment earnings are found for youth aged 25 to 30 (both post-program years), and in the first post-program year for females, youth with disabilities and youth who attended post-secondary education
- most subgroups of participants increase their incidence of employment and decrease their dependence on government income supports
Between fiscal years 2020 to 2021 and 2022 to 2023, approximately 90,700 youth participated in YESSP, of which 55,200 were ESDC participants.Footnote 118
As previously stated, the findings for this section pertain only to ESDC participants. Where available, summaries of Strategy federal partners' evaluation findings are presented in Section 7.
Outcomes
Between April 2022 and March 2023, an ESDC-specific YESSP post-program participant survey was conducted. Footnote 119 The survey was sent to all 17,241 ESDC YESSP participants asking them to rate changes (if any) in work-related skills from before to after participation. A total of 1,725 surveys were completed. The survey, which is non-representative and not stratified, provides indications that some participants improved work related skills associated with job search, communication, initiative and self-motivation, technical skills, and teamwork.
Focus groups
Focus groups were held with targeted groups of youth to discuss their experiences with the program, skills developed, and any challenges encountered with participation.
Qualifiers are used to represent the strength or frequency of responses, as follows:
- none (0% or no participants)
- few (<20% of participants)
- some (20% to 39% of participants)
- half (40% to 59% of participants)
- many (60% to 79% of participants)
- most (80% to 99% of participants)
- all (100% of participants)
Program reach
Evidence from the focus groups suggests that YESSP reached a diverse range of youth from subgroups targeted for participation. Participants reported becoming aware of YESSP mainly through social media, their social network (family and friends), and community organizations.
Participants' goals for YESSP participation
The primary goal for most targeted groups of participants was to obtain paid work experience through job placements.
Indigenous youth also identified the related goal of obtaining specialized training and certification to become more employable. Many Indigenous participants also stated that their aim was to acquire skills and knowledge specific to certain industries or occupations. Many Indigenous youth also sought to improve their soft skills, such as workplace communication and mediation skills, while others wanted to improve their life skills to make better choices and achieve success.
Black and racialized youth, rural residents, and participants with limited formal education expressed the need for on-the-job training to help transition from precarious or low-paid jobs to more secure positions.
Some participants, including new immigrants and youth with disabilities, highlighted the need for tailored career guidance and access to Canadian work experience or workplace accommodations that support their specific circumstances.
Programs and services received
Most youth identified that the program's primary focus was on job readiness and job search skills. Some youth also referenced receiving assistance with setting goals and career planning.
Indigenous youth also emphasized the importance of mentoring and support, particularly in the areas of workplace communications, interpersonal conflict resolution and problem-solving. Most Indigenous participants report that they enhanced their communication skills by participating in the program, and many learned conflict management skills to better manage workplace interactions.
Most participants also identified the importance of additional financial supports for childcare, transportation, and work-related equipment. Additionally, many participants identified programs providing access to certifications (such as First Aid and Workplace Hazardous Materials Information System). Some youth with less formal education and those from rural areas found these certifications particularly important.
Other programming elements identified as beneficial included modules on workplace culture and communication. Most youth indicated developing a better understanding of workplace rights and expectations.
Most participants spoke highly of their job placement opportunities and the support they received, whether they were provided with direct or indirect support by facilitators in the YESS program. Some participants did express concerns about the quality and suitability of job placement opportunities offered through the program. For example, a few participants reported feeling rushed or pressured into accepting positions or their job placements misaligned with their goals and preferences. A few participants also commented on the short length of the placement and suggested that the placement be extended from 3 months to at least 6 months and even up to a year.
Most participants indicated they received indirect assistance in networking and reaching out to potential employers. Indirect referrals include coaching and support by a facilitator on how to conduct one's own job search and being referred to job boards or provided with lists of contacts to call. In fewer cases, participants reported being referred directly to employers or job opportunities through the program.
Although few participants secured employment immediately after completing the program, most found it beneficial for enhancing job search skills, career direction, and understanding workplace expectations.
Barriers faced by participants to labour market and educational participation
Participants faced significant barriers, including financial challenges, mental health issues, and employment obstacles, which varied across different subgroups. Support teams, one-on-one mentorship, wrap-around supports and tailored guidance were identified by most youth as essential program components.
Tailored career guidance to meet the unique needs of diverse participants, providing directed support to those with less education, immigrants, or those in rural areas was also identified by some participants. Additional suggestions offered by focus group participants included culturally specific resources (including language and settlement services) and increased regional labour market information to help bridge their unique gaps in employment readiness.
In focus groups with Indigenous participants, the discussions centered around challenging personal and life circumstances, with most citing urban adjustment (i.e., lifestyle changes related to transition to city life). Many Indigenous youth also cited multiple barriers including mental health challenges, particularly in the context of being away from their support network. For many Indigenous participants the program was identified as helping them with developing important life skills and forming new habits including breaking away from self-limiting behaviours or practices (such as substance use). Culturally responsive programming (such as, smudging and conversation circles) was identified by some participants as helping them overcome social anxiety and develop confidence within an unfamiliar setting.
Some Black youth were seeking mentorship to access opportunities to improve their job prospects, which they perceived as limited or closed to them due to systemic barriered. A few stated they were looking for role models and were interested in seeing representation of Black leaders and mentors in their fields of interest.
Challenges identified in accessing and participating in YESSP
Participants identified various challenges to accessing and participating in the program, including:
- financial constraints and need for supports (most participants)
- transportation (many participants)
- accessing childcare (many participants)
- the program' marketing, visibility, and reach (some participants suggested increasing program visibility on social media platforms)
- responsiveness within the program (some participants identified issues with training staff turnover, and delays in staff following-up with them during the program)
Participants across subgroups reported high levels of satisfaction in their overall engagement with the program and the services provided. Findings show in addition to the paid job placement, the program provided financial assistance to help cover transportation costs (such as bus passes), childcare support, and expenses for clothing and other work-related equipment.
Best practices
Based on these findings, 5 best practices from a programming perspective have been identified when considering training and skills development with diverse youth. These best practices include providing:
- wrap-around supports including tailored guidance
- flexibility in program design
- mental health and supports
- culturally responsive programming
- mitigating financial risks with targeted supports
Several of these best practices align directly with new priorities identified with Strategy modernization including: enhanced and more flexible supports for youth and broader range of supports available to service providers (for example, case management, mentorship, job coaching and health supports).
YESSP profile and short-term outcomes trends (analyses without comparison groups)
The evaluation examines the labour market outcomes of Strategy participants (that is, the average changes that occurred for participants from the period before to the period after program participation). It is noted that outcomes only examine participants' results, and do not provide proof of program effectiveness. Program effectiveness is examined through incremental impacts, which are detailed in the following section.
The profile of YESSP participants (youth who began participation between April 1 and December 31, 2020) and SL participants (youth who began participation between January 1, 2010 and December 31, 2011) is presented in Table 12.Footnote 120 During the 2 reference periods, 3,170 youth participated in ESDC's YESSP, while almost 29,000 youth participated in ESDC's SL. When comparing the 2 profiles, YESSP participants are more likely to be female, older, and completed a higher level of education that SL participants. For example, while 24% of YESSP participants have not completed secondary education, more than half (52%) of SL participants reported not having completed secondary education.
In addition, 22% of YESSP participants completed a university degree or post-secondary diploma compared to 12% of SL participants.
For fiscal year 2020 to 2021, the average cost per ESDC YESSP participant is $18,274.Footnote 121
| Categories | YESSP participantsFootnote 122 | Skills Link participants |
|---|---|---|
| Number of participants (n) | 3,171 | 28,993 |
| Gender: Female | 52% | 41% |
| Gender: Male | 47% | 59% |
| Age: 15 to 19 | 27% | 34% |
| Age: 20 to 24 | 40% | 44% |
| Age: 25 to 30 | 31% | 19% |
| Age: over 31 | 2% | 3% |
| Sociodemographic group: Person with disability | 30% | 11% |
| Sociodemographic group: Racialized youth | 40% | 19% |
| Sociodemographic group: Recent immigrant | 13% | 6% |
| Sociodemographic group: Youth living in rural or remote area | 12% | 15% |
| Indigenous status: Inuit | 1% | not available* |
| Indigenous status: Métis | 2% | not available* |
| Indigenous status: Non-status | 6% | not available* |
| Indigenous status: Registered off-reserve | 8% | not available* |
| Indigenous status: Registered on-reserve | 8% | not available* |
| Official Languages: Francophone | 3% | not collected |
| Official Languages: Anglophone | 96% | not collected |
| Official Languages: Not declared | <1% | not collected |
| Marital status: Married or common-law | 11% | 9% |
| Marital status: Widow / divorced / separated | 2% | 1% |
| Marital status: Single | 71% | 73% |
| Marital status: Missing | not available | 16% |
| Highest level of education or skills levelFootnote 123: Secondary incomplete | 24% | 52% |
| Highest level of education or skills level: Secondary complete | 41% | 26% |
| Highest level of education or skills level: Post-secondary incomplete | 8% | - |
| Highest level of education or skills level: Post-Secondary complete | 10% | - |
| Highest level of education or skills level: University incomplete | 3% | - |
| Highest level of education or skills level: University complete | 12% | - |
| Highest level of education or skills level: Post-secondary / university incomplete | - | 6% |
| Highest level of education or skills level: Post-Secondary / university complete | - | 12% |
| Highest level of education or skills level: not declared/missing | 2% | 4% |
- Source: ESDC's Common System for Grants and Contributions.
- *The Indigenous status of Skills Link participants is not fully available; however, data indicates that 20% of participants have self-identified as Indigenous.
Units of analysis
Under YESSP, as many youth may participate in multiple YESSP interventions, the unit of analysis for the YESSP is youth participants with respect to the combination of interventions received. This unit of analysis aligns with the observed data, indicating that most youth engaged in a combined intervention, specifically Skills Training with Quality Employment Opportunity. Only a minority of youth received a single intervention. The analysis is limited to individuals who began their interventions between April 1, 2020 to December 31, 2020.
For YESSP, the outcomes are assigned based on the following 3 main interventions:
- Skills Training (ST): this unit of analysis includes participants in Accredited Skills Training and/or Employment Skills Training. Participants did not receive any other intensive interventions (such as a QEO) but may have received light touch interventions in the form of an Employment Service and/or support measure
- Quality Employment Opportunity (QEO): this unit of analysis includes participants who only received a QEO but did not receive any other intensive interventions (such as a skills training). Participants may have received light touch interventions in the form of an Employment Service and/or support measure.
- Combination of Quality Employment Opportunity and Skills Training (QEOST): this unit of analysis combines skills training acquired through Accredited Skills Training and/or Employment Skills Training with a Quality Employment Opportunity. Participants may or may not have also received an Employment Service and/or support measure as part of their interventions
Table 13 details the number of ESDC YESSP participants in each intervention type.
| Intervention typeFootnote 124 | Number of participants | Percentage of ESDC's YESSP |
|---|---|---|
| Quality Employment Opportunity and Skills Training | 1,742 | 54% |
| Skills Training | 976 | 30% |
| Quality Employment Opportunity | 312 | 10% |
| Employment Services | 143 | 4% |
| Entrepreneurship Skills Training | 39 | 1% |
| Total | 3,212 | 100% |
- Source: ESDC's Common System for Grants and Contribution.
Quality Employment Opportunity (QEO) participants
Between April 2020 and December 2020, 312 youth participated in QEO as their main intervention type, representing about 10% of ESDC's YESSP participants. On average, the duration of participation in QEO is 23 weeks.
The profile of QEO participants reveals that slightly more participants are male (51%) than female (47%).Footnote 125 Prior to participation, approximately 44% of QEO participants attended post-secondary education, of which 26% have a university degree. Nearly 19% of QEO participants do not have a high school diploma or equivalent.Footnote 126
The outcome results for QEO participants (n=312) are presented in Table 14. Due to the small number of participants, the evaluation was limited to examining subgroups by gender and educational attainment.
Overall, 84% of QEO participants were employed in the first year following the program start year, representing an increase of 29 percentage points from before to after program participation. In addition, in the 2-year post-program period, participants earned on average $24,311 annually, representing an average increase of $16,680 from the pre-program period.
The outcome results by level of education attained prior to program participation found that the higher the level of educational attainment the more likely participants are to be employed and receiving higher employment earnings post-program. Participants results show that following QEO participation:
- 78% of participants who had not completed secondary education were employed (an increase of 35 percentage points)
- 80% of participants who completed secondary education were employed (an increase of 27 percentage points)
- 91% of participants who completed post-secondary education were employed (an increase of 27 percentage points)
Outcome results by gender for QEO participants found similar results to the overall population of QEO participants.
| QEO participants | Percent employed - first year post-program | Change in employment between pre- and post-program periods | Employment earnings - annual average post-program | Employment earnings - change between pre- and post-program periods |
|---|---|---|---|---|
| All participants (n=312) | 84% | +29 percentage points | $24,311 | + $16,680 |
| Female youth (n=148) | 84% | +30 percentage points | $ 22,201 | +$15,214 |
| Male youth (n=160) | 84% | +28 percentage points | $25,916 | +$17,856 |
| Secondary incomplete (n=58) | 78% | +35 percentage points | $14,455 | $10,153 |
| Secondary complete / post-secondary incomplete (n =125) | 80% | +27 percentage points | $18,940 | $12,255 |
| Post-secondary complete (n =123) | 91% | +27 percentage points | $34,466 | $24,490 |
Skills Training (ST) participants
The outcomes for all ST participants (n=976) are presented in Table 15 below. Overall, 60% of participants were employed in the first year following the program start year, representing an increase of 13 percentage points from before to after program participation. In addition, in the 2-year post-program period, participants earned on average $10,127 annually, representing an average annual increase of $5,530 from the pre-program period.
The outcome results by level of education attained prior to program participation found that the higher the level of educational attainment the more likely participants are to be employed and receiving higher employment earnings post-program. Participant results show that following ST participation:
- 45% of participants who had not completed secondary education were employed (an increase of 12 percentage points)
- 62% of participants who completed secondary education were employed (an increase of 11 percentage points)
- 72% of participants who completed post-secondary education were employed (an increase of 19 percentage points)
Outcome analysis by additional subgroups of ST participants found similar short-term increases post-program for the percentage of participants employed (post-program increases ranging from 2 to 43 percentage points) and in average employment earnings.
| ST participants | Percent employed - first year post-program | Change in employment between pre- and post-program periods | Employment earnings - annual average post-program | Employment earnings - change between pre- and post-program periods |
|---|---|---|---|---|
| All ST participants (n=976) | 60% | +13 percentage points | $10,127 | +$5,530 |
| Female youth (n=511) | 64% | +16 percentage points | $10,615 | +$6,056 |
| Male youth (n=452) | 56% | +8 percentage points | $9,695 | +5,017 |
| Youth with disability (n=309) | 50% | +8 percentage points | $8,160 | +$5,016 |
| Secondary incomplete (n=254) | 45% | +12 percentage points | $6,126 | +$3,984 |
| Secondary complete / post-secondary incomplete (n = 501) | 62% | +11 percentage points | $8,873 | +$4,259 |
| Post-secondary complete (n =190) | 72% | +19 percentage points | $19,205 | +$11,270 |
| Indigenous youth (n=264) | 59% | +17 percentage points | $6,234 | +$3,427 |
| Racialized youth (n=421) | 60% | +13 percentage points | $11,473 | +$6,701 |
| Recent immigrant (n=108) | 69% | +43 percentage points | $18,186 | +$15,108 |
| Rural youth (n=75) | 53% | +17 percentage points | $6,257 | +$3,985 |
| Urban youth (n=908) | 60% | +12 percentage points | $10,450 | +$5,659 |
| Youth ages 15 to 19 (n=272) | 51% | +24 percentage points | $7,299 | +$5,970 |
| Youth ages 20 to 24 (n=396) | 63% | +2 percentage points | $10,270 | +$4,311 |
| Youth ages 25 to 30 (n=292) | 62% | +16 percentage points | $12,671 | +$7,028 |
Quality Employment Opportunity and Skills Training (QEOST) participants
The outcomes for all QEOST participants (n=1,742) are presented in Table 16. Overall, 76% of QEOST participants were employed in the first year following the program start year, representing an increase of 24 percentage points from before to after program participation. In addition, in the 2-year post-program period, participants earned on average $15,055 annually, representing an average increase of $9,378 from the pre-program period.
The outcome results by level of education attained prior to program participation found that the higher the level of educational attainment the more likely participants are to be employed and receiving higher employment earnings post-program. Participants results show that following QEOST participation:
- 61% of participants who had not completed secondary education were employed (an increase of 22 percentage points)
- 77% of participants who completed secondary education were employed (an increase of 23 percentage points)
- 88% of participants who completed post-secondary education were employed (an increase of 28 percentage points)
Outcome analysis by additional subgroups of QEOST participants found similar short-term increases post-program for the percentage of participants employed (post-program increases ranging from 12 to 51 percentage points) and in average employment earnings.
| QEOST participants | Percent employed - first year post-program | Change in employment between pre- and post-program periods | Employment earnings - annual average post-program | Employment earnings - change between pre- and post-program periods |
|---|---|---|---|---|
| All QEOST participants (n= 1,742) | 76% | +24 percentage points | $15,055 | +$9,378 |
| Female youth (n=908) | 80% | +28 percentage points | $14,714 | +$9,543 |
| Male youth (n=804) | 71% | +19 percentage points | $15,663 | +9,310 |
| Youth with disability (n=513) | 72% | +22 percentage points | $11,686 | +$6,751 |
| Secondary incomplete (n =416) | 61% | +22 percentage points | $10,169 | +$6,714 |
| Secondary complete / post-secondary incomplete (n =930) | 77% | +23 percentage points | $14,061 | $8,353 |
| Post-secondary complete (n =377) | 88% | +28 percentage points | $22,939 | +$14,971 |
| Indigenous youth (n=413) | 70% | +22 percentage points | $10,629 | +$6,358 |
| Racialized youth (n=681) | 79% | +29 percentage points | $16,757 | +$12,054 |
| Recent immigrant (n=256) | 89% | +51 percentage points | $23,334 | +$19,219 |
| Rural youth (n=229) | 74% | +12 percentage points | $16,199 | +$7,243 |
| Urban youth (n=1,513) | 76% | +26 percentage points | $14,882 | +$9,695 |
| Youth ages 15 to 19 (n=475) | 65% | +30 percentage points | $10,523 | +$8,589 |
| Youth ages 20 to 24 (n=693) | 76% | +17 percentage points | $14,756 | +$8,597 |
| Youth ages 25 to 30 (n=549) | 84% | +27 percentage points | $19,178 | +$11,032 |
Incremental impacts for YESSP participants
Quality Employment Opportunity (QEO) participants
As shown in the Table 17, relative to the comparison group, QEO participants strengthen their labour market attachment over the 2-year post-program period through increases in incidence of employment (by a difference of 15.6 and 8.8 percentage points respectively) and employment earnings (by a difference of $4,347 and $5,075 respectively). In the first-year post-program, participants also depend less on government income supports (by a difference of -13.1 percentage points), due to lower use of Employment Insurance benefits (by a difference of -$2,700).
| Indicators | In-program | First year post-program | Second year post-program |
|---|---|---|---|
| Incidence of employment (percentage points) | 7.02* | 15.59*** | 8.79*** |
| Employment earnings ($) | -2,869*** | 4,347** | 5,075** |
| Employment Insurance benefits ($) | -1,564*** | -2,700*** | 255 |
| Social assistance benefits ($) | -159 | -2 | not available |
| Dependence on income support (percentage points) | -5.87** | -13.1*** | not available |
- Significant level ***1% **5% *10%
- Note: For social assistance benefits and dependence of income support categories, second-year tax data was not available due to the timing of the release of T1 tax data. Employment earnings are reported on T4 tax data.
Skills Training (ST) participants
Between April and December 2020, 976 youth participated in ST as their main intervention type, representing about 31% of YESSP participants. The duration of participation in ST averaged 17 weeks.
The profile of participants reveals that slightly more females (52%) than males (46%) participated in ST.Footnote 127 Prior to ST participation, approximately 30% of participants attended post-secondary studies, with 8.5% having a university diploma. Nearly 26% of ST participants did not have a high school diploma or equivalent.
As shown in the Table 18, relative to the comparison group, ST participants are less likely to be employed in the post-program period, with a statistically significant decrease in incidence of employment in the second post-program year (by a difference of -7.9 percentage points). ST participants also have lower employment earnings over the 2-year post-program period (by a difference of -$5,796 and -$7,012 respectively). Findings for dependence on government income supports are not statistically significant. On average, participating in ST, as the main intervention type, does not strengthen the labour market attachment of participants relative to non-participants.
| Indicators | In-program | First year post-program | Second year post-program |
|---|---|---|---|
| Incidence of employment (percentage points) | -13.33*** | -4.77 | -7.92*** |
| Employment earnings ($) | -6,225*** | -5,796*** | -7,012*** |
| Employment Insurance benefits ($) | -1,371** | -2,089*** | -664* |
| Social assistance benefits ($) | 396 | 462 | not available |
| Dependence on income support (percentage points) | 5.35 | -2.15 | not available |
- Significance level ***1% **5% *10%
- For social assistance benefits and dependence of income support categories, second-year tax data was not available due to the timing of the release of T1 tax data. Employment earnings are reported on T4 tax data.
Quality Employment Opportunity with Skills Training (QEOST) participants
Between April 2020 and December 2020, nearly 1,750 youth participated in QEOST, representing about 55% of ESDC's YESSP participants. On average, the duration of participation in QEOST is 23 weeks.
The profile of QEOST participants reveals that slightly more participants are female (52%) than male (46%).Footnote 128 Prior to QEOST participation, approximately 33% of participants attended post-secondary studies, of which 12% have a university diploma. Nearly 24% of QEOST participants did not have a high school diploma or equivalent.
As shown in the Table 19, relative to non-participants, in the first post-program year, QEOST participants have a higher incidence of employment (by a difference of 13.1 percentage points) and are less likely to depend on government income supports (-8.4 percentage points), mainly due to lower receipt of Employment Insurance benefits (-$1,063). Lower employment earnings are found in both post-program years for participants relative to non-participants, however, only the second year is statistically significant (-$2,759). Incidence of employment is not statistically significant in the second post-program year.
| Indicators | In-program | First year post-program | Second year post-program |
|---|---|---|---|
| Incidence of employment (percentage points) | 3.87* | 13.13*** | 4.67 |
| Employment earnings ($) | -4,913*** | -1,049 | -2,759** |
| Employment Insurance benefits ($) | -1,157*** | -1,063** | 54 |
| Social assistance benefits ($) | -104 | -193 | not available |
| Dependence on income support (percentage points) | -1.69 | -8.37** | not available |
- Significant level ***1% **5% *10%
- For social assistance benefits and dependence of income support categories, second-year tax data was not available due to the timing of the release of T1 tax data. Employment earnings are reported on T4 tax data.
Findings for select QEOST and ST subgroups by gender, disability, and age groups can be found in Appendix F.
YESS federal partners' evaluation findings
The following section provides short summaries of 6 federal partners' evaluation findings or internal reviews. Overall, evidence points to program participation assisting youth in developing skills to assist them in finding employment. Programs aim to support youth facing barriers to integrate into the labour market. High levels of satisfaction the program are reported by both participants and employers/sponsors. Some summaries point to challenges in administering the program due to late funding decisions.
The following 3 federal partners have either completed or will be completing their own evaluations of the modernized Strategy for public release as per the 2016 Policy on Results, and summaries are included in this report:
- ISED: Evaluation of Computers for Schools Plus (CFS+) and Computer for Schools Intern (CFSI) programs (publicly released in fiscal year 2022 to 2023)
- NRC: Evaluation of the Industrial Research Assistance Program (publicly released in fiscal year 2022 to 2023)
- CMHC: Evaluation of the Housing Internship for Indigenous Youth Program (due for approval in 2024 to 2025)
The following federal partner is completing its own evaluation, as per the 2016 Policy on Results; however, a summary of results is not included in this report:
- AAFC: Evaluation of the Youth Employment and Skills Program (due for approval in 2024 to 2025)Footnote 129
The following 4 federal partners completed an internal review for inclusion in this evaluation:
- PCH: Study of the Young Canada Works Initiative
- ISC: First Nations and Inuit Youth Employment Strategy - Summary of Internal Review
- ISED: Digital Skills for Youth (DS4Y) Program Analysis
- Parks Canada: YESS Advisory Project
Canadian Heritage: Study of the Young Canada Works Initiative
Introduction
This study examines the Young Canada Works (YCW) initiative and is intended to support the evaluation of YESS conducted by ESDC. YESS is delivered by 11 federal partners, including Canadian Heritage, which is responsible for implementing YCW. The study presents findings on the themes of relevance, equity, outcomes and Canadian Heritage-ESDC coordination between 2019 to 2020 and 2022 to 2023. The methods used in the study are as follows: administrative and financial data analysis, literature review, and analysis of 11 key informant interviews with program staff and representatives of the organizations that redistribute YCW funding.
Mandate of the Young Canada Works initiative
The YCW initiative provides funding to employers to create jobs and internships for young Canadians between the ages of 15 and 30. YCW is broken down into 2 programs:
- YCW Heritage offers employment in the heritage, arts and cultural sectors
- YCW Official Languages offers the opportunity to gain work experience while building skills in the first or second official language in an official language minority community (OLMC)
Both YCW programs have 2 streams offering internships for graduates lasting from 4 to 12 months, and summer/short-term jobs for students lasting from 6 to 16 weeks (see Figure 2). YCW funding is redistributed by 11 organizations.Footnote 130 The YCW Secretariat ensures coordination between Canadian Heritage and ESDC.
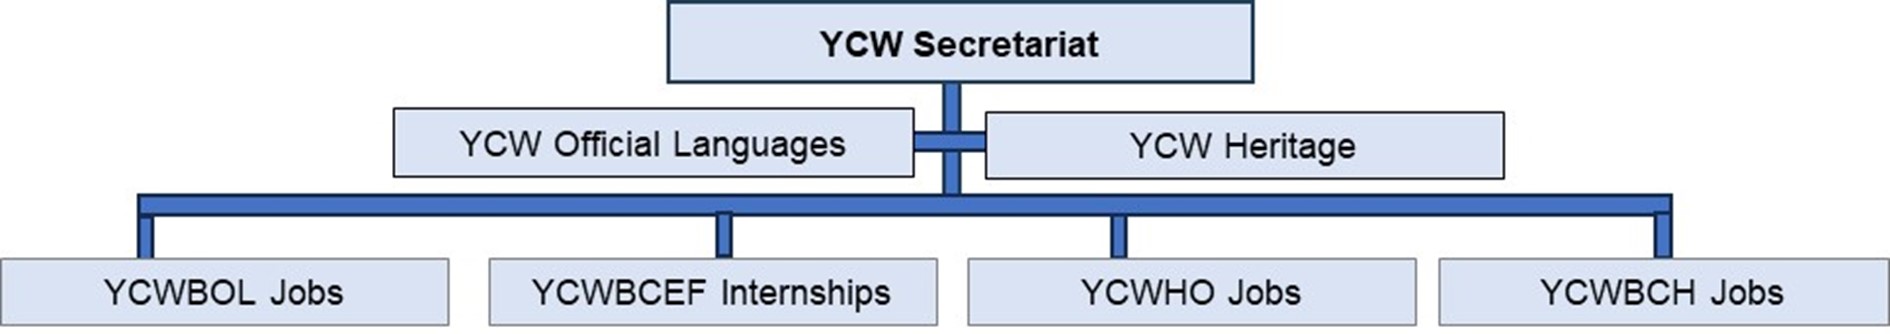
Text description: Figure 2
The YCW Secretariat is responsible for coordinating the YCW Official Languages and YCW Heritage programs. Both programs offer two streams each, providing internships for graduates and summer/short-term job opportunities for students. The YCW Official Languages streams are YCW in Both Official Languages (YCWBOL) and YCW in Building Careers in English and French (YCWBCEF). The YCW Heritage streams include YCW in Heritage Organizations (YCWHO) and YCW in Building Careers in Heritage (YCWBCH).
Relevance
YCW funding is in high demand, and only 39% of the demand could be met. YCW funded a total of 8,656 work placements and internships during the study period. In total, 52% were funded using regular funding, while 48% were funded by additional funding and COVID-19 top-up funding (Table 20).
| YCW programs | Number of jobs and internships funded using regular funding | Number of jobs and internships funded by additional funding and COVID-19 funding | Total |
|---|---|---|---|
| Heritage | 1,662 | 3,482 | 5,144 |
| Official Languages | 2,861 | 651 | 3,512 |
| Total | 4,523 | 4,133 | 8,656 |
- Source: YCW internal data. Common Budget Information YCW.
COVID-19 top-up funding allowed for more employers and a larger portion of participants' wages to be funded. This one-time funding enabled YCW to meet all employer demand between 2020 to 2021 and 2021 to 2022. According to key informant interviews, employers have had more difficulty recruiting since the emergency funding ended, given the labour shortage and competitive wages. Because of this, and because funding has returned to pre-COVID-19 levels, the number of YCW participants dropped from 2,332 to 1,681 between 2019 to 2020 and 2022 to 2023.
Equity
The number of participants belonging to equity groups increased over the study period, from 35% to 61%. YCW Heritage exceeded its targets for participants from equity groups, except for racialized people in 2019 to 2020. YCW Official Languages reached nearly all its targets in 2022 to 2023, except for Indigenous people.Footnote 132
To ensure better access to equity groups during the study period, YCW:
- increased targets for equity groups in 2022 to 2023
- YCW Heritage modified its terms and conditions to replace the terms "student" and "graduate" with "young person" and YCW Official Languages has undertaken the process to modify its terms and conditions
- developed a promotional strategy targeting equity groups in particular
- offered flexibility in the length of jobs and internships
- awarded additional points to employers that included measures for employment equity groups
- allowed participants to obtain a job or internship in their region instead of more than 125 km awayFootnote 133
In addition, the majority of participants (93%) who responded to the surveyFootnote 134 said their employer had removed at least one barrier to employment over the course of the study. While YCW helps provide better access to equity groups, the key informant interviews identified the following barriers:
- the age limit of 30 reduces access to YCW, particularly for Indigenous peopleFootnote 135
- the permanent resident criterion limits access to young people from equity groups
- wagesFootnote 136 are not competitive enough, limiting participant recruitment
- YCW's participant recruitment portal does not offer the option to search for candidates by equity group.
Outcomes
Short-term: YCW participants acquired occupational skills
- YCW funds jobs that enable participants to develop various skills and gain work experience:
- almost all participants (99%) who responded to the survey said they had strengthened and/or acquired various general skills needed in the job market
- in particular, participants said they developed the following skills: communication, adaptability and problem solving
- YCW Heritage funds jobs in museums, libraries and archives
- these jobs are difficult to access, as they require candidates to have years of previous work experience
- YCW Official Languages enables participants to practise one of the 2 official languages in the workplace:
- more than half of the YCW Official Languages participants who responded to the survey (63%) said they practised their second language or an Official Language Minority Community's official language during the study period
- YCW promotes networking on the job or internship
- more than half of the participants (59%) who responded to the survey said they had the opportunity to network during their employment in the study period
Medium-term: half of YCW participants who completed an internship have obtained a job
YCW mainly offers summer short-term jobs to young people returning to school. However, the internship component has enabled several graduates to be hired as a result of their participation in YCW. Half of the employers offering internships (51%) who responded to the survey hired a YCW participant during the study period. The majority of participants (93%) who obtained a summer job and responded to the survey said that YCW enabled them to choose a field of study or career path.
Canadian Heritage-ESDC coordination
YCW changed its performance measures to target more young people from equity groups, a priority of the new 2019 YESS. This complicated YCW's reporting, as participant self-identification is voluntary, and the information cannot be broken down into Canadian Heritage and ESDC-funded participants. According to key informant interviews, the reporting required by ESDC does not consider YCW's other objectives: to support organizations in the heritage sector, ensure the vitality of Official Language Minority Communities and promote second-language learning.
Key informants interviewed also noted that collaboration and communication between ESDC and YCW are good, but there is an administrative burden when YCW must send information to ESDC on short notice. In addition, YESS provides annual funding, limiting YCW's efficiency. Additional funding is generally granted in the summer, while the majority of targeted jobs are also in the summer. As a result, some employers must return program fundingFootnote 137 because of the lack of alignment between the awarding of this funding and employment needs.
Canada Mortgage and Housing Corporation: Preliminary results from the Evaluation of the Housing Internship for Indigenous Youth
At the time of the Horizontal Evaluation of YESS, Canada Mortgage and Housing Corporation (CMHC) was in the process of conducting an evaluation of its Housing Internship for Indigenous Youth Program (HIIY) under the Strategy. The following information provides preliminary indications of program outcomes.
Scope of the evaluation
The evaluation focuses on the HIIY's relevance, coherence, responsiveness, effectiveness, impact, and efficiency. It covers the period from between fiscal years 2018 to 2019 and 2022 to 2023, which includes the program's change from the Housing Internship for First Nation and Inuit Youth to HIIY.
Preliminary results
The following outlines preliminary results of the HIIY Evaluation (covering the period between fiscal years 2018 to 2019 and 2022 to 2023), based on the available evidence at the time of preparing this summary. These results have not been formally triangulated and may be subject to change in the final HIIY Evaluation report as new analysis and evidence emerges. The evaluation uses the following lines of evidence:
- key informant interviews:
- CMHC staff (4 interviews completed with 6 interviewees)
- HIIY Sponsor - Employer (11 interviews completed with 11 interviewees)
- HIIY Interns - past program participants (7 interviews completed with 7 interviewees)
- Indigenous partners (1 interview completed with 2 interviewees)
- literature review
- document review
- administrative data review
Overall, the HIIY is well-received by key informants including CMHC staff, sponsor (employer) organizations, and youth interns. The program fills a continued need to provide Indigenous youth with paid internships and to support the development of housing sector capacity within Indigenous communities. Currently, the HIIY complements other existing housing and internship/employment programs directed to Indigenous youth. During the scope period, the program funded more than 2,200 internships. Early evidence suggests that the HIIY program enabled interns to develop hard and soft skills. Finally, while the HIIY top-up funding increased the program's reach, it also limited the ability of staff to be proactive in planning and outreach because of the short periods associated with the funding.
Finding: There is a continued need for a program that provides Indigenous youth with paid internships in the housing sector
Statistics Canada data shows that Indigenous youth (aged 15 to 29) are more likely to be unemployed compared to non-Indigenous youth.Footnote 138 Indigenous youth face systemic barriers to education and employment. Literature and key informant interviews highlighted challenges including less access to education, training, and employment, in addition to lack of access to the internet and transportation in some communities.Footnote 139 Interviews with sponsor (employer) organizations reported that substance use, mental health, and trauma were challenges that accompanied some Indigenous youth into their internships.
Key informant interviewees noted that Indigenous youth need more awareness about opportunities within the skilled trades and other professions.
Finding: There is a continued need for a program that supports housing capacity in Indigenous communities
Indigenous communities face capacity challenges that affect their ability to address housing needs. Skills identified as required by communities include housing administration and management; housing construction and maintenance; and supportive services.
Access to labour is important to support housing development. Several sponsors (employers) said they rely on the HIIY program to address labour shortages in their communities.
Finding: HIIY is a unique program that complements both housing programs and employment programs
There are other youth, and specifically Indigenous youth internship programs, funded through Indigenous Services Canada, the Youth Employment and Skills Strategy, other levels of governments, and through Indigenous and private organizations.
Document reviews and interviews with CMHC staff found that although there is some overlap in the populations served, HIIY has a unique focus on developing skills within the housing sector and therefore developing housing sector capacity in Indigenous communities. This sets it apart from other programs.
Finding: Early evidence suggests that HIIY provides an opportunity to participate in employment and training experiences that positively contributed to the development of skills
Interviews with youth interns and sponsors (employers) noted that skills developed include:
- hard skills, including computer skills; managing finances; housing construction, renovation, how to use tools; housing maintenance; and tenant relations
- soft skills, including communications; teamwork; problem solving; and time management
Finding: Throughout the years covered by this evaluation, the HIIY program has received incremental top-up funding that exceeds its original A-base funding. These top-ups have enabled the program to increase the program's reach. However, the announcements for top-up funding are often on short notice, which makes it challenging for staff to proactively plan, conduct outreach, and promote the program
CMHC staff and sponsor (employer) interviewees shared their desire for longer-term, stable funding to better plan and develop more meaningful internships. Suggestions from sponsors (employers), youth interns, Indigenous partners, and CMHC staff include to improve the internships including:
- offering higher/competitive salaries that match cost of living
- longer internships
- more opportunities for networking
- greater access to wrap-around employment supports
- innovative partnerships with industry to address housing skill and capacity needs
Indigenous Services Canada: First Nations and Inuit Youth Employment Strategy - Summary of internal review
Indigenous Services Canada (ISC) is responsible for the delivery of the First Nations and Inuit Youth Employment Strategy (FNIYES) as a partner in Employment and Social Development Canada's (ESDC's) Youth Employment and Skills Strategy (YESS) horizontal initiative. FNIYES is comprised of 2 programs:
- First Nations and Inuit Summer Work Experience Program: supports initiatives to help First Nations and Inuit youth acquire skills, prepare for full-time employment and earn income to support post-secondary education, through summer work experiences.
- First Nations and Inuit Skills Link Program: supports initiatives that help First Nations and Inuit youth acquire essential employability and job-related skills, learn about career options and prepare for employment and career development, through co-operative education placements, internships and mentored work placements.
FNIYES programs are unique relative to the other programs under the YESS strategy due to their primary focus on First Nations and Inuit youth skills development. The program delivery structure aligns with ISC's mandate to enable Indigenous control of program delivery, providing services to members of the community, and defining their specific local labour market gaps.
Methodology
FNIYES program officials completed an internal program review to support this horizontal evaluation. The scope of the internal review covers June 2019 to March 2023 (June 2019 is the start of the YESS modernization) and this document summarizes the findings.
The findings are based on a mixed method approach comprising the following lines of evidence: document, data, and file reviews and analyses, as well as the examination of hundreds of qualitative narratives that included completed submissions of the Youth Evaluation data collection instrument. Further, written submissions were received from 15 recipients through a call-out for commentaries, though some were not included as they fell outside the time-period of this review.
Limitations were encountered with respect to quantitative results from 2019 to 2023. These are not available as the percentage of reports received for each of those fiscal years has not reached the Education Branch 85% threshold required to publicly publish results.Footnote 140
FNIYES successes
Increasing demand suggests that both FNIYES program streams are successful and well-utilized among First Nations and Inuit youth. Its popularity among First Nations and Inuit youth is driven by the opportunities to gain experience and important skills for employment, in addition to earning income. For example, First Nations and Inuit youth report learning specific competencies related to their placement, such as new knowledge and skills, as well as transferable soft skills such as communication and teamwork. Many describe this as the most positive aspect of their placement. Additionally, First Nations and Inuit youth shared that their self-confidence increased because of their experience, and that they learned to be more responsible. They also expressed their gratitude for the employment opportunity, as it helped them support their families and gain exposure to different types of employment. In addition, as positive aspects of their placements, many First Nations and Inuit youth reported that they were able to build new relationships/friendships, work in/with a team, and (re)connect with their community and culture.
Furthermore, workplaces have generally provided a supportive, professional, and safe work environment for First Nations and Inuit youth. This level of support contributed to the positive experiences reported by many First Nations and Inuit youth.
Overall, the FNIYES programs provide opportunities for First Nations and Inuit youth to learn and further develop their skills and readiness for employment, while offering an enjoyable experience at the same time. FNIYES has also allowed First Nations and Inuit youth to reimagine their future, expanding options and shedding light on new possibilities.
FNIYES challenges
Regarding the period covered (2019 to 2023), several identified challenges were related to the COVID-19 pandemic restrictions between 2020 and 2022. However, when asked what could be done to improve First Nations and Inuit youth placements or the FNIYES programs, most First Nations and Inuit youth indicated their satisfaction with how the program is currently being delivered. Among those who did provide comments on areas for improvement, most of the feedback focused on meeting the increasing demand for FNIYES and providing more opportunities to: learn about different types of employment/skills; spend more time in placements; obtain more funding; and earn higher wages.
An additional challenge was the receipt of completed Program Reports and the Youth Evaluation data collection instruments; however, it should be noted that this is unrelated to the modernization of YESS, but rather reporting and capacity issues internal to ISC.
Innovation, Science and Economic Development Canada: Evaluation of the Computers for Schools Intern Program
An evaluation of Computers for Schools Plus (CFS+) and Computer for Schools Intern (CFSI) programs was completed in 2023, examining the achievement of program expected outcomes for the period from April 1, 2016, to March 31, 2022. The findings below are drawn from multiple lines of evidence, including literature and document reviews, stakeholder interviews, surveys of current and former interns, and a review of performance, administrative and financial data.
Finding: The CFSI program supported youth in developing skills and gaining practical work experience to increase their employability, which is aligned with federal government priorities
The CFSI was successful in providing practical work experience to youth. It was noted during interviews that the CFSI had increased the employability of youth interns through participation in internships, which positioned them advantageously to move forward in their careers with other employers.
Finding: The CFSI provided learning opportunities and enhanced employability for diverse youth. Interns developed digital skills and secured employment in a technology field. Helping interns to connect with potential employers was identified as an area of opportunity, while broadening eligibility was identified as a way to improve diversity
Nearly 1,675 youth interns were hired over the 6 years covered by the evaluation. Interviewees agreed that CFSI was effective in supporting learning opportunities, skill development, and employability for youth. The evaluation survey found that internships increased the digital and career skills of youth and 56% of interns reported being employed following their internship. While a slight majority of the interns surveyed reported that the program put them in a better position to make contacts with potential employers (57.6%), almost 1 in 4 interns indicated this was not the case (22.9%).
The evaluation found that diversification of participants in the CFSI program remains a priority. From 2018 onward, more than one-third of interns hired identified themselves as racialized (36%), which was higher than the established targets. A total of 19% of interns identified as female, just shy of the 20% target. This represents an improvement over the 15% noted during the last evaluation.
Finding: Interns expressed a high level of satisfaction with the CFSI program, although some challenges were noted regarding internship duration and the competitiveness of wages. Opportunities for improvement included more support for access to training and skills acquisition
Overall, the majority of interns surveyed (83.8%) were satisfied with the CFSI program. Most also agreed (88.7%) that there is a need to continue providing this kind of experience to youth, and further agreed that they developed new skills through their experience with the CFSI program (79.6%).
While many interviewees noted that the internship duration was too short, almost half of the interns surveyed reported that the length of the internship was just right (48.1%). Interns were less satisfied with the hourly wage, with only 50% of interns surveyed reporting they were satisfied. Slightly less than half of the interns (46.9%) agreed that the internship salary was competitive with similar jobs in their local labour market. CFS+ Affiliates noted that offering competitive wages was a challenge, as there was a single amount of funding allocated per intern, and offering a higher wage meant reducing the duration of the internship.
Digital Skills for Youth Program review
The Digital Skills for Youth (DS4Y) program is a non-repayable contribution program, delivered under the Government of Canada's Youth Employment and Skills Strategy, that provides youth with work opportunities requiring digital skills, and training opportunities in both digital and soft skills.
In 2022, ISED completed an examination of the DS4Y program outcomes for fiscal years 2019 to 2020, 2020 to 2021 and 2021 to 2022 using program data drawn from Recipient Organization quarterly and final reports, interviews with Recipient Organizations and Internship Host Organizations and a survey of DS4Y interns.
Finding: DS4Y provided increased learning opportunities for youth
Over the 3 complete years of activity, the indicators showed that the program surpassed its target number of 200 Internship Host Organizations (IHOs) and 630 interns. During this period, 5,596 youth were hired as part of the DS4Y program as the influx of COVID funding in 2020 to 2021 and 2021 to 2022 allowed the program to reach more youth. The program also attained or was very close to its target of 50% of interns being female. The review found that the 200-300% increase in the number of IHOs (from 464 in 2019 to 2020 to 1,398 in 2020 to2021 and 1,728 in 2021 to 2022) and interns (from 700 in 2019 to 2020 to 2,153 in 2020 to 2021 and 2,743 in 2021 to 2022) during the pandemic suggests that the restrictions reinforced the need for digital capacities in small-businesses and not-for-profit organizations, stimulating their interest in DS4Y. Similarly, restrictions reduced job possibilities for young people, potentially stimulating their interest in internships.
Finding: DS4Y participation was of benefit to youth interns and indicators show that participants gained experience, learned new soft skills and enhanced or gained new digital skills
Stakeholder feedback and program data show that DS4Y internships were of benefit to the interns: the experience enhanced their soft and digital skills, gave them essential work experience, in most cases their first formal work experience, it provided training, helped them transition from school to the workplace, and increased their confidence and employability. In particular, 93% of the surveyed interns noted an improvement/enhancement of their soft skills over the course of their internship. Further, the interns reported that they were given the opportunity to participate in training or upskilling activities that enhanced their digital skills (86%) and their workplace skills (100%) during their internship.
Finding: DS4Y interns enhanced their employability and found employment, most in jobs requiring digital skills or in employment that was orienting them in a digital skill career
All surveyed interns (100%) stated that the skills and experience gained during their internship enhanced their employability. Program data indicated that prior to April 2020 and the pandemic restrictions, 94% of participants found employment following their internship, although this figure decreased to 72% in 2020-21 and 59% in 2021-22 following the COVID-19 restrictions.
National Research Council Canada: Evaluation of Industrial Research Assistance ProgramFootnote 141
The evaluation of the National Research Council's Industrial Research Assistance Program (NRC IRAP) covered the period between fiscal years 2017 to 2018 and 2021 to 2022. It assessed NRC IRAP's reach, effectiveness, efficiency and relevance. A comprehensive mixed-methods approach was used in the evaluation, including data and document reviews, internal and external interviews, case studies, a survey, focus group discussions, journey mapping, an international comparison study and a partial benefit cost analysis.
In addition to its core program, NRC IRAP provides support through numerous other temporary and ongoing initiatives. This includes the Youth Employment Program, through which small- and medium-sized enterprises receive funding to hire qualified post-secondary graduates as interns.
The information below outlines the evaluation findings specific the Youth Employment Program and its youth participants.Footnote 142
Summary of findings
Efficiency: Youth component is perceived as well integrated within the core program
The level of integration of various service offerings into the core IRAP varies. The youth component was perceived to be more integrated than other non-core program components. Awareness of the Youth Employment Program was generally high among all stakeholders consulted for the evaluation.
Reach: Youth reach increased
NRC IRAP provided more youth, and specifically more female youth, than ever before with job placements within small- and medium-sized enterprises clients' projects. The program also reached more youth who identify as visible minorities, Indigenous, and persons with disabilities.
Youth reach almost doubled between the 2 evaluation periods
NRC IRAP supported 7,232 youth job placements which represents 11.7% of the total high quality jobs supported by the program within client firms during the evaluation period (2018 to 2021). At the time of reporting, 5,823 of the youth placements had been completed and 4,121 (that is, 71%) of youth continued to be employed post program engagement.
Reflecting the increase in available funding, the number of youth participating in the Youth Employment Program increased from 4,878 in the previous evaluation period (2014 to 2017) to about 7,232, representing about a 50% increase in the number of unique youth participating in the program. Most youth participants came from Ontario, Quebec, British Columbia, and Yukon. Most youth placements were in the Information and communication technology sector, followed by manufacturing and materials and energy and resources.
More female youth and more youth from underrepresented groups were reached
In response to federal government commitments to support the career advancement of women in Science, Technology, Engineering and Mathematics fields, NRC IRAP increased the proportion of female youth engaged in the program over the last decade. The growth in number of female youth reached between fiscal year 2013 to 2014 (earliest available data) and fiscal year 2021 to 2022 was about 262% while that of male youth was about 57%. The proportion of youth in the program who are female increased compared to the previous evaluation period (38% in 2018 to 2022 vs 32% in 2014 to 2017). During the evaluation period, there was also a steady increase in the proportion of female youth annually engaged by the program from 31% (in 2017 to 2018) to 54% (in 2021 to 2022).
The program also reached more youth who identify as racialized, Indigenous, and persons with disabilities (see Table 21).
| Subgroups | 2014 to 2017 | 2018 to 2021 | Percentage point increase |
|---|---|---|---|
| Women | 32% | 38% | + 6 percentage points |
| Racialized youthFootnote 143 | 17% | 22% | + 5 percentage points |
| Indigenous youth | 1% | 2% | + 1 percentage points |
| Youth with disabilities | 1% | 2% | + 1 percentage points |
- Note: Equity, diversity and inclusion data were being provided on a voluntary basis by participants.
- Source: NRC administrative data
Parks Canada: YESS Advisory Project
Program description
As one of the partner agencies receiving funding via the YESS, Parks Canada is the only partner who hires youth directly in a range of job opportunities across the country, many of which support the tourism industry.
Data from multiple lines of evidence were collected for this advisory project. These include:
- document review
- data analysis of the program's hiring outcomes
- interviews with Parks Canada staff, including supervisors of youth participants (n=11)
Additionally, as part of ESDC's reporting requirements, surveys were conducted by Parks Canada's Human Resources and Employee Wellness Directorate involving youth participants and supervisors. The survey results were used as secondary data, complementing the primary lines of evidence listed above. The participant exit surveys from the 2022-23 and 2023-24 cycles had response rates of 14% (n=77) and 22% (n=144) respectively.
Objective and scope
As part of ESDC's horizontal evaluation of the YESS, partner departments and agencies such as Parks Canada have been encouraged to conduct their own evaluation work. As such, Parks Canada launched an advisory project in October 2023 to assess the effectiveness of Parks Canada's YESS interventions.
This advisory project built upon the horizontal evaluation's scope by identifying questions and reporting on issues specific to Parks Canada's interventions, namely:
- Skill development: To what extent have the supports and services offered under the YESS contributed to the acquisition of skills and employment amongst youth?
- Hiring objectives: How effective is Parks Canada at achieving its hiring objectives for youth facing barriers?
- Supports for youth with disabilities: To what degree are managers and supervisors equipped with the necessary tools and knowledge to effectively hire, integrate, and support youth with disabilities throughout their employment?
The scope of the advisory project included the activities and results generated since the start of the YESS modernization, covering the period from June 2019 to October 2023.
Key findings
Skill development
Findings from multiple lines of evidence indicate that Parks Canada's YESS interventions contribute to skill acquisition and enhance employability for participating youth. Participant surveys provides insights into self-reported skill improvements among participants. For instance, in the 2022 to 2023 cycle, 79% of respondents report improvement in at least one skill area: 74% in transferable skills, 27% in technical skills, and 52% in career navigation skills. Furthermore, in another survey conducted with supervisors, 54% of respondents recognize considerable improvements in transferable skills among participants, and 37% report some improvement.
Participants also report increased confidence, strategic thinking, and communication skills. Interviews with supervisors support these findings, often highlighting that practical experience and acquired skills improve employability. Confidence, particularly in operating equipment and interacting with visitors and colleagues, is notably improved. However, career navigation skills shows mixed results, with 48% of surveyed supervisors reporting no improvement or finding these skills not applicable.
Data also reveals a high satisfaction rate among youth involved in the Strategy. Surveyed participants cite opportunities for growth, positive team environments, and supportive colleagues and management as key benefits. Despite positive feedback, some participants desire more substantial responsibilities and career progression support.
The analysis of surveyed participants further reveals diverse post-contract paths: two-thirds intend to return to school or formal training, 17% are employed with Parks Canada, 8% are seeking employment, and 5% are exploring future education or training opportunities. These findings emphasize the varied outcomes for youth post-contract.
Hiring objectives
Data indicates that Parks Canada's YESS program has raised and exceeded its hiring objectives for employment equity groups every year during the period under review. The program utilizes data on labour market availability to shape these hiring objectives.
At Parks Canada, employment equity data for the YESS is gathered from youth who self-identify in participant forms during the hiring process. Data collection efforts on self-identification have been consistent over the past 5 years, as Parks Canada collects self-identification data for all temporary youth employees, including non-YESS participants. However, the response rates among non-YESS participants remain low, resulting in poor data quality. Additional efforts are needed to improve response rates for these groups to ensure accurate and comprehensive data collection. Enhanced efforts to improve self-identification data collection among all temporary youth hired at Parks Canada would be beneficial in demonstrating the overall proportion of youth facing barriers who are hired within the Agency.
Establishing and nurturing relationships with local entities that support youth facing barriers was highlighted as a key strategy to the strategy's success. Parks Canada further encourages the hiring of youth facing barriers by providing recruitment supports, such as the development of an Indigenous recruitment guide and resources on inclusive job postings.
Supports for youth with disabilities
Parks Canada provides a variety of tools and resources to support the hiring and integration of youth with disabilities. These resources include comprehensive hiring guides, accessibility tools, and training materials available through the organization's online platforms. Despite these provisions, there is a noted gap in awareness and utilization of these resources among supervisors, indicating a need for improved communication and training to ensure these tools are effectively used.
Interviews conducted with managers and supervisors participating in the YESS offer insights into how the guidance and resources designed to support youth with disabilities are perceived. A recurring theme in the responses is a desire for targeted training tailored to the unique needs of youth with disabilities. Supervisors shared instances highlighting gaps in available knowledge on how to effectively implement accommodations and provide a conducive work environment for youth with disabilities. This gap is not limited to physical accommodations but extends to understanding and navigating mental health issues and other invisible barriers that youth may face.
When asked about the supports that would be most helpful in addressing these gaps, responses narrowed in on a desire for enhanced communication channels and a support network for supervisors. Recognizing the difficulties of implementing a 'one-size-fits-all' approach to training for supporting various disabilities, some respondents suggested the usefulness of an expert contact point for learning best practices and sharing resources.
Summary of findings
Findings from multiple lines of evidence suggest the YESS enhances foundational skills like confidence, which boosts employability. The mixed results in career navigation skills highlighted an opportunity for the strategy to strengthen these capabilities, further preparing youth for the labour market.
The advisory project found that Parks Canada's YESS exceeded its hiring objectives for employment equity groups, though evidence also highlighted an opportunity to review and refine its data collection methods and objectives, to better track progress and identify areas for further improvement.
The YESS staffing process at Parks Canada is aligned with the program's objectives to hire youth facing barriers, evidenced by a proactive approach through targeted recruitment.
Evidence from multiple lines of evidence suggested that managers and supervisors of YESS participants at Parks Canada are somewhat equipped to provide sustained support for youth with disabilities, though evidence suggested that targeted training and enhanced resources would be beneficial to meeting these objectives.
Youth Digital Gateway
Summary: Launched in July 2021, the purpose of Youth Digital Gateway is to deliver holistic, client-centric digital services for youth, with a focus on youth employment, skills, and services. The overall budget for Youth Digital Gateway is nearly $31.8 million over 6 years between 2019 to 2020 and 2024 to 2025.
The project aims to:
- establish a client-centric approach for a Government of Canada digital platform for services and tools supporting youth employment, skills development, learning and community service
- continue to engage youth directly in the design, co-creation, and testing of new and improved digital services
- transform the way services are delivered to youth to better meet their needs by building new digital services and tools
Challenges were experienced in the design and delivery of the Youth Digital Gateway, in part due to the pre-launch period being interrupted by the COVID-19 pandemic. As the project approaches its completion date, a comprehensive, lessons learned exercise will be conducted across policy, program and the project team.
For more information about the Youth Digital Gateway, please refer to Appendix G.
Strategic Collaboration projects
Summary: The YESS Strategic Collaboration projects aim to strengthen the connections between key actors across the youth employment ecosystem (service delivery, employers and industry, and/or educational or training sectors), and to promote the adoption of innovative and effective practices. Between March 2019 and fiscal year 2023 to 2024, ESDC invested nearly $33 million in 9 Strategic Collaboration projects with a total number of 13,000 participants.
Monitoring, activity and annual reports revealed to what extent recipients carried out planned activities, produced expected outputs and achieved intended objectives. However, given that most projects are still operating as of September 2023, it is too early to provide a comprehensive assessment of the extent to which all strategic collaboration projects achieved their intended objectives. There are, however, concrete examples and achievements reported for projects that started in 2019, including assisting youth in completing training, obtaining certification and obtaining employment or becoming self-employed.
Context
The YESS Strategic Collaboration projects aim to strengthen the connections between key actors across the youth employment ecosystem (service delivery, employers and industry, and/or educational or training sectors), and to promote the adoption of innovative and effective practices. Employment and Social Development Canada invested nearly $33 million in 9 Strategic Collaboration projects with a total number of 13,000 participants. The list of projects, budget, number of participants when applicable and stated objectives are presented below.
NPower Canada National Expansion Initiative: Launching Opportunity Youth into Digital Careers
Active years: July 2019 to March 2022
Budget: $3,712,106
Number of participants: 3,560
Objectives:
- enroll 3,560 low-income youth into IT Workforce Development Programs across Canada, especially in communities under-represented in the technology sector, and provide them with IT skills to secure employment
- contribute to youth employment initiatives to build an evidence-based community of practice
- expand services to 2 new Canadian regions and expand the network of hiring partners from 200 to at least 500 employers
- ensure responsiveness to industry and employers needs
Big Brothers Big Sisters of Canada: Mentor Canada
Active years: March 2019 to March 2023
Budget: $7,879,904
Number of participants: Nil
Objectives:
- capture the landscape of mentoring programs and services across Canada and develop a pan-Canadian mentoring strategy
- expand existing or create new digital platforms that connect mentors and mentees to mentoring service providers and leverage existing tools, best practices and co-create new tools and resources to fill gaps in mentor programming
- establish a network of provincial and regional affiliates across Canada
- deliver a public education campaign to build the mentoring movement across Canada
MaRS Discovery District
Active years: March 2019 to September 2023
Budget: $5,033,162
Number of participants: 8,200
MaRS Discovery District in partnership with the "Opportunity for all Youth" coalition of employers will connect 8,200 work ready NEET youth to meaningful work. Specific objectives include:
- increase the number of NEET youth securing meaningful employment
- mobilize large employers across Canada to join the coalition and hire NEET youth
- improve employers' hiring practices and change their perception about NEET youth
- mobilize and assist community employment service providers to better prepare NEET youth to meet the hiring needs of coalition employers
- work with governments to improve programs and policies for youth employment
Ontario Association of Youth Employment Centres: Canadian Council for Youth Prosperity
Active years: July 2019 to July 2024Budget: $6,570,771
Number of participants: Nil
The recipient, through the Council for Youth Prosperity, will deliver the National Youth Workforce Development Initiative. The Council will address the lack of a centralized and representative entity to provide leadership and capacity building to achieve a supportive youth workforce development strategy and ecosystem. Specific objectives include:
- create a youth workforce development strategy to support young people by enhancing their ability to navigate and leverage employment opportunities
- provide recommendations to inform national and provincial/territorial related efforts
- identify and enhance sectoral capacity to improve job retention for youth impacted by trauma and/or those living with mental health and/or disability challenges
- advance the use of technology to improve navigational supports
St. Paul's Foundation of Vancouver: Foundry Works! Youth Employment and Skills Strategy for Young Adults Accessing Foundry
Active years: April 2021 to March 2024
Budget: $3,870,000
Number of participants: 750
The recipient will collaborate with the organizations in the Foundry Works! model to deliver the YESS program to 750 youth with barriers to employment and to increase capacity across the youth service provider network to better support youth, and to help employers hire and retain youth. The Recipient will use a model that blends health and employment or training services to help participants develop work-related skills and gain paid work experience to successfully transition into the labour market.
Nova Scotia Community College: The Future is Youth: Maximizing Pathways to Post Secondary Education, Skill Development and Employment
Active years: September 2020 to March 2024
Budget: $1,006,560
Number of participants: 21
The recipient will deliver Accredited Skills Training intervention to assist 21 youth facing barriers, including 12 Indigenous youth, 1 youth with disability, and 8 visible minority youth giving them the opportunity to benefit from the interventions and supports, which will enable them to develop their skills and employability to prepare them to obtain and keep employment. Activities include case management or assessment, accredited skills training and other supports such as housing and nutrition.
A Way Home: Working Together to End Youth Homelessness
Active years: October 2021 to September 2023Budget: $4,246,834
Number of participants: 587
The recipient will deliver employment services and Quality Employment Opportunity interventions and other supports to assist 587 youth facing barriers by providing them with the opportunity to remove homelessness as a barrier to employment.
CIO Strategy Council: Youth Employment Non-profits: Digital and Data Readiness R&D Consortium
Active years: September 2022 to March 2024Budget: $399,208
Number of participants: Nil
The recipient will develop, test, assess, establish a consortium and produce recommendations to benefit non-profit organizations with their interventions involving youth employment services in the digital skills-building ecosystem.
Findhelp Information Services
Active years: September 2022 to September 2024
Budget: $648,500
Number of participants: Nil
Findhelp Information Services is a social innovation project aiming to improve Access to Services for Canadian Youth to support them on their employment journey.
This project will create intelligent data technology to match Canadian youth and youth partners to a nationwide network of relevant resources, including face-to-face services, social services, pre-employment supports, and employment opportunities.
Monitoring, activity and annual reports revealed to what extent recipients carried out planned activities, produced expected outputs and achieved intended objectives. However, given that most projects are still operating as of September 2023, it is too early to provide a comprehensive assessment of the extent to which all strategic collaboration projects achieved their intended objectives. There are, however, concrete examples and achievements reported for projects that started in 2019, as follows.
Supported by survey of participants and employers, NPower Canada served 3,681 unemployed or underemployed and low-income youth. Of them, 3,017 (82%) have successfully completed the program. Graduates have earned globally recognized certifications such as the Google IT Support Professional certificate and the Microsoft Azure Fundamentals Certificate. As well, 2,849 (71%) secured employment or enrolled in postsecondary education. Employers reported high satisfaction rates with youth hired through NPower.
Mentor Canada was launched in 2019 by Big Brothers Big Sisters of Canada, the Alberta Mentoring Partnership and the Ontario Mentoring Coalition. Mentor Canada engaged with organizations across Canada to promote the mentoring movement. For example, Mentor Canada:
- launched the community of practice in April 2023
- developed a training on Attunement for Quality Mentoring Relationships for mentoring practitioners and mentors
- worked with Partners for Youth with Disabilities to adapt 3 training modules for Canadian audiences from the US Disability Mentoring Certificate Program and online training offered in the USA since 2017
- supported provincial and/or regional networks such as Ontario Mentoring Coalition and the Big Brother Big Sister agencies in Saskatchewan
- ongoing refinement of existing and new digital platforms (such as, Mentor Connector, e-mentoring platform) and development of new platforms (national training strategy and Quality Mentoring System)
The Canadian Council for Youth Prosperity carried out outreach activities with employers, partners and youth including:
- launching the Black Seed program to improve Black youth employment in Canada
- attending the Cannexus 2023 (Canada's Career Development Conference) with a booth, panel discussion and presentations
- hosting 3 webinars with employers and produced reports on ongoing youth unemployment
- carrying nationwide youth survey and focus groups
The project with St. Paul's Foundation of Vancouver is progressing with some challenges to reach the established targets. As of March 31, 2022, 551 youth were served with 215 (39%) are employed or self-employed and 90 (16%) who returned to school.
The Nova Scotia Community College delivered accredited skills training interventions to 19 participants with 10 employed and 7 who returned to school.
The Strategic Collaboration working group
A Strategic Collaborations working group was formed in 2019 with the objectives to:
- further address the systemic disincentives that keep service providers (and their partners across the ecosystem) from working together
- support the development and scale of novel solutions that drive breakthroughs in employment for barriered youth
The working group produced a report to:
- generate a collective reflection on Strategic Collaborations and lessons learned
- explore evaluative approaches to capture the impact of these projects
- identify future challenges in the youth employment and youth supports ecosystem, and opportunities to work together
To better capture the collective impact of their systems change work, working group members explored shared evaluation options and identified relevant indicators. However, they were not able to move the shared evaluation work beyond the preliminary conceptualization phase.
The working group generated many benefits, including increased awareness, reach and engagement, knowledge sharing, and opportunities for innovation. The working group did, however, encountered challenges related to a perceived lack of a clear mandate, group curation and resourcing challenges, and challenges related to funding and reporting models.
Conclusion
The YESS is the Government of Canada's commitment to help youth, particularly those facing barriers to employment, get the information and gain the skills, work experience and abilities they need to make a successful transition into the labour market.
Summary of findings
Implementation
As part of the modernization of the Strategy, federal partners modified their existing programs to expand their programs' reach to target youth facing barriers to employment. However, challenges persist due to funding instabilities associated with fluctuations in annual incremental funding, short-term funding, and late funding decisions.
Governance
Strategy federal partners acknowledge the importance of ESDC's role in coordinating and providing guidance as the Strategy's lead department. In terms of improvements, federal partners identified the need for greater collaboration, sharing of information and the opportunity for greater horizontal decision-making opportunities.
Performance measurement
During fiscal year 2022 to 2023, approximately 115,000 youth participated in CSJ, while an estimated 26,260 youthFootnote 144 participated in YESSP (with 17,241 from ESDC and 9,018 from federal partners).
Data collection and reporting challenges were identified by federal partners, including a lack of a centralized data collection system to securely upload participant data to ESDC. Half of all federal partners also identified that the shared outcomes and output indicators do not capture all valuable data about the unique context of their programs and participants.
Canada Summer Jobs
Overall, incremental impacts demonstrate that in the short-term CSJ participation strengthens the labour market attachment of youth participants relative to non-participants. CSJ is a good policy tool to assist youth in integrating into the labour market, as it makes some contribution to facilitating the transition from school to employment.
Youth Employment and Skills Strategy Program
Focus group participants report high levels of satisfaction with the overall programs and the services received.
Incremental impacts for YESSP reveal that relative to similarly matched non-participants:
- QEO participants strengthen their labour market attachment through increases in incidence of employment and higher employment earnings. They also decrease their reliance on government income supports following participation.
- ST participants in the short-term experience lower incidence of employment and lower employment earnings.
- QEOST participants experience increases in incidence of employment and depend less on government income supports in the first post-program year. However, they experience lower employment earnings.
Please note, as the estimation of incremental impacts is based on a short-term post program period of 2 years, it is too early to determine the impact of YESSP interventions on youth. The true impact of YESSP can only be measured at the medium term (that is, 5 years post-program).
Federal partners' evaluations and internal reviews
In general, the findings emphasize the funding of work placements for youth to gain labour market experience and develop skills. Federal partners also identify providing opportunities for youth facing barriers to employment to assist them in entering or remaining in the labour market. Summaries of participating federal partners findings are detailed within the report.
Youth Digital Gateway
Challenges were experienced in the design and delivery of the Youth Digital Gateway, in part due to the pre-launch period being interrupted by the COVID-19 pandemic. As the project approaches its completion date, a comprehensive, lessons learned exercise will be conducted across policy, program and the project team.
Strategic Collaboration projects
Given that most projects are still operating as of September 2023, it is too early to provide a comprehensive assessment of the extent to which all strategic collaboration projects achieved their intended objectives. There are, however, concrete examples and achievements reported for projects that started in 2019, including assisting youth in completing training and obtaining employment or becoming self-employed.
Recommendations and observations
As part of the evaluation, multiple lines of qualitative and quantitative evidence were examined to draw conclusions about the Strategy's performance and effectiveness.
The quantitative lines of evidence assessed the short-term effectiveness of YESS for ESDC's participants by producing incremental impacts. It is noted that:
- the YESSP results are limited to ESDC's participants, representing 49.5% of YESSP funding, due to challenges in accessing federal partners' non-aggregate participant level data
- no cost-benefit analysis could be conducted for either component, given the short post-program period available for the analysis
The qualitative lines of evidence identified specific challenges and best practices associated with the implementation, governance and performance measurement of the Strategy. In addition, focus groups allowed a limited number of participants to share their experiences with YESSP.
Six YESS federal partners' contributed evaluation findings or internal reviews of their programs. Of those, 3 federal partners will have publicly released evaluation reports.
Previous evaluation results for youth from labour market programs and a targeted review of international literature on youth employment programs complement the findings.
The quantitative results that answer questions about the Strategy's effectiveness stem from the conduct of advance causal analysis whereby impacts found can be attributed to a specific intervention type. These analyses are predicated on having access to high quality administrative records, thereby confirming the importance of the capacity to leverage and integrate relevant administrative data.
From these main findings, the following key recommendations and observations emerge:
Observation: Due to data limitations and the lag period to access Canada Revenue Agency taxation records, incremental impacts were estimated for a short post-program period of 2 years. It may be appropriate, if there is an interest within ESDC prior to the Strategy's next Financial Administration Act evaluation requirement, to conduct a follow-up assessment of the medium-term incremental impacts (up to 5 years post-program) and efficiency (cost-benefits) of YESS participation.
Recommendation 1: It is recommended that ESDC and YESS federal partners clarify roles and responsibilities in terms of data collection and evaluation. This includes the responsibility of ESDC regarding the scope of the horizontal evaluation and that of all federal partners when it comes to evaluate and publicly report on the impacts and effectiveness of their programs and services.
Recommendation 2: It is recommended that ESDC's Skills and Employment Branch pursue efforts to maintain and strengthen data collection provisions in support of YESS reporting, performance measurement and data-driven evaluations. To that regard, ESDC should:
- establish a new YESS data collection system with appropriate privacy and legal provisions, and information sharing agreements
- ensure that proper data elements are collected by all federal partners to allow for contacting participants for the conduct of qualitative lines of evidence (including surveys) and linking responses to administrative data
- prioritize data integrity, including validating data uploads and documenting changes over time
Appendix A: Annual YESS funding allocation by partner
| YESS partner | Funding source | 2019 to 2020 ($ M) | 2020 to 2021 ($ M) | 2021 to 2022 ($ M) | 2022 to 2023 ($ M) | 2023 to 2024 ($ M) | 2024 to 2025 ($ M) | Grand total (6 years) ($ M) |
|---|---|---|---|---|---|---|---|---|
| ESDC - CSJ | Ongoing | 122.8 | 122.8 | 122.8 | 122.8 | 122.8 | 122.8 | 736.8 |
| ESDC - CSJ | Incremental | 173.6 | 217.1 | 446.2 | 371.8 | 200 | 200.5 | 1,609.20 |
| ESDC - CSJ | CSJ Total | 296.4 | 339.9 | 569 | 494.6 | 322.8 | 323.3 | 2,346.0 |
| ESDC - YESSP | Ongoing | 73.3 | 110 | 110 | 110 | 110 | 119 | 632.3 |
| ESDC - YESSP | Incremental | 121.3 | 153.6 | 251 | 171.4 | 32.9 | 30.9 | 761.1 |
| ESDC - YESSP | ESDC Total | 194.6 | 263.6 | 361 | 281.4 | 142.9 | 149.9 | 1,393.4 |
| ISC | Ongoing | 27.1 | 27.1 | 27 | 27.2 | 27.2 | 27.2 | 162.7 |
| ISC | Incremental | 28.6 | 30.6 | 80 | 62.2 | 60.4 | 60.4 | 322.3 |
| ISC | ISC Total | 55.7 | 57.7 | 107 | 89.4 | 87.6 | 87.6 | 485 |
| ISED | Ongoing | 3.7 | 3.7 | 3.7 | 3.7 | 3.7 | 3.7 | 22.2 |
| ISED | Incremental | 10.2 | 56.2 | 67.6 | 12.7 | 7.1 | 7.2 | 160.8 |
| ISED | ISED Total | 13.9 | 59.9 | 71.3 | 16.4 | 10.8 | 10.9 | 183 |
| NRC | Ongoing | 5.4 | 5.4 | 5.4 | 5.4 | 5.4 | 5.4 | 32.2 |
| NRC | Incremental | 10 | 15 | 61.1 | 10 | 17.3 | 17.3 | 130.7 |
| NRC | NRC Total | 15.4 | 20.4 | 66.5 | 15.4 | 22.7 | 22.7 | 162.9 |
| ECCC | Ongoing | 3.1 | 3.1 | 3.2 | 3.2 | 3.2 | 3.2 | 18.9 |
| ECCC | Incremental | 11.4 | 11.4 | 35.1 | 11.4 | 15.4 | 15.4 | 100.2 |
| ECCC | ECCC Total | 14.5 | 14.5 | 38.3 | 14.6 | 18.6 | 18.6 | 119.1 |
| NRCan | Ongoing | 0.6 | 0.6 | 0.6 | 0.6 | 0.6 | 0.6 | 3.6 |
| NRCan | Incremental | 8.8 | 15.8 | 44 | 9.2 | 15 | 15 | 107.9 |
| NRCan | NRCan Total | 9.4 | 16.4 | 44.6 | 9.8 | 15.6 | 15.6 | 111.5 |
| Canadian Heritage | Ongoing | 7.1 | 7.1 | 7.1 | 7.1 | 7.1 | 7.1 | 42.8 |
| Canadian Heritage | Incremental | 7.1 | 15 | 16.5 | 7.1 | 9.1 | 9.1 | 63.8 |
| Canadian Heritage | Canadian Heritage Total | 14.2 | 22.1 | 23.7 | 14.2 | 16.2 | 16.2 | 106.6 |
| PC | Ongoing | 2 | 2 | 2 | 2 | 2 | 2 | 12 |
| PC | Incremental | 7 | - | 45.4 | 6.9 | 12.9 | 12.9 | 85.2 |
| PC | PC Total | 9 | 2 | 47.4 | 8.9 | 14.9 | 14.9 | 97.2 |
| AAFC | Ongoing | 1.2 | 1.2 | 1.3 | 1.2 | 1.2 | 1.2 | 7.2 |
| AAFC | Incremental | 2.6 | 9.2 | 21.4 | 2.5 | 12.3 | 12.3 | 60.2 |
| AAFC | AAFC Total | 3.8 | 10.4 | 22.7 | 3.7 | 13.5 | 13.5 | 67.4 |
| GAC | Ongoing | 6.4 | 6.4 | 6.4 | 6.4 | 6.4 | 6.4 | 38.4 |
| GAC | GAC Total | 6.4 | 6.4 | 6.4 | 6.4 | 6.4 | 6.4 | 38.4 |
| CMHC | Ongoing | 1 | 1 | 1 | 1 | 1 | 1 | 6 |
| CMHC | Incremental | 4.9 | 4 | 7.9 | 4.8 | 3.7 | 3.7 | 28.9 |
| CMHC | CMHC Total | 5.9 | 5 | 8.9 | 5.8 | 4.7 | 4.7 | 34.9 |
| IRCC | Incremental | - | - | 1.1 | 15.8 | - | - | 16.9 |
| IRCC | IRCC Total | - | - | 1.1 | 15.8 | - | - | 16.9 |
| YESSP Total | Ongoing | 130.9 | 167.6 | 167.7 | 167.8 | 167.8 | 176.8 | 978.3 |
| YESSP Total | Incremental | 211.9 | 310.8 | 631.1 | 314 | 186.1 | 184.2 | 1838 |
| YESSP Total | YESSP Total | 342.8 | 478.4 | 798.9 | 481.8 | 353.9 | 361 | 2,816.30 |
| Total Strategy | Ongoing funding | 253.7 | 290.4 | 290.5 | 290.6 | 290.6 | 299.6 | 1715.1 |
| Total Strategy | Incremental funding | 385.5 | 527.9 | 1077.3 | 685.8 | 386.1 | 384.7 | 3,447.20 |
| Total Strategy | Total funding | 639.2 | 818.3 | 1,367.80 | 976.4 | 676.7 | 684.3 | 5,162.30 |
- Source: Financial information from ESDC Departmental Results Reports for Horizontal Initiatives, as well as internal ESDC documents; Fall Economic Statements and Budgets. The figures in this table have been rounded to the nearest decimal point meaning that the totals may not be exact.
Appendix B: YESS logic model (2021)
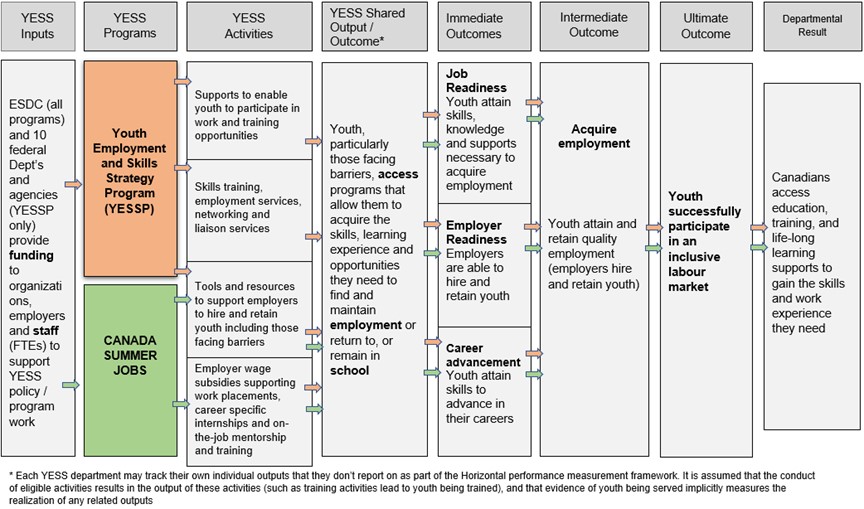
Text description: Figure B1
YESS inputs from ESDC and 10 federal departments and agencies provide funding to organizations, employers and staff to support policy and program work for YESSP and Canada Summer Jobs. For the YESSP, this funds YESS activities including supports to enable youth to participate in work and training opportunities as well as skills training, employment services, networking and liaison services and tools and resources to support employers to hire and retain youth, including those facing barriers. For Canada Summer Jobs, this funds tools and resources to support employers to hire and retain youth, including those facing barriers and employer wage subsidies supporting work placements, career-specific internships and on-the-job mentorship training.
These activities have a shared output/outcome, which is that youth, particularly those facing barriers have access to programs that allow them to acquire the skills, learning experience and opportunities they need to find and maintain employment or return to/remain in school. These outputs are split into 3 outcome categories; immediate, intermediate and ultimate outcomes. Immediate outcomes include job readiness, where youth attain skills, knowledge and supports necessary to acquire employment. They also include employer readiness, where employers are able to hire and retain youth. Finally, immediate outcomes include career advancement where youth attain skills to advance in their careers. Intermediate outcome includes youth who acquire and retain quality employment. Ultimate outcome includes youth who successfully participate in an inclusive labour market. This leads to departmental results where Canadians access education, training and life-long learning supports to gain the skills and work experiences they need.
Appendix C: Description of the estimation method for the incremental impacts
The role of the incremental impact analysis is to isolate the effects of participation from other factors. To achieve this, the incremental impact analysis compares the labour market experience of participants before and after their participation with that of similar non-participants. The difference in results between the 2 groups is then attributed to the impact of program participation (the incremental impact). Figure C1 presents an example of incremental impact calculation.
Text description: Figure C1
Incremental impacts are the difference in the pre-post participation outcomes between participants and similar non-participants.
For example:
- if the average annual earnings of participants are $30,000 before participation and $38,000 after participation, the change in earning for participants is an increase of $8,000
- if the average annual earnings in the comparison group are $31,000 before participation and $36,000 after participation, the change in earnings for the comparison group is an increase of $5,000
- the incremental impact, that is the change attributed to program participation, is $8,000 minus $5,000, which equals an increase of $3,000
The evaluation uses non-experimental propensity score based weighting approach to measure the program impacts. This approach aims to ensure that the participants and comparison group are balanced in terms of background factors (that is, sociodemographic and labour market history variables) prior to estimating the program impacts.
The evaluators applied the kernel matching technique, which uses the entire control group and re-weights control group members each time they are compared with a new participant, based on propensity score differentials. As part of the robustness check, these methods are combined with difference-in-differences estimation method, which allows for the participants and non-participant groups to differ on time-invariant unobserved characteristics, by assuming common time trends in the pre- and post-participation period in these characteristics.
Moreover, 2 different estimation techniques (Inverse Probability Weighting and Nearest Neighbour) are carried out separately for each type of YESSP and CSJ intervention type to validate the impact estimates.
As with previous YES evaluation, the Action Plan Equivalent is the unit of analysis used. Action Plan Equivalents regroup all YESSP or CSJ interventions received by an individual. Action Plan Equivalents are categorized based on the most intensive intervention they contain.
The analysis includes Action Plan Equivalents that consist only of YESSP or CSJ interventions. Action Plan Equivalents that include a combination of YESSP or CSJ and other labour market programs funded by ESDC, were excluded from the participant sample.
The matching of participants and comparison group members used up to 75 socio-demographic and labour market variables observed over 2 years before participation. The comparison group was created using youth who participated in a light touch intervention under the Labour Market Development Agreements, known as an Employment Assistance Services.Footnote 145 In other words, the experience of CSJ and YESSP interventions is compared to the experience of youth who received Employment Assistance Services-only under the Labour Market Development Agreements. This is a conservative approach given the fact that participation in Employment Assistance Services can lead to limited effects on labour market outcomes.
Incremental impacts are generated over 2 post-program years. Incremental impacts estimated for CSJ and YESSP participants should not be directly compared.
One of the key strengths of the quantitative analyses is that they are based on administrative data rather than survey responses. Compared to survey data, administrative data are not subject to recall errors or response bias.
Limitations
The propensity score models used to match participants and non-participants for the incremental impact analyses are judged to be robust. In part, this is because they were based on 2 years of pre-participation data. Moreover, these models are based on a vast array of variables including sociodemographic characteristics, location, skill level related to last occupation, and indicators of labour market attachment.
However, the matching process can be further refined for specific subgroups if the following information is available in the future:
- persons with disabilities: the type and severity of the disability, and the capacity/willingness to work full-time
- recent immigrants: the country of origin, the proficiency in English or French, and the relevance of credentials and work experience
- racialized youth: place of birth; individuals who are born outside of Canada face different challenges compared to those born in Canada
Refining the matching process for population subgroups could broaden the scope for greater Gender-based Analysis Plus analyses.
Sensitivity analysis and the use of alternative estimation methods have increased confidence in the incremental impact estimates. However, one limitation with the propensity score matching techniques is that no one can be fully sure the impacts are not influenced by factors not captured in the data.
The examination of cost-benefit analysis is also not possible at this time due to the short post-program period available. As such, the YESS horizontal evaluation will not be able to fully assess the impact and effectiveness of the modernised Strategy. As the modernized Strategy is still in its early years, it is also not possible to examine the Strategy's ultimate outcome.
Appendix D: ESDC Horizontal Initiatives - Departmental Results Report for YESS by partner (between 2020 to 2021 and 2022 to 2023)
| Reported outcomes of youth participants | 2020 to 2021 Youth served | 2020 to 2021 Employed or self- employed | 2020 to 2021 Returned to school | 2021 to 2022 Youth served | 2021 to 2022 Employed or self- employed | 2021 to 2022 Returned to school | 2022 to 2023 Youth served | 2022 to 2023 Employed or self- employed | 2022 to 2023 Returned to school |
|---|---|---|---|---|---|---|---|---|---|
| ESDC: Canada Summer Jobs | 67,718 | 42.3% | 80.5% | 124,747 | 46% | 54% | 115,003 | 47% | 79% |
| ESDC: Youth Employment and Skills Strategy ProgramFootnote 147 | 14,236 | 44% | 12% | 23,526 | 45% | 11% | 21,948 | 55% | 18% |
| NRC IRAP: Youth Employment Program | 892 | 90% | 2% | 2,238 | 89% | 2% | 725 | 86% | - |
| AAFC: Youth Employment and Skills Program | 1,139 | 27% | 34% | 2,340 | 28% | 32% | 249 | 73% | 41% |
| ECCC: Science Horizons Youth Internship ProgramFootnote 148 | 958 | 80% | 4% | 1,402 | 23% | 0% | 578 | 87% | 3% |
| Canadian Heritage: Young Canada Works | 2,055 | - | - | 2,324 | - | - | 1,747 | - | - |
| ISED: Computers for Schools Intern | 331 | 31% | 7% | 261 | 40% | 28% | 187 | 4% | 21% |
| ISED: Digital Skills for Youth | 2,110 | 74% | 3.5% | 2,620 | 70% | 0% | 468 | 63% | - |
| IRCC: Settlement Program | - | - | - | - | - | - | 3,225 | 75% | - |
| GAC: International Youth Internship Program | 0 | 0% | 0% | 156 | 61% | 18% | 183 | 30% | 25% |
| ISC: First Nations and Inuit Youth Employment Strategy and Income Assistance First Nations Youth Employment Strategy | Not available | Not available | Not available | Not available | Not available | Not available | Not available | Not available | Not available |
| CMHC: Housing Internship for Indigenous Youth | 330 | 20% | 10% | 518 | 16% | 8% | 417 | 35% | 15% |
| Parks Canada : Youth Experience Employment Program | 196 | - | 100% | 4,232 | 100% | - | 645 | - | - |
| NRCan: Science and Technology Internship Program - Green Jobs | 683 | 77% | 3% | 1,697 | 85% | 6% | 594 | 74% | 12% |
Reported outcomes of youth participants: proportion of youth participants facing barriers to employment
Fiscal year 2020 to 2021
ESDC Canada Summer Jobs :
- Indigenous: 6%
- racialized: 20%
- disability: 2.5%
ESDC Youth Employment and Skills Strategy Program:
- Indigenous: 20%
- racialized: 41%
- disability: 25%
NRC IRAP Youth Employment Program:
- women: 31%
- racialized: 25%
- disability: 1.1%
- Indigenous: 1.5%
AAFC Youth Employment and Skills Program:
- rural: 43%
- Indigenous 12%
- racialized: 6%
- disability: 3%
ECCC Science Horizons Youth Internship Program:
- Indigenous: 2.7%
- racialized: 22%
- disability: 2.2%
Canadian Heritage Young Canada Works:
- Indigenous: 5%
- racialized: 17%
- disability: 7%
ISED Computers for Schools Intern:
- Indigenous: 4.2%
- racialized: 42%
- disability: 8.5%
ISED Digital Skills for Youth
- Indigenous: 5.2%
- racialized: 33.8%
- disability: 2.9%
IRCC Settlement Program: -
GAC International Youth Internship Program: 0%
ISC First Nations and Inuit Youth Employment Strategy and Income Assistance First Nations Youth Employment Strategy : not available
CMHC Housing Internship for Indigenous Youth:
- Indigenous: 100%
Parks Canada Youth Experience Employment Program:
- Indigenous: 11%
- racialized: 9%
- disability: 3%
NRCan Science and Technology Internship Program - Green Jobs:
- employment equity groups: 61%
Fiscal year 2021 to 2022
ESDC Canada Summer Jobs:
- Indigenous: 7.5%
- racialized: 7%
- disability: 3%
ESDC Youth Employment and Skills Strategy Program:
- Indigenous: 18%
- racialized: 45%
- disability: 25%
NRC IRAP Youth Employment Program:
- racialized: 28%
- disability: 2%
- Indigenous: 1.4%
AAFC Youth Employment and Skills Program:
- rural and remote: 59%
- Indigenous 8.5%
- racialized: 9.4%
- disability: 2.6%
ECCC Science Horizons Youth Internship Program:
- Indigenous: 2.6%
- racialized: 25%
- disability: 3.4%
Canadian Heritage: Young Canada Works
- Indigenous: 5%
- racialized: 19%
- disability: 6.5%
- OLMC: 30%
ISED Computers for Schools Intern:
- Indigenous: 4.6%
- racialized: 38.3%
- disability 6.5%
ISED: Digital Skills for Youth
Indigenous: 5.5%
- visible minority: 39.9%
- disability: 3.6%
IRCC: Settlement Program: -
GAC: International Youth Internship Program
- Indigenous: 2%
- racialized: 35%
- disability: 4%
ISC: First Nations and Inuit Youth Employment Strategy and Income Assistance First Nations Youth Employment Strategy: Not available
CMHC: Housing Internship for Indigenous Youth:
- Indigenous: 100%
Parks Canada: Youth Experience Employment Program
- Indigenous: 19.5%
- racialized: 16.1%
- disability: 6.2%
NRCan: Science and Technology Internship Program - Green Jobs:
- women: 44%
- Indigenous 17%
- racialized: 25%
- disability: 4%
Fiscal year 2022 to 2023
ESDC CSJ:
- Indigenous = 4.2%
- racialized = 20.5%
- disability = 9.1%
- woman = 62.4%
ESDC YESSP:
- Indigenous = 17.6%
- racialized = 38.8%
- disability = 25.3%
NRC IRAP Youth Employment Program:
- Indigenous = 3.9%
- racialized = 27%
- disability = 3.3%
- rural = 3.6%
- OLMC = 2.9%
AAFC Youth Employment and Skills Program:
- Indigenous = 28.9%
- racialized = 29.7%
- disability = 28.9%
- rural and remote = 62.5%
ECCC Science Horizons Youth Internship Program:
- Indigenous = 4.5%
- racialized = 24.1%
- disability = 6.4%
Canadian Heritage Youth Canada Works - Official Languages and Youth Canada Works - Heritage (respectively):
- Indigenous = 5% and 6.9%
- racialized = 24% and 13.1%
- disability: 5% and 12.7%
- OLMC = 49% and 5.9%
- female = 67% and 71.4%
ISED Computers for Schools Intern Program:
- Indigenous = 5.9%
- racialized = 39.6%
- disability = 13.4%
ISED Digital Skills for Youth:
- Indigenous = 5.6%
- racialized = 42.7%
- disability = 6%
IRCC Settlement Program:
- newcomers to Canada = 100%
GAC International Youth Internship Program:
- Indigenous = 0.5%
- racialized = 43%
- disability = 3.8%
ISC First Nations and Inuit Youth Employment Strategy and Income Assistance First Nations Youth Employment Strategy : not available
CMHC Housing Internship for Indigenous Youth:
- Indigenous = 100%
NRCan Science and Technology Internship Program - Green Jobs
- Indigenous = 33.5%
- racialized = 25.8%
- disability = 8.3%
- female = 46.8%
Parks Canada Youth Experience Employment Program:
- Indigenous = 15.2%
- racialized = 18.6%
- disability = 12.6%
Appendix E: Additional incremental impact results for CSJ subgroups of participants
Additional subgroup incremental impact findings are presented below for CSJ participants. Findings for subgroups of participants are not presented if the number of participants is too low to conduct incremental impact analyses and/or the statistical model did not balance.
| IndicatorsFootnote 149 | In-program | First year post-program | Second year post-program |
|---|---|---|---|
| Incidence of employment (percentage points) | 6.13*** | 1.46** | 8.63*** |
| Employment earnings ($) | 40 | -456 | 3,752*** |
| Employment Insurance benefits ($) | 172*** | -1006*** | -1345*** |
| Social assistance benefits ($) | -303*** | -244*** | -222*** |
| Dependence on income support (percentage points) | -2.56*** | -7.16*** | -7.85*** |
- Significant level ***1% **5% *10%
| Indicators | In-program | First year post-program | Second year post-program |
|---|---|---|---|
| Incidence of employment (percentage points) | 7.46*** | 4.25*** | 11.05*** |
| Employment earnings ($) | 1,387*** | 1,337*** | 5,397*** |
| Employment Insurance benefits ($) | -122 | -351*** | -817*** |
| Social assistance benefits ($) | -440*** | -334*** | -236*** |
| Dependence on income support (percentage points) | -5.44*** | -4.78*** | -5.59*** |
- Significant level ***1% **5% *10%
| Indicators | In-program | First year post-program | Second year post-program |
|---|---|---|---|
| Incidence of employment (percentage points) | 18.09*** | 7.05*** | 17.63*** |
| Employment earnings ($) | 692*** | -591** | 1,126*** |
| Employment Insurance benefits ($) | -9 | -1242*** | -1193*** |
| Social assistance benefits ($) | -504*** | -441*** | -419*** |
| Dependence on income support (percentage points) | -5.98*** | -11.91*** | -10.5*** |
- Significant level ***1% **5% *10%
| Indicators | In-program | First year post-program | Second year post-program |
|---|---|---|---|
| Incidence of employment (percentage points) | 6.96*** | 4.8*** | 9.18*** |
| Employment earnings ($) | -1157*** | -2832*** | 692 |
| Employment Insurance benefits ($) | 49 | -518*** | -621*** |
| Social assistance benefits ($) | -489*** | -374*** | -354*** |
| Dependence on income support (percentage points) | -5.74*** | -6.4*** | -5.79*** |
- Significant level ***1% **5% *10%
| Indicators | In-program | First year post-program | Second year post-program |
|---|---|---|---|
| Incidence of employment (percentage points) | 9.63*** | 3.86*** | 10.91*** |
| Employment earnings ($) | 41 | -388* | 2,743*** |
| Employment Insurance benefits ($) | 96*** | -888*** | -1313*** |
| Social assistance benefits ($) | -290*** | -277*** | -252*** |
| Dependence on income support (percentage points) | -2.86*** | -7.23*** | -8.28*** |
- Significant level ***1% **5% *10%
| Indicators | In-program | First year post-program | Second year post-program |
|---|---|---|---|
| Incidence of employment (percentage points) | 9.77*** | 3.14*** | 9.69*** |
| Employment earnings ($) | -640*** | -1,722*** | 1,592*** |
| Employment Insurance benefits ($) | 34 | -962*** | -1259*** |
| Social assistance benefits ($) | -305*** | -279*** | -258*** |
| Dependence on income support (percentage points) | -3.44*** | -7.1*** | -8.27*** |
- Significant level ***1% **5% *10%
| Indicators | In-program | First year post-program | Second year post-program |
|---|---|---|---|
| Incidence of employment (percentage points) | 7.31*** | -0.51 | 7.36*** |
| Employment earnings ($) | -894*** | -2,395*** | 462 |
| Employment Insurance benefits ($) | 226** | -721*** | -1015*** |
| Social assistance benefits ($) | -301*** | -252*** | -240*** |
| Dependence on income support (percentage points) | -2.09*** | -5.44*** | -5.73*** |
- Significant level ***1% **5% *10%
| Indicators | In-program | First year post-program | Second year post-program |
|---|---|---|---|
| Incidence of employment (percentage points) | 6.7*** | 4.01*** | 10.29*** |
| Employment earnings ($) | 1,422*** | 1,484*** | 5,490*** |
| Employment Insurance benefits ($) | -147 | -387** | -909*** |
| Social assistance benefits ($) | -431*** | -387*** | -239*** |
| Dependence on income support (percentage points) | -5.58*** | -6.17*** | -6.18*** |
- Significant level ***1% **5% *10%
| Indicators | In-program | First year post-program | Second year post-program |
|---|---|---|---|
| Incidence of employment (percentage points) | 7.68*** | 5.48*** | 12.32*** |
| Employment earnings ($) | 1030** | 903 | 5,228*** |
| Employment Insurance benefits ($) | 8 | -324** | -675*** |
| Social assistance benefits ($) | -454*** | -309*** | -170** |
| Dependence on income support (percentage points) | -4.6*** | -4.09*** | -4.86*** |
- Significant level ***1% **5% *10%
Appendix F: Additional incremental impact results for YESSP subgroups
Additional subgroup incremental impact findings are presented below by gender, disability and age groups of participants in QEOST or ST. Findings for subgroups of participants are not presented if the number of participants is too low to conduct incremental impact analyses and/or the statistical model did not balance.
Overall, the impacts for most subgroups of participants in ST and QEOST confirm the trends seen in the overall ST and QEOST populations.
| Indicators | In-program | First year post-program | Second year post-program |
|---|---|---|---|
| Incidence of employment (percentage points) | -2.82 | 10.79*** | 0.14 |
| Employment earnings ($) | -4,215*** | 975 | -3,582** |
| Employment Insurance benefits ($) | -967* | -1,163* | 413 |
| Social assistance benefits ($) | -476 | -654 | not available |
| Dependence on income support (percentage points) | -2.07 | -6.71** | not available |
- Significant level ***1% **5% *10%
- For social assistance benefits and dependence of income support categories, second-year tax data was not available due to the timing of the release of T1 tax data. Employment earnings are reported on T4 tax data.
| Indicators | In-program | First year post-program | Second year post-program |
|---|---|---|---|
| Incidence of employment (percentage points) | -21.65*** | -10.09** | -11.62*** |
| Employment earnings ($) | -6,682*** | -6,332*** | -5,508*** |
| Employment Insurance benefits ($) | -1,583* | -1,997** | -858* |
| Social assistance benefits ($) | 758 | 569 | not available |
| Dependence on income support (percentage points) | 3.39 | -4.1 | not available |
- Significant level ***1% **5% *10%
- For social assistance benefits and dependence of income support categories, second-year tax data was not available due to the timing of the release of T1 tax data. Employment earnings are reported on T4 tax data.
| Indicators | In-program | First year post-program | Second year post-program |
|---|---|---|---|
| Incidence of employment (percentage points) | 5.44 | 12.99*** | 7.71** |
| Employment earnings ($) | -3,566*** | -172 | -4,592** |
| Employment Insurance benefits ($) | -1,844*** | -1,141* | -84 |
| Social assistance benefits ($) | -182 | -80 | not available |
| Dependence on income support (percentage points) | -7.1** | -7.71** | not available |
- Significant level ***1% **5% *10%
- For social assistance benefits and dependence of income support categories, second-year tax data was not available due to the timing of the release of T1 tax data. Employment earnings are reported on T4 tax data.
| Indicators | In-program | First year post-program | Second year post-program |
|---|---|---|---|
| Incidence of employment (percentage points) | -8.61* | -2.95 | -5.66 |
| Employment earnings ($) | -6,225*** | -5,568*** | -7,015*** |
| Employment Insurance benefits ($) | -844** | -1,606*** | -204 |
| Social assistance benefits ($) | 402 | 882** | not available |
| Dependence on income support (percentage points) | 3.87 | 0.05 | not available |
- Significant level ***1% **5% *10%
- For social assistance benefits and dependence of income support categories, second-year tax data was not available due to the timing of the release of T1 tax data. Employment earnings are reported on T4 tax data.
| Indicators | In-program | First year post-program | Second year post-program |
|---|---|---|---|
| Incidence of employment (percentage points) | 6.13 | 19.43*** | 13.65** |
| Employment earnings ($) | -1,575 | 2,105** | 1,879 |
| Employment Insurance benefits ($) | -189 | -319 | -257 |
| Social assistance benefits ($) | 1,101** | 456 | not available |
| Dependence on income support (percentage points) | 7.92** | -5.92* | not available |
- Significant level ***1% **5% *10%
- For social assistance benefits and dependence of income support categories, second-year tax data was not available due to the timing of the release of T1 tax data. Employment earnings are reported on T4 tax data.
| Indicators | In-program | First year post-program | Second year post-program |
|---|---|---|---|
| Incidence of employment (percentage points) | -14.29** | 1.37 | 16.96* |
| Employment earnings ($) | -1,743* | -214 | 2,157 |
| Employment Insurance benefits ($) | -69 | -465 | -4,343* |
| Social assistance benefits ($) | 1,077 | 470 | not available |
| Dependence on income support (percentage points) | 10.56 | -4.48 | not available |
- Significant level ***1% **5% *10%
- For social assistance benefits and dependence of income support categories, second-year tax data was not available due to the timing of the release of T1 tax data. Employment earnings are reported on T4 tax data.
| Indicators | In-program | First year post-program | Second year post-program |
|---|---|---|---|
| Incidence of employment (percentage points) | 5.7 | 8.47 | 19.65** |
| Employment earnings ($) | -1,325 | 2,315 | 186 |
| Employment Insurance benefits ($) | -852* | -1,359 | -1,629 |
| Social assistance benefits ($) | 349** | -30 | not available |
| Dependence on income support (percentage points) | 1.62 | -3.84 | not available |
- Significant level ***1% **5% *10%
- For social assistance benefits and dependence of income support categories, second-year tax data was not available due to the timing of the release of T1 tax data. Employment earnings are reported on T4 tax data.
| Indicators | In-program | First year post-program | Second year post-program |
|---|---|---|---|
| Incidence of employment (percentage points) | 8.55*** | 15.79*** | 4.49 |
| Employment earnings ($) | -3,087*** | 443 | -2,583 |
| Employment Insurance benefits ($) | -1,103** | -1404** | 323 |
| Social assistance benefits ($) | 162 | -205 | not available |
| Dependence on income support (percentage points) | -0.28 | -3.19 | not available |
- Significant level ***1% **5% *10%
- For social assistance benefits and dependence of income support categories, second-year tax data was not available due to the timing of the release of T1 tax data. Employment earnings are reported on T4 tax data.
| Indicators | In-program | First year post-program | Second year post-program |
|---|---|---|---|
| Incidence of employment (percentage points) | -15.3*** | -1.51 | -1.86 |
| Employment earnings ($) | -6,079*** | -5,351*** | -5,316*** |
| Employment Insurance benefits ($) | -697 | -1741** | -48 |
| Social assistance benefits ($) | 694* | 643 | not available |
| Dependence on income support (percentage points) | 8.69** | -1.62 | not available |
- Significant level ***1% **5% *10%
- For social assistance benefits and dependence of income support categories, second-year tax data was not available due to the timing of the release of T1 tax data. Employment earnings are reported on T4 tax data.
| Indicators | In-program | First year post-program | Second year post-program |
|---|---|---|---|
| Incidence of employment (percentage points) | 0.69 | 15.95*** | 0.19 |
| Employment earnings ($) | -5,709*** | 1,281 | 1,451 |
| Employment Insurance benefits ($) | -1,086** | -210 | 833** |
| Social assistance benefits ($) | -319 | -1,171* | not available |
| Dependence on income support (percentage points) | -0.98 | -8.48 | not available |
- Significant level ***1% **5% *10%
- For social assistance benefits and dependence of income support categories, second-year tax data was not available due to the timing of the release of T1 tax data. Employment earnings are reported on T4 tax data.
| Indicators | In-program | First year post-program | Second year post-program |
|---|---|---|---|
| Incidence of employment (percentage points) | -13.81*** | -3.43 | -9.68** |
| Employment earnings ($) | -7,144*** | -4,539** | -5,379** |
| Employment Insurance benefits ($) | -1,918** | -1,711 | -3 |
| Social assistance benefits ($) | -537 | -59 | not available |
| Dependence on income support (percentage points) | -1.2 | -0.41 | not available |
- Significant level ***1% **5% *10%
- For social assistance benefits and dependence of income support categories, second-year tax data was not available due to the timing of the release of T1 tax data. Employment earnings are reported on T4 tax data.
Appendix G: Youth Digital Gateway
Background
The design of the Youth Digital Gateway (YDG) was informed by several engagements and consultations with youth and youth service delivery organizations. With supported documentation, examples include:
- the 2017 Expert Panel on Youth Employment with youth eco-system experts
- consultations and recommendations on improving the Youth Employment Strategy
- consultations to understand the challenges and motivations that affect young Canadians' involvement in service to their communities and to propose solutions
- consultation with over 200 youth in 19 different locations across Canada and with 100 experts on youth employment
- consultation with 20 youth service delivery organizations in Quebec
- engaging youth during 5 breakout sessions at the 2019 Canada Youth Summit to gather feedback and insights on the YDG prototype
- in partnerships with the Ontario College of Art and Design University, student designers developed 15 conceptual designs for YDG, which were then tested for credibility and attractiveness
Overall, youth and youth partners expressed that the current way information is presented to them online on Government of Canada webpages is hard to understand and difficult to navigate. Youth desired access to tailored information and tools to support them in their transition to the workplace and in taking part in volunteer opportunities.
Youth service providers expressed interest in finding information on funding opportunities in one single place and support during the application process. The application process can be a deterrent for small and medium sized organizations.
Youth Digital Gateway objectives
The purpose of YDG is to deliver holistic, client-centric digital services for youth, with a focus on youth employment, skills, and services. The project aims to:
- establish a client-centric approach for a Government of Canada digital platform for services and tools supporting youth employment, skills development, learning and community service
- continue to engage youth directly in the design, co-creation, and testing of new and improved digital services
- transform the way services are delivered to youth to better meet their needs by building new digital services and tools
Youth Digital Gateway funding
Budget 2019 invested $31.8 million over 5 years under the Canada Service Corps (CSC) and the Youth Employment and Skills Strategy (YESS) to support the implementation of the YDG project. Currently, the overall budget for YDG is nearly $31.8 million over 6 years between 2019 to 2020 and 2024 to 2025.
Youth Digital Gateway implementation
Since the launch of YDG in July 2021, research activities and user testing were undertaken by the YDG team to improve user experience and identify areas for improvement. These activities included:
- consultation sessions with target demographics and key stakeholder organizations
- one-on-one user interviews
- surveys of users and co-creation workshops
The YDG team devoted efforts to testing and consulting with end users to understand user needs and identify pain points in navigating Government of Canada websites. This allowed the team to design and deliver the YDG and the tools and components that are useful to youth.
The YDG team prepared regular reports documenting the outcomes of the user experience testing between April 2021 and August 2022. This included the pre-launch period during the concept design phase.
The YDG team reported that the main takeaway from user consultations is that they enjoy the design and layout of the YDG platform. As well, the YDG team stated that they review and analyse user research findings to develop insights and inform incremental changes to YDG products.
In terms of promotional activities, the YDG team leveraged mailing lists through Youth Mandate for Greater Involvement (YMAGIN), the YESS program distribution list and the Youth Secretariat of the Government of Canada to send out promotional material and information, as well as to recruit participants for consultation on YDG design and testing.
The document review revealed that the YDG team carried out many promotional activities on social media between August 2021 and January 2023. For example, this included promotional posts to raise awareness about YDG between August 2021 and September 2022 via Leaders Today and Leaders d'aujourd'hui Facebook and Instagram social media accounts.
Performance measurement and monitoring
The YDG team established immediate and intermediate outcomes along with associated indicators and targets. The YDG team explained that original targets were aspirational and set in the absence of baseline information and for a project that is implemented using an agile process. As of October 2023, the YDG team has limited information on the level of achievements of these targets. The team stated that revisions to these outcomes and their targets are being proposed, to align with the results expected for the current scope of the project. The scope has evolved over time due to a better understanding of the operational environment, user needs, changing priorities, and delays in obtaining functional authority for project implementation.
The YDG team explained that the YDG had been approved as an "agile" project with variable scope. In agile, the sub-components of digital products are developed and released individually, and the scope of what is ultimately to be delivered can evolve over time in response to changes in the operating environment.
The YDG team developed a client satisfaction survey that was implemented in December 2022. Users are prompted to provide feedback on their experience following a set amount of time interacting with any feature on the site. The results to date can be found in Chart G1.
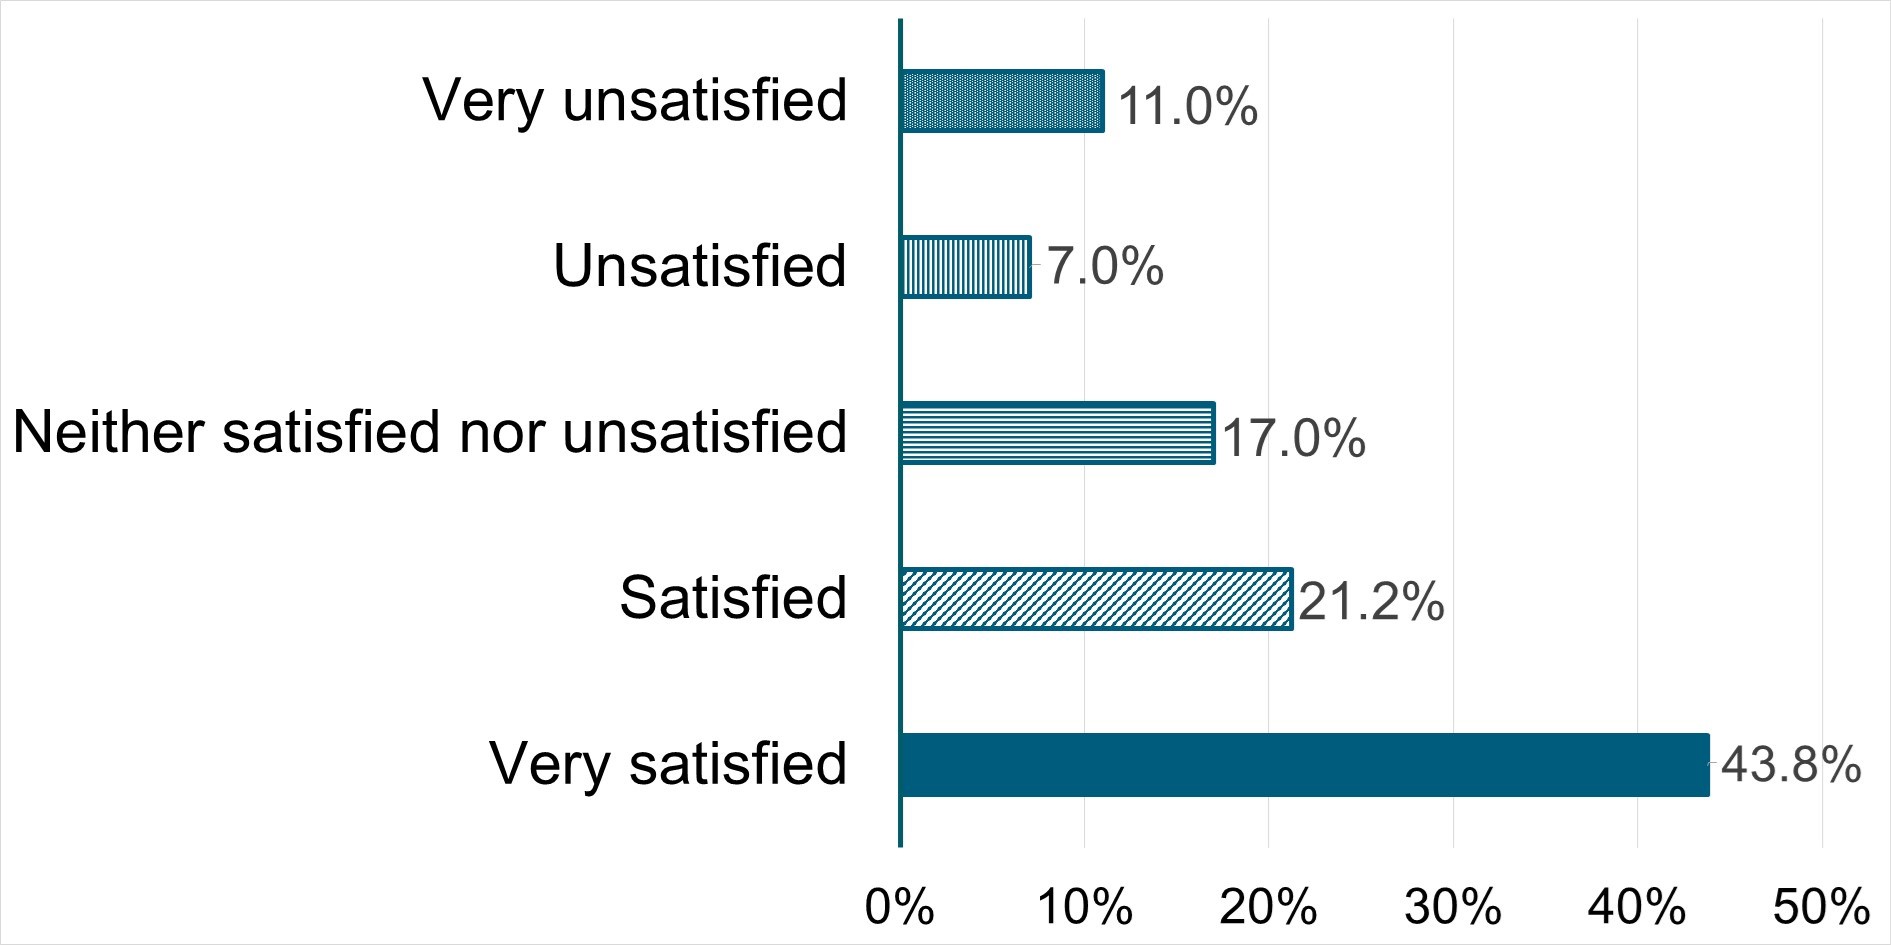
- Source: YDG survey statistics as of October 2023. N=1,518
Text description: Chart G1
| Satisfaction level | Satisfaction rates |
|---|---|
| Very satisfied | 43.8% |
| Satisfied | 21.2% |
| Neither satisfied nor unsatisfied | 17.0% |
| Unsatisfied | 7.0% |
| Very unsatisfied | 11.0% |
As well, the YDG team maintains regularly updated web traffic statistics on its SharePoint page. For example, between July 2021 and October 2023, 53,600 unique visitors made 56,250 visits for 172,650 web-page views. Statistics are also compiled and available per web page visits. This includes job postings, information on specific programs, and volunteer opportunities. Statistics are also available from which website visitors accessed YDG. Visitors came from google (43%), bookmarked page (17.6%), job bank (2.5%) and other federal departments and social media platforms.
Overlap and duplication, and complementarity with other existing platforms
The intent of the YDG was to build a platform that complements other Government of Canada service offerings. The YDG leverages existing Government of Canada resources to make it easy for youth to find relevant and accessible information and resources to support their employment, skills development, learning and community service goals.
Identifying information that could help youth facing barriers to opportunity and making that information more accessible was a particular priority. While the initial focus was on making existing Government of Canada resources more accessible, the project also aims to integrate information about supports available from outside the Government of Canada's ecosystem.
The aggregation of this content is not duplicative in nature, as it focuses on improving navigation to existing web pages where youth can find supports and resources they may need or be looking for quicker based on their goals and wants.
Design, delivery, and implementation challenges
The YDG team experienced several design and implementation challenges, including:
- the pre-project launch period was interrupted by the COVID-19 pandemic, which continued to pose barriers to research, design and development during the implementation phase
- it also created unplanned efforts towards updating processes and acquiring tools to support virtual collaboration
- the implementation phase was scheduled to launch in April 2020, but delays ensued in obtaining functional authority and forced the project team to risk-manage expenses until funding was secured
- this resulted in time and resources that would otherwise have gone to project delivery being allocated to pre-production activities such as hiring and procurement.
- finding suitable staff in user research, service design, user experienceFootnote 151 design, content design capacity and Cloud
- internal engagement within ESDC led to delivery delays as the project's agile and user-centric approach wasn't fully understood nor accepted.
- despite releasing the initial minimal viable product within the timelines forecasted in the initial roadmap once functional authority was approved, the project has since met several implementation delays due to:
- dependency on user research to identify pain points that can be addressed by the project
- anticipated challenges related to implementation and adoption of new tools and processes required for cloud environments
- rigid service standards for accessibility review of new software solutions as well as the limitations of Government of Canada procurement processes creating barriers and delays to obtaining licenses for specific software solutions
- long wait times to complete the accessibility testing process also contributed to delays in the release of completed products
- YDG website was launched with no established traffic or brand awareness because the website wasn't launched as planned on the established Youth.ca domain
- this was mainly due to decisions to use Cloud and incompatible technology for existing websites with the cloud environment
- the low traffic created challenges for promoting the site, gathering user feedback and analytics, and recruiting participants for testing
- recruitment of users and of service delivery organizations for research purposes:
- participation was voluntary in the absence of user compensation provisions
- recruiting youth who are further away from the labour market and targeted by YESS and CSC
- lack of internal capacity and stakeholder support to engage youth service delivery organizations in the YDG consultations
Extent to which the YDG project implementation is progressing on schedule
The YDG was approved as an agile project with a variable scope. It was also intended to adopt user-centric design principles, requiring research and consultation to inform the design and implementation of YDG products. This approach entails a process of iterative design, development, and testing to inform development of future features and products, to help ensure that they meet user needs.
The initial roadmap focused on delivering 5 digital products. Over the course of the project, research and analysis demonstrated that some features proposed in the roadmap were less desirable and brought little value to users. The team focused efforts on delivering solutions that would enable improvements in personalization, navigation and findability of resources and opportunities in one location. As a result, the initial project roadmap was adjusted, and the project has delivered within this revised plan.
YESS program officials expressed a desire and need to focus on improving navigation and have more information on the YDG targeting service providers and employers applying for funding under YESS, and on related jobs opportunities made available under YESS. These requirements were prioritized in the 2023 to 2024 and 2024 to 2025 roadmap.
Lessons learned
As the YDG project approaches its completion date, a comprehensive, lessons learned exercise will be conducted across policy, program and the project team to document the lessons identified, the success, key accomplishments and areas of improvement to consider in the context of the service transformation journey.