
Employment Insurance Monitoring and Assessment Report 2014/2015 Chapter II - 2. Assisting Canadians during unemployment: Employment Insurance regular benefits
2. Assisting Canadians during unemployment: Employment Insurance regular benefits
Employment Insurance (EI) regular benefits provide temporary financial assistance to workers who have lost their job for reasons outside their control, while they look for work or upgrade their skills, Footnote 31 provided that, in the previous 52 weeks, or since the start of their last claim (whichever is shorter), they paid EI premiums and have accumulated the required number of hours of insurable employment. In most cases, to qualify for regular benefits, individuals require between 420 and 700 hours of insurable employment, depending on the unemployment rate of the EI economic region in which they reside at the time of making their claim. This feature of the EI program is referred to as the Variable Entrance Requirement (VER).
However, workers who have recently entered the labour market for the first time (new entrants) and those who have limited or no work experience in the last two years (re-entrants) require 910 hours of insurable employment regardless of where they reside. These two groups are collectively known as new-entrants/re-entrants (NEREs).
The amount paid in EI regular benefits is driven by three key indicators: the number of claims, the duration of benefits, and the average weekly benefit rate (level of benefits). In general, an increase in one of these three indicators will have a positive impact on the total amount paid. In the section 2.1, the number of claims and amount paid will be discussed, while the duration and level of regular benefits will be discussed in sections 2.3 and 2.4. For the purpose of these sections, EI regular claims refer to claims for which at least $1 of regular benefits was paid.
2.1 Employment Insurance regular claims and amount paid Footnote 32
The number of regular claims established in 2014/2015 remained relatively stable at 1.34 million from 1.33 million in 2013/2014, representing a slight increase of 1.3%. Despite a downward trend since 2008/2009, the number of new EI regular claims remained 3.8% higher than the level (1.29 million) observed in 2007/2008, prior to the onset of the 2008 recession (see chart 8).
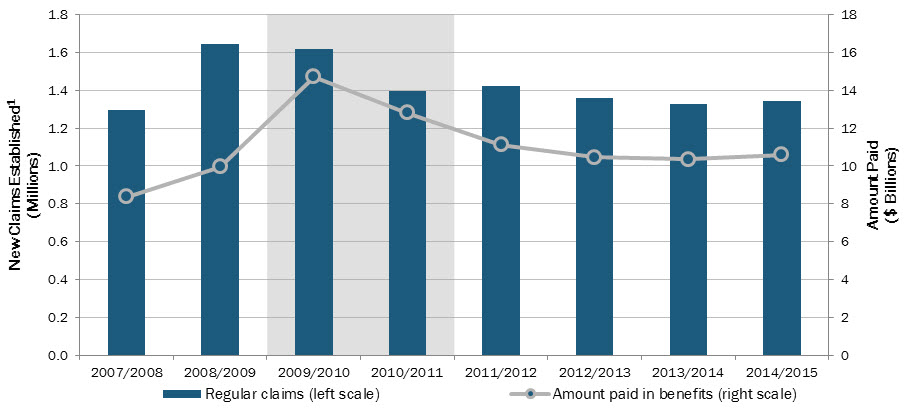
Show Data Table
| Regular Claims (Millions) | Amount Paid ($ Billions) | |
|---|---|---|
| 2007/2008 | 1.3 | 8.4 |
| 2008/2009 | 1.6 | 10.0 |
| 2009/2010 | 1.6 | 14.7 |
| 2010/2011 | 1.4 | 12.8 |
| 2011/2012 | 1.4 | 11.1 |
| 2012/2013 | 1.4 | 10.5 |
| 2013/2014 | 1.3 | 10.4 |
| 2014/2015 | 1.3 | 10.6 |
- Note: Shaded area corresponds to a recessionary period for Canada's economy.
- 1 Includes claims for which at least $1 of regular benefits were paid.
- Source: ESDC, Employment Insurance (EI) administrative data. Data are based on a 10% sample of EI administrative data.
In addition, the unemployment rate attained a high of 8.5% in 2009/2010 and has since been decreasing, reaching 6.9% in 2014/2015 (see Chart 9). Generally, the number of EI regular claims tends to be sensitive to economic cycles and labour market conditions. Canadian economic activity fell in the Oil and Gas Extraction industry in the last quarter of 2014/2015, particularly in the Western provinces, following a sharp decline in the price of oil between June 2014 and January 2015. This ended the post-recession downward trend in the number of EI regular claims since 2008/2009 and began an upward trend.
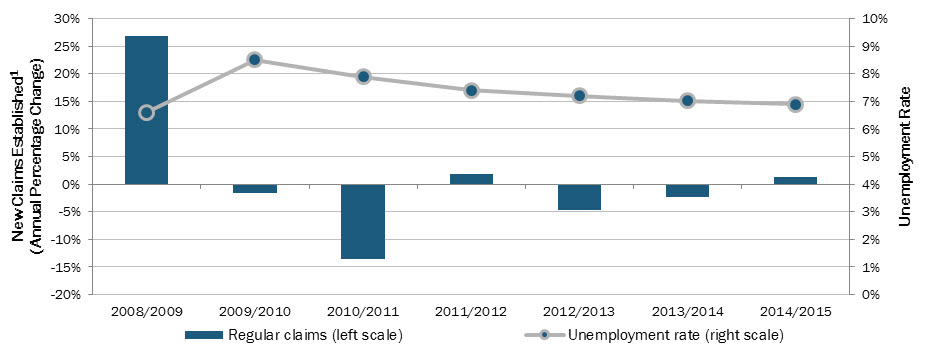
Show Data Table
| New Regular Claims Established (Annual percentage change) |
Unemployment rate | |
|---|---|---|
| 2008/2009 | 26.9% | 6.6% |
| 2009/2010 | -1.6% | 8.5% |
| 2010/2011 | -13.6% | 7.9% |
| 2011/2012 | 1.8% | 7.4% |
| 2012/2013 | -4.6% | 7.2% |
| 2013/2014 | -2.3% | 7.0% |
| 2014/2015 | 1.3% | 6.9% |
- 1 Includes claims for which at least $1 of regular benefits was paid.
- Source: ESDC, Employment Insurance (EI) administrative data (for data on regular claims); and Statistics Canada, Labour Force Survey, CANSIM Table 282-0001 (for data on unemployment rate). ESDC data are based on a 10% sample of EI administrative data.
Finally, as the number of EI regular claims stabilized, so did the amount of EI regular benefits paid to Canadians, which slightly increased to $10.6 billion in 2014/2015 from $10.4 billion in 2013/2014. This increase follows a four year downward trend in amount paid, decreasing since 2009/2010 when a high of $14.7 billion was reached. The amount paid in regular benefits is 26.6% higher than 2007/2008 levels, before the onset of the 2008 recession.
In 2014/2015, there was an average of 510,320 beneficiaries receiving EI regular benefits each month, a decrease of 1.5% from the average 518,080 regular beneficiaries in 2013/2014. The beneficiary count represents the number of EI claimants who received at least $1 of EI regular benefits during the reference period for the month (usually the week of the 15th day) and is affected by the inflow of new EI regular claimants and the outflow of EI regular claimants who have stopped receiving benefits, principally because they have exhausted their benefits entitlement or have returned to work.
Generally speaking, claims and beneficiaries tend to move together, except when there are changes in the average duration of benefits or a sudden, significant increase or decrease in new claims. When there is an economic shock, claim volumes will increase ahead of beneficiaries, due to the lag between when a new claim is received and when a benefit period is established and benefits are made payable. The beneficiary count will remain elevated after the volume of new claims have subsided as previous claims remain in pay, until benefits are exhausted or the claimants have returned to work.
2.1.1 Employment Insurance regular claims and amount paid, by province and territory, gender and age
As seen in Chart 10, while the number of new EI regular claims established remained relatively stable nationally (+1.3%), it fluctuated largely by province and territory. As such, while Alberta (+25.9%) and Saskatchewan (+15.0%) saw large increases in claims volume, the number of claims decreased noticeably in Ontario (-2.4%), as well as in Nunavut (-29.4%) and in Yukon (-6.9%). As indicated in section 2.1.2, changing economic conditions affecting the Mining and Oil and Gas Extraction industry in the Western provinces had a negative impact on the number of claims established in these regions. In addition, the increase in the number of EI claims in Alberta and Saskatchewan was observed for both men and women.

Show Data Table
| 2014/2015 New Regular Claims Established (Annual percentage change) |
|
|---|---|
| N.L. | 0.2% |
| P.E.I. | 3.2% |
| N.S. | 2.0% |
| N.B. | -0.7% |
| Que. | -0.1% |
| Ont. | -2.4% |
| Man. | 4.6% |
| Sask. | 15.0% |
| Alta. | 25.9% |
| B.C. | -1.3% |
| Y.T. | -6.9% |
| N.W.T. | 9.8% |
| Nvt. | -29.4% |
| Canada | 1.3% |
- 1 Includes claims for which at least $1 of regular benefits was paid.
- Source: ESDC, Employment Insurance (EI) administrative data. Data are based on a 10% sample of EI administrative data.
Similarly, the total amount of regular benefits paid also fluctuated significantly by province and territory (see Chart 11), with Alberta and Saskatchewan again seeing the largest increases from 2013/2014 to 2014/2015 at 11.4% and 9.3%, respectively, while Ontario and Nunavut decreased by 1.1% and 20.2%, in that order.
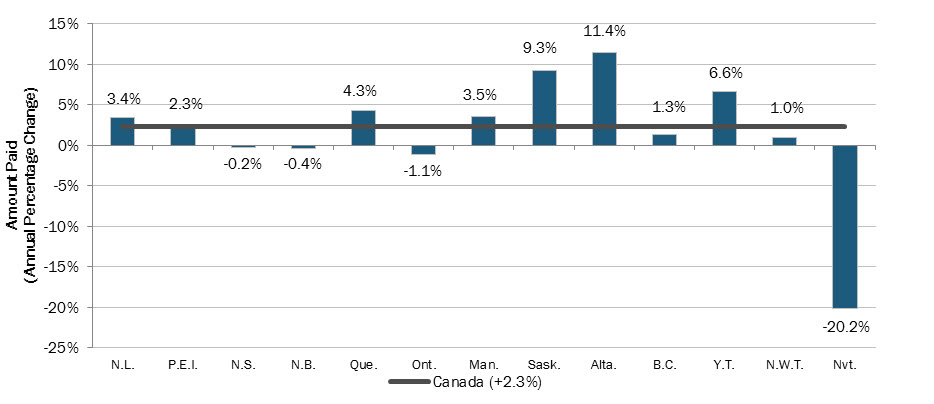
Show Data Table
| 2014/2015 Amount Paid (Annual percentage change) |
|
|---|---|
| N.L. | 3.4% |
| P.E.I. | 2.3% |
| N.S. | -0.2% |
| N.B. | -0.4% |
| Que. | 4.3% |
| Ont. | -1.1% |
| Man. | 3.5% |
| Sask. | 9.3% |
| Alta. | 11.4% |
| B.C. | 1.3% |
| Y.T. | 6.6% |
| N.W.T. | 1.0% |
| Nvt. | -20.2% |
| Canada | 2.3% |
- Source: ESDC, Employment Insurance (EI) administatrative data. Data are based on a 10% sample of EI administrative data.
Table 8 depicts the percentage change in the number of new EI regular claims and amount paid by gender from 2013/2014 to 2014/2015. As can be seen, the number of regular EI claims established increased nationally for men (+2.3%) while it decreased slightly for women (-0.3%). Percentage changes by gender show big fluctuations by province: while the number of EI regular claims made by men increased by 35.6% in Alberta, it decreased by 7.2% in the Territories. Likewise, the number of EI regular claims established by women increased by 11.9% in Alberta while it decreased by 3.1% in Nova Scotia and New Brunswick.
| Province and Territory | New Claims Established1
(Annual Percentage Change) |
Amount Paid (Annual Percentage Change) |
||||
|---|---|---|---|---|---|---|
| Men | Women | Total | Men | Women | Total | |
| Newfoundland and Labrador | 1.1% | -1.2% | 0.2% | 2.8% | 4.7% | 3.4% |
| Prince Edward Island | 4.5% | 1.3% | 3.2% | 2.5% | 1.8% | 2.2% |
| Nova Scotia | 5.1% | -3.1% | 2.0% | 0.9% | -2.7% | -0.2% |
| New Brunswick | 0.6% | -3.1% | -0.7% | 0.2% | -1.8% | -0.4% |
| Quebec | 0.2% | -0.6% | -0.1% | 5.1% | 2.4% | 4.3% |
| Ontario | -3.2% | -1.3% | -2.4% | -2.0% | 0.3% | -1.1% |
| Manitoba | 7.0% | 0.8% | 4.6% | 5.4% | -0.5% | 3.5% |
| Saskatchewan | 21.1% | 5.4% | 15.0% | 11.0% | 5.3% | 9.3% |
| Alberta | 35.6% | 11.9% | 25.9% | 14.4% | 6.1% | 11.4% |
| British Columbia | -0.3% | -2.4% | -1.3% | 1.4% | 1.2% | 1.4% |
| Yukon | -4.7% | -11.0% | -6.9% | 0.6% | 18.5% | 6.5% |
| Northwest Territories | 1.9% | 27.7% | 9.8% | -3.0% | 10.6% | 1.2% |
| Nunavut | -30.4% | -27.6% | -29.4% | -15.3% | -31.2% | -20.4% |
| Canada | 2.3% | -0.3% | 1.3% | 2.7% | 1.5% | 2.3% |
- Note: Totals may not add up due to rounding.
- 1 Includes claims for which at least $1 of regular benefits was paid.
- Source: ESDC, Employment Insurance (EI) administrative data. Data are based on a 10% sample of EI administrative data.
Table 8 also shows that gender fluctuations by province and territory usually follow the same trend: the number of EI regular claims increases or decreases for both genders in a specific area. This is not the case however for the provinces of Newfoundland and Labrador, Nova Scotia, New Brunswick and Quebec, where while the number of claims increased for men, it decreased for women.
Similar to new claims established, the amount paid moved in the same direction for both men and women in 8 out of the 13 provinces and territories. The exceptions to this were the provinces of Nova Scotia, New Brunswick, Ontario, and Manitoba, as well as the Northwest Territories. Specifically, the Northwest Territories saw a gap of 13.6%, where amount paid to men modestly decreased by 3.0% but amount paid to women increased by 10.6%. Even more significant was Yukon, which witnessed the largest gender gap in the year-over-year percentage change at nearly 18%, although both men and women observed increases in amount paid.
Chart 12 shows that the proportion of claims made by claimants aged between 25 and 44 years old has been decreasing slightly since 2007/2008. On the other hand, claims made by older workers (55 years and older) are trending upward from 16% in 2007/2008 to 22% in 2014/2015.
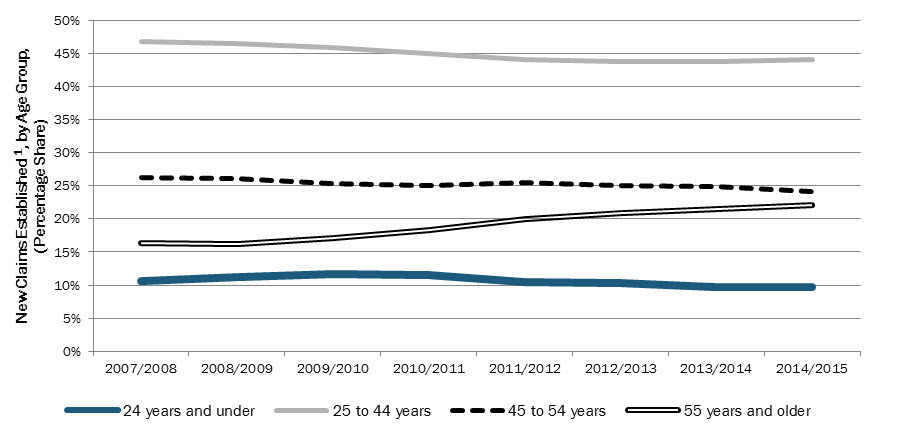
Show Data Table
| New Regular Claims Established (percentage share) | ||||||||
|---|---|---|---|---|---|---|---|---|
| 2007/2008 | 2008/2009 | 2009/2010 | 2010/2011 | 2011/2012 | 2012/2013 | 2013/2014 | 2014/2015 | |
| 24 years and under | 11% | 11% | 12% | 12% | 11% | 10% | 10% | 10% |
| 25 to 44 years | 47% | 47% | 46% | 45% | 44% | 44% | 44% | 44% |
| 45 to 54 years | 26% | 26% | 25% | 25% | 26% | 25% | 25% | 24% |
| 55 years and older | 16% | 16% | 17% | 18% | 20% | 21% | 22% | 22% |
- 1 Includes claims for which at least $1 of regular benefits was paid.
- Source: ESDC, Employment Insurance administrative data. Data are based on a 10% sample of EI administrative data.
There is a parallel movement among the age groups for the amount paid in regular benefits (see Chart 13). Specifically, the share of the total amount paid to those aged 55 years and older has been increasing since 2009/2010, when it had remained steady at around 17% for several years. In 2014/2015 the amount paid to this age group increased to 23%. In addition, those aged 25 to 44 have seen the largest decrease, falling from 48% in 2007/2008 to 43% in 2014/2015. The other age groups (those aged 24 and under, and 45 to 55 years) have seen very modest decline in their share of total amount paid.

Show Data Table
| Amount Paid (percentage share) | ||||||||
|---|---|---|---|---|---|---|---|---|
| 2007/2008 | 2008/2009 | 2009/2010 | 2010/2011 | 2011/2012 | 2012/2013 | 2013/2014 | 2014/2015 | |
| 24 years and under |
10% | 10% | 11% | 10% | 10% | 10% | 9% | 9% |
| 25 to 44 years |
48% | 47% | 47% | 44% | 44% | 44% | 44% | 43% |
| 45 to 54 years |
25% | 26% | 26% | 26% | 26% | 25% | 25% | 25% |
| 55 years and older |
17% | 17% | 17% | 20% | 21% | 22% | 22% | 23% |
- Source: ESDC, Employment Insurance (EI) administrative data. Data are based on a 10% sample of EI administrative data
These trends may be attributed to the aging population. There is a positive correlation between the increase in the number of EI regular claims and amount paid among older workers and the increase in their share of the Canadian labour force. Older workers accounted for 19% of the labour force in 2014/2015, an increase from 15% in 2007/2008.
2.1.2 Employment Insurance Regular claims and amount paid, by industry and Employment Insurance claimant category
From 2013/2014 to 2014/2015, while the total number of EI regular claims remained stable, the number of EI regular claims in the Mining and Oil and Gas Extraction industry increased by 18.5%. This industry, which was impacted by the sharp decrease in the price of oil in 2014/2015, experienced the highest percentage increase in EI regular claims. Further analysis shows that the increase in EI regular claims in this industry was concentrated in three provinces: Alberta (+71.3%), British Columbia (+41.4%) and Nova Scotia (+31.3%). It has to be stated that, even with this increase in EI regular claims, the Mining and Oil and Gas Extraction industry only accounts for 2% of the overall EI regular claims.
Consistent with 2013/2014, the three industries that accounted for the highest number of claims in 2014/2015 were: the construction industry (20%), the manufacturing industry (11%) and the educational services industry (11%) (see Table 9). These three industries accounted for 42% of EI regular claims.
| Industry | New Claims Established1 | Amount Paid | ||||
|---|---|---|---|---|---|---|
| (Share) | ($ Million) | (Share) | ||||
| 2013/2014 | 2014/2015 | 2014/2015 | 2013/2014 | 2014/2015 | 2014/2015 | |
| Goods-Producing Industries | 512,200 | 511,030 | 38% | 4,349.4 | 4,379.8 | 41% |
| Agriculture, Forestry, Fishing and Hunting | 57,140 | 56,880 | 4% | 503.6 | 500.7 | 5% |
| Mining and Oil and Gas Extraction | 24,380 | 28,900 | 2% | 253.1 | 238.9 | 2% |
| Utilities | 4,680 | 4,420 | 0% | 40.0 | 41.1 | 0% |
| Construction | 274,730 | 274,140 | 20% | 2,324.7 | 2,376.8 | 22% |
| Manufacturing | 151,270 | 146,690 | 11% | 1,228.0 | 1,222.4 | 12% |
| Services-Producing Industries | 769,260 | 748,370 | 56% | 5,734.3 | 5,656.9 | 53% |
| Wholesale Trade | 43,940 | 44,050 | 3% | 435.7 | 421.0 | 4% |
| Retail Trade | 79,210 | 72,850 | 5% | 630.3 | 607.0 | 6% |
| Transportation and Warehousing | 56,690 | 56,270 | 4% | 412.9 | 400.3 | 4% |
| Finance and Insurance | 14,750 | 13,820 | 1% | 167.0 | 155.9 | 1% |
| Real Estate and Rental and Leasing | 18,050 | 18,030 | 1% | 155.3 | 163.7 | 2% |
| Professional, Scientific and Technical Services | 53,800 | 54,690 | 4% | 510.6 | 505.4 | 5% |
| Business, Building and Other Support Services2 | 96,850 | 93,310 | 7% | 784.5 | 787.0 | 7% |
| Educational Services | 145,810 | 146,040 | 11% | 605.8 | 634.6 | 6% |
| Health Care and Social Assistance | 48,840 | 47,160 | 4% | 360.2 | 362.2 | 3% |
| Information, Cultural and Recreation3 | 41,960 | 39,470 | 3% | 332.8 | 318.3 | 3% |
| Accommodation and Food Services | 63,360 | 58,550 | 4% | 460.3 | 427.2 | 4% |
| Other Services (except Public Administration) | 40,700 | 40,730 | 3% | 336.6 | 334.4 | 3% |
| Public Administration | 65,300 | 63,400 | 5% | 542.3 | 539.9 | 5% |
| Unclassified | 44,350 | 83,210 | 6% | 283.9 | 565.3 | 5% |
| Canada | 1,325,810 | 1,342,610 | 100% | 10,367.6 | 10,602.1 | 100% |
- Note: Totals may not add up due to rounding.
- 1 Includes claims for which at least $1 of regular benefits was paid.
- 2 This industry comprises the industries with codes 55 (management of companies and enterprises) and 56 (administrative and support, waste management and mediation services) from the North American Industry Classification System.
- 3 This industry comprises the industries with codes 51 (information and cultural industries) and 71 (arts, entertainment and recreation) from the North American Industry Classification System.
- Source: ESDC, Employment Insurance (EI) administrative data. Data are based on a 10% sample of EI administrative data.
In 2014/2015, the number of new EI regular claims in the goods-producing industries remained fairly constant, decreasing by just 0.2%. The decrease in the number of claims in the goods industry was driven by a decrease in the Manufacturing industry, but was offset by the year-over-year increase of 18.5% in the Mining, Oil and Gas Extraction industry. As illustrated in Chart 14, the goods industry observed a modest employment loss of 0.6% in 2014/2015. Unlike the goods industry, the services industry showed a modest employment gain of 0.9%, while the number of EI regular claims decreased by 2.7%. The decline in EI regular claims in the service industry was driven by decreases in new claims in Retail Trade (-8.0%), Accommodation and Food Services (-7.6%), and Business, Building and Other Support Services (-3.7%).
Despite the decrease in the number of regular claims, 2014/2015 saw a modest 0.7% increase in the amount paid in the goods-producing industries (see Chart 14). This is attributable to the increase in amount paid to the construction sector, which made up 54% of the goods-producing industries’ new claims in 2014/2015. Unsurprisingly, the services-producing industries saw a 1.3% decline in the amount of regular benefits paid, driven primarily by the large overall decrease in the amount of regular claims in these industries.
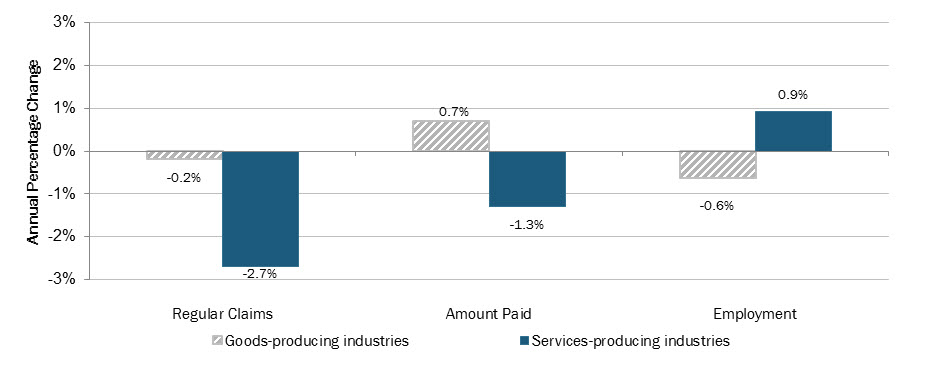
Show Data Table
| 2014/2015 (Annual percentage change) | |||
|---|---|---|---|
| Regular Claims | Amount Paid | Employment | |
| Goods-producing industries | -0.2% | 0.7% | -0.6% |
| Services-producing industries | -2.7% | -1.3% | 0.9% |
- 1 Includes claims for which at least $1 of regular benefits was paid.
- Source: ESDC, Employment Insurance (EI) administrative data (for data on regular claims and amount paid); and Statistics Canada, Labour Force Survey, CANSIM Table 282-0007 (for data on employment). ESDC data are based on a 10% sample of EI administrative data.
Similar to last year, the distribution of EI regular claims by EI claimant category shows that frequent claimants accounted for roughly 23% of new claims established. The proportion of long-tenured workers and occasional claimants however fluctuated slightly: while the percentage of long-tenured workers decreased by 2 percentage points, from 21% to 19%, occasional claimants’ share of EI claims increased by 3 percentage points, from 55% to 58% (see Table 10).
| Claimant Category2 | New Claims Established1 | Amount Paid | ||||
|---|---|---|---|---|---|---|
| (Share) | ($ Million) | (Share) | ||||
| 2013/2014 | 2014/2015 | 2014/2015 | 2013/2014 | 2014/2015 | 2014/2015 | |
| Long-tenured Workers | 285,000 | 261,760 | 20% | 2,377.2 | 2,136.9 | 20% |
| Occasional Claimants | 731,030 | 776,150 | 58% | 5,278.5 | 5,735.6 | 54% |
| Frequent Claimants | 309,780 | 304,700 | 23% | 2,712.0 | 2,729.6 | 26% |
| Canada | 1,325,810 | 1,342,610 | 100% | 10,367.6 | 10,602.1 | 100% |
- Note: Totals may not add up due to rounding.
- 1 Includes claims for which at least $1 of regular benefits was paid.
- 2 Long-tenured workers are Employment Insurance (EI) claimants who have paid at least 30% of the maximum annual EI premiums for the past 7 of 10 years and who, over the last 5 years, have collected EI regular or fishing benefits for 35 weeks or less. Frequent claimants are EI claimants who have had three or more claims for EI regular or fishing benefits and have collected benefits for a total of more than 60 weeks in the past 5 years. Occasional claimants are EI claimants who do not meet the requirements for either long-tenured workers or frequent claimants.
- Source: ESDC, Employment Insurance (EI) administrative data. Data are based on a 10% sample of EI administrative data.
The total amount paid to the different EI claimant categories have also remained constant over the 2013/2014 and 2014/2015 years. While occasional claimants make up the bulk of the both new claims and amount paid, this claimant category is underrepresented as a share of amount paid, making up 4 percentage points less of the total new claims. Conversely, frequent claimants are overrepresented, making up 3 percentage points more of the total amount paid than total new claims. This indicates that frequent claimants have, on average, longer benefit durations and/or higher average weekly benefit rates than occasional claimants.
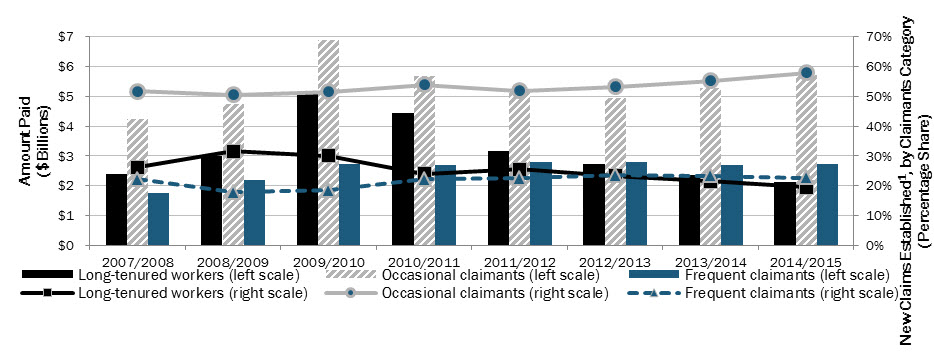
The number of long-tenured workers has been declining since the 2008 downturn. As such, the number of EI regular claims established for long-tenured workers in 2014/2015 is close to half of those in 2008/2009 (261,760 and 519,780, respectively). Not only did the number of EI regular claims for long-tenured workers decline since 2008/2009 but their share of claims also declined (from 32% to 20%) (see Chart 15). In addition, the amount paid to this claimant category has declined 57.8% since the recession, when it reached a high of $5.1 billion in 2009/2010.
Show Data Table
| Amount Paid ($ Billion) | New Regular Claims Established (Percentage share) | |||||
|---|---|---|---|---|---|---|
| Long-tenured workers | Occasional claimants | Frequent claimants | Long-tenured workers | Occasional claimants | Frequent claimants | |
| 2007/2008 | $2.4 | $4.2 | $1.8 | 26% | 52% | 22% |
| 2008/2009 | $3.0 | $4.8 | $2.2 | 32% | 51% | 18% |
| 2009/2010 | $5.1 | $6.9 | $2.7 | 30% | 51% | 19% |
| 2010/2011 | $4.4 | $5.7 | $2.7 | 24% | 54% | 22% |
| 2011/2012 | $3.2 | $5.2 | $2.8 | 26% | 52% | 23% |
| 2012/2013 | $2.7 | $5.0 | $2.8 | 23% | 53% | 24% |
| 2013/2014 | $2.4 | $5.3 | $2.7 | 22% | 55% | 23% |
| 2014/2015 | $2.1 | $5.7 | $2.7 | 20% | 58% | 23% |
- 1 Includes claims for which at least $1 of regular benefits was paid.
- 2 Long-tenured workers are Employment Insurance (EI) claimants who have paid at least 30% of the maximum annual EI premiums for the past 7 of 10 years and who, over the last 5 years, have collected EI regular or fishing benefits for 35 weeks or less. Frequent claimants are EI claimants who have had three or more claims for EI regular or fishing benefits and have collected benefits for a total of more than 60 weeks in the past 5 years. Occasional claimants are EI claimants who do not meet the requirements for either long-tenured workers or frequent claimants.
- Source: ESDC, Employment Insurance administrative data. Data are based on a 10% sample of EI administrative data.
Unlike long-tenured workers, occasional claimants’ share of EI regular claims has increased between 2008/2009 and 2014/2015 (from 51% to 58%). The number of EI claims made by occasional claimants has decreased between the years of 2008/2009 to 2012/2013 (from 830,660 to 720,810), but is trending upward since then (776,150 in 2014/2015). Consistent with this upward trend, this claimant category saw the highest increase in amount paid from 2013/2014 to 2014/2015, at 8.7% -- it is the second consecutive year where occasional claimants saw an increase in amount paid.
Finally, the proportion of EI regular claims established by frequent claimants has increased every year from 2008/2009 to 2012/2013 (18% to 24%) and has been stable since then at around 23% (see Chart 15). The number of claims made by frequent claimants has increased for the period from 2008/2009 to 2011/2012, but has since been trending downward. Amount paid to frequent claimants has also continued to be constant, remaining around $2.7 billion for six consecutive years.
2.1.3 Employment Insurance regular claims, by education level, hours of insurable employment, and unemployment rate in the Employment Insurance economic region
Analysis by educational level shows that most EI regular claims were made by claimants who worked in occupations that required college or apprenticeship training (34%) or secondary school and/or occupation specific training (33%). Data suggests that occupations that required a university degree or management studies tended to use less of the EI program. Table 11 also shows that the share of EI regular claims by education level has remained fairly stable over time.
| Education Level | New Claims Established1
(Share) |
|||||||
|---|---|---|---|---|---|---|---|---|
| 2007/2008 | 2008/2009 | 2009/2010 | 2010/2011 | 2011/2012 | 2012/2013 | 2013/2014 | 2014/2015 | |
| Management | 4% | 4% | 5% | 5% | 5% | 5% | 5% | 5% |
| University | 7% | 7% | 7% | 8% | 8% | 8% | 8% | 8% |
| College or apprenticeship training | 31% | 32% | 33% | 32% | 33% | 33% | 34% | 34% |
| Secondary school and/or occupation specific training | 36% | 36% | 35% | 34% | 34% | 33% | 33% | 33% |
| On the job training | 22% | 21% | 19% | 22% | 21% | 21% | 20% | 20% |
| Canada | 100% | 100% | 100% | 100% | 100% | 100% | 100% | 100% |
- Note: Totals may not add up due to rounding.
- 1 Includes claims for which at least $1 of regular benefits was paid.
- Source: ESDC, Employment Insurance (EI) administrative data. Data are based on a 10% sample of EI administrative data.
In 2014/2015, 39% of EI regular claims made by youth (24 years and under) were in positions that required either a college diploma or apprenticeship training, and 25% occupied positions that required secondary school or occupation specific training. In contrast, 38% of regular claims established by workers aged 45 years and older were in positions that required secondary school or occupation specific training, and 31% were in positions that required either a college diploma or apprenticeship training. This fact suggests that older workers who establish an EI claim tend to be less educated than younger workers.
The unemployment rate in an EI economic region determines the number of hours of insurable employment needed to qualify for EI. The higher the unemployment rate, the lower is the number of hours needed to qualify. In 2014/2015, a high proportion of EI regular claims were made by claimants who had accumulated 1,820 hours or more of insurable employment during their qualifying period (26.4%), which was an increase of 0.8 percentage point compared to 2013/2014. Table 12 shows that this percentage has been increasing since 2011/2012. It also shows that this proportion was much higher in 2008/2009 (31.1%) when the last recession started. One of the reasons for this is that a higher proportion of long-tenured workers lost their jobs and started receiving EI benefits in 2008/2009, and that these claimants had accumulated several hours of employment in the qualifying period (generally 52 weeks prior to their claim).
| Hours of Insurable Employment | New Claims Established1
(Share) |
|||||||
|---|---|---|---|---|---|---|---|---|
| 2007/2008 | 2008/2009 | 2009/2010 | 2010/2011 | 2011/2012 | 2012/2013 | 2013/2014 | 2014/2015 | |
| Less than 700 hours | 5.4% | 4.6% | 6.9% | 6.9% | 6.1% | 5.5% | 5.2% | 4.8% |
| 700 to 979 hours | 15.9% | 13.8% | 15.6% | 16.9% | 16.3% | 15.5% | 15.2% | 15.2% |
| 980 to 1,259 hours | 19.8% | 17.7% | 18.6% | 19.6% | 19.5% | 19.3% | 19.1% | 19.1% |
| 1,260 to 1,539 hours | 17.7% | 16.5% | 16.6% | 17.3% | 17.9% | 18.4% | 18.4% | 18.3% |
| 1,540 to 1,819 hours | 15.8% | 16.3% | 15.6% | 15.7% | 16.2% | 16.5% | 16.6% | 16.3% |
| 1,820 hours and more | 25.3% | 31.1% | 26.7% | 23.5% | 24.1% | 24.8% | 25.6% | 26.4% |
| Canada | 100% | 100% | 100% | 100% | 100% | 100% | 100% | 100% |
- Note: Totals may not add up due to rounding.
- 1 Includes claims for which at least $1 of regular benefits was paid.
- Source: ESDC, Employment Insurance (EI) administrative data. Data are based on a 10% sample of EI administrative data.
Statistics for the other increments of hours of insurable employment show that the proportion of claimants who accumulated less than 700 hours of insurable employment has been declining every year since 2010/2011. This is partially attributable to the gradual decrease of the unemployment rate in many EI economic regions, which consequently increases the number of hours needed to qualify for the program in these regions.
Chart 16 depicts the average number of hours of insurable employment per claim that qualified for EI benefits, which has been increasing every year since 2011/2012, from 1,338 to 1,381 hours. As expected, the number of hours of insurable employment per claim fluctuates by province. The number of hours in the Atlantic provinces tends to be lower than in other provinces. In 2014/2015, Newfoundland and Labrador showed the lowest average number of hours of insurable employment at 1,206, while claims established in Alberta had the highest average number of hours with 1,542 hours.
The average number of hours of insurable employment also fluctuates by sex and by age. Statistics show that claims made by men had, on average, 64 more hours of insurable employment than claims established for women in 2014/2015 (1,406 and 1,342 hours, respectively). This gap has remained constant over the last four years. Data by age show that claimants aged 55 years and over had accumulated the lowest number of hours of insurable employment in 2014/2015 (1,312), while those between 25 and 44 years of age had accumulated the highest number of hours (1,413).
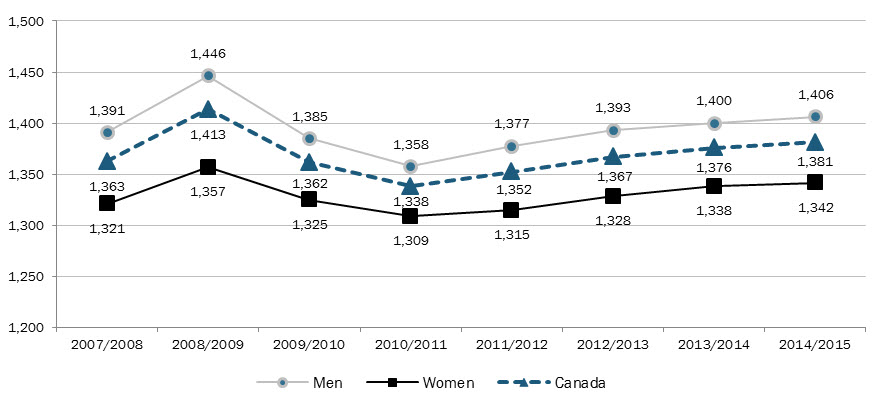
Show Data Table
| Men | Women | Canada | |
|---|---|---|---|
| 2007/2008 | 1,391 | 1,321 | 1,363 |
| 2008/2009 | 1,446 | 1,357 | 1,413 |
| 2009/2010 | 1,385 | 1,325 | 1,362 |
| 2010/2011 | 1,358 | 1,309 | 1,338 |
| 2011/2012 | 1,377 | 1,315 | 1,352 |
| 2012/2013 | 1,393 | 1,328 | 1,367 |
| 2013/2014 | 1,400 | 1,338 | 1,376 |
| 2014/2015 | 1,406 | 1,342 | 1,381 |
- 1 Includes claims for which at least $1 of regular benefits was paid.
- Source: ESDC, Employment Insurance (EI) administrative data. Data are based on a 10% of EI administrative data.
To conclude, Table 13 shows that the distribution of new EI regular claims by regional unemployment rates fluctuates on a yearly basis. While the percentage of new EI regular claims established in EI economic regions with an unemployment rate of 6.0% or lower was 14% in 2013/2014, it increased to 20% in 2014/2015. The increase in the number of EI regular claims established in Alberta is one reason for the increase in EI regular claims in the unemployment rate threshold of “less than or equal to 6.0%”, as more than 90% of claims established in Alberta (95,940 out of 105,780) were made in regions where the unemployment rate was under 6.1% in 2014/2015.
| Regional Unemployment Rate2 | New Claims Established1
(Share) |
||||||
|---|---|---|---|---|---|---|---|
| 2008/2009 | 2009/2010 | 2010/2011 | 2011/2012 | 2012/2013 | 2013/2014 | 2014/2015 | |
| 0.1% to 6.0% | 26% | 8% | 8% | 13% | 15% | 14% | 20% |
| 6.1% to 7.0% | 18% | 9% | 9% | 12% | 12% | 15% | 12% |
| 7.1% to 8.0% | 24% | 11% | 16% | 12% | 13% | 20% | 25% |
| 8.1% to 9.0% | 8% | 14% | 24% | 33% | 33% | 25% | 18% |
| 9.1% to 10.0% | 3% | 28% | 15% | 10% | 7% | 4% | 6% |
| 10.1% to 11.0% | 6% | 8% | 8% | 5% | 4% | 6% | 4% |
| 11.1% to 12.0% | 2% | 6% | 6% | 3% | 3% | 4% | 3% |
| 12.1% to 13.0% | 3% | 4% | 3% | 2% | 2% | 1% | 1% |
| 13.1% to 14.0% | 1% | 2% | 1% | 1% | 2% | 1% | 0% |
| 14.1% to 15.0% | 3% | 2% | 2% | 1% | 1% | 2% | 2% |
| 15.1% to 16.0% | 1% | 2% | 2% | 2% | 2% | 4% | 2% |
| 16.1% or higher | 6% | 7% | 7% | 7% | 7% | 6% | 8% |
| Canada | 100% | 100% | 100% | 100% | 100% | 100% | 100% |
- Note: Totals may not add up due to rounding.
- 1 Includes claims for which at least $1 of regular benefits was paid.
- 2 Unemployment rates used for the Employment Insurance program are a moving average of seasonally adjusted rates of unemployment produced by Statistics Canada, as per section 17 of the Employment Insurance Regulations.
- Source: ESDC, Employment Insurance (EI) administrative data. Data are based on a 10% sample of EI administrative data.
2.2 Coverage, eligibility and access to Employment Insurance regular benefits
As previously indicated, the Employment Insurance (EI) program provides temporary financial assistance to unemployed individuals who have recently lost employment for reasons outside their control (e.g., a valid job separation), contributed to the program and accumulated the required number of hours of insurable employment over the past year or since their last claim—whichever is shorter.
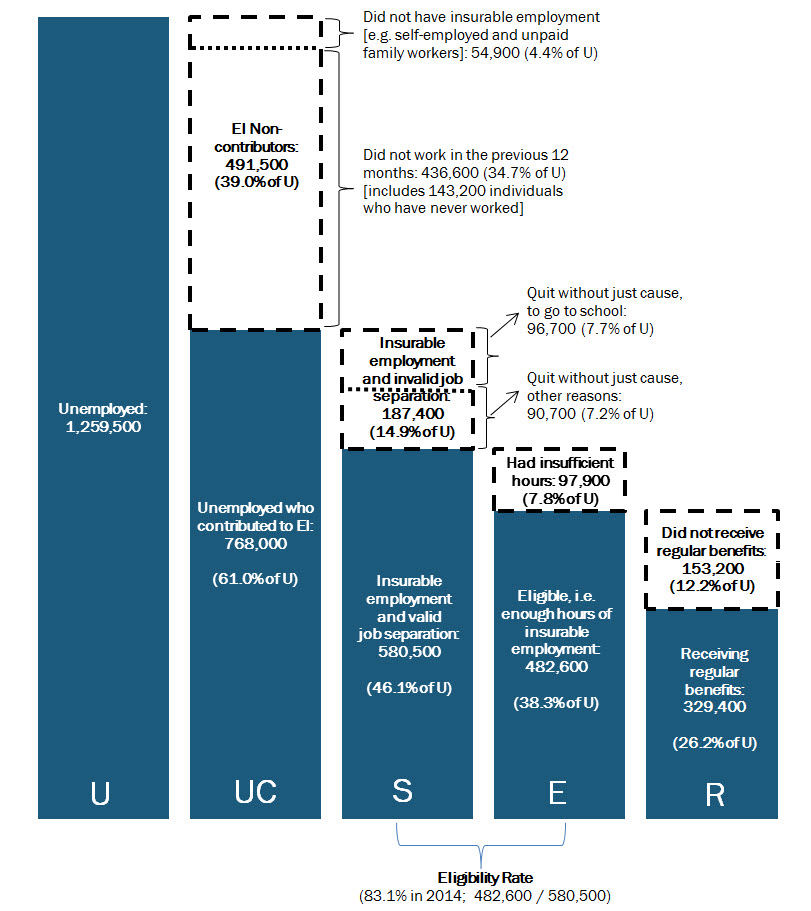
The following sections examine the unemployed population and various sub-populations of the unemployed population as they relate to the EI program. More specifically, the unemployed population is examined from the perspective of the core eligibility requirements (contribution to EI, valid job separation, and sufficient hours of insurable employment). As illustrated in Chart 17, in 2014 there were 1,259,500 unemployed individuals (bar U), of which 768,000 had contributed to the EI program (bar UC). Of those who had worked and contributed to EI, there were 580,500 individuals who had a valid job separation (bar S). The sub-populations include 482,600 individuals who were eligible for EI—meaning they also had accumulated enough hours of insurable employment to qualify for EI regular benefits (bar E); of that group, a total of 329,400 individuals received regular benefits (bar R).
The following section elaborates on the number of unemployed individuals in 2014 who were covered by the EI program (section 2.2.1), were eligible for EI regular benefits (section 2.2.2) and had access to EI regular benefits (section 2.2.3). The majority of the statistics in these sections are based on results from the 2014 Employment Insurance Coverage Survey (EICS) Footnote 33 conducted by Statistics Canada. The EICS was originally launched in 1997, primarily to better understand the relationship between the number of persons in receipt of EI benefits and the number of unemployed. The results allow users to draw a comprehensive profile of the unemployed and other persons who may have been entitled to EI benefits due to a recent break in employment.
Show Data Table
| 2014 | ||
|---|---|---|
| Number | Share of Unemployed | |
| Unemployed | 1,259,500 | Not applicable |
| Unemployed who contributed to EI | 768,000 | 61.0% |
| Insurable employment and valid job separation | 580,500 | 46.1% |
| Eligible: Enough insurable hours | 482,600 | 38.3% |
| Receiving regular benefits | 329,400 | 26.2% |
| EI non-contributors | 491,500 | 39.0% |
| Insurable employment and invalid job separation | 187,400 | 14.9% |
| Ineligible: Insufficient insurable hours | 97,900 | 7.8% |
| Did not receive regular benefits | 153,200 | 12.2% |
- Note: Totals may not add up due to rounding.
- Source: Statistics Canada, Employment Insurance Coverage Survey.
2.2.1 Coverage of Employment Insurance regular benefits
The EI program’s definition of coverage is similar to that of other insurance programs. As such, an individual is considered to be covered by the EI program if he or she has paid EI premiums at a given time in the previous 12 months.
This section analyzes the unemployed population who paid EI premiums in the previous 12 months leading up to their period of unemployment in 2014. Also examined is the population of unemployed individuals who had not paid EI premiums in the previous 12 months.
2.2.1.1 Coverage of Employment Insurance regular benefits, national statistics
According to the EICS, there were 1,259,500 unemployed individuals in Canada (shown as bar U in Chart 17) in 2014. Footnote 34 This represents a decrease of 4.0% from the 1,312,300 unemployed individuals reported in 2013.
The 2014 EICS estimated that, among the 1,259,500 unemployed individuals, 768,000 had paid EI premiums in the previous 12 months before becoming unemployed (referred to as contributors), representing 61.0% of all unemployed people (see Chart 17, blue bar UC), a small decline compared to 2013 (62.5%).
According to the 2014 EICS, there were 491,500 individuals who had not contributed to EI in the previous 12 months (referred to as non-contributors), representing 39.0% of the unemployed (see Chart 17, white bar above UC). Those who had not paid EI premiums include self-employed workers, Footnote 35 unpaid family workers, and individuals who have not worked in the previous 12 months including those who had never worked. As illustrated in Chart 17 (white bar above UC), in 2014, there were 54,900 self-employed and unpaid family workers representing 4.4% of the total unemployed population; in addition, there were 436,600 individuals who did not work in the previous 12 months including those who had never worked, representing 34.7% of the total unemployed population.
Table 14 provides a distribution of unemployed EI contributors and non-contributors. The EI coverage rate (proportion of the unemployed who had paid EI premiums in the previous 12 months) decreased from 70.0% to 61.0% between 2007 (just before the 2008 recession) and 2014. This decrease can be attributed to increases in the proportion of unemployed individuals who had not worked in the previous 12 months, which can be further broken down by i) individuals who had not worked in the previous 12 months, excluding those who had never worked (+5.7 percentage points), and ii) individuals who had never worked (+4.2 percentage points).
| Employment Insurance Contributors and Non-Contributors | Unemployed Population (Share) |
|||||||
|---|---|---|---|---|---|---|---|---|
| 2007 | 2008 | 2009 | 2010 | 2011 | 2012 | 2013 | 2014 | |
| Employment Insurance Contributors | 70.0% | 70.1% | 70.3% | 64.7% | 64.5% | 61.7% | 62.5% | 61.0% |
| Employment Insurance Non-contributors | 30.0% | 29.9% | 29.7% | 35.3% | 35.5% | 38.3% | 37.5% | 39.0% |
| Have No Recent Insurable Employment (e.g. Self-employed1 and Unpaid Family Workers) | 5.2% | 4.4% | 4.9% | 3.0% | 3.4% | 4.4% | 4.5% | 4.4% |
| Have Not Worked in the Previous 12 Months (Excluding Those Who Have Never Worked) | 17.6% | 18.3% | 18.3% | 24.1% | 25.0% | 24.6% | 24.3% | 23.3% |
| Have Never Worked | 7.2% | 7.2% | 6.5% | 8.3% | 7.1% | 9.3% | 8.8% | 11.4% |
| Canada | 100% | 100% | 100% | 100% | 100% | 100% | 100% | 100% |
- Note: Totals may not add up due to rounding.
- 1 Self-employed individuals can opt in and subsequently pay EI premiums for special benefits, but they are not eligible for regular benefits.
- Source: Statistics Canada, Employment Insurance Coverage Survey.
2.2.1.2 Coverage of Employment Insurance regular benefits, by region
EI coverage rates vary by region, ranging from a high of 79.4% in the Atlantic provinces to lows of 54.7% in Ontario and 59.6% in the Western provinces. Regions with higher coverage rates are those that have a lower proportion of individuals who had not worked in the previous 12 months. As indicated in Table 15, 18.0% of the Atlantic provinces’ unemployed population did not work in the previous 12 months, which consists of those who i) had not worked in the previous 12 months (excluding those who had never worked) and ii) had never worked; the proportions were comparatively higher in Ontario (40.9%) and in the Western provinces (36.5%).
| Employment Insurance Contributors and Non-Contributors | Unemployed Population (Share) |
||||
|---|---|---|---|---|---|
| Atlantic1 | Quebec | Ontario | Western2 | Canada | |
| Employment Insurance Contributors | 79.4% | 65.4% | 54.7% | 59.6% | 61.0% |
| Employment Insurance Non-contributors | 20.6% | 34.6% | 45.3% | 40.4% | 39.0% |
| Have No Recent Insurable Employment (e.g. Self-employed3 and Unpaid Family Workers) | 2.6% | 5.4% | 4.4% | 3.9% | 4.4% |
| Have Not Worked in the Previous 12 Months (Excluding Those Who Have Never Worked) | 13.0% | 20.7% | 27.2% | 23.4% | 23.3% |
| Have Never Worked | 5.0% | 8.5% | 13.7% | 13.1% | 11.4% |
| Canada | 100% | 100% | 100% | 100% | 100% |
- Note: Totals may not add up due to rounding.
- 1 The Atlantic provinces comprise Newfoundland and Labrador, Prince Edward Island, New Brunswick and Nova Scotia.
- 2 The Western provinces comprise Manitoba, Saskatchewan, Alberta and British Columbia.
- 3 Self-employed individuals can opt in and subsequently pay EI premiums for special benefits, but they are not eligible for regular benefits.
- Source: Statistics Canada, Employment Insurance Coverage Survey.
2.2.1.3 Coverage of Employment Insurance regular benefits, by gender and age
In 2014, the male coverage rate was 69.0%, increasing from 64.3% in 2013, which can be attributed to decreases in the number of individuals who had no recent insurable employment and those who had not worked in the previous 12 months (excluding those who had never worked). Conversely, the female coverage rate was 50.1%, decreasing from 60.0% in 2013¬, which is primarily attributed to a significant increase in women who had never worked (+44.5% or +25,600). As a result, the gender gap in the coverage rate increased to 18.9 percentage points in 2014, an increase of 14.6 percentage points compared to 2013. The average gap over the previous five years was 6.2 percentage points.
In 2014, the youth (15 to 24 years) coverage rate decreased to 50.3%, from 54.0% in 2013. Adults (25 years and older) had a 65.3% coverage rate, decreasing slightly from 65.5% in 2013. Coverage rates among youth tend to be significantly lower than those of adults because youth are less likely to have insurable employment, and are more likely to have never worked. In 2014, among unemployed youth, 29.5% had never worked—almost double the proportion witnessed in 2008 (15.7%)—compared to 4.0% for those aged 25 and older.
2.2.2 Eligibility for Employment Insurance regular benefits
To be eligible for EI regular benefits, individuals must first be covered by the EI program—meaning they must have paid EI premiums in the previous 12 months before their period of unemployment. In addition, to be eligible, individuals must have had a valid job separation and have accumulated enough hours of insurable employment before their job separation.
This section examines the individuals with a valid job separation and who have accumulated enough hours of insurable employment to be eligible for EI regular benefits (see Chart 17, blue bar E).
2.2.2.1 Eligibility for Employment Insurance regular benefits, national statistics
The 2014 EICS estimated that 580,500 unemployed individuals had a valid job separation, making them potentially eligible for EI regular benefits (see Chart 17, blue bar S).
In 2014, there were also 187,400 (14.9%) individuals whose job separation did not meet the EI program’s requirements (see Chart 17, white bar above S). These include unemployed individuals who quit their job to go to school (96,700 or 7.7% of the unemployed population) and those who quit for other reasons without just cause Footnote 36 (90,700 or 7.2% of the unemployed population).
Among the 580,500 unemployed population in 2014 who were covered by the EI program and had a valid job separation, 482,600 had accumulated enough hours to qualify for EI regular benefits (see Chart 17, blue bar E), for an eligibility rate of 83.1% (482,600 / 580,500). The 2014 EI eligibility rate of 83.1% represents a decrease of 2.7 percentage points from 85.8% in 2013 but remains above pre-recession levels (i.e. 82.3% in 2007 and 82.7% in 2006).
The remaining 97,900 of the unemployed population who had contributed to EI in the previous 12 months and had a valid job separation did not accumulate sufficient hours of insurable employment to qualify for EI regular benefits in 2014.
2.2.2.2 Eligibility for Employment Insurance regular benefits, by province
In 2014, eligibility rates ranged from a low of 77.3% in British Columbia to a high of 94.1% in Newfoundland and Labrador (see Chart 18). Compared with 2013 EICS figures, the EI eligibility rate decreased in 7 out of the 10 provinces. The largest decreases occurred in Nova Scotia (-13.6 percentage points) and Alberta (-7.5 percentage points). From 2013 to 2014, in both Nova Scotia and Alberta, a smaller proportion of the unemployed with insurable employment and a valid job separation had accumulated enough hours of insurable employment to qualify for EI. The drops in eligibility in both Nova Scotia and Alberta may be associated with differences in the composition of workers. Manitoba (+5.8 percentage points), Saskatchewan (+3.1 percentage points) and Newfoundland and Labrador (+0.2 percentage point) showed slight to moderate increases to their eligibility rate.
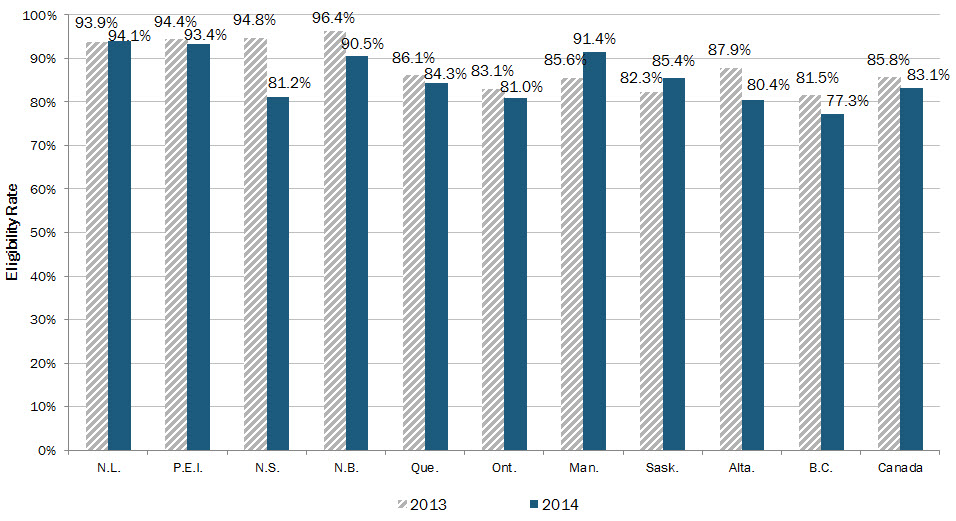
Show Data Table
| Eligibility rate | ||
|---|---|---|
| 2013 | 2014 | |
| N.L. | 93.9% | 94.1% |
| P.E.I. | 94.4% | 93.4% |
| N.S. | 94.8% | 81.2% |
| N.B. | 96.4% | 90.5% |
| Que. | 86.1% | 84.3% |
| Ont. | 83.1% | 81.0% |
| Man. | 85.6% | 91.4% |
| Sask. | 82.3% | 85.4% |
| Alta. | 87.9% | 80.4% |
| B.C. | 81.5% | 77.3% |
| Canada | 85.8% | 83.1% |
- Source: Statistics Canada, Employment Insurance Coverage Survey.
Eligibility rates may increase or decrease nationally, and by province and region, over the course of several years. Chart 19 shows that the national eligibility rate increased in 2009, after the 2008 recession. It has since decreased in 2010 and 2011, and increased in 2012 and 2013, before decreasing again in 2014. More information on eligibility trends can be found in section 2.2.2.4.
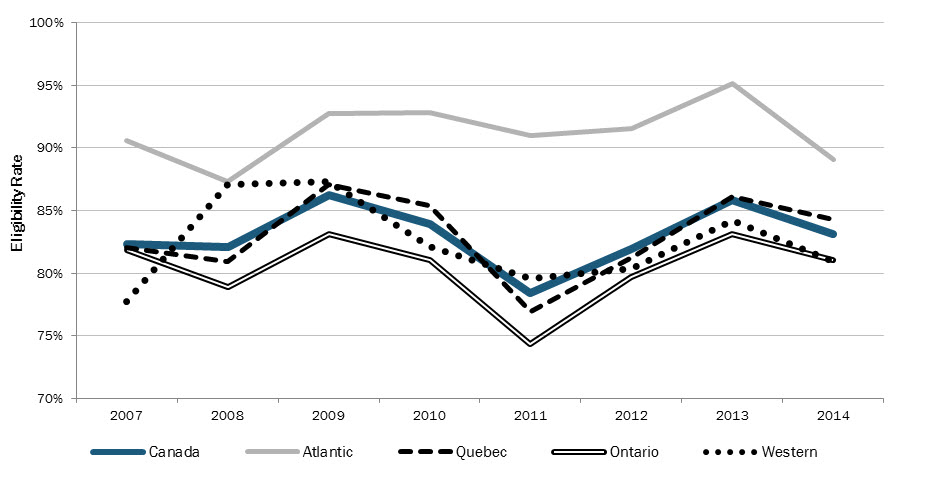
Show Data Table
| Eligibility rate | ||||||||
|---|---|---|---|---|---|---|---|---|
| 2007 | 2008 | 2009 | 2010 | 2011 | 2012 | 2013 | 2014 | |
| Canada | 82.3% | 82.1% | 86.2% | 83.9% | 78.4% | 81.9% | 85.8% | 83.1% |
| Atlantic | 90.6% | 87.3% | 92.7% | 92.8% | 91.0% | 91.5% | 95.1% | 89.1% |
| Quebec | 82.0% | 80.9% | 87.1% | 85.4% | 76.9% | 81.2% | 86.1% | 84.3% |
| Ontario | 81.8% | 78.9% | 83.1% | 81.0% | 74.3% | 79.7% | 83.1% | 81.0% |
| Western | 77.7% | 87.1% | 87.3% | 82.1% | 79.6% | 80.4% | 84.2% | 80.9% |
- Note 1: The Atlantic provinces comprise Newfoundland and Labrador, Prince Edward Island, New Brunswick and Nova Scotia.
- Note 2: The Western provinces comprise Manitoba, Saskatchewan, Alberta and British Columbia.
- Source: Statistics Canada, Employment Insurance Coverage Survey.
Eligibility rates by province and region generally follow the national trends; however, the degree of eligibility varies. For example, from 2007 to 2014, the Atlantic provinces have consistently had higher eligibility rates than the rest of the country, averaging 91.3% during that time. Comparatively, Ontario’s eligibility rate averaged 80.4% during the past eight years, lowest among all regions depicted in Chart 19. Quebec and the Western provinces experienced eligibility rates which more closely resembled the national trends.
2.2.2.3 Eligibility for Employment Insurance regular benefits, by gender and age
In 2014, EI eligibility rates decreased for all demographic groups, except for women and adult women (25 years and older) (see Table 16). The EI eligibility rate for men decreased from 89.8% in 2013 to 84.0% in 2014, while eligibility for women increased from 80.0% to 81.3%. The 5.8 percentage point decrease in the male eligibility rate in 2014 is attributed to i) a decrease in the number of men who had enough hours to qualify for EI regular benefits (-2.0%), and ii) an increase in the pool of men who had insurable employment and a valid job separation (+4.7%).
| Gender and Age Group | Eligibility Rate | ||||||
|---|---|---|---|---|---|---|---|
| 2008 | 2009 | 2010 | 2011 | 2012 | 2013 | 2014 | |
| Men | 84.6% | 87.3% | 83.6% | 79.4% | 81.9% | 89.8% | 84.0% |
| Women | 77.8% | 84.3% | 84.4% | 77.0% | 81.9% | 80.0% | 81.3% |
| Youth (15 to 24 Years) | 51.9% | 62.8% | 48.4% | 42.1% | 45.2% | 54.5% | 44.0% |
| Adults (25 Years and Older) | 89.1% | 90.5% | 89.6% | 85.1% | 87.9% | 90.4% | 87.9% |
| Adult Men (25 Years and Older) | 90.6% | 91.8% | 89.5% | 87.4% | 86.8% | 93.8% | 88.8% |
| Adult Women (25 Years and Older) | 86.4% | 88.3% | 89.6% | 82.0% | 88.9% | 85.5% | 86.3% |
| Canada | 82.2% | 86.2% | 83.9% | 78.4% | 81.9% | 85.8% | 83.1% |
- Source: Statistics Canada, Employment Insurance Coverage Survey.
As reported in previous EI Monitoring and Assessment Reports, gender differences in eligibility rates reflect different employment characteristics among men and women. A higher proportion of men than women hold full-time and/or permanent jobs; women tend to be over-represented among those working in part-time and/or temporary jobs.
The youth (15 to 24 years) eligibility rate has shown large fluctuations between 2012 and 2014, increasing from 45.2% in 2012 to 54.5% in 2013, before decreasing to 44.0% in 2014. The youth eligibility rate has historically been associated with a significantly higher coefficient of variation, Footnote 37 which contributes to the large variations witnessed in recent years, compared to the adult eligibility rate, which is more stable. The significant decrease in the youth eligibility rate in 2014 can be primarily attributed to a decrease in the number youth who had enough hours to qualify for EI regular benefits (-35.2%), among youth who had insurable employment and a valid job separation.
The youth eligibility rate (44.0%) is the lowest among all age groups, consistent with prior year data. A low eligibility rate for youth is associated with the type of work that this group usually performs, which is either part-time and/or temporary work. Therefore, they tend to accumulate fewer hours of work. The adult (25 years and older) eligibility rate was considerably higher (87.9%) than that of youth (15 to 24 years). Higher adult eligibility rates reflect more stable employment and more hours of insurable employment (e.g. permanent full-time work).
It is also important to note that among the 182,600 unemployed youth contributors to EI (who were potentially eligible for EI regular benefits), 65.3% quit without a just cause (45.1% to go to school, and 20.2% for other reasons), compared to 11.7% (2.5% to go to school, and 9.2% for other reasons) among adults (25 years and older) (see Chart 20). The high incidence of quits without a just cause among youth reduces the number of youth who could potentially be eligible for EI regular benefits. Only 34.8% of unemployed youth contributors had a valid job separation, compared to 88.3% for adults.
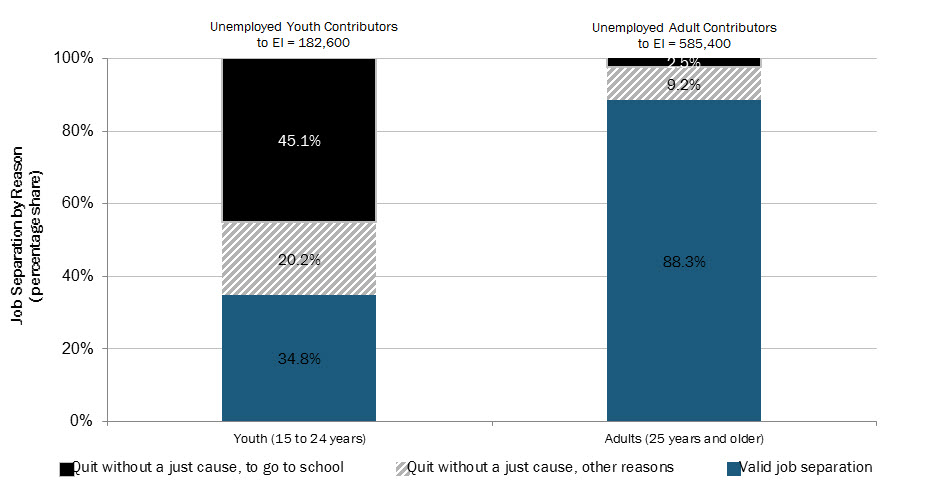
Show Data Table
| 2014 | |||
|---|---|---|---|
| Youth (15 to 24 years) | Adults (25 years and older) | ||
| Unemployed Contributors to EI | 182,600 | 585,400 | |
| Job separation by reason (percentage share) | Quit without a just cause, to go to school | 45.1% | 2.5% |
| Quit without a just cause, other reasons | 20.2% | 9.2% | |
| Valid job separation | 34.8% | 88.3% | |
- Note: Totals may not add up due to rounding.
- Source: Statistics Canada, Employment Insurance Coverage Survey.
2.2.2.4 Eligibility trends over the economic cycle
In general, the eligibility rate increases at the beginning of an economic downturn as the unemployed pool is composed of a greater percentage of newly unemployed workers who had relatively long, uninterrupted periods of employment. These workers would have accumulated enough hours to qualify for EI regular benefits. The eligibility rate also changes if there are structural changes in the labour market. When total employment is composed of a higher proportion of full-time employment (and a lower proportion of part-time employment), the incidence of being eligible for EI is higher. This is because full-time workers are more likely to have accumulated enough hours of insurable employment, and as a result, are more likely to be eligible to receive regular benefits.
From 2008 to 2009, as the recession took hold, the national eligibility rate increased to a high of 86.2% in 2009, from 82.2% in 2008 (see Table 17). The increase was attributed to the change in the composition of unemployed EI contributors. A large number of individuals became unemployed with insurable employment, a valid job separation and enough hours of insurable employment, making them eligible to receive EI regular benefits.
Between 2010 and 2011, as the recovery began, the national eligibility rate decreased from 83.9% to a historical low of 78.4%. This was the result of a shift in the composition of unemployed workers, as the proportion of unemployed permanent full-time workers as a share of unemployed workers with insurable employment and a valid job separation, decreased from 50.9% in 2010 to 45.3% in 2011 (see Table 17). This group has historically had a high eligibility rate (90-95%). In contrast, the proportion of unemployed temporary non-seasonal workers as a share of unemployed workers with insurable employment and a valid job separation increased from 24.7% in 2010 to a high of 28.1% in 2011. This group has historically had a lower eligibility rate (60-70%).
| 2008 | 2009 | 2010 | 2011 | 2012 | 2013 | 2014 | |
|---|---|---|---|---|---|---|---|
| Unemployment Rate | 6.1% | 8.3% | 8.1% | 7.5% | 7.3% | 7.1% | 6.9% |
| Eligibility Rate | 82.2% | 86.2% | 83.9% | 78.4% | 81.9% | 85.8% | 83.1% |
| Permanent Workers | 87.6% | 92.2% | 92.4% | 87.2% | 89.9% | 91.4% | 87.7% |
| Permanent Full-time Workers | 92.7% | 94.3% | 94.5% | 91.2% | 94.6% | 95.0% | 90.1% |
| Permanent Part-time Workers | 47.7% | 68.8% | 74.4% | 54.9% | 65.2% | 71.4% | 66.2% |
| Permanent Workers, Work Hours Unknown | 100.0% | 71.5% | 91.7% | 100.0% | 96.4% | 69.2% | 80.6% |
| Temporary Workers | 73.5% | 75.3% | 72.3% | 68.3% | 72.5% | 79.0% | 77.7% |
| Temporary Seasonal Workers | 85.0% | 81.4% | 83.6% | 81.2% | 75.6% | 85.0% | 84.6% |
| Temporary Non-seasonal Workers | 63.8% | 70.5% | 64.7% | 60.0% | 70.4% | 74.5% | 73.0% |
| Uncategorized Workers | Not available1 | Not available1 | Not available1 | Not available1 | Not available1 | Not available1 | Not available1 |
| Unemployed Who Have Insurable Employment and a Valid Job Separation | 571,781 | 857,186 | 746,009 | 695,331 | 628,836 | 624,123 | 580,546 |
| Permanent Workers |
340,145 (59.5%) |
546,357 (63.7%) |
432,479 (58.0%) |
362,126 (52.1%) |
340,982 (54.2%) |
336,637 (53.9%) |
285,668 (49.2%) |
| Permanent Full-time Workers | 291,875 (51.0%) |
500,683 (58.4%) |
379,353 (50.9%) |
315,310 (45.3%) |
283,644 (45.1%) |
285,670 (45.8%) |
252,351 (43.5%) |
| Permanent Part-time Workers | 40,245 (7.0%) |
39,258 (4.6%) |
45,333 (6.1%) |
41,389 (6.0%) |
54,532 (8.7%) |
47,979 (7.7%) |
27,169 (4.7%) |
| Permanent Workers, Work Hours Unknown | 8,025 (1.4%) |
6,416 (0.7%) |
7,793 (1.0%) |
5,427 (0.8%) |
2,806 (0.4%) |
2,988 (0.5%) |
6,148 (1.1%) |
| Temporary Workers |
224,874 (39.3%) |
305,501 (35.6%) |
309,077 (41.4%) |
322,551 (46.4%) |
287,099 (45.7%) |
283,634 (45.4%) |
281,376 (48.5%) |
| Temporary Seasonal Workers | 102,482 (17.9%) |
135,904 (15.9%) |
125,186 (16.8%) |
127,081 (18.3%) |
115,569 (18.4%) |
122,082 (19.6%) |
114,468 (19.7%) |
| Temporary Non-seasonal Workers | 122,392 (21.4%) |
169,597 (19.8%) |
183,891 (24.7%) |
195,471 (28.1%) |
171,529 (27.3%) |
161,552 (25.9%) |
166,908 (28.8%) |
| Uncategorized Workers | Not available1 | Not available1 | Not available1 | Not available1 | Not available1 | Not available1 | Not available1 |
- Note: Totals may not add up due to rounding.
- 1 Too unreliable to be published.
- Source: Statistics Canada, Employment Insurance Coverage Survey.
In 2013, the eligibility rate increased to 85.8% from 81.9% in 2012, due to a combination of factors. First, the proportion of unemployed permanent full-time workers—whose eligibility rate was 95.0% in 2013—as a share of unemployed workers with insurable employment and a valid job separation, increased by almost a percentage point (from 45.1% to 45.8%) between 2012 and 2013. Second, the number of unemployed who quit their job to go to school increased from 74,200 in 2012 to a recent high of 93,300 in 2013, representing an increase of 25.7%. As previously indicated, unemployed individuals with an invalid job separation are excluded when calculating eligibility rates and the exclusion of this group reduced the pool of unemployed workers who are less likely to have sufficient hours to be eligible for benefits. Finally, the proportion of unemployed temporary seasonal workers as a share of unemployed workers with insurable employment and a valid job separation increased from 18.4% in 2012 to 19.6% in 2013, while their eligibility rate increased from 75.6% to 85.0%. In 2012, the eligibility rate for temporary seasonal workers was lower than usual but returned to a normal level in 2013.
In 2014, the eligibility rate decreased to 83.1% from 85.8% in 2013, due to multiple reasons. First, the proportion of unemployed permanent full-time workers—whose eligibility rate was 90.1% in 2014—as a share of unemployed workers with insurable employment and a valid job separation, decreased from 45.8% in 2013 to 43.5% in 2014, while their eligibility rate decreased by almost 5 percentage points. Secondly, the proportion of unemployed temporary non-seasonal workers—whose eligibility rate was 74.5% in 2014—as a share of unemployed workers with insurable employment and a valid job separation, increased from 25.9% to 28.8% in 2014, while their eligibility rate decreased by 1.5 percentage points. This group has historically had a lower eligibility rate (60-75%), especially compared to permanent full-time workers (90-95%). Finally, there was a decline to the eligibility rate for permanent part-time workers (-5.2 percentage points, from 71.4% in 2013 to 66.2% in 2014).
As mentioned previously, poor economic conditions can result in a large pool of unemployed workers who have accumulated sufficient hours of insurable employment with a valid job separation, and are thus eligible for EI. As a result, higher eligibility rates tend to prevail during an economic slowdown or recession. However, during periods of economic recovery, the eligibility rates tend to decline, while during periods of more stable economic conditions, the eligibility may remain stable or even increase. This paradox highlights the fact that diverse compositions of the unemployed population accumulate varying degrees of hours of insurable employment from year-to-year, which contribute to fluctuations in eligibility rates, as witnessed over the past few years.
A recent study Footnote 38 using the Canada Out-of-Employment Panel (COEP) Survey showed that individuals’ work patterns influence their likelihood of being eligible for EI regular benefits. The study found that full-time permanent job separators had the highest eligibility rate, which can be attributed to having the highest average number of hours of insurable employment. Non-permanent job separators had the lowest eligibility rate, due to fewer hours worked, on average.
Another recent study Footnote 39 , Footnote 40 was conducted based on the Survey of Labour and Income Dynamics (SLID), in part, to assess the impact of changing working hours on EI eligibility, from 1996 (prior to the January 1997 EI change in the eligibility criteria, from a weeks-based system to an hours-based system) to 2010. The results suggest that, from 1996 to 2010 and among all workers combined, average weekly hours have only changed minimally, fluctuating between 33.5 and 35 hours. The study concluded that the eligibility rate was relatively stable over the past two decades. Due to the differences in hours worked, from 1996 to 2010, full-time workers had a significantly higher eligibility rate compared to those who were not, while youth (aged 16-24) and less educated workers (less than a high school diploma) had lower eligibility rates compared to their older and more educated counterparts.
2.2.2.5 Eligibility for Employment Insurance regular benefits, from records of employment
In addition to the EICS, another source often used to examine the eligibility of individuals for EI regular benefits is the Record of Employments (ROE). A recent evaluation study Footnote 41 was conducted on ROE-Based Measures and EI Eligibility. Footnote 42 The population and methodology used to determine eligibility rates in this ROE study differ from other eligibility measures (e.g. EICS). For example, eligibility rates cited in the ROE study are based on individuals with one or multiple ROEs, regardless if the individuals are unemployed or currently working in another job. In contrast, the EICS eligibility rate is based on the unemployed population that has recently contributed to EI and had a valid job separation. In addition, while the ROE is a form that an employer must issue to an employee leaving a job, regardless of the reason, approximately 30% of job separations have missing ROE forms. As a result, ROE-based eligibility rates may be underestimated since an individual’s complete employment history (i.e. all hours of insurable of employment) is not always taken into consideration, and the rates should be interpreted with caution when compared to other eligibility results, such as the EICS.
In this ROE-based study, the sample was based on 10% of individuals with ROEs submitted between 2001 and 2014. The study examined the percentage of job separators who were laid off due to shortage of work in the previous 52 weeks and who had accumulated enough hours of insurable employment to qualify for EI regular benefits, based on the Variable Entrance Requirement (VER). Based on the VER, individuals living in EI economic regions with high unemployment rates require fewer hours of insurable employment to qualify for benefits than do people in regions with lower unemployment rates.
The study found that regions with high unemployment rates had a larger proportion of job separators with sufficient hours to meet the entrance requirements than did regions with low unemployment rates. In 2014, in regions with an unemployment rate of 13.1% or higher, 83% of job separators with a layoff due to shortage of work accumulated enough hours of work to qualify for EI regular benefits. Conversely, only around 65% of job separators accumulated enough hours of work to qualify for EI regular benefits in regions of lower unemployment (unemployment rate below 8.0%).
In addition, the study determined that 67.1% of all job separators who were laid off due to shortage of work, had enough hours from their combined ROEs to be eligible for EI regular benefits in 2014. From 2001 to 2014, the figure ranged between 67.1% and 72.1%.
2.2.2.6 Eligibility for Employment Insurance regular benefits, among the employed population
A study Footnote 43 , using the Labour Force Survey (LFS), Footnote 44 measured the proportion of employees in Canada who would have had sufficient hours of insurable employment over the qualifying period to meet variable entrance requirements—ranging from 420 to 700 hours Footnote 45 —if all workers had been laid off in the year studied (i.e., during the 12 months of the calendar year).
The LFS-based simulations suggest that 88.5% of individuals who were working as paid employees in 2014 would have been eligible for regular benefits had they lost their job. The LFS-based simulations suggest that the proportion of employed individuals with sufficient hours to claim regular benefits had they lost their job varied only slightly across the country in 2014, ranging from a high of 90.3% in New Brunswick to 86.4% in Alberta. Eligibility rates from the LFS-based simulation are generally higher than those of the EICS because the LFS-based simulation is based on the employed population, which includes participants who likely have more hours of insurable employment compared to the unemployed population.
Men would have had a slightly higher eligibility rate (89.7%) than women (87.2%) had they lost their job in 2014, due to the fact that part-time employment is more common among women. Employed full-time workers would have been eligible to receive regular benefits 93.6% of the time had they lost their job, compared to 61.0% for employed part-time workers. In addition, 91.8% of employed adults (25 to 69 years) would have been eligible to receive regular benefits had they lost their job, compared to 65.5% for youth (19 to 24 years). Employed part-time workers and youth are less likely to qualify for regular benefits because they are less likely to accumulate enough hours of insurable employment over the qualifying period (usually 52 weeks preceding a claim). In addition, employed youth are more likely to be in school, and since they are newer to the labour force, they may face higher entrance requirements (910 hours under the NERE provision Footnote 46 ) to qualify for EI regular benefits.
2.2.3 Accessibility to Employment Insurance regular benefits
This section analyzes the level of access to EI regular benefits by unemployed individuals with valid job separations. Three measures of accessibility are discussed in this section. The first one is the R/S ratio (for receiving/separation), which is calculated by dividing the number of unemployed individuals who received regular benefits (see Chart 17, bar R) in the EICS reference week by the number of unemployed individuals with insurable employment and a valid job separation (see Chart 17, bar S). The second measure is the B/U ratio (for beneficiaries/unemployed) and is calculated by dividing regular beneficiaries in the LFS reference week by the number of the unemployed individuals (see Chart 17, bar U). The last measure is the B/UC ratio (for beneficiaries/unemployed contributors), calculated by dividing the number of regular beneficiaries in the LFS reference week by the number of unemployed EI contributors (see Chart 17, bar UC).
2.2.3.1 Accessibility to Employment Insurance regular benefits: the R/S ratio
The R/S ratio (see Chart 21, R/S) considers the unemployed population who previously worked and contributed to the EI program and had a valid job separation, while other measures of accessibility are based on a broader unemployed population. The 2014 EICS R/S access ratio was 56.7%, which represents a 1.3 percentage point decrease compared to 2013 (58.0%).
It is important to note that access to regular benefits (R/S) can differ from the eligibility rate (E/S) for a number of reasons: not all eligible persons opt to file a claim for benefits; monies paid on separation can delay immediate payment of benefits; claims that have not yet been established and put into pay; the individual worked while on claim Footnote 47 or returned to work full-time; and an individual’s claim was deemed ineligible due to other factors (e.g., on vacation, out of the country, failure to follow direction).
Similar to the eligibility rate, accessibility to EI regular benefits (R/S) varies by demographics, labour market characteristics and province. The R/S ratio ranged from 46.1% in Alberta to 80.6% in Newfoundland and Labrador in 2014. From 2013 to 2014, the largest increase occurred in Saskatchewan, +15.4 percentage points (from 54.2% to 69.6%), while the largest decreases were witnessed in Nova Scotia, -9.1 percentage points (from 72.0% to 62.9%) and Quebec, -8.2 percentage points (from 63.8% to 55.6%).
In 2014, the R/S ratio for women (57.1%) was slightly higher than that for men (56.6%). Adults (25 years and older) (60.5%), seasonal (65.6%) and permanent full-time workers (56.5%) had among the highest accessibility ratios in 2014. Youth (aged 15 to 24 years) and permanent part-time workers had the lowest accessibility ratios, at 26.5% and 31.1%, respectively.
2.2.3.2 Accessibility to Employment Insurance regular benefits: the B/U ratio Footnote 48
Another measure, the beneficiaries-to-unemployed (B/U) ratio, is often used as an indicator of accessibility to the EI program. The B/U ratio differs from the previously mentioned R/S ratio for a few reasons. First, its numerator (B, total regular beneficiaries in the LFS reference week) includes EI beneficiaries who are not unemployed, such as claimants who received both benefits and earnings in a given week. Footnote 49 Second, its denominator (U, all unemployed) includes many people who are outside of the EI program’s parameters for eligibility to regular benefits (e.g., self-employed Footnote 50 and unpaid family workers; individuals who did not pay EI premiums during the last 12 months; individuals who quit their job to go back to school or who quit their jobs for other reasons without just cause). Third, the B/U ratio is derived from two separate sources, as the numerator (B) comes from Statistics Canada’s monthly EI Statistics release, which is derived from EI administrative data and the denominator (U) comes from Statistics Canada’s Employment Insurance Coverage Survey.
As shown in Chart 21, in 2014, the B/U ratio was 38.6%, increasing from 38.4% in 2013. The increase is attributable to the fact that the number of regular beneficiaries (B) decreased in 2014 at a slower rate (-3.4%) compared to the number of unemployed (-4.0%). The recent decline in the B/U ratio (from 51.8% in 2009 to 38.6% in 2014) can be attributed to improving labour market conditions, as the number of regular beneficiaries (B) decreased from 767,900 in 2009 to 486,700 in 2014, representing a decrease of 36.6%. The high number of beneficiaries in 2009 can likely be attributed to a higher number of workers who became unemployed during the recession.
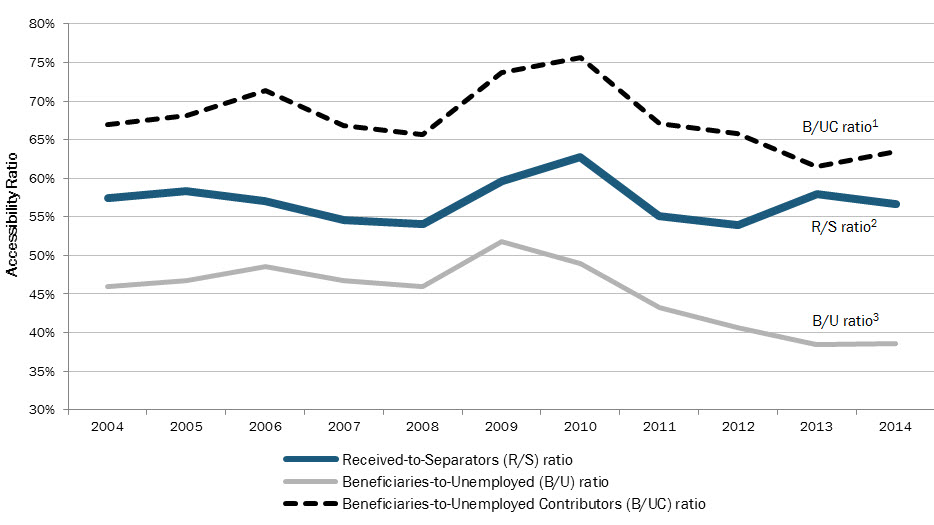
Show Data Table
| 2004 | 2005 | 2006 | 2007 | 2008 | 2009 | 2010 | 2011 | 2012 | 2013 | 2014 | |
|---|---|---|---|---|---|---|---|---|---|---|---|
| Received-to-Separators (R/S) ratio | 57.5% | 58.3% | 57.0% | 54.6% | 54.1% | 59.7% | 62.7% | 55.1% | 53.9% | 58.0% | 56.7% |
| Beneficiaries-to-Unemployed (B/U) ratio | 45.9% | 46.7% | 48.5% | 46.8% | 46.0% | 51.8% | 48.9% | 43.2% | 40.6% | 38.4% | 38.6% |
| Beneficiaries-to-Unemployed Contributors (B/UC) ratio | 67.0% | 68.1% | 71.4% | 66.9% | 65.6% | 73.7% | 75.6% | 67.1% | 65.8% | 61.5% | 63.4% |
- 1 The B/UC ratio is calculated as follows: [number regular beneficiaries ÷ number of unemployed who contributed to the Employment Insurance program].
- 2 The R/S ratio is calculated as follows: [number of individuals who received regular benefits ÷ number of unemployed contributors who had a valid job separation].
- 3 The B/U ratio is calculated as follows: [number of regular beneficiaries ÷ number of unemployed].
- Sources: Statistics Canada, Employment Insurance Coverage Survey (for data on those who received regular benefits (R), unemployed contributors who had a valid job separation (S), the unemployed (U), and unemployed contributors (UC)); and Statistics Canada, monthly Employment Insurance statistics release, CANSIM table 276-0020 (for data on regular beneficiaries (B)).
Other factors, including increases in the proportion of the unemployed who are outside of EI program parameters, can help explain the recent drop in the B/U ratio. As illustrated in Chart 22, 42.2% of the unemployed were outside of EI program parameters in 2009.
Since then, this proportion has increased each year, reaching a high of 53.9% in 2014. For example, the proportion of individuals who quit their job to go to school as a proportion of the total unemployed increased from 5.8% in 2009 to 7.7% in 2014, an increase of 11,000. More striking, the number of individuals who did not work in the previous 12 months as a proportion of the total unemployed population has increased from 24.8% in 2009 to 34.7% in 2014, an increase of 68,600 during this period. By definition, unemployed individuals who did not work in the previous 12 months have not paid EI premiums, and therefore, cannot become a regular beneficiary. It is therefore not surprising that the recent increases in the proportion of unemployed individuals who are outside of the EI program parameters (from 42.2% in 2009 to 53.9% in 2014), have had a large influence on the recent decreases to the B/U ratio.
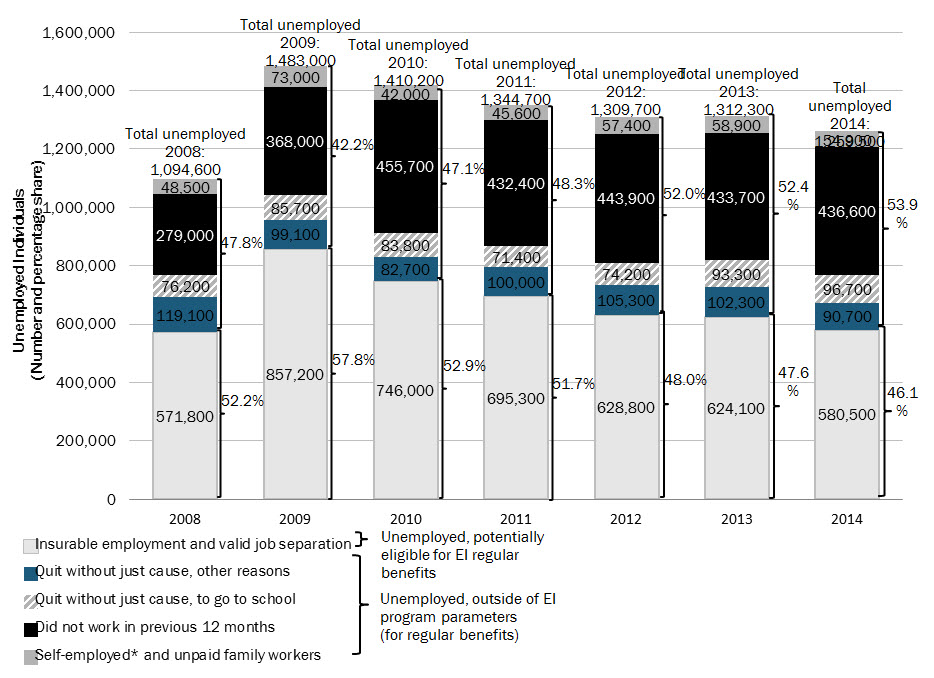
Show Data Table
| 2008 | 2009 | 2010 | 2011 | 2012 | 2013 | 2014 | |
|---|---|---|---|---|---|---|---|
| Total Unemployed | 1,094,600 | 1,483,000 | 1,410,200 | 1,344,700 | 1,309,700 | 1,312,300 | 1,259,500 |
| Self-employed* and unpaid family workers | 48,500 | 73,000 | 42,000 | 45,600 | 57,400 | 58,900 | 54,900 |
| Did not work in previous 12 months | 279,000 | 368,000 | 455,700 | 432,400 | 443,900 | 433,700 | 436,600 |
| Quit without just cause, to go to school | 76,200 | 85,700 | 83,800 | 71,400 | 74,200 | 93,300 | 96,700 |
| Quit without just cause, other reasons | 119,100 | 99,100 | 82,700 | 100,000 | 105,300 | 102,300 | 90,700 |
| Insurable employment and valid job separation | 571,800 | 857,200 | 746,000 | 695,300 | 628,800 | 624,100 | 580,500 |
| Unemployed, outside of EI program parameters (for regular benefits) | 47.8% | 42.2% | 47.1% | 48.3% | 52.0% | 52.4% | 53.9% |
| Unemployed, potentially eligible for EI regular benefits | 52.2% | 57.8% | 52.9% | 51.7% | 48.0% | 47.6% | 46.1% |
- Note: Totals may not add up due to rounding.
- * Self-employed individuals can opt in and subsequently pay EI premiums for special benefits (see chapter II, section 4), but they are not eligible for regular benefits.
- Source: Statistics Canada, Employment Insurance Coverage Survey.
2.2.3.3 Accessibility to Employment Insurance regular benefits: the B/UC ratio Footnote 51
A third measure, the beneficiaries-to-unemployed contributors (B/UC) ratio, is a modification of the B/U ratio in which the total number of unemployed individuals is replaced by the number of unemployed individuals who had paid EI premiums in the previous 12 months. The B/UC ratio’s denominator includes all unemployed individuals who paid premiums, which comprises individuals who had either i) a valid job separation, or ii) an invalid job separation (e.g., those who quit their job to return to school or quit for other reasons without a just cause).
The B/UC ratio reached a recent high of 75.6% in 2010, then decreased each year until 2013 (61.5%), before increasing in 2014 (63.4%). The increase in the 2014 B/UC ratio (+1.9 percentage point) is attributed to the fact that the decrease in beneficiaries (-3.4%) was outpaced by the decrease in unemployed contributors (-4.0%).
2.3 Level of Employment Insurance regular benefits
The level of EI regular benefits (i.e., the weekly regular benefit rate) that an EI claimant is entitled to receive is calculated by taking 55% of their highest (best) weeks of insurable earnings in the 52-week qualifying period before their claim is established (or the time since the start of their last claim, whichever is shorter) up to the maximum weekly benefit rate. Under the Employment Insurance Act, the maximum weekly benefit rate that an EI claimant is entitled to receive is directly linked to the maximum insurable earnings threshold (MIE). Footnote 52 The MIE is the income level up to which EI premiums are paid and reflects average weekly earnings from the year before (AWE). Footnote 53 The MIE was $47,400 in 2013, $48,600 in 2014, and $49,500 in 2015. Accordingly, the maximum weekly benefit was $501 in 2013, $514 in 2014 and $524 in 2015.
The calculation of the weekly benefit rate has gone through a number of transformations over the past 10 years which has enabled the EI program to become more responsive to changes in the local labour market. Up until November 2005, the weekly benefit rate was calculated using insurable earnings in the 26-week period before the establishment of a claim. During that period, weeks with relatively low insurable earnings could be excluded from the calculation, provided that the number of weeks of earnings exceeds the minimum divisor (through the Small Weeks Provision). The objective was to encourage EI claimants to accept all available work by excluding weeks of insurable earnings below $225 Footnote 54 which otherwise would reduce the weekly benefit rate on a future EI claim. In November 2005, the Best 14 Weeks (B14) pilot project replaced the Small Weeks provision in 23 EI economic regions of high unemployment. The B14 pilot project tested whether basing claimants’ benefits on their 14 best weeks of highest earnings in their qualifying period, which is generally 52 weeks preceding their claim, encouraged claimants to accept all available jobs. In 2008, the B14 pilot project parameters were renewed and extended to 25 EI economic regions until April 6, 2013.
On April 7, 2013, the newly legislated Variable Best Weeks (VBW) provision came into effect and was applied nationally to all EI economic regions. Under the VBW provision, the weekly benefit rate is calculated based on an EI claimant’s highest (best) weeks of insurable earnings during the qualifying period. The number of weeks used to calculate the weekly benefit ranges from 14 to 22, depending on the monthly regional unemployment rate. Footnote 55 A more detailed analysis of VBW can be found in Section 2.3.2.
The average weekly regular benefit rate in 2014/2015 was $434, representing a modest increase of 3.6% when compared to 2013/2014 ($419). The 3.6% growth experienced in 2014/2015 was lower than the 5.8% increase in 2013/2014, but similar to increases in 2011/2012 and 2012/2013 (3.5% and 3.1% respectively). When excluding the peak years around the 2008 recession (2009/2010 and 2010/2011), the growth in the average weekly regular benefit rate has been consistently above 3.0% since 2006/2007. The growth rate in 2009/2010 and 2010/2011 was only 0.8% and 1.1% respectively, due to weaker growth in average weekly earnings. The recent moderate growth since 2011/2012 can be attributable to the recovery of the 2008 recession and changes to the EI program (see Chart 23). As indicated below, in 2014/2015 the average weekly regular benefit rate grew by 3.6% which is significantly higher than the growth in the maximum weekly benefit rate in 2014 (+2.5%) and 2015 (+1.9%). A more detailed analysis on the impact of VBW can be found in Section 2.3.2.
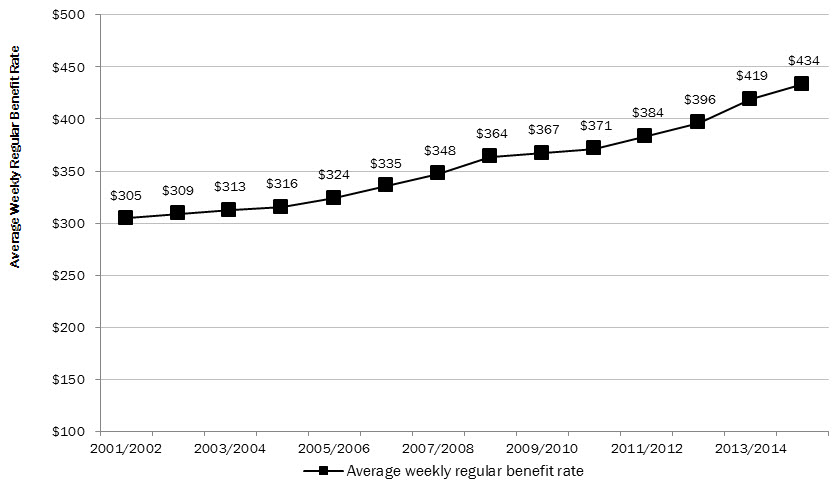
Show Data Table
| Average Weekly Regular Benefit Rate ($) | |
|---|---|
| 2001/2002 | 305 |
| 2002/2003 | 309 |
| 2003/2004 | 313 |
| 2004/2005 | 316 |
| 2005/2006 | 324 |
| 2006/2007 | 335 |
| 2007/2008 | 348 |
| 2008/2009 | 364 |
| 2009/2010 | 367 |
| 2010/2011 | 371 |
| 2011/2012 | 384 |
| 2012/2013 | 396 |
| 2013/2014 | 419 |
| 2014/2015 | 434 |
- Source: ESDC, Employment Insurance (EI) administrative data. Data are based on a 10% sample of EI administrative data.
2.3.1 Level of Employment Insurance regular benefits by province and territory, gender, age and Employment Insurance claimant category
The level of average EI weekly regular benefits fluctuates by province and territory, with Western provinces having, on average, a higher average weekly regular benefit rate than the rest of Canada in 2014/2015. Chart 24 shows that the average weekly regular benefit rate was highest for the Northwest Territories ($498) and lowest in Prince Edward Island ($407), representing a $91 difference.
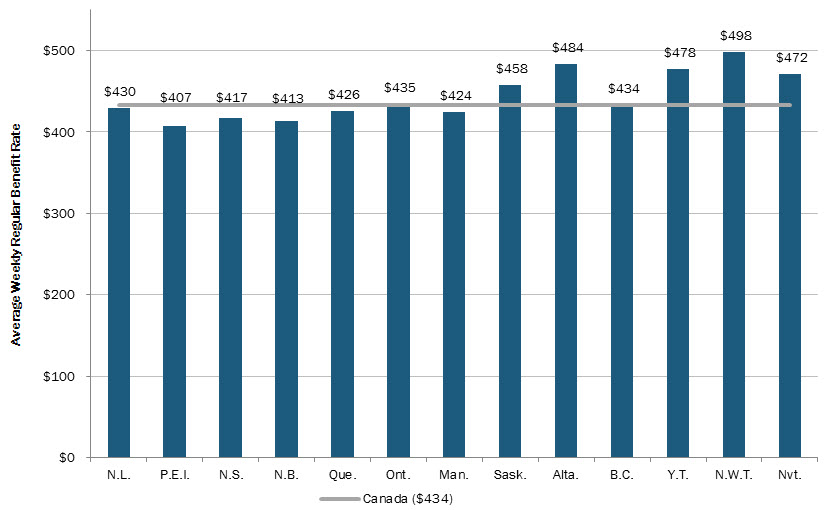
Show Data Table
| Average Weekly Regular Benefit Rate ($), 2014/2015 | |
|---|---|
| N.L. | 430 |
| P.E.I. | 407 |
| N.S. | 417 |
| N.B. | 413 |
| Que. | 426 |
| Ont. | 435 |
| Man. | 424 |
| Sask. | 458 |
| Alta. | 484 |
| B.C. | 434 |
| Y.T. | 478 |
| N.W.T. | 498 |
| Nvt. | 472 |
| Canada | 434 |
- Source: ESDC, Employment Insurance (EI) administrative data. Data are based on a 10% sample of EI administrative data.
Lower earnings is a contributing factor to provinces having an average weekly regular benefit rate that is below the national average. The weekly benefit rate is calculated based on an EI claimant’s weekly insurable earnings, so lower earnings would result in a lower weekly benefit rate. Analysis shows that out of 13 provinces and territories, six had average weekly earnings that were under the national average (Prince Edward Island, Nova Scotia, New Brunswick, Quebec, Manitoba, British Columbia), while seven were over (Newfoundland and Labrador, Ontario, Saskatchewan, Alberta, Nunavut, Northwest Territories and Yukon). When comparing average weekly regular benefit rate to average weekly earnings, the data show that all of the provinces that had an average weekly benefit rate below the national average also had average weekly earnings below the national average, except Newfoundland and Labrador.
Year-over-year analysis in Chart 25 shows that EI regular claims from the provinces of Saskatchewan (+5.3%), Alberta (+4.8%) and Nova Scotia (+4.3%) experienced the largest increase in their average weekly regular benefit rate, while EI regular claims from Yukon (+0.2%) had the lowest increase.
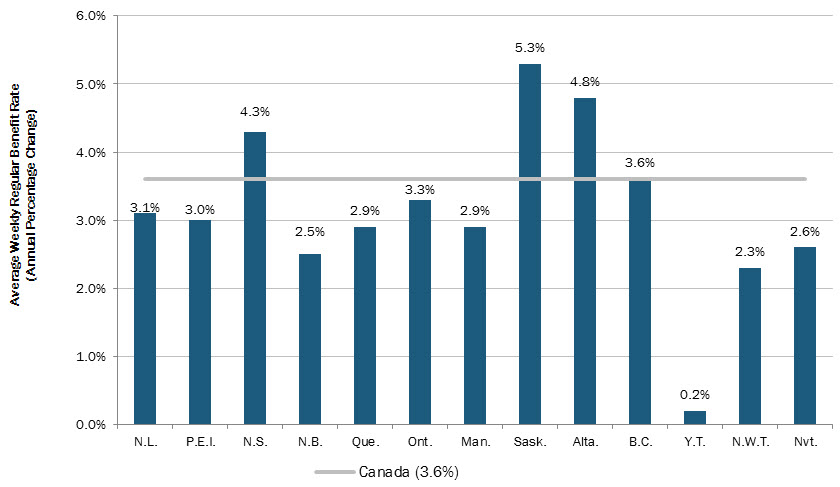
Show Data Table
| Average Weekly Regular Benefit Rate (Annual Percentage Change), 2013/2014 to 2014/2015 | |
|---|---|
| N.L. | 3.1% |
| P.E.I. | 3.0% |
| N.S. | 4.3% |
| N.B. | 2.5% |
| Que. | 2.9% |
| Ont. | 3.3% |
| Man. | 2.9% |
| Sask. | 5.3% |
| Alta. | 4.8% |
| B.C. | 3.6% |
| Y.T. | 0.2% |
| N.W.T. | 2.3% |
| Nvt. | 2.6% |
| Canada | 3.6% |
- Source: ESDC, Employment Insurance (EI) administrative data. Data are based on a 10% sample of EI administrative data.
Using a breakdown by age, Table 18 indicates that the average weekly regular benefit rate was the highest for EI regular claimants aged between 25 and 44 years old ($445) in 2014/2015 and lowest for those who were less than 25 years old ($405). The increase in the average weekly regular benefit rate from 2013/2014 to 2014/2015 was similar across all age groups, with EI regular claimants who were under 25 years old experiencing the highest increase in their weekly regular benefit rate (4.1%, or $16) and those aged 55 years and older experiencing the smallest increase of (3.2%, or $13).
| Average Weekly Regular Benefit Rate | ||||||
|---|---|---|---|---|---|---|
| Age | Men ($) 2013/2014 |
Women ($) 2013/2014 |
Total ($) 2013/2014 |
Men ($) 2014/2015 |
Women ($) 2014/2015 |
Total ($) 2014/2015 |
| 24 years and under | 405 | 342 | 389 | 422 | 354 | 405 |
| 25 to 44 years | 451 | 397 | 430 | 466 | 410 | 445 |
| 45 to 54 years | 455 | 383 | 423 | 470 | 397 | 437 |
| 55 years and older | 436 | 361 | 407 | 448 | 375 | 420 |
| Canada | 443 | 382 | 419 | 458 | 395 | 434 |
- Note: Totals may not add up due to rounding.
- Source: ESDC, Employment Insurance (EI) administrative data. Data are based on a 10% sample of EI administrative data.
Table 18 also demonstrates that men tend to have a higher average weekly regular benefit rate than women. In 2014/2015, the average weekly regular benefit rate for men was $458 compared to $395 for women, a difference of $63. When comparing 2014/2015 to 2013/2014, the average weekly regular benefit rate experienced growth at roughly the same rate for men as for women (3.4% vs. 3.3%). In 2013/2014 and 2014/2015, among men, those aged between 45 and 54 years old had the highest average weekly regular benefit rate, while women between the ages of 25 and 44 had the highest average weekly regular benefit rate.
By EI claimant category, long-tenured workers had an average weekly regular benefit rate of $472 in 2014/2015. In contrast, occasional claimants had an average weekly regular benefit rate of $420, while frequent claimants had an average weekly regular benefit rate of $436 in 2014/2015 (see Table 19). A claimant’s history of collecting benefits has an impact on the likelihood that he or she will receive the maximum weekly benefit, as individuals who are less likely to use the program (e.g., long-tenured workers) tend to have stronger labour force attachment and higher earnings. In 2014/2015, 65% of long-tenured workers and 47% of frequent claimants who had an EI claim established were entitled to the maximum weekly benefit rate, in contrast to only 42% of occasional claimants. While occasional workers had the lowest average weekly benefit in 2014/2015, they experienced the highest increase in their average weekly benefit when compared to 2013/2014 (+4.1%). Long-tenured workers were second with an increase of +3.8%, while frequent claimants experienced a below average increase of +2.5%.
| EI Claimant Category1 | Average Weekly Regular Benefit ($) |
Change (%) |
EI Claimants who are Entitled to the Maximum Weekly Benefit (%) |
Average Number of Weeks Used for Weekly Benefit Calculation (Weeks) |
|
|---|---|---|---|---|---|
| 2013/2014 | 2014/2015 | 2013/2014—2014/2015 | 2014/2015 | 2014/2015 | |
| Long-tenured Workers | 454 | 472 | 4.0 | 65 | 20 |
| Occasional Claimants | 403 | 420 | 4.2 | 42 | 19 |
| Frequent Claimants | 425 | 436 | 2.6 | 47 | 17 |
| Canada | 419 | 434 | 3.6 | 47 | 19 |
- 1 Long-tenured workers are Employment Insurance (EI) claimants who have paid at least 30% of the maximum annual EI premiums for 7 of the past 10 years and who, over the last 5 years, have collected EI regular or fishing benefits for 35 weeks or less. Frequent claimants are EI claimants who have had three or more claims for EI regular or fishing benefits and have collected benefits for a total of more than 60 weeks in the past 5 years. Occasional claimants are EI claimants who do not meet the requirements for either long-tenured workers or frequent claimants. Note: Totals may not add up due to rounding.
- Note: Totals may not add up due to rounding
- Source: ESDC, Employment Insurance (EI) administrative data. Data are based on a 10% sample of EI administrative data.
2.3.2 Variable best weeks provision
The VBW provision was introduced into all EI economic regions on April 7, 2013, which saw the implementation of a national method to calculate the weekly benefit rate for EI claimants based on their highest (best) weeks of insurable earnings. The number of weeks used to calculate the weekly benefit under VBW varies from 14 to 22 weeks (See Table 20). For 33 EI economic regions, the VBW provision replaced the Small Weeks provision, while it replaced the B14 pilot project for the remaining 25 EI economic regions. Under the previous legislation (i.e., Small Weeks), the calculation of the weekly benefit rate potentially discouraged individuals from working lower-earning weeks as the calculation of the weekly benefit took into account all weeks of earnings over the past 26 weeks above the $225 threshold. Due to this calculation method of the weekly benefit rate, it was not always beneficial for EI claimants to work lower-earning weeks as their weekly benefit rate for their following EI claim may be reduced. By allowing individuals to choose their highest weeks of earnings, the EI program encourages individuals to accept more work and develop stronger labour force attachment. Given that the VBW provision has been in place for over two years, there are considerable data to analyze the impact that the provision has had on former B14 pilot and non-pilot regions. Section 2.3.2.1 will examine the impact that the VBW provision has had on the EI economic regions.
| Regional Rate of Unemployment | Number of Weeks |
|---|---|
| 6% or less | 22 |
| 6.1% to 7% | 21 |
| 7.1% to 8% | 20 |
| 8.1% to 9% | 19 |
| 9.1% to 10% | 18 |
| 10.1% to 11% | 17 |
| 11.1% to 12% | 16 |
| 12.1% to 13% | 15 |
| 13.1% or More | 14 |
- Source: The Employment Insurance Act, Section 14.
2.3.2.1 The impact of the variable best weeks provision on the Employment Insurance economic regions
The proportion of regular claims established in the 25 former B14 pilot regions remained consistant at 37% in Canada in 2014/2015. Since 2012/2013, 9 of the 25 former B14 pilot regions, on average, continued to have an unemployment rate of 13.1% or greater, which has resulted in no change in the number of best weeks used to calculate their weekly regular benefit rate (i.e., they continued to use 14 weeks). However, since the introduction of the VBW provision, 16 regions experienced an increase in the number of best weeks used to calculate their weekly benefit rate as their local labour market improved. As of 2014/2015, one region experienced an increase of one to two weeks, ten regions experienced an increase of three to five weeks, and five regions experienced an increase of six weeks or more. Footnote 56
Due to the fact that the VBW provision changed how the weekly benefit rate was calculated, a key metric to assess the relative impact of the VBW provision is the average weekly regular benefit rate. The average weekly regular benefit rate of former B14 pilot regions continued to rise in 2014/2015, and converged with that of non-pilot regions. The convergence of the average weekly regular benefit rate between former pilot and non-pilot regions is consistent with the objective of enhancing fairness in calculating the weekly benefit under the VBW provision (see Chart 26). In 2014/2015, in former B14 pilot regions, the average weekly regular benefit rate increased by $15 to $431, up almost a full percentage point over the year before (3.6% vs. 2.5%). This growth in the average weekly benefit rate in former B14 pilot regions is slightly higher than the growth in the MIE in 2014 (2.5%), suggesting that the average impacts of changing from B14 to VBW were minimal in these regions. Analysis suggests that the majority of claims established in former B14 pilot regions in 2014/2015 (75%) would have encountered no change in their weekly benefit if the B14 calculation methods were still in place. The negative impacts associated with changing from the B14 to VBW were limited for other claims established in former B14 pilot regions. Of those claims that were negatively impacted, the weekly regular benefit rate in former B14 pilot regions would have been approximately $15 higher (or 3.5%), on average, than what they received under the VBW calculation method.

Show Data Table
| Average Weekly Regular Benefit Rate ($) | ||
|---|---|---|
| Former Best 14 Pilot Regions | Former Non-pilot Regions | |
| 2009/2010 | 374 | 365 |
| 2010/2011 | 377 | 367 |
| 2011/2012 | 392 | 379 |
| 2012/2013 | 406 | 391 |
| 2013/2014 | 416 | 421 |
| 2014/2015 | 431 | 436 |
- Source: ESDC, Employment Insurance (EI) administrative data. Data are based on a 10% sample of EI administrative data.
As expected, the average weekly regular benefit rate grew more significantly in former non-pilot regions since the VBW provision came into effect in April 2013; specifically, in 2013/2014, the fiscal year following the introduction of VBW, the average weekly regular benefit rate in former non-pilot regions increased by 7.8% (see Chart 27). This is a growth rate that is almost three times as large as that experienced in former pilot regions over the same period. This is mainly due to the fact that claimants in former non-pilot regions are now able to use their best weeks from the 52 weeks preceding the claim to calculate their weekly benefit. By contrast, before the VBW provision came into effect, their weekly benefit rate was determined by dividing their insurable earnings accumulated during the 26-week period before the establishment of the claim by the greater of the number of weeks the claimant worked in this period or the minimum divisor, which varied between 14 and 22 depending on the monthly regional unemployment rate. The VBW calculation method benefits those who have inconsistent work patterns (i.e., weeks of low earnings and weeks of high earnings) as these EI claimants are now able to exclude weeks with lower earnings or no earnings from the calculation of their weekly benefit. In 2014/2015 the growth rate of the average weekly benefit rate in former non-pilot regions resembled that of former pilot regions, at roughly 3.0%, which is marginally higher than the growth in the MIE in 2014 (2.5%).
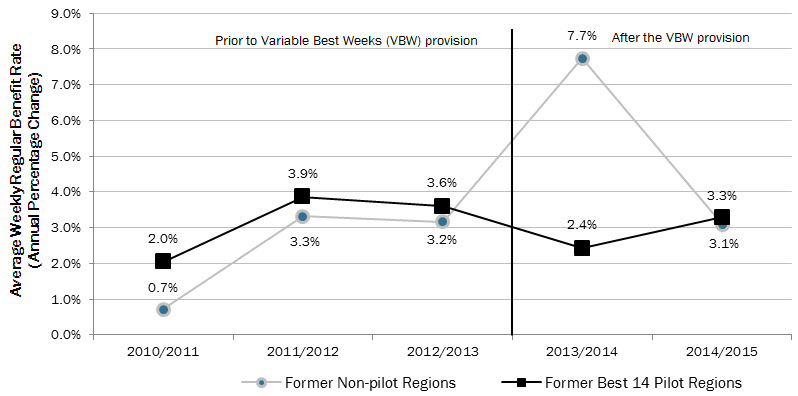
Show Data Table
| Growth in the Average Weekly Regular Benefit Rate ($) | ||
|---|---|---|
| Formet Best 14 Pilot Regions | Former Non-pilot Regions | |
| 2010/2011 | 2.0% | 0.7% |
| 2011/2012 | 3.9% | 3.3% |
| 2012/2013 | 3.6% | 3.2% |
| 2013/2014 | 2.4% | 7.7% |
| 2014/2015 | 3.3% | 3.1% |
- Source: ESDC, Employment Insurance (EI) administrative data. Data are based on a 10% sample of EI administrative data.
As shown in Table 21, when former B14 pilot regions are broken down by the change in the number of best weeks from 2012/2013 to 2014/2015, very little difference is present between the groupings for the change in the best weeks in regards to the average weekly regular benefit rate. The difference among the groupings was more important in the year after the implementation of the VBW provision (i.e., 2012/2013 vs. 2013/2014). For the most part, regions experiencing a change in the best weeks saw an increase in their weekly regular benefit rate similar to the growth in the MIE over the same time (5.5%). All 25 former pilot regions experienced growth in their average weekly regular benefit rate from 2012/2013 to 2014/2015. Table 21 shows, however, that as the change in the number of best weeks increases, the percentage change in the average weekly regular benefit rate decreases. For example, regions that did not experience a change in the number of best weeks saw their average weekly regular benefit rate increase by 7.0%, while regions with an increase of 6 or more weeks experienced an increase of 4.3% in their average weekly regular benefit rate.
| Change in Best Weeks by EI Economic Region | Insurable Hours | Weekly Regular Benefit Rate | ||||||||
|---|---|---|---|---|---|---|---|---|---|---|
| 2012/2013 | 2013/2014 | 2014/2015 | Change (2012/2013 - 2014/2015) | 2012/2013 | 2013/2014 | 2014/2015 | Change (2012/2013 - 2014/2015) | |||
| (hrs) | (%) | ($) | (%) | |||||||
| Zero Weeks | 1,147 | 1,175 | 1,174 | 27 | 2.4 | 401 | 417 | 429 | 28 | 7 |
| Newfoundland-Labrador | 1,124 | 1,165 | 1,151 | 27 | 2.4 | 397 | 414 | 426 | 29 | 7.3 |
| Eastern Nova Scotia | 1,140 | 1,147 | 1,173 | 33 | 2.9 | 394 | 413 | 432 | 38 | 9.6 |
| Restigouche-Albert | 1,139 | 1,163 | 1,159 | 20 | 1.8 | 397 | 412 | 421 | 24 | 6 |
| Gaspésie-Iles-de-la-Madeleine | 1,106 | 1,145 | 1,126 | 20 | 1.8 | 404 | 421 | 430 | 26 | 6.4 |
| Northern Manitoba | 1,262 | 1,278 | 1,268 | 6 | 0.5 | 396 | 409 | 418 | 22 | 5.6 |
| Northern Saskatchewan | 1,299 | 1,293 | 1,321 | 22 | 1.7 | 421 | 432 | 453 | 32 | 7.6 |
| Yukon | 1,224 | 1,270 | 1,297 | 73 | 6 | 457 | 477 | 476 | 19 | 4.2 |
| Northwest Territories | 1,273 | 1,319 | 1,393 | 120 | 9.4 | 463 | 487 | 492 | 29 | 6.3 |
| Nunavut | 1,189 | 1,244 | 1,218 | 29 | 2.4 | 462 | 460 | 464 | 2 | 0.4 |
| One to two weeks | 1,324 | 1,326 | 1,316 | -8 | -0.6 | 415 | 429 | 439 | 24 | 5.8 |
| Northern Ontario | 1,324 | 1,326 | 1,316 | -8 | -0.6 | 415 | 429 | 439 | 24 | 5.8 |
| Three to five weeks | 1,301 | 1,306 | 1,333 | 32 | 2.5 | 407 | 414 | 431 | 24 | 5.7 |
| Prince Edward Island | 1,198 | 1,214 | 1,243 | 45 | 3.8 | 389 | 395 | 407 | 18 | 4.6 |
| Western Nova Scotia | 1,285 | 1,270 | 1,289 | 4 | 0.3 | 382 | 388 | 405 | 23 | 6 |
| Madawaska-Charlotte | 1,248 | 1,259 | 1,267 | 19 | 1.5 | 383 | 391 | 399 | 16 | 4.2 |
| Northwester Quebec | 1,281 | 1,287 | 1,303 | 22 | 1.7 | 419 | 422 | 437 | 18 | 4.3 |
| Lower St. Lawrence | 1,281 | 1,292 | 1,281 | 0 | 0 | 414 | 422 | 429 | 15 | 3.6 |
| Chicoutimi-Jonquiere | 1,324 | 1,322 | 1,309 | -15 | -1.1 | 410 | 413 | 427 | 17 | 4.1 |
| Niagara | 1,388 | 1,415 | 1,407 | 19 | 1.4 | 405 | 415 | 433 | 28 | 6.9 |
| Windsor | 1,409 | 1,413 | 1,536 | 127 | 9 | 408 | 408 | 456 | 48 | 11.8 |
| Northern Alberta | 1,433 | 1,457 | 1,494 | 61 | 4.3 | 451 | 465 | 490 | 39 | 8.6 |
| Northern British Columbia | 1,407 | 1,321 | 1,387 | 51 | 3.8 | 432 | 444 | 462 | 30 | 6.9 |
| Six weeks or more | 1,354 | 1,366 | 1,370 | 16 | 1.2 | 408 | 413 | 426 | 18 | 4.3 |
| St. John’s | 1,407 | 1,452 | 1,442 | 35 | 2.5 | 422 | 434 | 447 | 25 | 5.9 |
| Trois-Rivières | 1,333 | 1,336 | 1,356 | 23 | 1.7 | 411 | 409 | 418 | 7 | 1.7 |
| Central Quebec | 1,333 | 1,333 | 1,339 | 6 | 0.5 | 404 | 407 | 419 | 15 | 3.7 |
| Oshawa | 1,420 | 1,482 | 1,465 | 45 | 3.2 | 422 | 432 | 454 | 32 | 7.6 |
| Huron | 1,403 | 1,395 | 1,411 | 8 | 0.6 | 412 | 420 | 431 | 19 | 4.6 |
| All Pilot Regions | 1,270 | 1,283 | 1,290 | 20 | 1.6 | 406 | 416 | 431 | 25 | 6.1 |
- Source: ESDC, Employment Insurance (EI) administrative data. Data are based on a 10% sample of EI administrative data.
The introduction of the VBW provision has not resulted in a significant change in insurable hours of work accumulated before the termination of employment. Indeed, claimants in former B14 pilot regions had worked on average 1,287 hours in 2014/2015, which represented an increase of only 17 hours (or 1.3%) compared to 2012/2013.
Overall, the minimal effect of the VBW provision on insurable hours is a result of the fact that the majority of claimants (greater than 90%) qualify for EI with more than 700 insurable hours, indicating that the majority of individuals had substantial insurable employment prior to the introduction of the VBW provision.
2.3.3 Working while on claim pilot projects Footnote 57
The purpose of the Working While on Claim (WWC) provision is to encourage work attachment by allowing claimants to accept available work while receiving EI benefits. Prior to the introduction of the WWC provision in 1997, all employment earnings earned while receiving Employment Insurance (EI) benefits were deducted dollar for dollar from the claimant’s weekly EI benefit. Under the WWC provision, claimants may earn employment income, up until a specified earnings threshold, with reduced or no deductions in employment insurance benefits. The specific earnings threshold is determined by the legislation or pilot project prevailing at the time. Above this threshold, earnings are again deducted dollar for dollar from the claimant’s weekly EI benefit. If a claimant’s weekly benefit is reduced to zero, that week of entitlement may be deferred for later use within the same benefit period, which generally ends 52 weeks from the start of the claim. The WWC provision currently applies to regular, fishing, parental, compassionate care benefits and parents of critically ill children.
For the past eight years, working while on claim has been governed by several pilot projects, each of which amended the WWC earnings threshold and benefit reductions, set forth in the legislation under the Employment Insurance Act and the Employment Insurance Regulations. Under legislation, which was last in effect in December 2008, claimants could earn the greater of 25% of their weekly EI benefit or $50 without any reduction in their weekly benefit, after which their benefits were reduced dollar for dollar.
2.3.3.1 Working while on claim pilot projects Footnote 58
The first WWC pilot project (Pilot Project 8) was introduced in 23 EI Economic Regions on December 11, 2005 and ran until December 6, 2008. The purpose was to test whether allowing Employment Insurance (EI) claimants to earn more income while claiming EI benefits would encourage them to accept more available work while receiving EI benefits. Under this WWC pilot, the amount EI claimants could earn while on claim without a reduction in their benefits, was increased to the greater of $75 or 40% of their weekly benefit, with benefits reduced dollar for dollar beyond this threshold. EI claimants not in the 23 EI Economic Regions continued to be subject to an allowable earnings threshold of $50 or 25% of their weekly EI benefit based on the WWC provision in the Employment Insurance Act.
The pilot project was re-introduced (Pilot Project 12) on December 7, 2008 on a national level (in all EI economic regions) and ran until August 6, 2011. Budget 2011 announced a new pilot (Pilot Project 17) under the same parameters of the previous pilot to assess the effectiveness of the pilot during a period of economic recovery and a full economic cycle. This pilot began on August 7, 2011, and ran until August 4, 2012.
As part of the Budget 2012, a new national WWC pilot project (Pilot Project 18) was introduced on August 5, 2012. Under this new WWC pilot project, a claimant’s benefits are reduced by 50% of his or her earnings while on claim, starting with the first dollar earned, until the claimant's earnings reach 90% of the average weekly earnings used to establish his or her weekly benefit rate. At that point, the claimant’s benefits are reduced dollar for dollar, to ensure claimants do not receive more in earnings and benefits than they would have earned working full time. This pilot concluded on August 1, 2015, and was replaced by Pilot Project 19, which kept the same provisions as Pilot Project 18.
A key difference between the Pilot Project 17 and Pilot Project 18 provisions is in the total income (EI benefits and employment income) claimants earn at different earnings levels: for lower earnings, generally two days of work or less (80% of the benefit rate), Pilot Project 17 provides more total income; however, for higher earnings Pilot Project 18 provides more total income. After the new WWC Pilot Project 18 began, some claimants indicated they could not find additional work beyond approximately one day per week and they were experiencing difficulty transitioning to the new pilot rules. As a result, eligible EI claimants who had earnings while on claim between August 7, 2011, and August 4, 2012, and were covered by the provisions of the previous WWC pilot project (Pilot Project 17), have the option to revert to the rules of the previous WWC pilot project. Once a claimant reverts, the Pilot Project 17 rules apply for the duration of the claim or until August 2016 (i.e. when Pilot Project 19 is set to expire), whichever is earlier. So long as claimants have chosen to revert in all previous claims, they are given the opportunity to revert on subsequent claims. However, once a claimant does not revert, they no longer have the option to revert.
The option to revert was operational on January 6th, 2013. As of March 31, 2015, a total of 19,144 claims had reverted. The number of claims that reverted peaked during the first month, followed by an immediate and significant decline, before finally it leveled off at this lower level. Of all claims that reverted to the parameters of the previous WWC pilot (earnings allowance of $75 or 40% of benefits), over 90% were located in Atlantic Canada and Quebec. According to internal estimates, the provincial breakdown is as follows: Newfoundland 11%, Nova Scotia 7%, New Brunswick 15%, Prince Edward Island 5%, Quebec 53%, Ontario 6 %, and British Columbia 1%; all other provinces and territories were below 1%. Footnote 59
As of March 31, 2015 only 12,029 claimants had taken advantage of the option to revert, out of a pool of 773,778 who had the opportunity – namely those who had earnings between August 7, 2011, and August 4, 2012. It should be noted that this pool of claimants who are considered to have had the opportunity to revert includes a large number of claimants who had earnings while on claim during the August 2011 to August 2012 period, but have not actually claimed during the Pilot Project 18 or 19 period, and therefore cannot technically be considered reverters. Nevertheless, the low number of reversions seems to indicate that many claimants were either indifferent or found the new WWC provisions beneficial. Findings from a focus group study in 2014, Footnote 60 , Footnote 61 however, would suggest that some claimants did not clearly understand the new WWC provisions and the option to revert. For instance, while 70% of respondents to a telephone questionnaire claimed they were aware of the new WWC provisions, some of these were found to have only a vague understanding of the actual changes that had been introduced. In addition, just over 10% of telephone respondents who were eligible to revert were aware of the option to revert. However, some of these respondents who claimed awareness of the option to revert did not think they were eligible when in fact they were, demonstrating a lack of true understanding. These misperceptions suggest that the low rate of reversion may not be entirely driven by claimants’ preferences but may reflect a lack of understanding.
2.3.3.2 Claims utilizing working while on claim provision Footnote 62
This section examines the regular claims established in fiscal year 2013/2014 that worked while on claim at least once, regardless of the amount of time worked during the claim and who these claimants worked for. The analysis in this section (2.3.3.2) focuses on completed claims only, and therefore is delayed one year (to 2013/2014). The extent or intensity to which regular claimants worked while on claim is analyzed in the next section (2.3.3.3).
EI administrative data indicate that among all EI regular claims established in 2013/2014, a total of 691,870 involved at least one week worked while on claim, which represented 51% of all regular claims established that year (see Table 22). On average, these claims worked 11.6 weeks while on claim. The total number and proportion of those who worked while on claim have been following a downward trend since 2009/2010, when a high of 926,560 regular claims involved worked while on claim. This downward trend is analyzed at the end of section 2.3.3.3.
| 2009/2010 | 2010/2011 | 2011/2012 | 2012/2013 | 2013/2014 | |
|---|---|---|---|---|---|
| Portion of Claims with at least one Week Worked While on Claim | 56% | 56% | 55% | 52% | 51% |
| Average Number of Weeks Worked | 12.9 | 12.8 | 13.9 | 11.9 | 11.6 |
- Source: ESDC, Employment Insurance (EI) administrative data. Data are based on a 10% sample of EI administrative data.
The proportion of regular claims with at least one week worked while on claim varies according to industry and age. The Educational Services industry had the highest proportion of working claimants in 2013/2014 at 60% of regular claims, followed by Construction at 58%. Conversely, Finance and Insurance had the lowest proportion of working claimants at just 33% of regular claims. The high number of working claimants in the Educational Services and Construction industries reflects the seasonality of these industries, a characteristic often related with working while on claim (as discussed in the subsequent paragraph). Older workers (55 years and older) who established a regular claim in 2013/2014 were the least likely to have worked at least one week while on claim, with an incidence of just 39%. This compares to 55% for those aged under 55 years old. Despite noteworthy variation by the above socio-demographic characteristics, working while on claim varied little by gender: the proportion of men receiving regular benefits who took advantage of the WWC provision was 50%, very similar to that of women at 53%.
Regions also diverged significantly with respect to their proportion of claims with at least one week worked. Among regular claims established in the Atlantic provinces in 2013/2014, 60% involved working while on claim, as did 59% of EI regular claims established in Quebec. In the rest of Canada, just 44% of regular claims established in 2013/2014 involved working while on claim. This regional variability in the frequency of working while on claim could be influenced by a number of factors, including the Atlantic province and Quebec’s above average proportion of seasonal Footnote 63 and frequent claimants, as well as higher average unemployment rates Footnote 64 -- characteristics that are associated with higher rates of working while on claim. Specifically, across Canada, the proportion of seasonal workers who have at least one week worked while on claim was 60%, compared to non-seasonal workers with 47%. Similarly, claims made by frequent claimants included working while on claim in 60% of regular claims across Canada, compared to only 48% and 49% for claims made by long-tenured workers and occasional claimants, respectively. Finally, in 2013/2014, among EI economic regions with unemployment rates of 10.0% or lower, 49% of regular claims involved working while on claim, while among regions with unemployment rates higher than 10.0%, 60% of regular claims involved working while on claim.
For regular claims established in 2013/2014 involving work while on claim, the average actual duration was 18.7 weeks of regular benefits paid, lower than the 20.2 weeks for those regular claims that did not include any work while on claim (see Table 23). However, the average maximum duration for those claims with working while on claim was 32.2 weeks, higher than the 31.4 weeks provided to those without working while on claim. These differences in average maximum and actual duration may indicate that those working while on claim use less benefits, regardless of a higher average maximum duration.
| With Working while on Claim | Without Working while on Claim | |
|---|---|---|
| Average Actual Duration of Benefits | 18.7 | 20.2 |
| Average Maximum Duration of Benefits | 32.2 | 31.4 |
- 1 Includes claims for which at least $1 of regular benefits was paid.
- Source: ESDC, Employment Insurance (EI) administrative data. Data are based on a 10% sample of EI administrative data.
The average actual duration of those claims with working while on claim did not differ by age nor gender. On the contrary, it varied significantly across regions, due to the high correlation of regional unemployment rates and average maximum duration, as well as by industry, as it does for all regular benefits. Footnote 65 Specifically, the regions in Canada ranged from a low of 15.1 weeks in Alberta to a high of 31.1 weeks in Nunavut, while the industries ranged from 13.4 weeks in the Educational Services industry to 23.0 weeks in the Finance and Insurance industry. A 2015 study Footnote 66 looking at pure regular claimants Footnote 67 who worked while on claim found that the longer the duration of a claim, Footnote 68 the more likely the claimant was to work while on claim and to work for more than one employer. Specifically, of claims lasting 14 weeks or less, 48% worked while on claim and 14% worked for more than one employer. Conversely, those claims lasting 45 weeks or more had 67% of claimants working while on claim, with 30% working for more than one employer. The study also found that the number of weeks worked as well as the number of “full-time” weeks (defined as a claimant having their benefits reduced to zero and therefore deferring the week) also increased with the duration of the claim.
The above study also found that 74% of pure regular claimants who worked while on claim did so for a single employer, and 91% of hours worked while on claim were for one employer. In addition, the average working claimant worked approximately one third of the time (measured in weeks). Finally, the study found that 80% of working claimants had worked for the same employer previous to their claim, while 82% stayed with the same employer they worked for on claim after their claim had ended. In total, 95% of working claimants worked at least one week for the same employer before or after their claim. A subset of these claimants worked both before and after the claim, which made up 65% of working claimants. These statistics suggest that many claimants are being laid-off by their employer during a temporary work-shortage, with the possibility of returning intermittently during their EI claim when their employer requires it, and returning full-time when the work-shortage subsides. This could explain the high correlation of seasonal industries and claims, which produce and follow work-shortage trends, with working while on claim.
2.3.3.3 Weeks of work while on claim Footnote 69
This section examines the Working While on Claim provision from the perspective of weeks worked while on claim, focusing primarily on regular claims. The analysis examines all benefits paid for fiscal year 2014/2015 and whether or not employment income was reported during a week in which a claimant received EI benefits, regardless of when the claim was established.
EI administrative data indicate that among all EI benefit weeks paid in 2014/2015, 14% of weeks paid involved the claimant working while on claim. For regular claims, the proportion stood at 24% and was much higher than fishing, parental and compassionate care benefits. As Chart 28 shows, since 2011/2012, the proportion of weeks worked while on claim declined for all types of benefits.
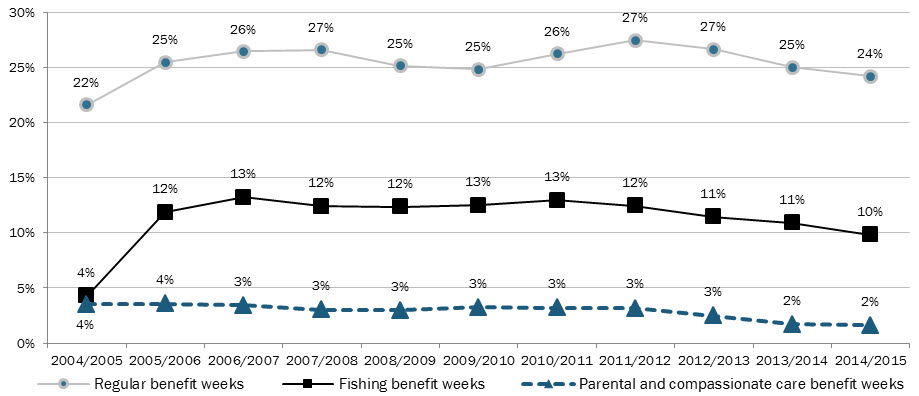
Show Data Table
| Regular benefit weeks | Fishing benefit weeks | Parental and compassionate care benefit weeks | |
|---|---|---|---|
| 2004/2005 | 22% | 4% | 4% |
| 2005/2006 | 25% | 12% | 4% |
| 2006/2007 | 26% | 13% | 3% |
| 2007/2008 | 27% | 12% | 3% |
| 2008/2009 | 25% | 12% | 3% |
| 2009/2010 | 25% | 13% | 3% |
| 2010/2011 | 26% | 13% | 3% |
| 2011/2012 | 27% | 12% | 3% |
| 2012/2013 | 27% | 11% | 3% |
| 2013/2014 | 25% | 11% | 2% |
| 2014/2015 | 24% | 10% | 2% |
- 1 Data are based on the weeks worked while on claim during this period, regardless of when the claim was established.
- 2 Excludes weeks worked while on claim with missing earnings data, which represent less than 1% of the weeks.
- Note: Excludes claims that reverted to Pilot Project 17.
- Source: ESDC Employment Insurance (EI) Adminsitrative Data. Data are based on a 10% sample of EI adminsitrative data.
Table 24 shows the proportion of weeks worked while entitled to receive regular benefits, broken down by socio-demographic characteristics over the past five fiscal years. The number of weeks worked vary in a very similar manner to the number of claims which had at least one week worked. Again, those under the age of 55 had a higher proportion of weeks worked while on claim, while those aged 55 years and over have a smaller proportion of weeks worked while on claim. In addition, the proportion of weeks worked while on claim varies significantly by province and territory. Again, the Atlantic provinces and Quebec have the highest proportion of regular weeks worked while on claim than the rest of Canada. In addition, British Columbia and the Yukon have higher proportions of weeks worked while on claim than the other Western provinces and the territories, but figures remain lower than the national average.
| 2010/2011 | 2011/2012 | 2012/2013 | 2013/2014 | 2014/2015 | |
|---|---|---|---|---|---|
| Pilot Project 12 | Pilot Projects 12 and 17 | Pilot Projects 17 and 18 | Pilot Project 18 | Pilot Project 18 | |
| Province | |||||
| Newfoundland and Labrador | 31% | 32% | 31%r | 28% | 27% |
| Prince Edward Island | 33% | 33% | 30%r | 28% | 26% |
| Nova Scotia | 32% | 32% | 31%r | 29% | 28% |
| New Brunswick | 36% | 36% | 35%r | 33% | 32% |
| Quebec | 33% | 35% | 34%r | 32% | 31% |
| Ontario | 20% | 20% | 19%r | 18% | 18% |
| Manitoba | 17% | 16% | 14%r | 14% | 13% |
| Saskatchewan | 17% | 16% | 15% | 13% | 13% |
| Alberta | 15% | 17% | 15% | 14%r | 12% |
| British Columbia | 22% | 23% | 22%r | 21%r | 20% |
| Yukon | 18% | 17% | 18% | 15% | 14% |
| Northwest Territories | 12% | 12% | 8% | 9% | 9% |
| Nunavut | 11% | 14% | 12% | 7% | 8% |
| Gender | |||||
| Men | 25% | 26% | 25% | 24%r | 23% |
| Women | 28% | 30% | 29%r | 27% | 26% |
| Age | |||||
| 24 and under | 23% | 24% | 24% | 23% | 23% |
| 25 to 44 years old | 26% | 28% | 27% | 26%r | 25% |
| 45 to 54 years old | 30% | 32% | 32% | 31%r | 30% |
| 55 and over | 21% | 23% | 20% | 18% | 18% |
| Canada | 26% | 27% | 27% | 25% | 24% |
- 1 Data are based on the weeks worked while on claim during the specified period, regardless of when the claim was established.
- 2 Excludes weeks worked while on claims with missing earnings data, which represent less than 1% of the weeks.
- 3 Excludes claims that reverted to Pilot Project 17
- r Revised
- Source: ESDC, Employment Insurance (EI) administrative data. Data are based on a 10% sample of EI administrative data.
The WWC rules have varied over the last three years and the following analysis compares results of these WWC pilot projects. Table 24 shows that the changes in pilot projects have had little effect on different socio-demographic groups- there is only a modest upward trend in the proportion of weeks worked with the introduction of Pilot Project 17 and a modest downward trend following the introduction of Pilot Project 18, consistent across all groups. Under Pilot Project 18, 25% of weeks were worked while on regular claim between August 2012 and March 2015. Footnote 70 This is lower than for Pilot Project 17, running from August 2011 to August 2012, under which the proportion of weeks worked was 28%.
Table 25 presents the distribution of weeks worked based on the earnings in relation to the claimants’ weekly benefit rate. With the implementation of Pilot Project 18, there has been a shift in the distribution towards higher earnings, despite the downward trend in total number of weeks worked. In other words, there has been an increase in the intensity of work compared to the previous WWC pilot, implying that the average number of hours or days worked while on claim per week has increased. As shown in Table 25, the percentage of claims with earnings greater than 40% of their weekly benefit rate (the allowable earnings threshold under the previous pilots) increased, from between 81% to 84% under Pilot Project 17 to between 87% and 90% under Pilot Project 18.
| 2011/2012 | 2012/2013 | 2013/2014 | 2014/2015 | |||||
|---|---|---|---|---|---|---|---|---|
| April 2011 to July 2011 | August 2011 to March 2012 | April 2011 to March 2012 | April 2012 to July 2012 | August 2012 to March 2013 | April 2012 to March 2013 | April 2013 to March 2014 | April 2014 to March 2015 | |
| Pilot Project 12 | Pilot Project 17 | Pilot Projects 12 and 17 combined | Pilot Project 17 | Pilot Project 18 | Pilot Projects 17 and 18 combined |
Pilot Project 18 | Pilot Project 18 | |
| Weeks worked while receiving regular benefits | 3,571,450 | 6,870,920 | 10,442,370r | 3,362,170r | 5,986,500r | 9,348,670 | 8,235,980r | 7,779,430 |
| Share of weeks worked while receiving regular benefits | 29% | 27% | 27% | 30% | 25% | 27% | 25% | 24% |
| Distribution of earnings while receiving regular benefits (Earnings as a share of EI Weekly Benefit Rate)4 | ||||||||
| 25% or less | 6% | 7% | 7% | 6% | 6% | 6% | 5% | 5% |
| 26% to 40% | 10% | 12% | 11% | 10% | 7% | 8% | 5% | 5% |
| 41% to 125% | 20% | 21% | 20% | 19% | 22% | 21% | 22% | 23% |
| 126% to 140% | 4% | 4% | 4% | 4% | 5% | 4% | 5% | 5% |
| 141% to 182% | 17% | 17% | 17% | 18% | 19% | 18% | 20% | 20% |
| 183% or more | 42% | 39% | 40% | 44% | 42% | 43% | 43% | 42% |
| Canada | 100% | 100% | 100% | 100% | 100% | 100% | 100% | 100% |
- 1 Data are based on the weeks worked while on claim during the specified period, regardless of when the claim was established.
- 2 Excludes weeks worked while on claims with missing earnings data, which represent less than 1% of the weeks.
- 3 Excludes claims that reverted to Pilot Project 17.
- 4 Percentages with decimals are rounded up or down. For example, if a claimant earned 25.3% of his or her EI benefit in a given week, that week would fall under the 25% or less category.
- r Revised.
- Source: ESDC, Employment Insurance (EI) administrative data. Data are based on a 10% sample of EI administrative data.
Chart 29 also shows the distribution of earnings from Table 25, in smaller increments, under the three different WWC regimes: the legislation, the provisions of Pilot Projects 12 and 17 and the provisions of Pilot Project 18. Under the legislation and Pilot Projects 12 and 17, 25% and 40% earning allowances did not reduce EI benefits until claimants earned more than those thresholds, after which earnings were deducted from benefits dollar for dollar. This provided a strong incentive to work up to the threshold amount (25% or 40%) but no incentive to work beyond it, since claimants receive no additional income (combined EI benefits and earnings) from working while on claim until they’ve surpassed their weekly benefit rate. Under the current pilot project, a claimant’s combined EI benefits and earnings from working while on claim rise consistently for every hour of work he or she accepts for significantly more earnings– specifically until they have surpassed 90% of their weekly benefit rate. As depicted in Chart 29, behavioural impacts of the incentives are suggested by the two distinct peaks in the data for the legislation and Pilot Projects 12 and 17, where claimants reached the respective thresholds. It also suggests a change in claimant behaviour under the current pilot project: there is now a smoother distribution of weeks worked while on claim, which demonstrates a more consistent incentive to accept available work, and therefore an increase in work intensity.
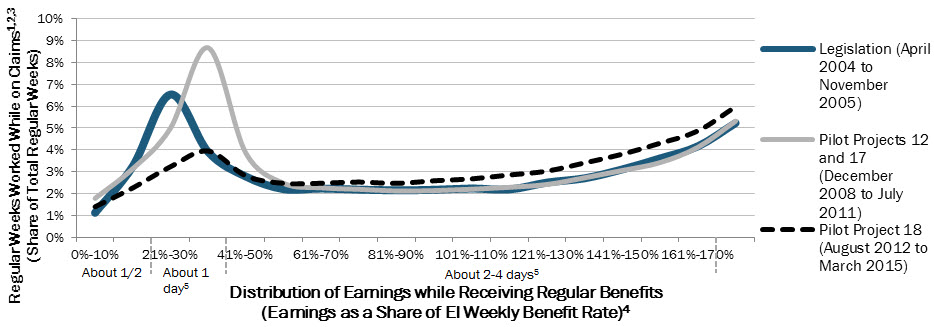
Show Data Table
| Earnings as a Share of EI Weekly Benefit Rate | Legislation (April 2004 to November 2005) |
Pilot Projects 12 and 17 (December 2008 to July 2011) |
Pilot Project 18 (August 2012 to March 2015) |
|---|---|---|---|
| 0%-10% | 1.1% | 1.8% | 1.4% |
| 11%-20% | 3.2% | 3.1% | 2.3% |
| 21%-30% | 6.5% | 5.0% | 3.2% |
| 31%-40% | 3.9% | 8.7% | 3.9% |
| 41%-50% | 2.8% | 3.9% | 2.8% |
| 51%-60% | 2.2% | 2.5% | 2.5% |
| 61%-70% | 2.2% | 2.3% | 2.5% |
| 71%-80% | 2.2% | 2.2% | 2.5% |
| 81%-90% | 2.1% | 2.1% | 2.5% |
| 91%-100% | 2.2% | 2.1% | 2.6% |
| 101%-110% | 2.2% | 2.2% | 2.7% |
| 111%-120% | 2.2% | 2.3% | 2.9% |
| 121%-130% | 2.5% | 2.4% | 3.0% |
| 131%-140% | 2.7% | 2.7% | 3.4% |
| 141%-150% | 3.1% | 3.1% | 3.8% |
| 151%-160% | 3.6% | 3.4% | 4.3% |
| 161%-170% | 4.2% | 4.1% | 4.9% |
| 171%-180% | 5.2% | 5.3% | 6.0% |
- 1 Data are based on the weeks worked while on claim during the specified period, regardless of when the claim was established.
- 2 Excludes weeks worked while on claim with missing earnings data, which represent less than 1% of the weeks.
- 3 Excludes claims that reverted to Pilot Project 17.
- 4 Percentages with decimals are rounded up or down. For example, if a claimant earned 25.3% of his or her EI benefit in a given week, that week would fall under the 25% or less category. Percentage above 180% were excluded.
- 5 Days worked is estimated by calculating the proportion of their full-time wage worked and converting it to days. For example, if a claimant worked for 20% of his or her benefit rate, recalling that the benefit rate is 55% of full time wage, then the claimant is working 11% (20% x 55%) of his or her full-time wage, or aproximately 1/2 a day (11% x 5 days). This assumes that working claimants are earning approximately the same hourly wage as at their employment with which they qualified for benefits, that they had been working full time prior to establishing a claim, and that they had earrned the maximum insurable earnings or below.
- Source: ESDC, Employment Insurance (EI) administrative data. Data are based on a 10% sample of EI adminsitrative data.
The increase in work intensity under Pilot Project 18 can also be demonstrated by examining, on an aggregate level, the employment income earned while on claim with the level of regular benefits paid. As shown in Table 26, despite a decrease in the last two years, earnings expressed as a percentage of total regular benefits paid to all claimants has increased since 2009/2010 (54% to 59%), which suggests that the overall intensity of working while on claim has increased in recent years.
| 2009/2010 | 2010/2011 | 2011/2012 | 2012/2013 | 2013/2014 | 2014/2015 | |
|---|---|---|---|---|---|---|
| Pilot Project 12 | Pilot Project 12 | Pilot Projects 12 and 17 | Pilot Projects 17 and 18 | Pilot Project 18 | Pilot Project 18 | |
| Employment Income Earned While on Regular Claim ($B)4 | 8.0 | 7.3 | 7.0 | 6.9 | 6.4 | 6.3 |
| Total regular Benefits Paid to all Claimants ($B)5 | 14.7 | 12.8 | 11.1 | 10.5 | 10.4 | 10.6 |
| Ratio of Earnings to Regular Benefits6 | 54% | 57% | 63% | 66% | 62% | 59% |
- 1 Data are based on the weeks worked while on claim during this period, regardless of when the claim was established.
- 2 Excludes weeks worked while on claims with missing earnings data, which represent less than 1% of the weeks.
- 3 Excludes claims that reverted to Pilot Project 17
- 4 As of the 2014/2015 Employment Insurance Monitoring and Assessment Report, the methodology for the employment income earned while on regular claim has changed; previous years’ data were revised to reflect this change.
- 5 As of the 2014/2015 Employment Insurance Monitoring and Assessment Report, the total regular benefits paid to all claimants includes those training benefits paid under article 25 of the Employment Insurance Act; previous years’ data were revised to reflect this change.
- 6 Ratio of earnings to regular benefits is calculated by dividing the employment income earned while on regular claim by the total regular benefits paid to all claimants. As of the 2014/2015 Employment Insurance Monitoring and Assessment Report, the methodology has changed for the employment income earned while on regular claim and the total regular benefits paid to all claimants (see footnotes 4 and 5), and as such so has the ratio of earnings to regular benefits.
- Source: ESDC, Employment Insurance (EI) administrative data. Data are based on a 10% sample of EI administrative data.
This increase in work intensity seems to explain the decreases in the number of claims with working while on claim as well as the number of weeks worked since 2009/2010. The decline in the proportion of working claimants could be attributed to employers utilizing fewer employees as some working claimants increase their work intensity, decreasing the need for additional workers. Conversely, under the legislation and Pilot Projects 12 and 17, claimants may have chosen lower work intensities, increasing employers’ need to hire additional workers.
2.3.4 Benefit repayment provision Footnote 71
Claimants whose annual net income Footnote 72 exceeds 125% of the maximum insurable earnings (MIE) are required to repay, for a taxation year, the lesser of 30% of total EI benefits they received, other than special benefits, or 30% of their net income above this threshold (i.e., 125% of the MIE) Footnote 73 . Claimants who received no regular or fishing benefits in the preceding ten taxation years are exempt from this provision.
For the 2013 taxation year, 157,109 claimants repaid $201.7 million in benefits. It is estimated that, among all claimants other than those who only received special benefits, about 11% (or 9% of all EI claimants) repaid a portion of their EI benefits received in 2013.
It should be noted that since the benefit repayment provision does not apply to special benefits, the use of the term "claimants" in the remainder of this section excludes claimants who only received special benefits.
2.3.4.1 Benefit repayment, by province and territory, gender and age group
Among provinces and territories, Alberta had the highest percentage of EI claimants who repaid a portion of their benefits (23%), followed by Newfoundland and Labrador (18%) and Northwest Territories (16%) [see Table 27].
| Claimants (Excluding Those That Only Received Special Benefits) | Claimants Who Repaid a Portion of Their Benefits | ||
|---|---|---|---|
| 2013/2014 | 2013 | 2013 (%) | |
| Province and Territory | |||
| Newfoundland and Labrador | 70,660 | 12,787 | 18 |
| Prince Edward Island | 18,020 | 1,048 | 6 |
| Nova Scotia | 63,870 | 7,722 | 12 |
| New Brunswick | 73,390 | 6,499 | 9 |
| Quebec | 430,000 | 40,948 | 10 |
| Ontario | 413,110 | 38,373 | 9 |
| Manitoba | 39,530 | 2,918 | 7 |
| Saskatchewan | 31,150 | 4,585 | 15 |
| Alberta | 98,000 | 22,813 | 23 |
| British Columbia | 148,690 | 18,676 | 13 |
| Yukon | 2,070 | 288 | 14 |
| Northwest Territories | 1,680 | 275 | 16 |
| Nunavut | 890 | 108 | 12 |
| Foreign services/non-residents | Not applicable | 69 | Not applicable |
| Gender | |||
| Men | 863,710 | 140,103 | 16 |
| Women | 527,350 | 17,006 | 3 |
| Age | |||
| 24 years and under (Youth) | 150,030 | 6,098 | 4 |
| 25 to 44 years | 609,290 | 68,297 | 11 |
| 45 to 54 years | 338,760 | 41,376 | 12 |
| 55 years and over (Older Workers) | 292,980 | 41,338 | 14 |
| Canada | 1,391,060 | 157,109 | 11 |
- Note: Totals may not add up due to rounding.
- Source: ESDC, Employment Insurance (EI) administrative data. Data on claimants are based on a 10% sample of EI administrative data; and data on claimants who repaid a portion of their benefits are based on a 100% sample of EI administrative data.
Among gender, 16% of male claimants were subject to repayment, compared to only 3% of female claimants. As a result, men continued to comprise the vast majority of claimants who repaid EI benefits; they accounted for 89% of the total number of EI claimants who repaid benefits in 2013, a share that has remained stable for over a decade. Statistics by age category indicate that older workers (55 and older) were more likely to repay EI benefits (14%) in 2013 while youth (24 years and under) were less likely to repay (4%). Footnote 74
Differences in frequency of benefit repayment between genders and among age groups reflect differences in pre-claim earnings among members of these groups and their likelihood to repay EI benefits. For example, based on the latest available statistics, in 2011, younger workers (24 years and under) had a total income of $14,200, compared to $48,500 for core-aged workers (25 to 54 years) and $38,400 for older workers (55 years and older). Footnote 75 As a result, it is more likely that workers older than 25 will exceed the net income threshold necessary to be subject to the benefit repayment provision, while the opposite effect is true for youth.
On average, EI claimants subject to the benefit repayment provision repaid $1,284 in 2013; this amount has increased for three consecutive years, is slightly higher than the amount repaid in 2012 ($1,218), and is higher than the average over the past decade ($1,093). EI claimants who repaid a portion of their benefits received $5,434 in EI benefits Footnote 76 in 2013, on average, higher than the amount in 2012 ($5,101). In 2013, EI claimants who repaid a portion of their benefits were on claim for an average of 12.0 weeks, slightly higher than the previous year (11.5 weeks). However, EI claimants who repaid EI benefits in 2013 were on an EI claim for a shorter duration compared to the overall population of EI regular claimants (19.4 weeks) in 2013/2014. This suggests that high-earning EI claimants generally are on EI benefits for shorter periods compared to their lower-earning counterparts.
Among those who repaid EI benefits in 2013, men repaid the highest amounts ($1,305) and were on an EI claim for the longest duration (12.1 weeks). Across age groups, older workers (55 and older) repaid the highest amounts ($1,514) and were on an EI claim for the longest duration (14.9 weeks).
In 2013, EI claimants in the Atlantic provinces repaid the largest amounts of EI benefits on average, most notably in Nova Scotia ($1,883) and Prince Edward Island ($1,841); these amounts were much higher than the national average ($1,284). In addition, EI claimants from the Atlantic provinces who were subject to repayment were on an EI claim for longer durations, most notably in Prince Edward Island (18.7 weeks) and Nova Scotia (17.9 weeks). Conversely, claimants from Quebec ($1,107) and Ontario ($1,159) repaid the lowest average amount of benefits and the duration of their benefits was shorter than almost all other jurisdictions (10.9 and 11.0 weeks, respectively). The Western provinces and territories ranged from $1,242 (Saskatchewan) to $1,422 (Yukon) for the amount repaid and from 10.9 weeks (Alberta) to 14.6 weeks (Nunavut) for the duration on claim. The data suggest that among EI claimants who were subject to the benefit repayment provision, a direct correlation exists between weeks on EI and benefits repaid; this is due to the fact that longer durations on EI result in higher amounts of EI received, a portion of which may have to be subsequently repaid.
2.4 Maximum and actual duration of Employment Insurance regular benefits Footnote 77
EI claimants can be paid between a maximum of 14 and 45 weeks of EI regular benefits, depending on the unemployment rate in the EI economic region in which they reside and the number of hours of insurable employment they accumulated during their qualifying period (see Table 28). Footnote 78 Individuals residing in regions with a high unemployment rate are entitled to receive more weeks of EI regular benefits, and those with a low number of hours of insurable employment are entitled to receive fewer weeks of benefits. For example, an individual residing in an EI economic region with an unemployment rate higher than 16.0%, and who has accumulated 1,820 hours of insurable employment during the qualifying period (generally the 52 week period preceding the claim), is entitled to a maximum of 45 weeks of EI regular benefits. Conversely, an individual residing in an EI economic region with an unemployment rate of 6.0% or lower, and who has accumulated 700 hours of insurable employment, is entitled to a maximum of 14 weeks of EI regular benefits. The EI program automatically adapts to the economic conditions of the regions in which individuals reside, as the regional unemployment rates used to establish the maximum duration of regular benefits are adjusted on a monthly basis for all EI economic regions.
| Number of Hours of Insurable Employment | Regional Unemployment Rate | |||||||||||
|---|---|---|---|---|---|---|---|---|---|---|---|---|
| 6.0% and under | 6.1% – 7.0% |
7.1% – 8.0% |
8.1% – 9.0% |
9.1% – 10.0% |
10.1% – 11.0% |
11.1% – 12.0% |
12.1% – 13.0% |
13.1% – 14.0% |
14.1% – 15.0% |
15.1% – 16.0% |
More than 16.0% | |
| 420–454 | 0 | 0 | 0 | 0 | 0 | 0 | 0 | 0 | 26 | 28 | 30 | 32 |
| 455–489 | 0 | 0 | 0 | 0 | 0 | 0 | 0 | 24 | 26 | 28 | 30 | 32 |
| 490–524 | 0 | 0 | 0 | 0 | 0 | 0 | 23 | 25 | 27 | 29 | 31 | 33 |
| 525–559 | 0 | 0 | 0 | 0 | 0 | 21 | 23 | 25 | 27 | 29 | 31 | 33 |
| 560–594 | 0 | 0 | 0 | 0 | 20 | 22 | 24 | 26 | 28 | 30 | 32 | 34 |
| 595–629 | 0 | 0 | 0 | 18 | 20 | 22 | 24 | 26 | 28 | 30 | 32 | 34 |
| 630–664 | 0 | 0 | 17 | 19 | 21 | 23 | 25 | 27 | 29 | 31 | 33 | 35 |
| 665–699 | 0 | 15 | 17 | 19 | 21 | 23 | 25 | 27 | 29 | 31 | 33 | 35 |
| 700–734 | 14 | 16 | 18 | 20 | 22 | 24 | 26 | 28 | 30 | 32 | 34 | 36 |
| 735–769 | 14 | 16 | 18 | 20 | 22 | 24 | 26 | 28 | 30 | 32 | 34 | 36 |
| 770–804 | 15 | 17 | 19 | 21 | 23 | 25 | 27 | 29 | 31 | 33 | 35 | 37 |
| 805–839 | 15 | 17 | 19 | 21 | 23 | 25 | 27 | 29 | 31 | 33 | 35 | 37 |
| 840–874 | 16 | 18 | 20 | 22 | 24 | 26 | 28 | 30 | 32 | 34 | 36 | 38 |
| 875–909 | 16 | 18 | 20 | 22 | 24 | 26 | 28 | 30 | 32 | 34 | 36 | 38 |
| 910–944 | 17 | 19 | 21 | 23 | 25 | 27 | 29 | 31 | 33 | 35 | 37 | 39 |
| 945–979 | 17 | 19 | 21 | 23 | 25 | 27 | 29 | 31 | 33 | 35 | 37 | 39 |
| 980–1,014 | 18 | 20 | 22 | 24 | 26 | 28 | 30 | 32 | 34 | 36 | 38 | 40 |
| 1,015–1,049 | 18 | 20 | 22 | 24 | 26 | 28 | 30 | 32 | 34 | 36 | 38 | 40 |
| 1,050–1,084 | 19 | 21 | 23 | 25 | 27 | 29 | 31 | 33 | 35 | 37 | 39 | 41 |
| 1,085–1,119 | 19 | 21 | 23 | 25 | 27 | 29 | 31 | 33 | 35 | 37 | 39 | 41 |
| 1,120–1,154 | 20 | 22 | 24 | 26 | 28 | 30 | 32 | 34 | 36 | 38 | 40 | 42 |
| 1,155–1,189 | 20 | 22 | 24 | 26 | 28 | 30 | 32 | 34 | 36 | 38 | 40 | 42 |
| 1,190–1,224 | 21 | 23 | 25 | 27 | 29 | 31 | 33 | 35 | 37 | 39 | 41 | 43 |
| 1,225–1,259 | 21 | 23 | 25 | 27 | 29 | 31 | 33 | 35 | 37 | 39 | 41 | 43 |
| 1,260–1,294 | 22 | 24 | 26 | 28 | 30 | 32 | 34 | 36 | 38 | 40 | 42 | 44 |
| 1,295–1,329 | 22 | 24 | 26 | 28 | 30 | 32 | 34 | 36 | 38 | 40 | 42 | 44 |
| 1,330–1,364 | 23 | 25 | 27 | 29 | 31 | 33 | 35 | 37 | 39 | 41 | 43 | 45 |
| 1,365–1,399 | 23 | 25 | 27 | 29 | 31 | 33 | 35 | 37 | 39 | 41 | 43 | 45 |
| 1,400–1,434 | 24 | 26 | 28 | 30 | 32 | 34 | 36 | 38 | 40 | 42 | 44 | 45 |
| 1,435–1,469 | 25 | 27 | 29 | 31 | 33 | 35 | 37 | 39 | 41 | 43 | 45 | 45 |
| 1,470–1,504 | 26 | 28 | 30 | 32 | 34 | 36 | 38 | 40 | 42 | 44 | 45 | 45 |
| 1,505–1,539 | 27 | 29 | 31 | 33 | 35 | 37 | 39 | 41 | 43 | 45 | 45 | 45 |
| 1,540–1,574 | 28 | 30 | 32 | 34 | 36 | 38 | 40 | 42 | 44 | 45 | 45 | 45 |
| 1,575–1,609 | 29 | 31 | 33 | 35 | 37 | 39 | 41 | 43 | 45 | 45 | 45 | 45 |
| 1,610–1,644 | 30 | 32 | 34 | 36 | 38 | 40 | 42 | 44 | 45 | 45 | 45 | 45 |
| 1,645–1,679 | 31 | 33 | 35 | 37 | 39 | 41 | 43 | 45 | 45 | 45 | 45 | 45 |
| 1,680–1,714 | 32 | 34 | 36 | 38 | 40 | 42 | 44 | 45 | 45 | 45 | 45 | 45 |
| 1,715–1,749 | 33 | 35 | 37 | 39 | 41 | 43 | 45 | 45 | 45 | 45 | 45 | 45 |
| 1,750–1,784 | 34 | 36 | 38 | 40 | 42 | 44 | 45 | 45 | 45 | 45 | 45 | 45 |
| 1,785–1,819 | 35 | 37 | 39 | 41 | 43 | 45 | 45 | 45 | 45 | 45 | 45 | 45 |
| 1,820 and more | 36 | 38 | 40 | 42 | 44 | 45 | 45 | 45 | 45 | 45 | 45 | 45 |
- Source: Employment Insurance Act, section 12.
Actual duration reflects the number of weeks during which an EI claimant receives EI regular benefits, which cannot exceed the maximum duration levels indicated in Table 28, under the current legislation and regulations. Actual duration is usually much smaller than maximum duration for a number of reasons. For example, an EI claimant may find work before the end of their benefit period. A detailed analysis on maximum and actual duration is provided in the following subsection.
2.4.1 Maximum and actual duration of Employment Insurance regular benefits
From 2013/2014 to 2014/2015, the average maximum duration of regular benefits decreased from 31.7 weeks to 31.4 weeks, while the average actual duration remained stable at 19.4 weeks (see Chart 30). For five consecutive years starting in 2010/2011, both average maximum and average actual duration of regular benefits have decreased or remained stable.
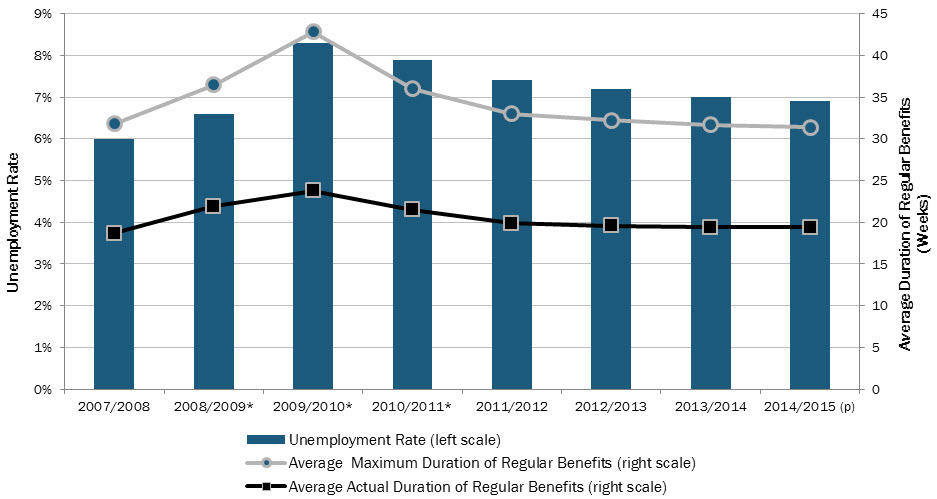
Show Data Table
| Unemployment Rate | Average Maximum Duration of Regular Benefits (Weeks) | Average Actual Duration of Regular Benefits (Weeks) | |
|---|---|---|---|
| 2007/2008 | 6.0% | 31.8 | 18.7 |
| 2008/2009* | 6.6% | 36.5 | 21.9 |
| 2009/2010* | 8.3% | 42.8 | 23.8 |
| 2010/2011* | 7.9% | 36.0 | 21.5 |
| 2011/2012 | 7.4% | 33.0 | 19.9 |
| 2012/2013 | 7.2% | 32.2 | 19.6 |
| 2013/2014 | 7.0% | 31.7 | 19.4 |
| 2014/2015(p) | 6.9% | 31.4 | 19.4 |
- * These years coincide with the Employment Insurance (EI) temporary measures announced in Budgets 2009 and 2010, that increased the maximum number of weeks for which regular benefits could be paid.
- (p) Preliminary data for the figures on actual duration.
- Sources: ESDC, Employment Insurance (EI) administrative data (for data on duration of regular benefits); and Statistics Canada, Labour Force Survey, CANSIM Table 282-0007 (for data on unemployment rates). ESDC data are based on a 10% sample of EI administrative data.
The annual decrease in the average maximum duration of regular benefits in 2014/2015 was very minor (-0.3 week) and may reflect the slight decrease in the unemployment rate in Canada, from 7.0% in 2013/2014 to 6.9% in 2014/2015.
The trend in the average maximum duration of regular benefits over the past five years shows a more significant decline. After reaching a high of 42.8 weeks in 2009/2010 after the 2008 recession, the average maximum duration of regular benefits has decreased for five straight years from 2010/2011 (36.0 weeks) to 2014/2015 (31.4 weeks). This decrease can be attributed to two factors: improved economic conditions and the termination of two pilot projects. Firstly, as economic conditions improve and the unemployment rate declines, the maximum duration of regular benefits tends to decrease. Secondly, the termination of the pilot for the Extension of EI Benefits for Long-Tenured Workers on September 11, 2010 and the termination of the pilot for Extended EI benefits on September 15, 2012, which temporarily increased maximum duration of regular benefits, Footnote 79 also contributed to the decline in average maximum duration of regular benefits over the past five years. It is important to note that these termination dates refer to the last day an EI claim could be established under a particular pilot. The full impact of a pilot is not realized until all related EI benefits are paid, which can be several months after a pilot’s termination date.
With respect to actual duration, in 2014/2015, EI regular claimants used, on average, 19.4 weeks of regular benefits, the same as 2013/2014. Average actual duration of EI regular benefits has decreased over the past five years, because of the decline in the average maximum duration of regular benefits and better economic conditions. First, actual duration is impacted by maximum duration; generally, as the maximum number of weeks decrease, so too do the number of weeks of actual duration. Second, improved economic conditions, in general, lead to a shorter duration of regular benefits since EI claimants can find employment sooner after an interval of receiving EI benefits.
An evaluation study Footnote 80 suggested that the effect of the program’s automatic adjustments to regular entitlement weeks, combined with the Extension of EI Regular Benefits temporary measure, led to an increase of 2.1 weeks in the average duration of claims established between March 2008 and September 2010. A supplemental study Footnote 81 using a geography-based approach to assess the impact of the pilot project relating to Extended Benefits on EI usage determined that the number of EI regular benefit weeks used increased by 2.7 weeks in the pilot regions, for claims established between September 12, 2010 and September 15, 2012.
A recent study Footnote 82 , using data from the Survey of Labour and Income Dynamics (SLID), looked at the impact of participation in job-related training on the incidence of receiving EI regular benefits and the duration of regular benefit payments during the period 2002 to 2008 (when SLID collected data on participation in training). The study suggests that for males who participated in job-related training in a given year, the probability of receiving EI regular benefits in the following year was reduced by 1.4 percentage point, from an average predicted probability Footnote 83 of 4.7%. For females who participated in job-related training, the probability of receiving EI regular benefits was found to be reduced by 0.6 percentage point, from an average predicted probability of 4.1%. The study also shows that it is employer-sponsored and workplace-based job-related training that reduce the incidence of receiving EI regular benefits; self-sponsored and classroom-based job-related training were not found to have an impact. With respect to the duration of EI regular benefits, the study suggests that job-related training had only a limited impact, reducing the duration of benefit payments by 1.6 day among male recipients and 0.9 day among female recipients.
2.4.1.1 Maximum duration and actual duration of Employment Insurance regular benefits, by province and territory, gender, age, and claimant category
In 2014/2015, the average maximum duration of EI regular benefits for each gender, all age groups, and most EI claimant categories, hovered close to the national average of 31.4 weeks. However, the average maximum duration of regular benefits by province and territory showed more variance (see Table 29).
The four Atlantic provinces experienced the highest average maximum duration of regular benefits (ranging from 33.2 weeks in Prince Edward Island to 38.2 weeks in Newfoundland and Labrador). British Columbia and Alberta had the lowest average, with 29.7 weeks each. This discrepancy is explained by provincial differences in economic conditions. As seen in Chapter I, the unemployment rates were the highest in the Atlantic provinces (ranging from 8.9% to 12.2%) and were amongst the lowest in British Columbia and Alberta (unemployment rates of 6.0% and 4.9%, respectively). From 2013/2014 to 2014/2015, there were modest changes to the average maximum duration among provinces, ranging from -0.9 week in New Brunswick to +0.8 week in Newfoundland and Labrador.
| Average Maximum Duration of Regular Benefits (Weeks) |
Average Actual Duration of Regular Benefits (Weeks) |
|||||||
|---|---|---|---|---|---|---|---|---|
| 2012/2013 | 2013/2014 | 2014/2015 | Change | 2012/2013 | 2013/2014 | 2014/2015p | Change | |
| Province and Territory | ||||||||
| Newfoundland and Labrador | 39.2 | 37.4 | 38.2 | 0.8 | 26.1 | 25.6 | 25.3 | -0.3 |
| Prince Edward Island | 34.9 | 33.5 | 33.2 | -0.3 | 23.3 | 22.7 | 23.3 | 0.6 |
| Nova Scotia | 35.5 | 34.0 | 34.4 | 0.4 | 23.9 | 23.1 | 23.5 | 0.4 |
| New Brunswick | 37.0 | 36.5 | 35.6 | -0.9 | 23.5 | 23.8 | 23.4 | -0.4 |
| Quebec | 31.1 | 31.0 | 30.7 | -0.3 | 18.4 | 18.6 | 18.7 | 0.1 |
| Ontario | 32.3 | 31.5 | 30.9 | -0.6 | 19.8 | 19.1 | 18.7 | -0.4 |
| Manitoba | 29.9 | 29.6 | 30.0 | 0.4 | 17.6 | 17.5 | 18.0 | 0.5 |
| Saskatchewan | 32.9 | 32.4 | 33.0 | 0.6 | 18.1 | 17.9 | 18.6 | 0.7 |
| Alberta | 28.4 | 29.1 | 29.7 | 0.6 | 16.0 | 16.3 | 17.4 | 1.1 |
| British Columbia | 30.5 | 30.2 | 29.7 | -0.5 | 18.8 | 18.6 | 18.8 | 0.2 |
| Yukon | 41.8 | 41.6 | 32.9 | -8.7 | 24.0 | 24.0 | 22.5 | -1.5 |
| Northwest Territories | 42.8 | 41.9 | 40.0 | -1.9 | 26.2 | 25.9 | 25.7 | -0.2 |
| Nunavut | 41.9 | 41.6 | 40.0 | -1.6 | 28.2 | 29.2 | 29.3 | 0.1 |
| Gender | ||||||||
| Men | 32.7 | 32.3 | 32.0 | -0.3 | 19.7 | 19.5 | 19.5 | 0.0 |
| Women | 31.4 | 30.8 | 30.5 | -0.3 | 19.6 | 19.3 | 19.4 | 0.1 |
| Age | ||||||||
| 15 to 24 years (Youth) | 31.2 | 30.7 | 30.5 | -0.2 | 17.6 | 17.6 | 17.9 | 0.3 |
| 25 to 44 years | 32.4 | 31.9 | 31.6 | -0.3 | 18.9 | 18.6 | 18.7 | 0.1 |
| 45 to 54 years | 32.7 | 32.3 | 32.0 | -0.3 | 20.1 | 19.9 | 19.8 | -0.1 |
| 55 years and over (Older workers) | 31.6 | 31.1 | 30.8 | -0.3 | 21.6 | 21.4 | 21.1 | -0.3 |
| EI Claimant Category1 | ||||||||
| Long-Tenured Workers | 34.9 | 34.7 | 34.5 | -0.2 | 18.3 | 17.9 | 17.5 | -0.4 |
| Occasional Claimants | 31.4 | 31.1 | 30.9 | -0.2 | 19.1 | 19.0 | 19.1 | 0.1 |
| Frequent Claimants | 31.2 | 30.4 | 30.1 | -0.3 | 22.2 | 22.0 | 22.0 | 0.0 |
| Canada | 32.2 | 31.7 | 31.4 | -0.3 | 19.6 | 19.4 | 19.4 | 0.0 |
- Note: Totals may not add up due to rounding.
- 1 Long-tenured workers are Employment Insurance (EI) claimants who have paid at least 30% of the maximum annual EI premiums for 7 of the past 10 years and who, over the last 5 years, have collected EI regular or fishing benefits for 35 weeks or less. Frequent claimants are EI claimants who have had three or more claims for EI regular or fishing benefits and have collected benefits for a total of more than 60 weeks in the past 5 years. Occasional claimants are EI claimants who do not meet the requirements for either long-tenured workers or frequent claimants.
- p Preliminary data.
- Source: ESDC, Employment Insurance (EI) administrative data. Data are based on a 10% sample of EI administrative data.
In 2014/2015, the average maximum duration of regular benefits in the territories was 32.9 weeks in the Yukon, and 40.0 weeks in the Northwest Territories and Nunavut. From 2013/2014 to 2014/2015, the territories witnessed decreases in average maximum duration, with Yukon experiencing the largest decline (-8.7 weeks or -21.2%), followed by Northwest Territories (-1.9 week or -4.5%) and Nunavut (-1.6 week or -3.8%).
The large decreases in the average maximum duration of regular benefits in the territories is attributed to improvements in data coverage, which allowed for the introduction of a new unemployment rate calculation methodology that better represents labour market conditions. In the past, the unemployment rate used for the purposes of the EI program in the territories was set at 25.0%. Effective October 12, 2014, the unemployment rate comes from Statistics Canada’s Labour Force Survey and reflects the actual labour market conditions. Also, effective October 12, 2014, EI economic regions for all three territories and Prince Edward Island were redefined by dividing each of the four regions into two EI economic regions, one consisting of the capital area and the remaining consisting of the non-capital area. Table 30 illustrates the impact of these changes, emphasizing the significance of the unemployment rate changes and the effect they had on the range of maximum entitlement during 2014/2015.
| Province and Territory | Employment Insurance Economic Region | Monthly Regional Unemployment Rate1 | Range of Maximum Duration of Regular Benefits | ||||
|---|---|---|---|---|---|---|---|
| April 1, 2014 to October 11, 2014 |
October 12, 2014 to March 31, 2015 |
April 1, 2014 to October 11, 2014 |
October 12, 2014 to March 31, 2015 |
||||
| Minimum (%) |
Maximum (%) |
Minimum (%) |
Maximum (%) |
(Weeks) | (Weeks) | ||
| Prince Edward Island | Charlottetown2 | 9.8 | 12.0 | 8.0 | 8.6 | 20 to 45 | 17 to 42 |
| Prince Edward Island3 | 9.8 | 12.0 | 11.5 | 12.7 | 20 to 45 | 23 to 45 | |
| Yukon | Whitehorse2 | 25.0 | 25.0 | 4.1 | 5.8 | 32 to 45 | 14 to 36 |
| Yukon3 | 25.0 | 25.0 | 7.3 | 9.8 | 32 to 45 | 17 to 44 | |
| Northwest Territories | Yellowknife2 | 25.0 | 25.0 | 3.6 | 4.5 | 32 to 45 | 14 to 36 |
| Northwest Territories3 | 25.0 | 25.0 | 13.1 | 14.2 | 32 to 45 | 26 to 45 | |
| Nunavut | Iqaluit2 | 25.0 | 25.0 | 3.9 | 5.0 | 32 to 45 | 14 to 36 |
| Nunavut3 | 25.0 | 25.0 | 16.8 | 18.2 | 32 to 45 | 32 to 45 | |
- Note: Totals may not add up due to rounding.
- 1 Unemployment rates used for the Employment Insurance program are a moving average of seasonally adjusted monthly rates of unemployment produced by Statistics Canada, as per section 17 of the Employment Insurance Regulations.
- 2 From April 1, 2014 to October 11, 2014, the current EI economic regions "Charlottetown", "Whitehorse", "Yellowknife", and "Iqaluit" did not exist. However, the prevailing unemployment rates (for the purposes of the Employment Insurance Program) for these areas were based on those of the former EI economic regions they were a part of (i.e., Prince Edward Island 9.8-12.0%; Yukon 25.0%; Northwest Territories 25.0%; and Nunavut 25.0%).
- 3 For the purposes of the Employment Insurance program, unemployment rates for the Employment Insurance (EI) economic regions of Yukon, the Northwest Territories and Nunavut were set at 25% up until October 11, 2014.
- Sources: ESDC, Employment Insurance Act, section 12 (for data on maximum duration); and ESDC, Labour Force Survey (for data on EI monthly regional unemployment rates).
The redefining of the previously mentioned EI economic regions had more of an impact on the territories, most notably Yukon, than it did for the only province impacted by the change, Prince Edward Island. For example, in 2014/2015, from the period between April 1, 2014 and October 11, 2014 compared to the period between October 12, 2014 and March 31, 2015, the monthly unemployment rate in the EI economic region of Yukon decreased from 25.0% to 7.3–9.8%, resulting in a drop in the range of maximum entitlement of regular benefits from 32–45 weeks, to 17–44 weeks (see Table 30). During the same period, Whitehorse’s monthly unemployment rate decreased from 25.0% Footnote 84 to 4.1–5.8%, resulting in a drop in the range of maximum entitlement from 32–45 weeks, to 14–36 weeks. The impact of the unemployment rate calculation methodology changes in the Yukon territory (comprising the new EI economic regions of Yukon and Whitehorse), which took effect on October 12, 2014, was the primary reason for the 8.7 week drop in average maximum duration.
Across gender, men had slightly higher levels of average maximum duration of regular benefits than women. Maximum duration of regular benefits was also the highest, on average, among claimants between 25 to 54 years of age. Finally, long-tenured workers Footnote 85 had much longer maximum duration of regular benefits than occasional Footnote 86 and frequent claimants. Footnote 87
In 2014/2015, Nunavut (29.3 weeks), Northwest Territories (25.7 weeks) and Newfoundland and Labrador (25.3 weeks) experienced the largest average actual duration of regular benefits, whereas Alberta (17.4 weeks) and Manitoba (18.0 weeks) witnessed the lowest average of all provinces and territories. Between 2013/2014 and 2014/2015, the largest decrease in average actual duration of regular benefits occurred in the Yukon (-1.5 week), while the largest increase was observed in Alberta (1.1 week) and Saskatchewan (0.7).
The decrease in Yukon is due to changes in the unemployment rate calculation methodology mentioned previously: the average actual duration for the territory was 24.0 weeks in 2013/2014, before dropping to 22.5 weeks in 2014/2015. In addition, the large increase in Alberta and Saskatchewan coincides with the spike observed in these provinces for the number of new regular claims established in 2014/2015. As described in section 2.1, the number of claims jumped by 25.9% in Alberta and by 15.0% in Saskatchewan because of the changing economic conditions affecting the Mining and Oil and Gas Extraction industry. As a result, not only did the number of regular claimants in Alberta and Saskatchewan rise, but the period of time during which the claimants collected regular benefits also increased.
In 2014/2015, actual duration of regular benefits was nearly identical for both men and women, while it was highest among older workers (55 years and older) and frequent claimants.
2.4.1.2 Maximum duration and actual duration of Employment Insurance regular benefits, by industry and employment interval group
In 2014/2015, EI regular claimants in the Mining, Oil and Gas Extraction industry experienced, on average, the largest maximum duration at 34.6 weeks, followed by the Manufacturing industry (34.3 weeks)—similar to results from the previous year (see Table 31). The higher maximum duration levels in these industries can be attributed to a large proportion of claimants with 1,400 or more hours of insurable employment, claimants who are more likely to reside in regions with higher unemployment rates (e.g. 12.1% or higher), and individuals who work, on average, among the highest number of hours, at 41.0 and 37.1 hours per week, including overtime, respectively (refer to Chapter I, Chart 19).
| Industry | Average Maximum Duration of Regular Benefits (Weeks) |
Average Actual Duration of Regular Benefits (Weeks) |
||||||
|---|---|---|---|---|---|---|---|---|
| 2012/2013 | 2013/2014 | 2014/2015 | Change | 2012/2013 | 2013/2014 | 2014/2015p | Change | |
| Goods-producing industries | 33.1 | 32.6 | 32.3 | -0.3 | 19.3 | 19.1 | 19.0 | -0.1 |
| Agriculture, Forestry, Fishing and Hunting | 31.3 | 30.8 | 30.8 | 0.0 | 21.6 | 21.4 | 21.9 | 0.5 |
| Mining, Oil and Gas Extraction | 35.2 | 34.9 | 34.6 | -0.3 | 20.3 | 20.4 | 19.7 | -0.7 |
| Utilities | 34.4 | 33.4 | 31.7 | -1.7 | 17.0 | 18.3 | 17.7 | -0.6 |
| Construction | 32.3 | 31.7 | 31.3 | -0.4 | 18.1 | 18.1 | 17.9 | -0.2 |
| Manufacturing | 34.7 | 34.5 | 34.3 | -0.2 | 20.4 | 19.9 | 19.7 | -0.2 |
| Services-producing industries | 31.7 | 31.2 | 30.9 | -0.3 | 19.8 | 19.5 | 19.5 | 0.0 |
| Wholesale Trade | 34.3 | 34.0 | 33.7 | -0.3 | 23.4 | 22.9 | 22.4 | -0.5 |
| Retail Trade | 32.7 | 32.4 | 32.2 | -0.2 | 22.7 | 22.2 | 22.1 | -0.1 |
| Transportation and Warehousing | 31.3 | 30.5 | 30.3 | -0.2 | 19.3 | 18.7 | 19.1 | 0.4 |
| Finance and Insurance | 34.9 | 34.3 | 34.2 | -0.1 | 24.7 | 24.7 | 23.1 | -1.6 |
| Real Estate, Rental and Leasing | 32.3 | 32.3 | 31.8 | -0.5 | 21.7 | 22.2 | 21.6 | -0.6 |
| Professional, Scientific and Technical Services | 33.7 | 33.4 | 33.1 | -0.3 | 21.3 | 21.3 | 20.8 | -0.5 |
| Business, Building and Other Support Services2 | 31.7 | 31.0 | 30.8 | -0.2 | 21.5 | 21.3 | 21.4 | 0.1 |
| Educational Services | 29.4 | 28.6 | 28.2 | -0.4 | 11.9 | 11.7 | 12.3 | 0.6 |
| Health Care and Social Assistance | 33.0 | 32.5 | 32.2 | -0.3 | 21.5 | 21.3 | 21.3 | 0.0 |
| Information, Culture and Recreation3 | 30.5 | 29.6 | 29.2 | -0.4 | 20.7 | 20.4 | 20.6 | 0.2 |
| Accommodation and Food Services | 31.1 | 30.7 | 30.3 | -0.4 | 22.4 | 22.2 | 22.3 | 0.1 |
| Other Services (except Public Administration) | 32.6 | 32.0 | 31.7 | -0.3 | 21.3 | 21.0 | 21.4 | 0.4 |
| Public Administration | 31.9 | 31.4 | 31.1 | -0.3 | 19.9 | 20.5 | 20.6 | 0.1 |
| Unclassified Industries | 31.3 | 31.3 | 31.1 | -0.2 | 22.1 | 21.5 | 21.3 | -0.2 |
| Canada | 32.2 | 31.7 | 31.4 | -0.3 | 19.6 | 19.4 | 19.4 | 0.0 |
- Note: Totals may not add up due to rounding.
- 1 Includes claims for which at least $1 of regular benefits were paid.
- 2 This industry comprises the industries with codes 55 (management of companies and enterprises) and 56 (administrative and support, waste management and mediation services) from the North American Industry Classification System.
- 3 This industry comprises the industries with codes 51 (information and cultural industries) and 71 (arts, entertainment and recreation) from the North American Industry Classification System.
- P Preliminary data.
- Source: ESDC, Employment Insurance (EI) administrative data. Data are based on a 10% sample of EI administrative data.
In 2014/2015, the average maximum duration of EI regular benefits slightly declined or remained stable for all industries, except for the Utilities industry. EI claimants within the Utilities industry witnessed a decrease in maximum duration of 1.7 week.
Average actual duration levels were highest in the Finance and Insurance industry (23.1 weeks) and lowest in the Educational Services industry (12.3 weeks) in 2014/15. The shorter intervals of actual average duration witnessed in the Educational Services industry are influenced by a shorter maximum duration (28.2 weeks, on average).
The largest variation in average actual duration levels in 2014/2015 occurred in the Finance and Insurance industry (-1.6 week). There were only minor increases and decreases in the other industries.
EI regular claimants accumulate varying hours of insurable employment beyond the minimum requirement, under the Variable Entrance Requirement (VER) provision, and can be divided into three groups: i) short employment interval (0 to 70 hours beyond minimum requirement); ii) medium employment interval (71 to 910 hours beyond minimum requirement); and iii) long employment interval (911 or more hours beyond minimum requirement). As illustrated in Chart 31, in 2014/2015, 44% of all regular claimants had long employment intervals, compared to 53% for those with medium employment intervals. Only 3% of regular claimants had short employment intervals, which implies that a small proportion of claimants just barely qualify for regular benefits.
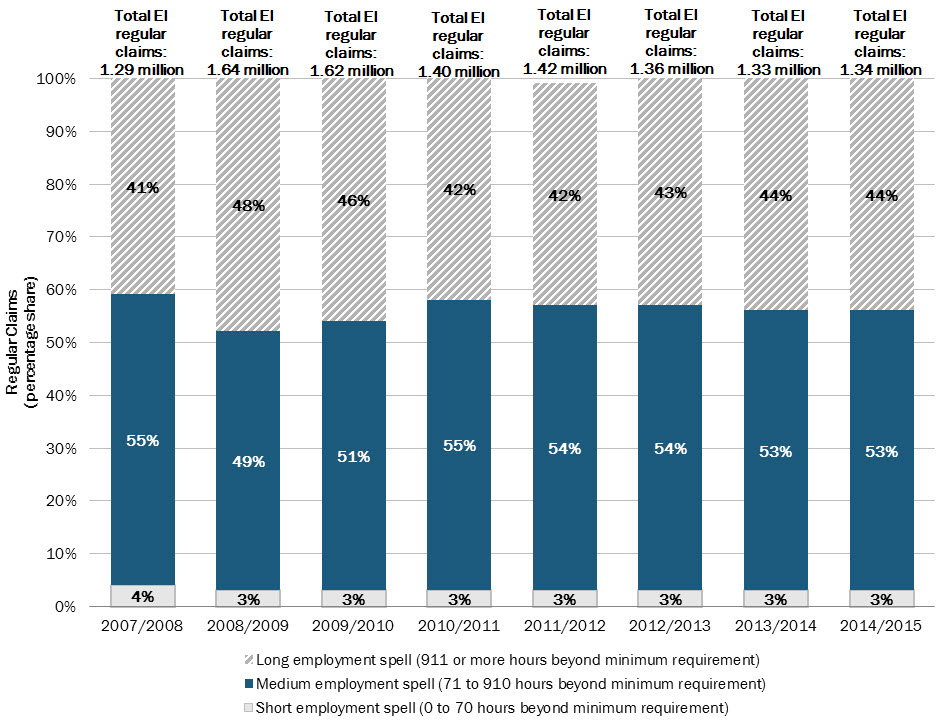
Show Data Table
| Total EI regular claims (millions) | Long employment spell (911 or more hours beyond minimum requirement) | Medium employment spell (71 to 910 hours beyond minimum requirement) | Short employment spell (0 to 70 hours beyond minimum requirement) | |
|---|---|---|---|---|
| 2007/2008 | 1.29 | 41% | 55% | 4% |
| 2008/2009 | 1.64 | 48% | 49% | 3% |
| 2009/2010 | 1.62 | 46% | 51% | 3% |
| 2010/2011 | 1.40 | 42% | 55% | 3% |
| 2011/2012 | 1.42 | 42% | 54% | 3% |
| 2012/2013 | 1.36 | 43% | 54% | 3% |
| 2013/2014 | 1.33 | 44% | 53% | 3% |
| 2014/2015 | 1.34 | 44% | 53% | 3% |
- Note: Totals may not add up due to rounding.
- 1 Includes claims for which at least $1 of regular benefits was paid.
- Source: ESDC, Employment Insurance (EI) administrative data. Data are based on a 10% sample of EI administrative data.
Chart 31 provides a visual illustration of the proportion of regular claimants who have, on average, shorter or longer weeks of duration (e.g. the short employment interval group is linked to shorter duration levels). Since 2007/2008, the share of EI regular claims has remained relatively constant among all three employment interval groups, although the proportion increased slightly for claimants from the long employment interval group, in 2008/2009 and 2009/2010, during the 2008 recession. During the recession, a large number of workers who had permanent full-time work became unemployed, and many of them had accumulated several hundred hours of insurable employment beyond the minimum requirement.
2.4.2 Proportion of regular benefit weeks used Footnote 88
The average proportion of regular benefit weeks used is the number of weeks of regular benefits used (i.e., actual duration) expressed as a proportion of the maximum number of weeks of regular benefits available to EI claimants (i.e., maximum duration). In 2013/2014, claimants used an average of 63.5% of their regular benefit weeks, representing a slight increase compared to 2012/2013 (63.1%), and the fourth consecutive year of increases. Regular claimants have consistently used between 58% and 64% of their regular benefit weeks since 2002/2003.
As in previous periods, in 2013/2014, the average proportion of regular benefit weeks used was highest in the Atlantic provinces, ranging from 67.3% in New Brunswick to 71.4% in Prince Edward Island. Among provinces, claimants in Saskatchewan and Alberta used the lowest proportion of their regular benefit weeks (57.9% and 58.1%, respectively).
Historically, women and men have used a similar proportion of their regular benefit weeks. That was also the case for claims established in 2013/2014, as men used an average of 63.4% of their regular benefit weeks, compared to an average of 63.7% for women.
Older workers (55 years and older) tend to use more of their regular benefit weeks than their younger counterparts. This is due to the fact that, as seen in Chapter I, duration of unemployment is longer, on average, for people from older cohorts than for younger individuals. In 2013/2014, older workers used, on average, 70.8% of their regular benefit weeks, compared to 59.9% for youth (15 to 24 years), 60.7% for claimants between 25 and 44 years, and 63.6% for those between 45 and 54 years.
An EI regular claimant’s reason for job separation may also have an impact on the proportion of their regular benefit weeks used. Approximately 85% of regular claims are established due to a layoff, as the reason for job separation. In 2013/2014, EI regular claimants Footnote 89 who have a layoff as reason for job separation, used on average, 67.8% of their benefit weeks, compared to 77.3% and 81.6% for EI regular claimants with dismissals and voluntary separations, respectively. A reason for job separation which results in a lower proportion of regular benefit weeks used may signal quicker re-employment.
An analysis of the proportion of regular benefit weeks used also indicates that more hours of insurable employment is associated with a lower proportion of regular benefits used. In 2013/2014, claimants with more hours of insurable employment (1,820 hours or more) used 52.0% of their regular benefit weeks, compared to 85.5% for those with less hours (804 hours or less), as shown in table 32.
Furthermore, higher unemployment rates are also associated with a higher proportion of regular benefit weeks used, although the correlation is weaker than for hours of insurable employment, and results do not hold true for all insurable hour groupings. In 2013/2014, claimants in lower unemployment rate regions (8.0% and less) used 62.5% of their regular benefit weeks, compared to claimants in higher unemployment rate regions (12.1% and higher), who used 67.7% of their benefit weeks.
| Hours of Insurable Employment | Regional Unemployment Rate2 | |||
|---|---|---|---|---|
| 8.0% and less | 8.1% to 12.0% | 12.1% and higher | Average | |
| 804 hours and less | 83.7% | 85.2% | 87.5% | 85.5% |
| 805 to 1,819 hours | 64.7% | 64.4% | 65.4% | 64.7% |
| 1,820 hours and higher | 53.4% | 51.1% | 47.8% | 52.0% |
| Canada | 62.5% | 63.4% | 67.7% | 63.5% |
- 1 Includes claims for which at least $1 of regular benefits were paid.
- 2 Unemployment rates used for the Employment Insurance program are a moving average of seasonally adjusted monthly rates of unemployment produced by Statistics Canada, as per section 17 of the Employment Insurance Regulations.
- Source: ESDC, Employment Insurance (EI) administrative data. Data are based on a 10% sample of EI administrative data.
Previous work patterns have an influence on the number of hours of insurable employment accumulated and the proportion of regular benefit weeks used. In 2013/2014, long-tenured workers Footnote 90 used 52.5% of their regular benefit weeks, compared to 63.0% for occasional claimants, Footnote 91 and 75.2% for frequent claimants Footnote 92 as illustrated in Chart 32.
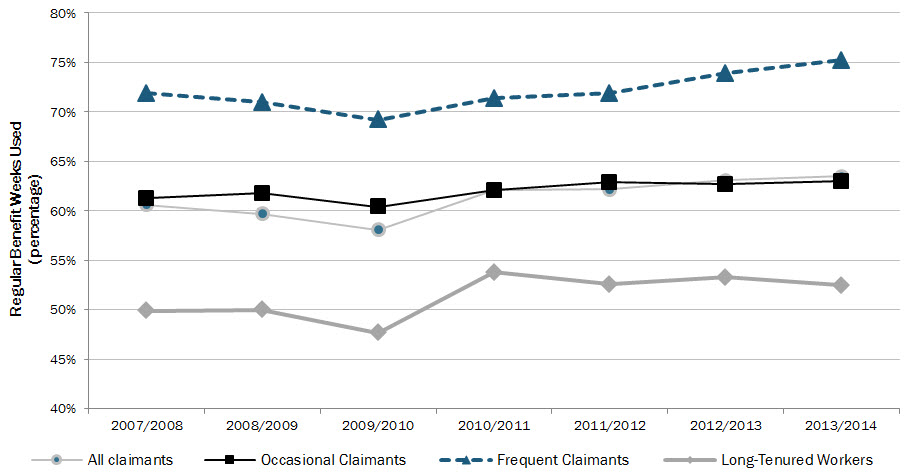
Show Data Table
| All claimants | Occasional Claimants | Frequent Claimants | Long-Tenured Workers | |
|---|---|---|---|---|
| 2007/2008 | 60.6% | 61.3% | 71.9% | 49.9% |
| 2008/2009 | 59.7% | 61.8% | 71.0% | 50.0% |
| 2009/2010 | 58.1% | 60.4% | 69.2% | 47.7% |
| 2010/2011 | 62.1% | 62.1% | 71.4% | 53.8% |
| 2011/2012 | 62.2% | 62.9% | 71.9% | 52.6% |
| 2012/2013 | 63.1% | 62.7% | 73.9% | 53.3% |
| 2013/2014 | 63.5% | 63.0% | 75.2% | 52.5% |
- 1 Long-tenured workers are Employment Insurance (EI) claimants who have paid at least 30% of the maximum annual EI premiums for 7 of the past 10 years and who, over the last 5 years, have collected EI regular or fishing benefits for 35 weeks or less. Frequent claimants are EI claimants who have had three or more claims for EI regular or fishing benefits and have collected benefits for a total of more than 60 weeks in the past 5 years. Occasional claimants are EI claimants who do not meet the requirements for either long-tenured workers or frequent claimants.
- Source: ESDC, Employment Insurance (EI) administrative data. Data are based on a 10% sample of EI administrative data.
In summary, long-tenured workers generally have more weeks of entitlement to regular benefits, collect fewer weeks of benefits and therefore use a lower proportion of their benefit weeks. The situation is reversed for frequent claimants: they have fewer weeks of entitlement, collect more weeks of regular benefits and consequently use a higher proportion of their benefit weeks.
2.5 Exhaustion of Employment Insurance regular benefits Footnote 93
The aim of monitoring exhaustees is to determine whether EI provides adequate temporary income support to those looking for suitable employment. Up to 2012, analysis regarding exhaustion of regular benefits contained in the EI Monitoring and Assessment Report was based on claimants who used all the regular weeks to which they were entitled.
As of the 2012/13 EI Monitoring and Assessment Report, analysis of regular benefits exhaustion was expanded to include claims for which the benefit period ends before all potential regular benefit weeks of entitlement are paid. Footnote 94 As a result, two distinct groups of exhaustees are now scrutinized—claims for which all eligible regular weeks are paid (entitlement exhaustees) and claims that reach the final week of the benefit period before all eligible regular benefits are paid (benefit period exhaustees).
The analysis of regular benefits exhaustion also takes into consideration regular claimants who re-qualify for a new EI claim within 4 weeks of exhausting their prior claim. These claimants experience a relatively short, if any, interruption in EI benefits. Information on these claimants is presented as entitlement exhaustee requalification rates.
In addition, analysis will be provided on the proportion of benefit period exhaustees who requalify for a new EI claim within 4 weeks of reaching the final week of the benefit period (usually 52 weeks) before all benefits are paid. Information on these claimants is presented as benefit period requalification rates.
Analysis of exhaustees is based on regular claims completed in 2014/2015, which facilitates more timely analysis and reporting of exhaustion rates. In reports prior to 2012/2013, analysis of exhaustees was based on claims that were established in a specific year, and in order to utilize mature data, the results were reported considerably later in relation to the reference period.
2.5.1 Entitlement exhaustion of Employment Insurance regular benefits
Of all regular claims completed in 2014/2015, approximately one-third (34.7% or 461,000) of claimants exhausted their entitlement to regular benefits. This represents a slight increase of 0.4 percentage points compared to 2013/2014 (34.3%), and is 7.9 percentage points higher compared to 2010/2011 (26.8%). The lower rate of exhaustion for claims completed in 2010/2011 is attributable to two factors: longer entitlement resulting from automatic adjustments to entitlement levels, linked to higher unemployment rates during the recession and subsequent recovery; and the EI temporary measures extending regular benefits introduced under the Economic Action Plan. Footnote 95
As depicted in Chart 33, the volume of regular claimants who exhausted their entitlement has remained relatively stable over the past four years, ranging between 458,000 and 463,000 from 2011/2012 to 2014/2015.
Of claimants exhausting their EI regular entitlement in 2014/2015, 9.1% were able to establish a subsequent claim within 4 weeks. This proportion has increased every year since 2009/2010 when 5.2% of entitlement exhaustees re-qualified for a new claim. If re-qualifiers are removed from the equation, then the proportion of regular claimants who exhausted their entitlement and were unable to establish a new claim decreases to 31.5% (referred to as an adjusted entitlement exhaustion rate), which is less than the 34.7% of pure entitlement exhaustees mentioned previously. The majority of the analysis that ensues is based on the pure number of entitlement exhaustees.
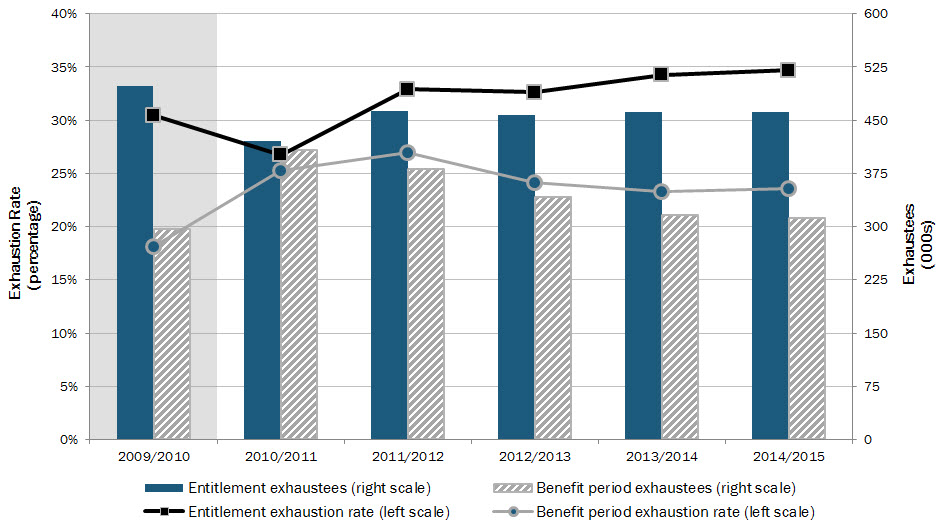
Show Data Table
| Entitlement exhaustees (000) | Benefit period exhaustees (000) | Entitlement exhaustion rate | Benefit period exhaustion rate | |
|---|---|---|---|---|
| 2009/2010 | 498 | 297 | 30.5% | 18.1% |
| 2010/2011 | 421 | 409 | 26.8% | 25.3% |
| 2011/2012 | 463 | 381 | 32.9% | 27.0% |
| 2012/2013 | 458 | 343 | 32.6% | 24.1% |
| 2013/2014 | 462 | 316 | 34.3% | 23.3% |
| 2014/2015 | 461 | 313 | 34.7% | 23.6% |
- Note: Shaded area(s) correspond to recessionary period(s) for Canada's economy.
- Source: ESDC, Employment Insurance (EI) administrative data. Data are based on a 10% sample of EI administrative data.
2.5.1.1 Entitlement exhaustion by demographics
While the national entitlement exhaustion rate remained stable from 2013/2014 to 2014/2015, there were mostly modest changes among the provinces and territories, and the different demographic groups. However, Yukon showed the largest change in entitlement exhaustion, more than doubling to 35.1% in 2014/2015 compared to 2013/2014 (17.4%). This can be attributed to a 8.7 week drop in average maximum duration, which was impacted by the introduction of a new unemployment rate calculation methodology that better represents labour market conditions, effective on October 12, 2014. Footnote 96
Nunavut exhibited the highest entitlement exhaustion rate (42.2%) while Saskatchewan exhibited the lowest rate (28.3%). Table 33 presents entitlement exhaustion rates by various demographic groups for 2014/2015. Newfoundland and Labrador exhibited the highest requalification rate at 24.3%, while Nunavut experienced the lowest rate (2.1%).
Women have higher entitlement exhaustion rates than men, as they accumulate on average fewer hours of insurable employment, resulting in fewer weeks of entitlement to regular benefits. Claimants aged 55 and older tend to have the highest entitlement exhaustion rate, which is likely attributable to the challenges they face in securing new employment following a job loss.
The likelihood of entitlement exhaustion varies for different categories of EI claimants. For instance, frequent claimants had an exhaustion rate of 38.7% in 2014/2015, a small increase compared to 2013/2014 (37.3%). Also, just over one-fifth of these claimants were able to re-qualify for a new EI claim. In comparison, entitlement exhaustion rates were 35.7% for occasional claimants, and 27.1% for long-tenured workers, whi
| Entitlement Exhaustion Rate (%) |
Benefit Period Exhaustion Rate (%) |
|||||
|---|---|---|---|---|---|---|
| 2012/2013 | 2013/2014 | 2014/2015 | 2012/2013 | 2013/2014 | 2014/2015 | |
| Province and Territory | ||||||
| Newfoundland and Labrador | 26.9% | 33.2% | 37.7% | 43.4% | 39.4% | 34.5% |
| Prince Edward Island | 34.7% | 45.1% | 40.1% | 31.7% | 28.0% | 27.6% |
| Nova Scotia | 32.9% | 39.5% | 38.3% | 30.2% | 28.0% | 25.7% |
| New Brunswick | 26.5% | 29.5% | 30.5% | 41.0% | 37.8% | 39.5% |
| Quebec | 30.7% | 33.2% | 33.8% | 27.8% | 25.8% | 26.7% |
| Ontario | 35.2% | 35.2% | 35.6% | 17.9% | 18.9% | 18.0% |
| Manitoba | 32.1% | 31.4% | 33.3% | 17.5% | 19.4% | 22.2% |
| Saskatchewan | 26.9% | 26.7% | 28.3% | 19.0% | 21.2% | 23.7% |
| Alberta | 33.2% | 31.4% | 29.3% | 13.2% | 14.2% | 15.8% |
| British Columbia | 37.4% | 38.3% | 37.4% | 18.3% | 18.1% | 20.8% |
| Yukon | 15.0% | 17.4% | 35.1% | 31.1% | 25.0% | 24.8% |
| Northwest Territories | 34.3% | 27.3% | 30.2% | 29.7% | 29.0% | 24.0% |
| Nunavut | 35.6% | 39.2% | 42.2% | 25.8% | 21.1% | 14.0% |
| Gender | ||||||
| Men | 30.4% | 32.7% | 33.2% | 26.1% | 25.2% | 24.9% |
| Women | 35.9% | 36.7% | 36.9% | 21.1% | 20.5% | 21.4% |
| Age | ||||||
| 24 years and under (Youth) | 31.4% | 32.5% | 32.1% | 19.0% | 18.0% | 18.5% |
| 25 to 44 years | 30.9% | 32.2% | 32.1% | 21.6% | 21.1% | 21.2% |
| 45 to 54 years | 31.3% | 32.7% | 33.7% | 27.6% | 26.8% | 27.1% |
| 55 years and older (Older Workers) | 38.7% | 41.2% | 42.0% | 28.0% | 26.5% | 26.6% |
| EI Claimant Category1 | ||||||
| Long-Tenured Workers | 27.4% | 28.1% | 27.1% | 19.7% | 20.4% | 21.6% |
| Occasional Claimants | 35.4% | 35.4% | 35.7% | 19.6% | 19.6% | 19.9% |
| Frequent Claimants | 31.8% | 37.3% | 38.7% | 39.5% | 34.5% | 34.2% |
| Seasonality | ||||||
| Seasonal2 | 22.0% | 25.8% | 26.8% | 37.2% | 36.1% | 36.2% |
| Non-Seasonal | 37.1% | 38.1% | 38.3% | 18.7% | 17.6% | 18.2% |
| Canada | 32.6% | 34.3% | 34.7% | 24.1% | 23.3% | 23.6% |
le requalification rates were 5.6% and 3.0%, respectively.
- 1 Long-tenured workers are EI claimants who have paid at least 30% of the maximum annual EI premiums for 7 of the past 10 years and who, over the last 5 years, have collected EI regular or fishing benefits for 35 weeks or less. Frequent claimants are EI claimants who have had three or more claims for EI regular or fishing benefits and have collected benefits for a total of more than 60 weeks in the past 5 years. Occasional claimants are EI claimants who do not meet the requirements for either long-tenured workers or frequent claimants.
- 2 Seasonal regular claims are those claims, for which at least $1 of regular benefits was paid, by claimants who have established at least three regular or fishing claims in the last five years, two of which had to have started during the same period of year as the current claim. This period is defined as the 8 weeks before and 8 weeks after the current claim commenced, for a total window of 17 weeks.
- Source: ESDC, Employment Insurance (EI) administrative data. Data are based on a 10% sample of EI administrative data.
2.5.1.2 Entitlement exhaustion by the variable entrance requirement
Entitlement exhaustion rates are negatively correlated with the number of weeks of regular benefits entitlement, which is a function of both the number of hours of insurable employment accumulated and the regional unemployment rate. Footnote 97
As illustrated in Table 34, in 2014/2015, entitlement exhaustion rates decreased significantly as the number of hours of insurable employment increased with the exception of claimants who accumulated 1,800 hours or more. For instance, 67.6% of regular claimants with 420 to 769 hours exhausted their entitlement, compared to 21.9% of regular claimants with 1,470 to 1,819 hours. The entitlement exhaustion rate for regular claimants with more than 1,820 hours was slightly higher at 25.2%, likely because those with more than 1,820 hours face a more significant job loss shock. These claimants may be long-tenured workers facing more significant challenges in finding new employment.
Table 34 also shows that entitlement exhaustion rates vary based on the unemployment rate, with rates ranging from 25.1% in regions with an unemployment rate of 16.1% or higher, to 36.3% in regions with an unemployment rate between 8.1% and 10.0%.
Exhaustion rates tend to be low when both the unemployment rates and the number of hours of insurable employment are high. Under these circumstances, regular claimants have a higher maximum duration of regular benefit weeks. For example, only 12.1% of regular claimants exhausted their benefit weeks, if they resided in regions with 16.1% or higher unemployment rates, and accumulated between 1,470 and 1,819 hours of insurable employment. In contrast, 71.8% of regular claimants exhausted their benefit weeks, if they resided in regions with unemployment rates between 8.1% and 10%, and accumulated between 420 and 769 hours of insurable employment.
| Hours of Insurable Employment | Regional Unemployment Rate1 | |||||
|---|---|---|---|---|---|---|
| 0.1% - 8.0% |
8.1% - 10.0% |
10.1% - 12.0% |
12.1% - 16.0% |
16.1% or more |
Average | |
| 420 to 769 hours | 63.0% | 71.8% | 68.3% | 68.6% | 51.7% | 67.6% |
| 770 to 1,119 hours | 54.2% | 56.4% | 51.8% | 34.9% | 25.8% | 51.9% |
| 1,120 to 1,469 hours | 31.1% | 30.3% | 25.9% | 18.9% | 15.8% | 29.3% |
| 1,470 to 1,819 hours | 23.4% | 22.3% | 14.5% | 14.7% | 12.1% | 21.9% |
| 1,820 hours and higher | 27.1% | 25.8% | 16.0% | 14.8% | 15.4% | 25.2% |
| Canada | 34.0% | 36.3% | 34.1% | 34.9% | 25.1% | 34.7% |
- 1 Unemployment rates used for the Employment Insurance program are a moving average of seasonally adjusted monthly rates of unemployment produced by Statistics Canada, as per section 17 of the Employment Insurance Regulations.
- Source: ESDC, Employment Insurance (EI) administrative data. Data are based on a 10% sample of EI administrative data.
2.5.1.3 Entitlement exhaustion and requalification rates
The entitlement exhaustee requalification rate refers to regular claimants who exhaust their EI entitlement but are able to establish a new claim for EI benefits within four weeks. Similar to entitlement exhaustion rates, requalification rates vary significantly depending on a claimant’s work force attachment (hours of insurable employment) and the regional unemployment rate. As shown in Table 35, the requalification rate for claimants who exhausted their entitlement with between 420 and 769 hours of insurable employment was 15.0% in 2014/2015, compared to 3.2% or less for claimants who established their claims with 1,470 or more hours of insurable employment. Similarly, 24.6% of entitlement exhaustees in regions with unemployment rates between 12.1% and 16.0% established a subsequent claim within four weeks after exhaustion, versus approximately 6.0% of entitlement exhaustees in regions with an unemployment rate of 8.0% or lower.
| Hours of Insurable Employment | Regional Unemployment Rate1 | |||||
|---|---|---|---|---|---|---|
| 0.1% - 8.0% |
8.1% - 10.0% |
10.1% - 12.0% |
12.1% - 16.0% |
16.1% or more |
Average | |
| 420 to 769 hours | 7.0% | 8.3% | 15.9% | 26.0% | 24.6% | 15.0% |
| 770 to 1,119 hours | 8.4% | 11.1% | 19.8% | 35.7% | 14.4% | 12.3% |
| 1,120 to 1,469 hours | 9.9% | 10.5% | 19.3% | 14.2% | 10.3% | 11.0% |
| 1,470 to 1,819 hours | 3.0% | 2.9% | 4.4% | 6.1% | 4.6% | 3.2% |
| 1,820 hours and higher | 0.5% | 0.5% | 1.4% | 0.8% | 1.3% | 0.6% |
| Canada | 6.0% | 7.4% | 15.7% | 24.6% | 16.2% | 9.1% |
- 1 Unemployment rates used for the Employment Insurance program are a moving average of seasonally adjusted monthly rates of unemployment produced by Statistics Canada, as per section 17 of the Employment Insurance Regulations.
- Source: ESDC, Employment Insurance (EI) administrative data. Data are based on a 10% sample of EI administrative data.
2.5.1.4 Entitlement exhaustion of Employment Insurance regular benefits – seasonal claimants and seasonal gappers
Historically, entitlement exhaustion rates have always been lower for seasonal claimants than for non-seasonal claimants. That held true for claims completed in 2014/2015, as the entitlement exhaustion was at 26.8% for seasonal claimants and 38.3% for non-seasonal claimants (see Table 33).
The variance in exhaustion rates between seasonal and non-seasonal regular claimants is due to the fact that when seasonal claimants are laid off, most have a job lined up for the next season and will return to work at approximately the same time the following year. However, most non-seasonal regular claimants have to look for work once they are laid off, and are therefore more likely to rely on EI for longer periods and exhaust their benefit entitlement.
The level of entitlement and duration of regular benefits have a particular impact on seasonal claimants who have a combined work-benefit period of less than 52 weeks per year. This group of claimants is referred to as “seasonal gappers.” These workers may go through a period where neither work income nor EI is available to them, if the seasonal job to which they are returning is not yet available when they exhaust their EI benefits.
Among individuals who completed claims in 2014/2015, there were 16,080 seasonal gappers, representing slightly over 1% of all regular claimants who completed a claim in 2014/2015. Seasonal gappers who completed claims in 2014/2015 averaged 18.9 weeks of work and 26.6 weeks of EI benefits, including the waiting period, resulting in an average gap of 6.5 weeks. Over half (56.2%) of seasonal gappers experienced a gap of less than 6 weeks, 26.7% a gap of 6 to 11 weeks and 17.1% a gap of 12 weeks or more.
As mentioned in previous reports, the likelihood of becoming a seasonal gapper is higher in regions with high unemployment, where claimants require fewer hours to qualify for benefits, and there can be extended periods of unemployment between seasons. The Atlantic provinces were overrepresented in regard to seasonal gappers (27%), while only representing 15% of all regular claims completed in 2014/2015. For the same period, Ontario accounted for 21% of seasonal gappers, but was actually underrepresented as the province accounted for 30% of regular claims in Canada.
2.5.2 Benefit period exhaustion of Employment Insurance regular benefits
As stated previously, benefit period exhaustees refers to regular claims that reach their final week of the benefit period before all regular benefits are paid. Among all regular claims completed in 2014/2015, 23.6% (or 313,000) of claimants exhausted their benefit period before receiving their full entitlement of regular benefit weeks. This represents a slight increase from 2013/2014 (23.3%).
Benefit period exhaustion rates are influenced by variables affecting the duration of an EI claim, such as regular benefit entitlement, weeks worked while on claim and usage of special benefits. The relationship between these factors and the exhaustion of the benefit period is examined in further detail in section 2.5.4.
2.5.2.1 Benefit period exhaustion by demographics
Among provinces and territories, there were fluctuations in the benefit period exhaustion rate in 2014/2015, with the largest increases occurring in Manitoba (+2.8 percentage points) and British Columbia (+2.7 percentage points), and the largest decreases occurring in Nunavut (-5.1 percentage points) and Northwest Territories (-5.0 percentage points), as shown in Table 33 in section 2.5.1.1. There were modest increases and decreases in the benefit period exhaustion rate across gender and all age groups. New Brunswick experienced the highest benefit period exhaustion rate (39.5%), while Nunavut exhibited the lowest rate (14.0%).
Men tend to have higher benefit period exhaustion rates than women, as they are generally entitled to more weeks of regular benefits. They are also more likely to work while on claim and defer EI benefits. Claimants aged 45 and older tend to have a higher benefit period exhaustion rate than younger claimants. Since 2010/2011, the benefit period exhaustion rate for claimants aged 45 and older decreased more significantly than for claimants under 45 years of age.
As shown in Table 33, the likelihood of exhausting the benefit period before full entitlement was paid varies greatly for different categories of EI claimants. For claims completed in 2014/2015, 21.6% of long-tenured workers and 19.9% of occasional claimants exhausted their benefit period, while 34.2% of frequent claimants exhausted their benefit period, of whom approximately six out of seven re-qualified for a new claim. Although the average duration of regular benefits for seasonal claimants is shorter than that for non-seasonal claimants, 36.2% of seasonal claimants exhausted their benefit period in 2014/2015 compared to 18.2% of non-seasonal claimants. The benefit period exhaustion rate for seasonal claimants has decreased slightly from its high in 2011/2012 at 38.8%, but remains higher than in 2009/2010 when it stood at 25.4%.
2.5.2.2 Benefit period exhaustion by the variable entrance requirement
As illustrated in Table 36, benefit period exhaustion rates are moderately correlated with the number of hours of insurable employment used to establish the claim for benefit. Claimants who accumulated between 420 and 769 hours in 2014/2015 experienced a 11.4% benefit period exhaustion rate, compared to about 28%-29% of claimants who accumulated between 1,120 and 1,819 hours. However, it decreased to 22.6% for claimants with more than 1,820 hours. These are similar patterns to last year.
Benefit period exhaustion rates are positively correlated to the unemployment rate. It varied more significantly by unemployment rates than by hours of insurable employment in 2014/2015 as claimants from regions with an unemployment rate of 8.0% or lower experienced an average benefit period exhaustion rate of 19.4%. By comparison, claimants in regions with unemployment rates of 16.1% or higher incurred average benefit period exhaustion rates more than twice as high (42.4%).
| Hours of Insurable Employment | Regional Unemployment Rate1 | |||||
|---|---|---|---|---|---|---|
| 0.1% - 8.0% |
8.1% - 10.0% |
10.1% - 12.0% |
12.1% - 16.0% |
16.1% or more |
Average | |
| 420 to 769 hours | 9.4% | 8.7% | 7.6% | 12.6% | 23.3% | 11.4% |
| 770 to 1,119 hours | 13.0% | 15.3% | 21.5% | 38.0% | 49.4% | 19.4% |
| 1,120 to 1,469 hours | 23.7% | 27.7% | 36.4% | 48.3% | 51.3% | 28.9% |
| 1,470 to 1,819 hours | 23.6% | 26.6% | 39.4% | 51.4% | 46.7% | 27.9% |
| 1,820 hours and higher | 18.2% | 21.3% | 37.1% | 40.9% | 39.0% | 22.6% |
| Canada | 19.4% | 21.8% | 29.4% | 35.2% | 42.4% | 23.6% |
- 1 Unemployment rates used for the Employment Insurance program are a moving average of seasonally adjusted monthly rates of unemployment produced by Statistics Canada, as per section 17 of the Employment Insurance Regulations.
- Source: ESDC, Employment Insurance (EI) administrative data. Data are based on a 10% sample of EI administrative data.
Higher benefit period exhaustion rates in regions with high unemployment rate reflects a greater usage of EI benefits and a greater proportion of claimants living in these regions working while on claim. While approximately 51% of all regular claimants worked while on claim, the figure was significantly higher (60%) for claimants residing in regions with unemployment rates of 10.1% or higher. As outlined in section 2.3.1, claimants who work while on claim and have sufficient earnings can defer their week of EI benefits to a future week within the same benefit period.
2.5.2.3 Benefit period exhaustion and requalification rates
Compared to entitlement exhaustees whose requalification rate Footnote 98 was 9.1% in 2014/2015, benefit period exhaustees had an average requalification rate Footnote 99 of 70.5%, as shown in Table 37. The requalification rate has continuously increased since 2010/2011 when it stood at 58.2%. Requalification rates vary by demographics, as 85.2% of frequent claimants who exhausted their benefit period re-qualified for a new EI claim, compared to 59.5% of long-tenured workers.
Moreover, as shown in Table 37, benefit period exhaustees who had accumulated more hours of insurable employment and/or who lived in a region with a lower unemployment rate were less likely to re-qualify for a new EI claim in 2014/2015.
| Hours of Insurable Employment | Regional Unemployment Rate1 | |||||
|---|---|---|---|---|---|---|
| 0.1% - 8.0% |
8.1% - 10.0% |
10.1% - 12.0% |
12.1% - 16.0% |
16.1% or more |
Average | |
| 420 to 769 hours | 63.9% | 60.8% | 74.3% | 77.5% | 83.3% | 72.8% |
| 770 to 1,119 hours | 74.7% | 73.9% | 82.4% | 87.0% | 84.5% | 79.4% |
| 1,120 to 1,469 hours | 81.2% | 78.1% | 83.9% | 80.7% | 83.7% | 80.9% |
| 1,470 to 1,819 hours | 69.4% | 64.6% | 73.5% | 73.8% | 71.7% | 69.1% |
| 1,820 hours and higher | 48.6% | 45.9% | 61.9% | 69.8% | 69.5% | 53.1% |
| Canada | 67.8% | 65.2% | 75.3% | 78.7% | 79.3% | 70.5% |
- 1 Unemployment rates used for the Employment Insurance program are a moving average of seasonally adjusted monthly rates of unemployment produced by Statistics Canada, as per section 17 of the Employment Insurance Regulations.
- Source: ESDC, Employment Insurance (EI) administrative data. Data are based on a 10% sample of EI administrative data.
2.5.3 Profile of claimants by exhaustion type (entitlement and benefit period)
As stated previously, more than two-thirds of benefit period exhaustees re-qualified Footnote 100 for a new EI claim in 2014/2015. To do so, these claimants had to accumulate sufficient hours of insurable employment during their qualifying period, which corresponded to the benefit period that they exhausted. As shown in Table 38, nearly three-quarters (72%) of benefit period exhaustees worked while on claim and averaged 16.0 weeks of work.
On average, in 2014/2015, non-exhaustees used 13.1 weeks of regular benefits, while entitlement exhaustees used 27.7 weeks. Benefit period exhaustees used 18.7 weeks of regular benefits, a figure that was comparable to that for all regular claimants (19.2 weeks).
On average, non-exhaustees received 41.8% of their regular entitlement (i.e. weeks of benefits) with nearly two-thirds (62.1%) receiving less than 49.5% of their regular benefit entitlement. In comparison, entitlement exhaustees used all of their regular entitlement, by definition, while benefit period exhaustees used 56.0% of their regular benefits entitlement, with 56.2% of claimants using at least 50% of their regular benefits entitlement.
Working while on claim and receiving special benefits influence the benefit period exhaustion rate, since they lengthen claim duration. Of all benefit period exhaustees, 16.1% received special benefits in 2014/2015, a figure that was significantly higher than for all regular claimants (10.8%). When special benefits are combined with regular benefits, the probability of reaching the final week of the 52-week benefit period increases. However, those who collected special benefits were far less likely to re-qualify for a new EI claim as 38.7% of benefit period exhaustees who claimed special benefits re-qualified for a new claim, compared to 76.6% who did not.
| All Regular Claims | Non-Exhaustees | Entitlement Exhaustees | Benefit Period Exhaustees | |
|---|---|---|---|---|
| Exhaustion Rate | Not applicable1 | Not applicable1 | 34.7% | 23.6% |
| Gap To Next Claim | ||||
| Re-qualifiers (New Claim) | 19.3% | 1.1% | 9.1% | 70.5% |
| Non Re-qualifiers (No New Claim) | 80.7% | 98.9% | 90.9% | 29.5% |
| Adjusted Exhaustion Rate | Not applicable1 | Not applicable1 | 31.5% | 6.8% |
| Proportion of Claims Involving at Least One Week Worked While On Claim | 50.6% | 50.4% | 36.2% | 72.3% |
| Average Weeks Working While On Claim | 11.5 | 7.9 | 12.0 | 16.0 |
| Average Weeks of Regular Benefits Paid | 19.2 | 13.1 | 27.7 | 18.7 |
| Mixed Claims (Collected Special Benefits) | 10.8% | 8.8% | 9.8% | 16.1% |
| Percentage of EI Entitlement Used | ||||
| Less than 24.5% | 17.7% | 32.7% | Not applicable | 13.7% |
| 24.5% to less than 49.5% | 19.1% | 29.4% | Not applicable | 26.2% |
| 49.5% to less than 74.5% | 15.2% | 19.3% | Not applicable | 29.0% |
| 74.5% or more | 48.0% | 18.7% | 100.0% | 31.1% |
| Averaged Entitlement Used | 63.0% | 41.8% | 100.0%2 | 56.0% |
- Note: Totals may not add up due to rounding.
- 1 By definition, exhaustion rates are only applicable for exhaustee populations (entitlement and benefit period exhaustees).
- 2 By definition, entitlement exhaustees have used all their entitled weeks of regular benefits.
- Source: ESDC, Employment Insurance (EI) administrative data. Data are based on a 10% sample of EI administrative data.
2.5.4 Aggregated exhaustion of Employment Insurance regular benefits
The aggregated exhaustion of EI regular benefits reflects all claims for which claimants ceased to receive EI regular benefits payments because all weeks of entitlement were paid or because the final week of the benefit period was reached. In 2014/2015, the aggregated exhaustion rate was 58.2%, a slight increase compared to 2013/2014 (57.6%). Removing claimants who are able to re-qualify for EI, the aggregate adjusted rate of exhaustion declines to 38.5%. The exhaustion rates examined and reported in this section reflect the proportion of regular claimants who no longer have access to EI regular benefits. However, it is important to note some of these individuals will have found or returned to work and as a result have no immediate need for EI regular benefits. There is insufficient administrative data to report on the proportion of claimants who exhaust benefits (entitlement or benefit period) and return to work within a short period of time.
2.6. Connecting Canadians with available jobs provision
The Connecting Canadians with Available Jobs (CCAJ) initiative, announced in Budget 2012, consists of a number of actions that were taken with the objective to better connect unemployed Canadians with jobs where they live. The CCAJ initiative was implemented in January 2013 and introduced the following four measures:
- Enhancements to Job Alerts and labour market information to support job-search activities;
- Legislative changes and new integrity measures to strengthen claimants’ obligations to undertake a “reasonable job search” for “suitable employment”;
- Improved connections between the Temporary Foreign Worker Program (TFWP) and the EI program to ensure Canadians are considered before temporary foreign workers; and
- Collaboration projects with interested provinces and territories to make employment supports available to EI claimants earlier in their claim.
2.6.1 Enhanced job alerts
EI claimants may, on a voluntary basis, sign up to receive daily Job Alerts, which include job postings and other labour market information. Launched on January 6, 2013 the Enhanced Job Alerts (EJA) service is a free email service that proactively sends subscribers new available jobs up to twice a day. The EJA service provides a comprehensive list of available jobs in an individual’s chosen occupation(s) and community(ies) by incorporating job postings from Job Bank and private sector job boards. Claimants also receive additional labour market information, such as similar occupations for which they may be qualified, that can help them decide how and when to expand their job search. The EJA service is also available to individuals who are not EI claimants, but are interested in receiving job postings.
In addition to this Job Alerts service, there are other on-line tools available on the Job Bank website that provide valuable labour market information to help unemployed or underemployed individuals in making career decisions. Examples of available labour market information are occupational reports containing wages and outlooks, career tools to help analyze what careers a person may be interested in, as well as data on top advertised jobs.
From April 1, 2014 to March 31, 2015, there were 578 million job alerts (+392%) sent to 583,000 subscribers (+91.0%). In addition, 142,277 (-12.3%) employers created 1,265,057 (-13.7%) new job postings that were available through the Job Bank web site.
Job alerts exit survey
The Job Alerts Exit Survey is a voluntary survey sent to a user when they unsubscribe from Job Alerts. All users who unsubscribe receive the survey with close to 70% of users completing it.
In 2014/2015, 104,989 users (+93.4%) completed the Job Alerts Exit Survey. Of those who responded, 34,208 (32.6%) indicated that they were EI claimants, while 19,892 (58.1%) of these claimants answered that they had found a job while subscribing to Job Alerts.
2.6.2 Employment Insurance claimants’ responsibilities
Under the CCAJ initiative, changes were made to update the EI Regulations to clarify the responsibilities of EI claimants receiving regular and fishing benefits, by defining what constitutes a reasonable job search and suitable employment. The criteria used to define suitable employment include type of work, wages, commuting time, working conditions, hours of work and personal circumstances. Requirements regarding the type of work and wages vary based on a claimant’s previous use of the EI program, as well as the time spent on claim. Under these definitions, EI claimants are categorized according to their use of the EI program. For more information regarding the national distribution of the regular claims by EI claimant category, please refer to section 1.5 of Chapter 2.
Claimant Information sessions
In February 2013, Claimant Information (CI) sessions were re-designed and became tailored to each of the three EI claimant groups; frequent claimants, occasional claimants and long-tenured workers. Claimants directed to CI sessions are identified based upon local job-demand in their previous occupation and availability of work.
From April 1, 2014 to March 31, 2015, 10,195 CI sessions were held nationally, with 168, 531 claimants directed to attend.
For analytical purposes, claimants who are directed to information sessions are compared to a random sample of claimants with similar attributes who are not directed to information sessions (e.g. control group). A review of claims that started from April 2013 to March 2014 and have since completed showed that EI claimants directed into CI sessions had on average 1 less week of benefits paid than those not directed to report and were 1.3 times more likely to report having found work.
Disqualification and disentitlement
EI claimants have always been required to undertake a job search for suitable employment. In addition, the Employment Insurance Act stipulates that individual can be disentitled from EI benefits for a variety of reasons. The CCAJ initiative did not add new reasons or operational codes for disentitling a claimant. As such, there is no administrative data that precisely identifies EI claimants that have been denied benefits as a result of the regulations and CI sessions that were introduced as part of the CCAJ initiative. However, two specific disentitlements are closely related to the new regulations and the refined CI sessions, which can provide some insight in terms of the impact on EI claimants. In fiscal year 2014 a total of 1,250 disentitlements were imposed because claimants failed to search for work (1,070) or refused to accept suitable employment (180). This represents a small proportion (0.08%) of total EI regular and fishing claims established, and does not take into consideration that in some situations, benefits would have been reinstated once the claimant demonstrated they were fulfilling their responsibility.
2.6.3 Improved coordination between Employment Insurance and Temporary Foreign Worker programs
Measures to strengthen the links between the EI program and the Temporary Foreign Worker program were implemented as part of the CCAJ initiative. The improved coordination between the two programs is intended to better connect employers and those claiming EI and ensure qualified Canadians are considered before hiring temporary foreign workers.
2.6.4 Collaboration with provinces and territories
Budget 2012, under the CCAJ initiative, also included a commitment to “work with provincial and territorial governments to make employment supports available to EI claimants earlier in their claim period” to facilitate faster returns to work and savings to the EI Operating Account. In support of this commitment, ESDC developed collaboration projects with British Columbia and Manitoba in 2013 and, in 2013/14, tested the impact of early interventions in the delivery of active measures on EI claimants. Results suggest that early intervention is most effective when focused on clients with relatively high re-employment potential.
2.7 Employment Insurance regular benefits and seasonal workers
2.7.1 Seasonal workers
Due to definitional differences between seasonal claims and seasonal workers by different entities, it is possible to see variation in figures within this section. The Statistics Canada Labour Force Survey (LFS) defines seasonal workers as those whose employment is in an industry where employment levels rise and fall with the seasons.
According to the LFS, there were 423,100 seasonal workers in 2014/2015 Footnote 101 , a 2.0% decrease from 2013/2014. The number of seasonal workers has dropped to its lowest point since 2009/2010 (420,000), and remains slightly higher than the levels witnessed prior to the onset of the 2008 recession (418,900 in 2007/2008).
Seasonal workers represented 20.9% of all temporary workers and 2.8% of all employees in 2014/2015, reaching its lowest proportions in the last decade, according to the LFS. During the last decade, among all temporary workers, the proportion of seasonal workers has ranged between 20.9% and 23.7%; among all employees, the proportion of seasonal workers has fluctuated between 2.8% and 3.1%.
A study in seasonal employment Footnote 102 found that seasonal workers were more likely to be male, to have less education and to have fewer dependants than workers in general. These workers were also more prominent in the Atlantic provinces and in primary industries.
2.7.2 Seasonal claims made by Employment Insurance regular benefit claimants
EI seasonal claimants are claimants who have established at least three regular or fishing claims in the last five years, two of which had to have started during the same period of year as the current claim. This period is defined as the 8 weeks before and 8 weeks after the current claim established, for a total window of 17 weeks. There were 446,000 seasonal claims in 2014/2015, of which 26,000 Footnote 103 were from EI fishing claims. The analysis in the following subsections will focus on Seasonal Regular claims, excluding fishing benefits.
EI administrative data show that there were 420,000 seasonal regular claims in 2014/2015. These seasonal regular claims represented 31% of regular claims established. After increasing for the last five consecutive years, the share of seasonal claims returned to the pre-recession level of 2007/2008. Historically, labour market conditions have had less of an effect on the volume of seasonal claims than on the volume of non-seasonal regular claims, as shown in Chart 34.
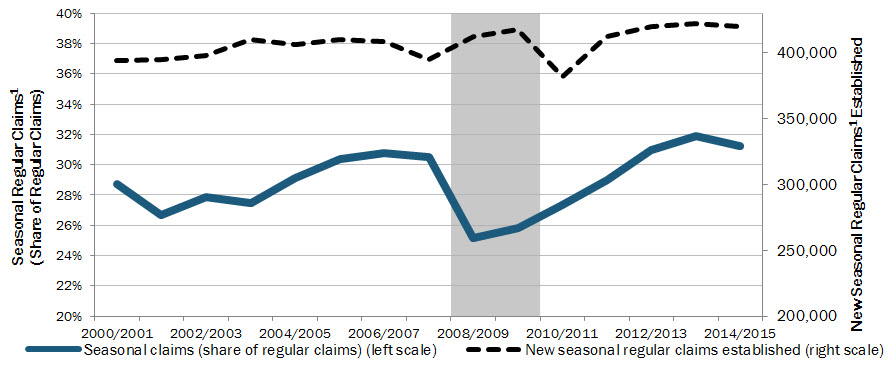
Show Data Table
| Seasonal claims (share of regular claims) | New seasonal regular claims established | |
|---|---|---|
| 2000/2001 | 29% | 394,140 |
| 2001/2002 | 27% | 394,710 |
| 2002/2003 | 28% | 397,920 |
| 2003/2004 | 27% | 410,430 |
| 2004/2005 | 29% | 406,000 |
| 2005/2006 | 30% | 410,030 |
| 2006/2007 | 31% | 408,490 |
| 2007/2008 | 31% | 395,160 |
| 2008/2009 | 25% | 412,660 |
| 2009/2010 | 26% | 417,430 |
| 2010/2011 | 27% | 381,810 |
| 2011/2012 | 29% | 412,230 |
| 2012/2013 | 31% | 419,930 |
| 2013/2014 | 32% | 422,410 |
| 2014/2015 | 31% | 419,720 |
- 1 Seasonal regular claims are those claims, for which at least $1 of regular benefits was paid, by claimants who have established at least three regular or fishing claims in the last five years, two of which had to have started during the same period of year as the current claim. This period is defined as the 8 weeks before and 8 weeks after the current claim commenced, for a total window of 17 weeks.
- Source: ESDC, Employment Insurance (EI) Administrative Data. Data are based on a 10% sample of EI administrative data.
As illustrated in Table 39, seasonal claims are more common among workers aged 45 and older, in the Atlantic provinces and Quebec, and in the goods sector. The construction, manufacturing and education industries account for over half of all EI seasonal regular claims.
In terms of volume, Quebec has the highest incidence of seasonality; the province accounted for 159,000 (37.9%) of all seasonal regular claims in 2014/15, compared with 265,000 (29%) of all non-seasonal regular claims. Conversely, Ontario accounted for 97,000 (23%) of seasonal regular claims, and 294,000 (32%) of non-seasonal regular claims. The disparity is partially explained by differences in the seasonality of their Construction and Manufacturing industries. For instance, 47,000 (or 52%) of all regular claims in Quebec’s Construction industry and 14,000 (30%) of all regular claims in Quebec’s Manufacturing industry were seasonal in 2014/15. In comparison, 23,000 (or 33%) and 5,000 (12%) of all regular claims in Ontario’s Construction and Manufacturing industry, respectively, were seasonal. For the rest of Canada, 32,000 (or 30%) of all Construction and 17,000 (34%) of all Manufacturing claims were seasonal (see Chart 35).
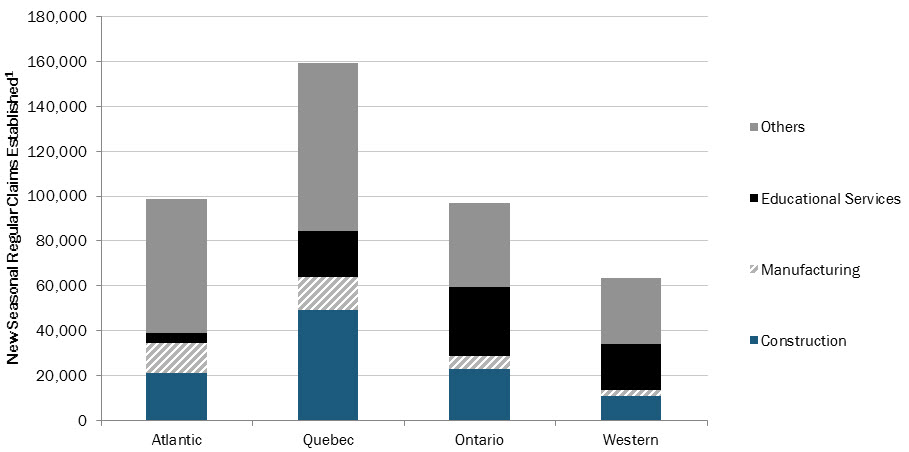
Show Data Table
| 2014/2015 | ||||
|---|---|---|---|---|
| Industry | Atlantic | Quebec | Ontario | Western |
| Construction | 21,160 | 49,200 | 23,160 | 10,900 |
| Manufacturing | 13,680 | 14,870 | 5,540 | 2,820 |
| Educational Services | 4,060 | 20,510 | 31,070 | 20,470 |
| Others | 59,910 | 74,730 | 37,370 | 29,520 |
- 1 Seasonal regular claims are those claims, for which at least $1 of regular benefits was paid, by claimants who have established at least three regular or fishing claims in the last five years, two of which had to have started during the same period of year as the current claim. This period is defined as the 8 weeks before and 8 weeks after the current claim commenced, for a total window of 17 weeks.
- Source: ESDC, Employment Insurance (EI) Administrative Data. Data are based on a 10% sample of EI administrative data.
In 2014/15, 6% of the Atlantic provinces’ workers were seasonal, compared to just 3% in the rest of Canada. Similarly, Atlantic provinces also reported high volumes of seasonal regular claims, and collectively accounted for 24% of all seasonal regular claims compared to only 12% of all non-seasonal regular claims in 2014/15.
To capture the regional distribution of seasonal regular claims, the ratio used is seasonal regular claims as a proportion of all regular claims. Using this ratio, 47% of all regular claims in the Atlantic provinces were seasonal in 2014/15, compared to 28% for the rest of Canada. The high frequency of seasonal claims in the Atlantic provinces can be largely attributed to its goods-producing industries, of which 53% of the regular claims are seasonal, compared to 33% for the rest of Canada. Within the Atlantic provinces, the industries with the highest frequency of seasonal regular claims were as follows: Agriculture, Forestry and Hunting (68%), Manufacturing (57%) and Construction (47%).
Among provinces, Alberta had the lowest frequency of seasonal claims, as 13% of its regular claims were seasonal. In particular, Alberta’s goods sector had a very low frequency of seasonal regular claims, 11%, compared with 53% in the Atlantic provinces’ goods-producing industries. This stark contrast can be attributed to differences in industrial and economic conditions; historically, Alberta has had lower unemployment rates compared to the Atlantic provinces, and this was again true in 2014/2015, despite less favourable market conditions in the Mining and Oil and Gas Extraction industry (see Table 39).
| Volume Distribution (number) | Volume Distribution (%) | Frequency (%) | ||||||
|---|---|---|---|---|---|---|---|---|
| Regular Claims | Seasonal Regular Claims | Non-seasonal Regular Claims | % of Regular Claims | % of Seasonal Regular Claims | % of Non-seasonal Regular Claims | Seasonal Regular Claims as a % of Regular Claims | Non-seasonal Regular Claims as a % of Regular Claims | |
| Regions of Canada | ||||||||
| Atlantic Provinces | 209,630 | 98,950 | 110,680 | 15.6 | 23.5 | 12.0 | 47.2 | 52.8 |
| Rest of Canada | 1,132,980 | 320,770 | 812,210 | 84.4 | 76.5 | 88.0 | 28.3 | 71.7 |
| Newfoundland and Labrador | 63,410 | 30,720 | 32,690 | 4.8 | 7.3 | 3.6 | 47.9 | 52.1 |
| Prince Edward Island | 16,560 | 8,580 | 7,980 | 1.2 | 1.9 | 0.8 | 51.6 | 48.4 |
| Nova Scotia | 60,730 | 25,560 | 35,170 | 4.5 | 6.2 | 3.8 | 42.5 | 57.5 |
| New Brunswick | 68,930 | 34,090 | 34,840 | 5.1 | 8.1 | 3.7 | 49.7 | 50.3 |
| Quebec | 423,840 | 159,240 | 264,600 | 31.5 | 38.0 | 28.6 | 37.6 | 62.4 |
| Ontario | 391,380 | 97,110 | 294,270 | 29.2 | 23.1 | 32.0 | 24.8 | 75.2 |
| Manitoba | 37,280 | 10,820 | 26,460 | 2.8 | 2.6 | 2.9 | 29.0 | 71.0 |
| Saskatchewan | 31,500 | 7,770 | 23,730 | 2.2 | 1.8 | 2.4 | 25.4 | 74.6 |
| Alberta | 105,780 | 13,700 | 92,080 | 8.1 | 3.3 | 10.2 | 13.0 | 87.0 |
| British Columbia | 139,040 | 31,370 | 107,670 | 10.3 | 7.4 | 11.6 | 22.6 | 77.4 |
| Yukon | 1,880 | 520 | 1,360 | 0.1 | 0.1 | 0.1 | 28.7 | 71.3 |
| Northwest Territories | 1,680 | 210 | 1,470 | 0.1 | 0.0 | 0.2 | 12.4 | 87.6 |
| Nunavut | 600 | 30 | 570 | 0.0 | 0.0 | 0.1 | 5.0 | 95.0 |
| Gender | ||||||||
| Men | 826,410 | 261,810 | 564,600 | 61.6 | 62.4 | 61.2 | 31.7 | 68.3 |
| Women | 516,200 | 157,910 | 358,290 | 38.4 | 37.6 | 38.8 | 30.6 | 69.4 |
| Age | ||||||||
| 15 to 24 years | 129,700 | 10,540 | 119,160 | 9.7 | 2.5 | 12.9 | 8.1 | 91.9 |
| 25 to 44 years | 592,390 | 154,680 | 437,710 | 44.1 | 36.9 | 47.4 | 26.1 | 73.9 |
| 45 to 54 years | 323,840 | 120,920 | 202,920 | 24.1 | 28.8 | 22.0 | 37.3 | 62.7 |
| 55 years and over | 296,680 | 133,580 | 163,100 | 22.1 | 31.8 | 17.7 | 45.0 | 55.0 |
| Industries | ||||||||
| Goods-Producing Industries | 511,030 | 180,310 | 330,720 | 38.1 | 43.0 | 35.8 | 35.3 | 64.7 |
| Service- Producing Industries | 748,370 | 220,260 | 528,110 | 55.7 | 52.5 | 57.2 | 29.4 | 70.6 |
| Unclassified Industries | 83,210 | 19,150 | 64,060 | 6.2 | 4.6 | 6.9 | 23.0 | 77.0 |
| Canada | 1,342,610 | 419,720 | 922,890 | 100.0 | 100.0 | 100.0 | 31.3 | 68.7 |
- Note: Totals may not add up due to rounding.
- 1 Includes claims for which at least $1 of regular benefits was paid.
- 2 Seasonal regular claims are those claims, for which at least $1 of regular benefits was paid, by claimants who have established at least three regular or fishing claims in the last five years, two of which had to have started during the same period of year as the current claim. This period is defined as the 8 weeks before and 8 weeks after the current claim commenced, for a total window of 17 weeks.
- Source: ESDC, Employment Insurance (EI) administrative data. Data are based on a 10% sample of EI administrative data.
In 2014/2015, about half of all seasonal regular claims were established in the third quarter of the fiscal year, between October and December (see Table 40). Further, 162,000 claims were initiated by men in the third quarter, representing 62% of all seasonal claims initiated by men and 39% of all seasonal regular claims. Seasonal patterns in claim establishment may vary significantly by gender and industry. Industrial analysis indicates that 64% of all seasonal regular claims in the goods sector, where male workers typically dominate, were initiated in the third quarter of 2014/2015; in all of 2014/2015, men accounted for 155,000 or 86% of all seasonal regular claims in the goods-producing industries. In 2014/2015, while 27% of all seasonal regular claims were initiated in the second quarter, women initiated 49% of all their seasonal regular claims in that quarter (between July and September). A large proportion, 52,000 claims, was initiated by women in the educational services industry (which includes teaching assistants, librarians, office staff, etc.) in that quarter. Interestingly, of the entire population of seasonal regular claims initiated by women in 2014/2015 (158,000), 41% were in the educational services industry.
| Total Seasonal Regular Claims | Distribution of Seasonal Regular Claims by Quarter (%) | ||||
|---|---|---|---|---|---|
| Q1 (April to June) |
Q2 (July to September) |
Q3 (October to December) |
Q4 (January to March) |
||
| Regions of Canada | |||||
| Atlantic | 98,950 | 14.1 | 20.5 | 50.3 | 15.2 |
| Quebec | 159,240 | 12.0 | 21.2 | 56.1 | 10.7 |
| Ontario | 97,110 | 9.4 | 35.0 | 42.6 | 13.0 |
| Western | 63,660 | 13.5 | 36.0 | 40.3 | 10.2 |
| Territories | 760 | 10.5 | 15.8 | 61.8 | 11.8 |
| Gender | |||||
| Men | 261,810 | 9.6 | 13.1 | 61.7 | 15.6 |
| Women | 157,910 | 16.3 | 48.6 | 28.5 | 6.6 |
| Industries | |||||
| Goods-Producing Industries | 180,310 | 7.6 | 12.7 | 63.9 | 15.9 |
| Service-Producing Industries | 220,260 | 16.1 | 38.5 | 36.5 | 9.0 |
| Unclassified | 19,150 | 9.1 | 18.1 | 57.9 | 14.8 |
| Canada | 419,720 | 12.1 | 26.5 | 49.2 | 12.2 |
- 1 Seasonal regular claims are those claims, for which at least $1 of regular benefits was paid, by claimants who have established at least three regular or fishing claims in the last five years, two of which had to have started during the same period of year as the current claim. This period is defined as the 8 weeks before and 8 weeks after the current claim commenced, for a total window of 17 weeks.
- Source: ESDC, Employment Insurance (EI) administrative data. Data are based on a 10% sample of EI administrative data.
2.7.3 Eligibility for Employment Insurance regular benefits among seasonal claimants
The Employment Insurance Coverage Survey (EICS) of Statistics Canada shows that eligibility for regular benefits among seasonal workers is higher than that for temporary non-seasonal workers Footnote 104 but lower than that for permanent full-time workers. In 2014, 84.6% of unemployed seasonal workers who had been paying premiums and then were laid off or quit with just cause were eligible for regular benefits. In comparison, 90.1% of full-time permanent workers were eligible for regular benefits, compared to 73.0% for temporary non-seasonal workers. A recent study, Footnote 105 based on the Canadian Out-of-Employment Panel Survey (COEP), further confirmed that seasonal workers are less likely than permanent full-time job separators (by 12 percentage points) to be eligible for EI regular benefits.
2.7.4 Duration of Employment Insurance regular benefits among seasonal claimants
In 2014/2015, the average maximum duration of seasonal regular claims was 30.3 weeks of regular benefits, consistent with the 30.6 weeks experienced in 2013/2014. Average maximum duration of seasonal regular claim has been declining since 2009/2010 when the average duration was 39.0 weeks, which included the additional weeks provided by the temporary measures introduced in Budget 2009/2010. The average maximum duration of regular benefits among seasonal regular claims is still slightly below the pre-recession level, which was 31.9 weeks in 2007/2008.
Compared with non-seasonal regular claimants, seasonal regular claimants tend to use less of their entitlement. On a per-claim basis, on average, seasonal regular claimants used 62% of their regular benefit entitlement for claims established in 2013/14. Footnote 106 In comparison, non-seasonal regular claimants used 64% of their regular benefit entitlement for claims established in 2013/14.
Correspondingly, the average actual duration of regular benefits among seasonal regular claimants is also shorter than that for non-seasonal regular claimants. The average seasonal regular claim established in 2013/2014 received 17.9 weeks of benefits, while non-seasonal regular claims received an average of 20.1 weeks. The same holds true for claims established in 2012/13, as seasonal regular claims received an average of 18.1 weeks of benefits, while non-seasonal regular claims received an average of 20.3 weeks.
2.7.5 Overlapping definitions of seasonal and frequent claimants: Internal analysis
The Connecting Canadians with Available Jobs (CCAJ) initiative, announced in 2012, introduced new EI claimant categories. The three new categories are long-tenured workers, frequent claimants and occasional claimants. Since then, frequent claimants are defined as claimants who have had three or more claims for EI regular or fishing benefits and received over 60 weeks of benefits in the past five years. While seasonal claimants are not officially defined in the Employment Insurance Act or Employment Insurance Regulations, for the purpose of this analysis seasonal claimants are claimants who have established at least three regular or fishing claims in the last five years, two of which had to have established during the same period of year as the current claim. Footnote 107
The definitions of seasonal and frequent claimants overlap as they must have established three or more claims each in the past five years, but they do defer as per two criteria:
- Frequent claimants are defined also on the number of weeks of EI regular or fishing received, while seasonal claimants are not; and
- While there is a criterion of timing of the establishment of claims for seasonal claimants, this criterion does not apply for frequent claimants.
Analysis of frequent regular claimants and seasonal regular claimants shows that less claimants qualify as frequent regular claimants compared to seasonal regular claimants (see Table 41). This suggests several seasonal regular claimants do not meet the frequent regular claimant definition because they use less than 60 weeks of regular benefits. These claimants then fall into the occasional and long-tenured workers claimant categories. Conversely, more claimants meet the seasonal claimant definition because they use less than 60 weeks of regular benefits but establish their claim at about the same time of the year.
| 2007/2008 | 2008/2009 | 2009/2010 | 2010/2011 | 2011/2012 | 2012/2013 | 2013/2014 | 2014/2015 | |
|---|---|---|---|---|---|---|---|---|
| Frequent | 286,950 | 292,030 | 300,370 | 309,230 | 321,040 | 319,580 | 309,780 | 304,700 |
| Seasonal | 395,140 | 412,660 | 417,430 | 381,810 | 412,230 | 419,930 | 422,410 | 419,720 |
- Note: Totals may not add up due to rounding.
- 1 Frequent regular claims are those claims, for which at least $1 of regular benefits was paid, established by claimants who have had three or more claims for EI regular or fishing benefits and received over 60 weeks of benefits in the past five years.
- 2 Seasonal regular claims are those claims, for which at least $1 of regular benefits was paid, by claimants who have established at least three regular or fishing claims in the last five years, two of which had to have started during the same period of year as the current claim. This period is defined as the 8 weeks before and 8 weeks after the current claim commenced, for a total window of 17 weeks.
- Source: ESDC, Employment Insurance (EI) administrative data. Data are based on a 10% sample of EI administrative data.
Deeper analysis shows that 254,000 regular claims met the definitions of both frequent and seasonal regular claims. This means that 51,000 of regular claims (305,000 – 254,000) only met the definition of frequent regular claims and that 166,000 of regular claims (420,000 – 254,000) only met the definition of seasonal regular claims (see Chart 36).
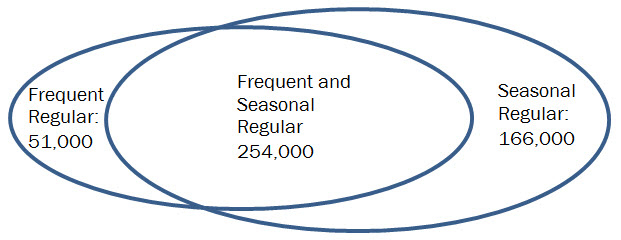
Show Data Table
| 2014/2015 | |
|---|---|
| Frequent Regular Claims | 51,000 |
| Frequent and Seasonal Regular Claims | 254,000 |
| Seasonal Regular Claims | 166,000 |
- 1 Frequent regular claims are those claims, for which at least $1 of regular benefits was paid, established by claimants who have had three or more claims for EI regular or fishing benefits and received over 60 weeks of benefits in the past five years.
- 2 Seasonal regular claims are those claims, for which at least $1 of regular benefits was paid, by claimants who have established at least three regular or fishing claims in the last five years, two of which had to have started during the same period of year as the current claim. This period is defined as the 8 weeks before and 8 weeks after the current claim commenced, for a total window of 17 weeks.
- Source: ESDC, Employment Insurance administrative data. Data are based on a 10% sample of EI administrative data.
The distribution of seasonal regular claims among claimant categories shows that frequent regular claims accounted for 61% of seasonal regular claims in 2014/2015, while occasional regular claimant and long-tenured worker claims accounted for 29% and 10% of seasonal regular claims respectively (see Chart 37). Industrial analysis shows that cross the country, the main difference between seasonal and frequent regular claims occurs in the Educational Services industry: 18% of seasonal claims were in this industry, compared with just 5% of frequent claims. Seasonal claims represent 52% of the Educational Services industry. Other large industrial breakdowns of regular claims that are similar between frequent and seasonal claimants: Construction industry claims accounted for 27% and 25% of frequent and seasonal claims respectively, while claimants from the Manufacturing industry represented 10% and 9% of frequent and seasonal claims respectively.
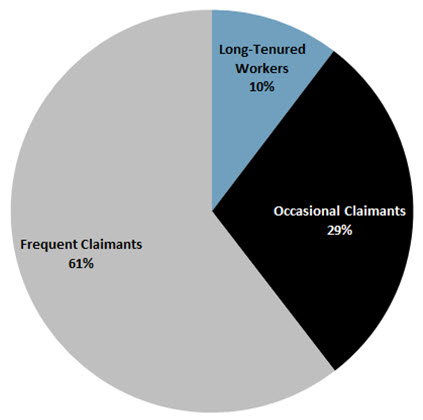
Show Data Table
| 2014/2015 | |
|---|---|
| Long-Tenured Workers | 10% |
| Occasional Claimants | 29% |
| Frequent Claimants | 61% |
- 1 Seasonal regular claims are those claims, for which at least $1 of regular benefits was paid, by claimants who have established at least three regular or fishing claims in the last five years, two of which had to have started during the same period of year as the current claim. This period is defined as the 8 weeks before and 8 weeks after the current claim commenced, for a total window of 17 weeks.
- Source: ESDC, Employment Insurance (EI) Administrative Data. Data are based on a 10% sample of EI administrative data.
Additionally, seasonal regular claims make up 83% of frequent regular claims, while non-seasonal regular claims make up just 17% (see Chart 38). Conversely, seasonal regular claims make up just 17% and 16% of long-tenured workers and occasional claimants, respectively, while non-seasonal regular claims make up 83% and 84% of the two categories. Industrial analysis reveals that 49% and 23% of seasonal long-tenured regular claimants were employed in the educational services and construction industry, respectively. Correspondingly, 33% and 23% of seasonal occasional regular claimants were employed in these two industries.
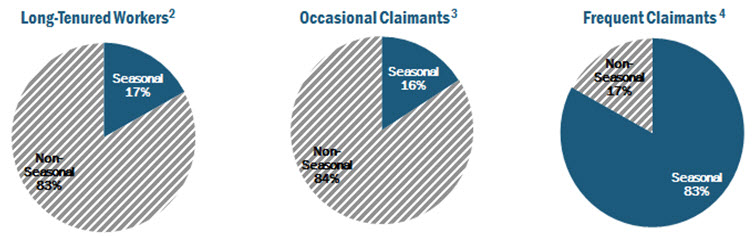
Show Data Table
| 2014/2015 | |||
|---|---|---|---|
| Long-tenured Workers | Occasional Claimants | Frequent Claimants | |
| Seasonal | 17% | 16% | 83% |
| Non-Seasonal | 83% | 84% | 17% |
- 1 Seasonal regular claims are those claims established, for which at least $1 of regular benefits was paid, by claimants who have established at least three regular or fishing claims in the last five years, two of which had to have started during the same period of year as the current claim. This period is defined as the 8 weeks before and 8 weeks after the current claim commenced, for a total window of 17 weeks.
- 2 Long-tenured workers regular claims are those claims, for which at least $1 of regular benefits was paid, established by claimants who have paid at least 30% of the annual maximum EI premium in at least seven of the past ten years and, over the last five years, have received 35 weeks or less of EI regular or fishing benefits.
- 3 Occasional regular claims are those claims, for which at least $1 of regular benefits was paid, established by claimants who do not fall into the long-tenured workers or frequent claimant EI claimant categories.
- 4 Frequent regular claims are those claims, for which at least $1 of regular benefits was paid, established by claimants who have had three or more claims for EI regular or fishing benefits and received over 60 weeks of benefits in the past five years.
- Source: ESDC, Employment Insurance (EI) Administrative Data. Data are based on a 10% sample of EI administrative data.
Finally, frequent regular claimants tend to qualify for EI with less hours of insurable employment than seasonal claimants: in the last three years, frequent regular claimants qualified for EI with 100 less hours than seasonal regular claimants (1,230 hours vs 1,126 hours). This may suggest that frequent regular claimants occupy more temporary and part-time positions than Seasonal Regular claimants.
2.8 Employment Insurance regular benefits and labour mobility
A significant movement of labour takes place in Canada, mainly from regions of high unemployment and low wages to regions of lower unemployment and higher wages. However, regional variations in unemployment rates that have persisted for decades continued during the 2008 recession and onwards, which potentially suggests that labour is not as mobile as the Canadian labour market requires, at least to some extent. Despite the fact that jobs may be available in other regions of the country, some workers are not able or prefer not to move, while others may not be aware of job opportunities outside of their region of residence. This situation contributes to regional pockets of high unemployment.
Subsection 2.8.1 analyzes labour mobility within Canada, primarily concerning the flow of migration between provinces and territories. Subsection 2.8.2 examines the current research surrounding the impact of the EI program on labour mobility decisions.
2.8.1 Labour mobility within Canada
Demographic estimates from Statistics Canada on interprovincial mobility in 2014/2015 showed that only two provinces¬—Alberta (+31,600) and British Columbia (+13,600)—had positive net migration flows of population within the country, as shown in Chart 39. Ontario (-13,600), Quebec (-14,000) and Manitoba (-7,700) had the highest negative net migration flows of population.
Show Data Table
| Interprovincial Mobility (Number of individuals), 2014/2015 |
||
|---|---|---|
| In-migrants | Out-migrants | |
| N.L. | 8,059 | 8,636 |
| P.E.I. | 2,333 | 3,447 |
| N.S. | 15,472 | 17,416 |
| N.B. | 10,677 | 13,847 |
| Que. | 19,377 | 33,348 |
| Ont. | 65,002 | 78,568 |
| Man. | 10,898 | 18,586 |
| Sask. | 19,054 | 21,905 |
| Alta. | 94,018 | 62,468 |
| B.C. | 60,091 | 46,529 |
| Y.T. | 1,621 | 1,494 |
| N.W.T. | 2,342 | 2,625 |
| Nvt. | 1,143 | 1,218 |
- Note: Figures for 2014/2015 are preliminary.
- Source: Statistics Canada, Estimates of Total Population, Canada, Provinces and Territories, CANSIM Table 051-0017.
Alberta is the only province that has experienced positive net migration every year since 2010/2011. Over the last five years combined, Alberta (+131,500), British Columbia (+18,800), and to a lesser extent, Yukon (+700), and Newfoundland and Labrador (+300) have had positive net migration flows, while the other provinces and territories experienced negative net migration flows.
The two most prevalent trends in interprovincial mobility in Canada are movement from east to west, and movement toward Alberta. According to analysis of migration data from Statistics Canada, among provincial residents who moved to another province in 2014/2015 Footnote 108 , 60% moved west, while the remaining 40% moved east. This trend has been consistent over the past six years.
In 2014/2015, Alberta was the preferred destination among all interprovincial migrants with 30% of them choosing Alberta as their province of destination. Most notably, Saskatchewan and British Columbia saw 49% and 52% of their out-migrants choose Alberta, respectively, while 32% of out-migrants from the Atlantic provinces chose Alberta as their destination province.
Alberta’s growing economy may have attracted several individuals to migrate to the province. Over the last five years, Alberta has seen employment gains of 248,500 (+12%), with the largest growth occurring in the Construction industry (54,800 or +27%), the Mining, Oil and Gas Extraction industry (33,400 or +24%), and the Health Care and Social Assistance industry (31,300 or +14%).
Labour mobility (and in particular movement from east to west) is considered by many academics to have a positive impact on the national economy, insofar as it provides workers with the opportunity to access other labour markets and obtain a job that is suitable to their skill set. From a national perspective, interprovincial mobility is desirable when workers from provinces with high unemployment and an excess of labour supply move to provinces with a low unemployment rate and an excess of labour demand (i.e., labour shortages). Footnote 109
A study by the Bank of Canada Footnote 110 examined the potential factors of regional migration within Canada and found that regional differences in employment rates and household incomes are positively related to migration flows (i.e., regions tend to receive migrants when their employment rates and median household incomes are higher than the region where the migrants originate from), while provincial labour market borders and language differences are negatively related (i.e., regions tend to receive fewer migrants from the region where the migrants originate from when they are separated by a provincial border or there is a language barrier). The authors suggest that if provincial labour market border barriers were removed (e.g., provincial licensing), labour mobility could potentially be easier for individuals which would have a positive impact on output growth for the country.
Another study Footnote 111 on interprovincial employment in Canada found that unemployment disparities incentivize employees to migrate or become interprovincial employees. Interprovincial employees are employees who accept jobs in other provinces while maintaining residence in their home province (e.g., commuting or fly-in/fly-out). In 2011, it was estimated that 420,000 individuals were classified as interprovincial employees (or roughly 3% of the paid Canadian workforce). The results of this study indicated that smaller provinces (e.g., the Atlantic provinces) had a larger percentage of their paid workforce participating in interprovincial employment. From 2002 to 2011, roughly 10% of the paid workforce in Newfoundland and Labrador were interprovincial employees compared to only 1.7% in Ontario. The authors also found that total wages and salaries from interprovincial employment account for a substantial percentage of aggregate total wages and salaries for small provinces. For all employees residing in Newfoundland and Labrador in 2011, 8.5% of total wages and salaries for the province came from interprovincial employment with corresponding percentages of 6.2%, 4.5%, and 4.6% for Prince Edward Island, Nova Scotia and New Brunswick, respectively. The study concludes that interprovincial employees were more likely to be men and under 25 years old.
While several factors can have an influence on an individual’s decision to move to another province, including but not limited to job opportunities, education/school, or family reasons, the need to seek a higher standard of living is a driving force. According to a recent report Footnote 112 on skills shortages in Atlantic Canada, while the proportion of Atlantic employment with post-secondary education has increased, the fields of study or skills acquired may not necessarily meet the needs of employers in Atlantic Canada. The skills and education that are in-demand are changing due in large part to the restructuring of the labour market from being manufacturing-based to knowledge- and service-based. For example, from 2004 to 2012, the Atlantic region saw a loss of roughly 30,000 manufacturing jobs, matched by the creation of an equal number of jobs in health and social services. Although many skills are transferrable across employment sectors, a certain level of new skills and education are usually required. This level of training is typically costly and time consuming, which creates a shortage of in-demand workers for employers.
According to the same study, over the last decade, Atlantic Canada has lost on a net basis about 50,000 youth (15 to 29 years) to the rest of Canada, largely due to net outflows to Alberta. This can be attributed to a shortage of entry-level jobs in the Atlantic region which may also be discouraging the entry of well-qualified young people into the Atlantic labour market. However, even though a large number of young people are moving away from the Atlantic region, the authors suggest that most university students want to remain in the Atlantic region, but are forced to leave for higher earnings and employment opportunities.
2.8.2 Impact of the Employment Insurance program on labour mobility
The employment insurance (EI) program supports labour mobility through the following two key policies:
- If an individual is receiving EI benefits and decides to move to look for work, they will continue to receive EI benefits with no change in the level of benefits or the number of weeks of benefits that they are entitled to, as EI benefits are based on where the individual resides at the time the claim is established.
- If an individual voluntarily leaves his or her job to follow a spouse, common-law partner or dependent child Footnote 113 to a new place, he or she will still be eligible to receive benefits.
Several studies over the past decade have looked at the determinants of labour mobility and how the EI program (e.g., variable entrance requirement) impacts the decision process to migrate for employment. Results of these studies indicate that the EI program does not appear to have a significant effect on mobility decisions, Footnote 114 while factors such as personal and regional labour market characteristics (e.g., age, gender, employment rates, population size, etc.), as well as moving costs, play a key role in such decisions. Footnote 115
A 2011 study Footnote 116 concluded that among EI regular claimants, those in regions with a high unemployment rate (12.1% or higher) were more likely to commute to work from one EI economic region to another, but less likely to permanently move to another EI economic region; however, the overall effect of EI benefits on geographical attachment was very minimal.
Another study Footnote 117 compared the commuting and mobility patterns of EI recipients and non-recipients. The findings suggested that EI does not discourage workers from being mobile. EI recipients were found to be more likely than non-EI recipients to commute 30 kilometers or more to work and more likely to work outside their census subdivision of residence. Also, following a job loss, EI recipients were more likely than non-EI recipients to move over 100 kilometers away.
In general, the available evidence suggests that EI is generally not a barrier to labour mobility, nor does it play a significant role in a person’s decision to move to another province or to commute.
2.9 Impact of Employment Insurance regular benefits on income redistribution Footnote 118
Similar to the impact analysis of total EI benefits on income redistribution conducted in section 1.6 of this chapter, this report also examines the impact regular benefits have on income redistribution.
To assess the level of income redistribution, the amount paid in regular benefits to each province or territory, selected demographic groups and industries is divided by the total amount of EI premiums collected. These regular benefits-to-contributions (B/C) ratios are then normalized so that the ratio for Canada is equal to 1.0. Footnote 119 The resulting ratiosthe adjusted regular benefits-to-contributions ratiosfor each jurisdiction, demographic group or industry indicate whether it received more in regular benefits than it contributed to the program, relative to Canada as a whole. In this section, the amount of EI premiums collected is based on the latest available Canada Revenue Agency (CRA) tax data, which are for 2013. Regular benefits data used for this analysis of B/C ratios are therefore for 2013 as well.
As contributions are not broken down by benefit type, the amount of EI premiums used to calculate the B/C ratios has been modified to ensure that the regular benefits-to-contributions ratio and the adjusted regular benefits-to-contributions ratio take into account the reduction in premiums related to special benefits, due to the Quebec Parental Insurance Plan (QPIP) and the Premium Reduction Program (PRP). To factor in the QPIP, which reduces the premiums paid by employers and employees in Quebec, Footnote 120 and the PRP, which reduces the premiums paid by employers who offer their employees a short-term disability plan, Footnote 121 the regular benefits-to-contributions ratios (adjusted and non-adjusted) have been calculated based on an estimate of the employment insurance premiums that would have been paid by employees and employers in the absence of QPIP and PRP, rather than on the premiums that were actually paid.
A province or territory, demographic group or industry with an adjusted ratio higher than 1.0 means that the underlying population is a net beneficiary of the EI program, while those with an adjusted ratio lower than 1.0 are net contributors to the program, relative to Canada as a whole. Annex 2.23 provides a detailed account of EI premiums collected and regular benefits paid across different provinces and territories, demographic groups (sex and age group) and industries. The following sections summarize the key findings.
2.9.1 Adjusted Regular Benefits-to-contributions ratios, by province and territory Footnote 122
The Atlantic provinces, Quebec and Yukon continued to be net beneficiaries of regular benefits from the EI program in 2013, as they were in previous years, with adjusted ratios greater than 1.0. By contrast, Ontario, the Western provinces and Northwest Territories remained net contributors, with adjusted ratios below 1.0 (see Chart 40). Nunavut was the only jurisdiction with an adjusted ratio equal to 1.0.
Generally, provinces with higher regular benefits-to-contributions ratios also have higher unemployment rates. In 2013, the Atlantic provinces had the highest unemployment rates in the country, while rates were lower in the Western provinces due to the region’s strong economic performance.
Show Data Table
| 2013 | ||
|---|---|---|
| Adjusted regular benefits-to-contributions ratio | Unemployment rate | |
| N.L. | 4.2 | 11.6% |
| P.E.I. | 3.8 | 11.6% |
| N.S. | 2.2 | 9.1% |
| N.B. | 3.1 | 10.3% |
| Que. | 1.3 | 7.6% |
| Ont. | 0.8 | 7.6% |
| Man. | 0.7 | 5.4% |
| Sask. | 0.6 | 4.1% |
| Alta. | 0.4 | 4.6% |
| B.C. | 0.8 | 6.6% |
| Y.T. | 1.4 | |
| N.W.T. | 0.9 | |
| Nvt. | 1.0 | |
| Canada | 1.0 | |
- Note: The unemployment rates for Yukon, Northwest Territories and Nunavut are not available.
- Source: Canada Revenue Agency [CRA], T4 slips with employment income (for data on contributions); ESDC, Employment Insurance (EI) administrative data (for data on benefits); and Statistics Canada, Labour Force Survey, CANSIM Table 282-0087 (for data on unemployment rates). CRA data are based on a 10% sample of T4 slips with employment income, and ESDC data are based on a 10% sample of EI administrative data.
2.9.2 Adjusted Regular Benefits-to-contributions ratios, by gender and age
Older workers (55 years and older) were net beneficiaries of regular benefits in 2013, with an adjusted regular benefits-to-contributions ratio equal to 1.2. This is consistent with the findings of an evaluation study, Footnote 123 which showed that older workers were generally more likely to be net beneficiaries of regular benefits.
Men were net beneficiaries with an adjusted regular benefits-to-contributions ratio equal to 1.2. However, women (adjusted regular B/C ratio of 0.8) were net contributors to the EI program in 2013 when considering regular benefits only, in contrast to their status when considering all EI benefits (adjusted total B/C ratio of 1.1). This is in line with unemployment rates being higher among males than females.
2.9.3 Employment Insurance regular benefits-to-contributions ratios, by industry
In 2013, the goods-producing industries, as a whole, were net beneficiaries of regular benefits from the EI program, with an adjusted regular benefits-to-contributions ratio of 1.8, while the services-producing industries were net contributors to regular benefits, with an adjusted ratio of 0.8. As described in Chapter I and section 2.1 of this chapter, in 2014/2015, the goods-producing industries comprised 22% of employment and 38% of all regular claims, indicating that they were overrepresented among EI regular claims. Conversely, the service sector comprised 78% of employment and 56% of all regular claims, indicating that the services-producing industries were underrepresented among EI regular claims.
The goods sector includes some industries with a large share of seasonal workers who are more likely to be laid off and collect regular benefits, such as in the Agriculture, Forestry, Fishing and Hunting industry (adjusted B/C ratio of 4.7), and the Construction industry (adjusted B/C ratio of 2.9) [see Chart 41]. These goods-producing industries were significant net beneficiaries of regular benefits in 2013, as in previous years.
Within the service sector, two industries were net beneficiaries of regular benefits from the program, with an adjusted regular benefits-to-contributions ratio larger than 1.0. These two industries were the Business, Building and Other Support Services industry (B/C ratio of 1.3), and the Accommodation and Food Services industry (B/C ratio of 1.3).

Show Data Table
| 2013 Adjusted regular benefits-to-contributions ratio |
|
|---|---|
| Goods-producing Industries | 1.8 |
| Agriculture, Forestry, Fishing and Hunting | 4.7 |
| Mining and Oil and Gas Extraction | 1.2 |
| Utilities | 0.4 |
| Construction | 2.9 |
| Manufacturing | 1.1 |
| Services-producing Industries | 0.8 |
| Wholesale Trade | 0.8 |
| Retail Trade | 0.8 |
| Transportation and Warehousing | 0.9 |
| Finance and Insurance | 0.3 |
| Real Estate and Rental and Leasing | 1.0 |
| Professional, Scientific and Technical Services | 0.8 |
| Business, Building and Other Support Services | 1.3 |
| Educational Services | 0.8 |
| Health Care and Social Assistance | 0.4 |
| Information, Culture and Recreation | 1.0 |
| Accommodation and Food Services | 1.3 |
| Other Services (except Public Adminstration) | 1.0 |
| Public Administration | 0.5 |
| Canada | 1.0 |
- Source: Canada Revenue Agency [CRA], T4 slips with employment income (for data on contributions); and ESDC, Employment Insurance (EI) administrative data (for data on benefits). CRA data are based on a 10% sample of T4 slips with employment income, and ESDC data are based on a 10% sample of EI administrative data.