
Employment Insurance Monitoring and Assessment Report 2014/2015 Chapter II - 3. Employment Insurance Fishing Benefits
3. Employment Insurance Fishing Benefits
Employment Insurance (EI) fishing benefits were created in 1956 and are paid to eligible self-employed fishers who do not meet the eligibility requirements for EI regular benefits.
For the purposes of these benefits, a self-employed fisher is defined as a self-employed person engaged in fishing (other than for their own sport). This definition includes a person engaged in one of the following activities:
- making a catch;
- any work incidental to making or handling a catch (such as loading, unloading, or transporting the catch made by the crew of which the person is a member, or preparing, repairing and laying-up the fishing vessel or fishing gear used by that crew), provided the person is also engaged in making the catch;
- the construction of a fishing vessel for their own use or for the use of the crew of which the person is a member in making a catch.
The amount paid in fishing benefits is driven by three key indicators: the number of claims, the average weekly benefit rate (i.e. the level of benefits) and the duration of benefits. In general, an increase in one of these indicators will have a positive impact on the total amount paid. The number of claims and amount paid are discussed in the next section (Section 3.1), while the level and duration of benefits are analyzed in Sections 3.3. and 3.4. In these sections, fishing claims refer to claims for which at least one dollar of fishing benefits was paid.
3.1 Employment Insurance Fishing Claims and Amount Paid
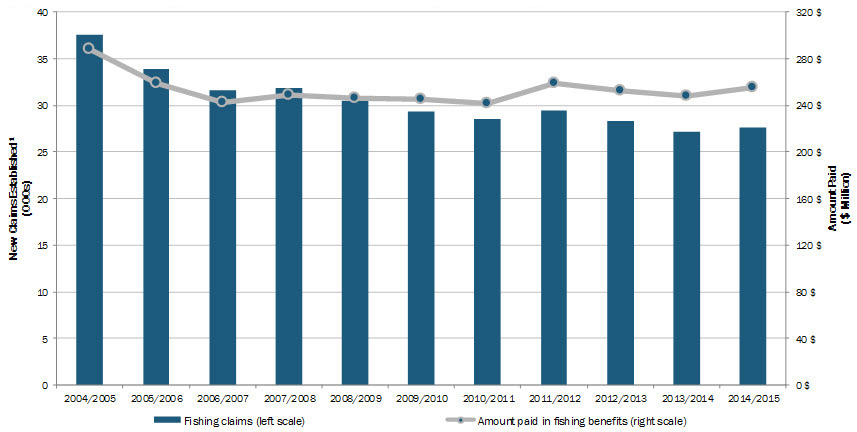
The number of new fishing claims established in 2014/2015 increased by 1.5 % compared to 2013–2014, a year that saw a 14-year historic low. New claims numbered 27,587 in 2014/2015, compared to 27,175 the previous year (see Chart 42). The general downward trend in the past few years is strongly correlated with the decrease in the number of commercial fishing licence holders in Canada observed between 2003 and 2013. This number had been decreasing almost continuously every year, going from 27,600 licences in 2003 to 21,500 in 2013. Footnote 125
Show Data Table
| Fishing claims (000s) | Amount paid in fishing benefits ($ Million) | |
|---|---|---|
| 2004/2005 | 37.6 | 289 |
| 2005/2006 | 33.9 | 259 |
| 2006/2007 | 31.7 | 242 |
| 2007/2008 | 31.9 | 249 |
| 2008/2009 | 30.5 | 246 |
| 2009/2010 | 29.3 | 245 |
| 2010/2011 | 28.5 | 242 |
| 2011/2012 | 29.5 | 259 |
| 2012/2013 | 28.3 | 253 |
| 2013/2014 | 27.2 | 248 |
| 2014/2015 | 27.6 | 256 |
- 1 Includes claims for which at least $1 of fishing benefits was paid.
- Source: ESDC, Employment Insurance (EI) administrative data. Data are based on a 100% sample of EI administrative data, except for amount paid, which is based on a 10% sample.
Moreover, in 2014–2015, an average of 11,200 claimants were receiving fishing benefits each month, up 0.6 % from 11,130 claimants in 2013/2014, according to Statistics Canada. Footnote 126 This number is the number of EI claimants who received at least one dollar in fishing benefits during the reference period within the given month (usually the week of the 15th day of the month). The number is affected by the inflow of new EI claimants and the outflow of EI claimants no longer receiving fishing benefits, mainly because they have exhausted the number of weeks of benefits to which they were entitled or because they have returned to work.
Usually, EI claims and the number of claimants tend to change in the same direction, except when there is a change in the duration of benefits or a large, sudden jump or decrease in the number of claims. During an economic shock, the number of claims increases faster than the number of claimants because there is a lag between the time that the new claims are received and the time that the benefit period is established and benefits are payable. Conversely, if the number of claims decreases, the number of claimants will remain high for a time, because of earlier claims for which benefits continue to be paid, until the benefits are exhausted or the claimants find work.
The amount paid in benefits increased to $256 million in 2014/2015, an increase of 3.1 % over the $248 million paid in 2013/2014. The number of fishing claims and the amount paid in fishing benefits in 2014/2015 both represent only 2 % of all EI claims and the total amount paid in EI benefits.
3.1.1 Employment Insurance Fishing Claims and Amount Paid, by Province and Territory, Gender and Age
The number of new fishing claims established in the Atlantic provinces varied very little in 2014/2015. These provinces accounted for 80 % of all fishing claims, a proportion similar to the three previous fiscal years (81 % each time). The main change was in British Columbia where the number of claims established increased by 18.2 % in 2014/2015 compared to the previous year. The number of claims in 2014/2015 in this province simply returned to the average level seen between 2009/2010 and 2011/2012, whereas the claims established in 2012/2013 and 2013/2014 were below the historical average.
Newfoundland and Labrador (with 11,160 claims established) accounted for 40% of all claims in Canada, followed by Nova Scotia (5,185 claims established or 19 % of the total), British Columbia (3,124 claims or 11 %), Prince Edward Island (2,844 claims or 10 %), New Brunswick (2,791 claims or 10%) and Quebec (1,390 claims or 5 %).
In 2014/2015, the amount paid in fishing benefits in the Atlantic provinces represented 78% of fishing benefits paid in Canada. Of the $256 million paid in EI fishing benefits, the fishers of Newfoundland and Labrador received the largest share ($99 million or 39 %), followed by those of Nova Scotia ($50 million or 20 %), British Columbia ($32 million or 12 %), New Brunswick ($27 million or 10 %), Prince Edward Island ($14 million or 9 %) and Quebec ($13 million or 5 %).
In 2014–2015, men were responsible for 82 % of fishing claims and received 83% of the amount paid (the same proportions as in the past). It should be noted that the proportion of claims established for women varied enormously from one province to another. This proportion went from a minimum of 5 % in Quebec to 24 % in Newfoundland and Labrador and Prince Edward Island (see Table 42).
| Province and Territory | Claims Established for… | |
|---|---|---|
| Men | Women | |
| Newfoundland and Labrador | 76% | 24% |
| Prince Edward Island | 76% | 24% |
| Nova Scotia | 91% | 9% |
| New Brunswick | 92% | 8% |
| Quebec | 95% | 5% |
| British Columbia | 82% | 18% |
| Other Provinces and Territories | 80% | 20% |
| Canada | 83% | 17% |
- 1 Includes claims for which at least $1 of fishing benefits were paid.
- Source: ESDC, Employment Insurance (EI) administrative data. Data are based on a 100% sample of EI administrative data.
Population aging demographics has affected the fishing workforce in recent years. Although the number of fishing claims that have been established has decreased over time, older workers (55 and older) have made a growing number of claims each year since 2000/2001, and 2014–2015 (+6.8 %) was no exception. In 2014/2015, older workers were responsible for 36 % of all fishing claims that were established. In the last six years, their share of fishing claims has increased by 7 percentage points (it was 29 % in 2009/2010).
Conversely, the number of claims established for core age workers (25 to 54 years), which represented 60% of all new fishing claims in 2014–2015, decreased by 1.9 %. This was the third consecutive annual decrease. The proportion of new claims established for workers from this age group declined gradually each year between 2009/2010 and 2014/2015. The decrease was of 7 percentage points, from 67% in 2009/2010 to 60 % in 2014/2015. Within this age group, workers aged 25 to 44 experienced a slightly greater decrease than the 45 to 54 age group, since the proportion in the first group dropped from 35 % to 30 % over the same period, compared to a 32 % to 30 % decrease for those aged 45 to 54 years.
The number of new claims established for young workers (24 years and under) remained low, accounting for only 4 % of all EI fishing claims in 2014–2015.
The distribution of amount paid follows a similar pattern. Older workers collectively received 10.8% more in fishing benefits in 2014/2015 compared to the previous fiscal year, and received 36% of all benefits paid in 2014–2015 (representing an increase of 8 percentage points compared to 2009/2010). Core age fishers, who received 60 % of fishing benefits (a decrease of 7 percentage points compared to 2009/2010), saw the total amount of benefits paid to them drop by 0.5 % in 2014/2015, following two annual decreases of more than 4.0 % in 2012–2013 and 2013–2014. Finally, the amount paid in EI benefits to young self-employed fishers represented only 4 % of the overall fishing benefits paid in 2014/2015.
3.1.2 Employment Insurance Fishing Claims and Amount Paid, by Claimant Category Footnote 127 and Employment Insurance economic region
Fishing benefits are seasonal. Nearly 9 out of 10 claims (88 %) in 2014/2015 were established for frequent claimants, whereas 11 % of claims were established for occasional claimants, and less than 1 % of claims for long-tenured workers. The amount paid in benefits is distributed in the same proportions, which remained relatively stable over the past several years.
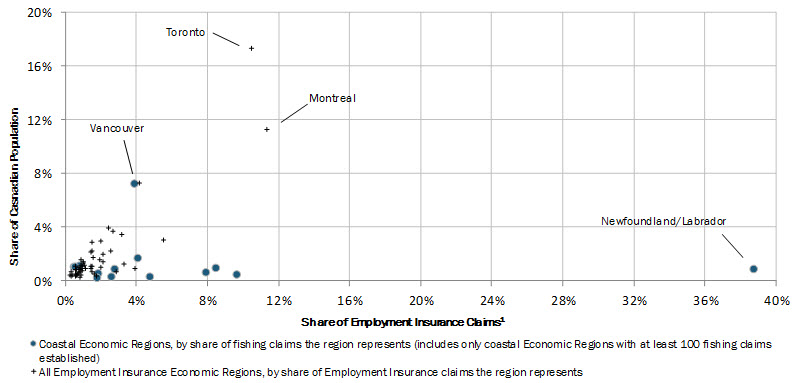
Most people who receive EI fishing benefits live in rural communities. As shown in Chart 43, fishing claims are made mainly by fishers residing in EI economic regions with small populations. Each point on the chart represents an EI economic region, and coastal regions with a minimum of 100 fishing claims in 2014/2015 (represented by the blue points) are almost all in the lower section of the chart, that is, in the section with the sparsely populated areas, with the exception of the economic region of Vancouver. This is in contrast to the situation observed with respect to regular claims, which are distributed among economic regions (represented by black plus signs) relatively proportionately to the size of their population, whether they are large (such as Toronto, Montreal or Vancouver) or small. These findings suggest that fishing benefits account for a substantial share of the rural economy of coastal regions. This is particularly true for the economic region of Newfoundland/Labrador, which dominates the country with a proportion of 39 % of new fishing claims established in Canada in 2014/2015, while it represents only 1% of the Canadian population.
Show Data Table
| Employment Insurance Economic Regions | Share of Employment Insurance Claims (coastal economic regions with at least 100 fishing claims) | Share of Employment Insurance Claims (all economic regions) | Share of Population |
|---|---|---|---|
| Other | 1.8% | 0.8% | 0.6% |
| Newfoundland/Labrador | 38.7% | 3.9% | 0.9% |
| Other | 9.6% | 1.6% | 0.5% |
| Other | 8.4% | 2.0% | 1.0% |
| Other | 0.8% | 0.9% | 1.2% |
| Other | 0.5% | 1.4% | 1.1% |
| Other | 1.8% | 0.8% | 0.3% |
| Other | 7.9% | 2.9% | 0.7% |
| Other | 4.7% | 1.8% | 0.4% |
| Other | 2.5% | 2.2% | |
| Other | 0.6% | 0.4% | |
| Other | 0.6% | 0.4% | |
| Other | 0.7% | 0.5% | |
| Other | 1.9% | 1.6% | |
| Montreal | 11.3% | 11.3% | |
| Other | 5.6% | 3.1% | |
| Other | 1.5% | 0.7% | |
| Other | 3.3% | 1.3% | |
| Other | 0.8% | 0.9% | |
| Other | 0.9% | 0.4% | |
| Other | 1.5% | 2.9% | |
| Other | 1.5% | 1.1% | |
| Other | 0.3% | 0.5% | |
| Other | 3.2% | 3.4% | |
| Other | 0.9% | 1.1% | |
| Toronto | 10.5% | 17.3% | |
| Other | 1.5% | 2.2% | |
| Other | 1.1% | 1.2% | |
| Other | 1.0% | 1.4% | |
| Other | 0.9% | 0.8% | |
| Other | 1.2% | 0.9% | |
| Other | 1.0% | 1.4% | |
| Other | 1.0% | 0.9% | |
| Other | 0.9% | 1.5% | |
| Other | 0.4% | 0.5% | |
| Other | 0.3% | 0.4% | |
| Other | 2.1% | 1.4% | |
| Other | 1.5% | 2.2% | |
| Other | 0.7% | 1.0% | |
| Other | 2.5% | 0.6% | 0.3% |
| Other | 0.3% | 0.7% | |
| Other | 0.6% | 0.8% | |
| Other | 0.6% | 0.9% | |
| Other | 0.4% | 0.8% | 0.7% |
| Other | 2.4% | 3.9% | |
| Other | 2.7% | 3.7% | |
| Other | 0.8% | 0.8% | |
| Other | 2.0% | 3.0% | |
| Other | 2.1% | 2.0% | |
| Other | 0.5% | 0.5% | |
| Vancouver | 3.8% | 4.1% | 7.3% |
| Other | 0.5% | 0.6% | 1.1% |
| Other | 4.0% | 1.5% | 1.8% |
| Other | 2.7% | 1.4% | 0.9% |
- Note: Employment Insurance Economic Regions where borders were changed in 2014/2015 are not reflected in this chart.
- 1 Includes claims for which at least $1 of Employment Insurane was paid (regular or fishing benefits).
- Source: Statistics Canada, Labour Force Survey (for data on population); and ESDC, Employment Insurance (EI) administrative data (for data on EI claims). ESDC data is based on a 10% sample of EI administrative data, exceptfor fishing claims which are based on a 100% sample.
3.2 Coverage, Eligibility and Access to Employment Insurance Fishing Benefits:
3.2.1 Coverage and Eligibility for Employment Insurance Fishing Benefits
To be covered by EI fishing benefits, an individual must meet the definition of a self-employed fisher and pay EI premiums during the qualifying period (usually the 31-week period prior to making a claim). We estimate that the EI Program covers approximately 20,000 to 21,000 self-employed fishers. Footnote 128
Eligibility for fishing benefits is based on the insurable earnings from fishing, rather than the number of hours of insurable employment (the hours worked), as is the case for other types of EI benefits. Footnote 129 To be eligible to receive fishing benefits, applicants must be ineligible to receive regular EI benefits and must have earned, during their qualifying period, minimum insurable earnings ranging from $2,500 to $4,200 as a self-employed fisher, depending on the regional rate of unemployment in the EI economic region where they live (see Table 43) Footnote 130 . These income thresholds have remained the same since 1996.
| Regional Unemployment Rate1 | Insurable Earnings |
|---|---|
| 6.0% or Lower | $4,200 |
| 6.1%–7.0% | $4,000 |
| 7.1%–8.0% | $3,800 |
| 8.1%–9.0% | $3,600 |
| 9.1%–10.0% | $3,400 |
| 10.1%–11.0% | $3,200 |
| 11.1%–12.0% | $2,900 |
| 12.1%–13.0% | $2,700 |
| 13.1 or Higher | $2,500 |
- 1 Unemployment rates used for the EI program are moving averages of seasonally adjusted monthly unemployment rates produced by Statistics Canada, as per section 17 of the Employment Insurance Regulations.
- Source : Employment Insurance Regulations (fishing), section 8.
Claimants who qualify for fishing benefits may receive benefits for a maximum of 26 weeks per claim, with the possibility of establishing two claims per year: one in the winter and another in the summer (since there are two separate qualifying and benefit periods for fishing benefits: a winter qualifying period that corresponds to the winter fishing season, for which the benefit period can start in April, and a summer qualifying period that corresponds to the summer fishing season, for which the benefit period can start in October).
However, if an individual has just started working as a self-employed fishers or is returning to fishing after an absence of a year or more preceding the qualifying period, he or she is considered as a new-entrant/re-entrant (NERE) and must earn at least $5,500 in insurable earnings from self-employed in fishing to qualify for fishing benefits.
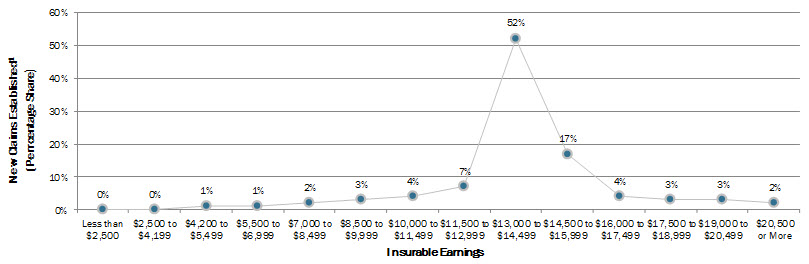
For roughly the last ten years, over 95% of fishers who have had a fishing claim established qualified to receive these benefits with insurable earnings above $5,500, which is the minimum eligibility requirement for NERE fishers. In 2014/2015, this proportion was 99 % (see Chart 44).
Show Data Table
| 2014/2015 | |
|---|---|
| Insurable Earnings | New Claims Established (Percentage Share) |
| Less than $2,500 | 0% |
| $2,500 to $4,199 | 0% |
| $4,200 to $5,499 | 1% |
| $5,500 to $6,999 | 1% |
| $7,000 to $8,499 | 2% |
| $8,500 to $9,999 | 3% |
| $10,000 to $11,499 | 4% |
| $11,500 to $12,999 | 7% |
| $13,000 to $14,499 | 52% |
| $14,500 to $15,999 | 17% |
| $16,000 to $17,499 | 4% |
| $17,500 to $18,999 | 3% |
| $19,000 to $20,499 | 3% |
| $20,500 and more | 2% |
- 1 Includes claims for which at least $1 of fishing benefits was paid.
- Source: ESDC, Employment Insurance (EI) administrative data. Data are based on a 10O% sample of EI administrative data.
3.2.2 Accessibility to Employment Fishing Benefits
Although 27,587 new claims for fishing benefits were established in 2014/2015, only 19,732 fishers had a claim established during this period, which represented an increase of 416 fishers (+2.2 %) since 2013/2014. The large difference between the number of fishing claims and the number of fishers making these claims is explained by the fact that some fishers are active in both fishing seasons (winter and summer) and are eligible for fishing benefits twice a year. As a result, some fishers made two claims in 2014–2015.
Among the provinces leading the fishing activities in Canada in 2014/2015, there was a year-over-year increase in the number of fishers who had a claim established in British Columbia (+493 for a total of 3,081 fishers), New Brunswick (+26 for a total of 1,951 fishers), Nova Scotia (+9 for a total of 3,805 fishers) and Prince Edward Island (+8 for a total of 1,904 fishers). Newfoundland and Labrador ( 118 for a total of 7,172 fishers) and Quebec ( 13 for a total of 828 fishers) were the only provinces that posted decreases in the number of fishers who had fishing claims in 2014/2015.
In 2014/2015, 2,596 fishers (13 % of the total) had a fishing claim established during the winter qualifying period only, while 9,284 fishers (47 % of the total) did so during the summer qualifying period only. Moreover, during the same period, 7,852 fishers (40 % of the total) made more than one fishing claim. As a result, the number of claims from individuals who made multiple claims (15,707) accounted for more than half (57%) of all fishing claims that were established in 2014/2015. Compared to 2013/2014, the number of fishers who had only a single claim established in 2014/2015 increased by 420 (+3.7 %), while the number of fishers who had multiple claims dropped by only 4 ( 0.1 %).
The Atlantic Provinces and Quebec accounted for 98% of all fishers who made multiple fishing claims. The number of fishers who had multiple claims established varied as follows in 2014–2015: Newfoundland and Labrador (+60 for a total of 3,987 fishers), New Brunswick (+13 for a total of 839 fishers), Prince Edward Island (+1 for a total of 939 fishers), Quebec (-6 for a total of 562 fishers) and Nova Scotia (-48 for a total of 1,380 fishers). The fishers in Quebec and Newfoundland and Labrador were most likely to be active in both seasons, as 68 % and 56 % of claimants in these provinces, respectively, made multiple fishing claims in 2014–2015.
3.3 Level of Employment Insurance Fishing Benefits
The weekly benefit rate for fishers is calculated by dividing the total insurable earnings from fishing during the qualifying period (usually the 31-week period prior to making a claim) by the divisor that corresponds to the unemployment rate of the EI economic region in which the claimant lives (see Table 44), then by multiplying the result by the earnings replacement rate of 55 %, without exceeding the allowed maximum weekly benefit, which was $514 (in 2014) and $524 (in 2015) [see the example below].
| Regional Unemployment Rate1 | Denominator |
|---|---|
| 6.0% or Lower | 22 |
| 6.1%–7.0% | 21 |
| 7.1%–8.0% | 20 |
| 8.1%–9.0% | 19 |
| 9.1%–10.0% | 18 |
| 10.1%–11.0% | 17 |
| 11.1%–12.0% | 16 |
| 12.1%–13.0% | 15 |
| 13.1 or Higher | 14 |
- 1 Unemployment rates used for the EI program are moving averages of seasonally adjusted monthly unemployment rates produced by Statistics Canada, in accordance with Article 17 of the Employment Insurance Regulations.
- Source : Employment Insurance Regulations (fishing), article 8.2.
The average weekly fishing benefit rate increased by 4.1%, from $465 in 2013/2014 to $484 in 2014/2015. With this increase, the average weekly benefit rate for fishers remained significantly higher than that paid to regular claimants ($434), as has been the case for a number of years, by about 10 %. Over the past few years, average weekly fishing benefit rates have tended to be systematically lower in British Columbia than in the other provinces (gap of 5 to 10 % compared to the national average). The same trend was observed in 2014/2015.
The average weekly fishing benefit rate remained close to the maximum weekly benefit rate of $ 514 (in 2014) and $ 524 (in 2015). The proportion of benefit claims for which fishers received the maximum benefit rate increased from 67 % in 2013/2014 to 75% in 2014/2015. This proportion is much higher than for regular claimants who received the maximum benefit rate (47 % in 2014/2015).
In part, this is because in 2014/2015, 59 % of self-employed claimants who had a fishing claim lived in an economic region with an unemployment rate higher than 13%; in addition, they represented almost two-thirds (64 %) of all fishing claims that were established. In regions with a high unemployment rate, the divisor used to calculate weekly earnings is lower, resulting in a higher benefit rate, which increases the likelihood of receiving the maximum benefit rate.
Example:
Calculation of the weekly fishing benefit
In 2015, Jean earned $9,865 as a self-employed fisher during the 31 weeks of his qualifying period. The rate of unemployment in his region of residence is 11.5%; the divisor is therefore 16. If we divide his fishing earnings of $9,865 by 16, we obtain weekly insurable earnings of $616.56. Jean will therefore receive $339 a week in fishing benefits, that is, 55% of $617, which is lower than the maximum weekly benefit ($524 in 2015). If Jean's weekly insurable earnings had been $1,000, Jean would have received the maximum weekly benefit of $524 (and not 55% of $1,000, or $550).
- Source: Employment Insurance (Fishing) Regulations, section 8.2.
In comparison with regular claimants who received an average of $ 6,950 in regular benefits in 2014/2015, fishers who established a claim in 2014/2015 received an average of $ 10,646 in fishing benefits, while fishers who established two claims in 2014/2015 received an average of $9,776 for the first claim and of $ 8,754 for the second claim, averaging a total of $ 18,530.
3.3.1 Working while on claim
EI administrative data indicate that, of all the weeks of benefits paid to fishers in 2014/2015, 10 % of these weeks were paid to claimants who worked during the week in question. As mentioned in Section 2.3.1.3 of chapter II, this proportion is lower than the proportion observed for regular benefits but higher than the proportion for parental and compassionate care benefits.
3.4 Maximum Duration and Actual Duration of Employment Insurance Fishing Benefits Footnote 131
The maximum duration of the fishing benefits is established at 26 weeks per claim, regardless of the claimant's region of residence.
In 2014/2015, the average actual duration of fishing benefits was 20.7 weeks (preliminary data), Footnote 132 compared to 20.8 weeks in 2013/2014 and 20.5 weeks in 2012/2013. Among the provinces leading the fishing activities in Canada, British Columbia, whose fishers generally fish for only a single season and historically have the longest average actual duration of benefits, had an average of 23.2 weeks, slightly up from 2013/2014 (22.8 weeks). The average actual duration of benefits in the Atlantic provinces and Quebec varied between 19.5 and 20.7 weeks per claim, slightly down from 2013/2014 (between 19.8 and 21.0 weeks).
Fishers who had a single claim in 2014/2015 received an average of 24.7 weeks of fishing benefits, compared to 24.8 weeks in 2013/2014 and 24.5 weeks in 2012/2013. Fishers who had two claims received benefits for an average of 20.3 weeks for their first claim (compared to 20.8 and 20.1 weeks in 2013/2014 and 2012/2013 respectively) and for 18.2 weeks for the second claim (compared to 17.8 and 18.0 weeks in 2013/2014 and 2012/2013 respectively), which represents an overall average of 38.6 benefit weeks in total (compared to 38.6 and 38.0 weeks in 2013/2014 and 2012/2013 respectively).