
Employment Insurance Monitoring and Assessment Report 2014/2015 Chapter II - 1. Employment Insurance benefits
1. Employment Insurance benefits
The Employment Insurance (EI) program provides temporary income support to workers who have lost their job for reasons beyond their control, while they look for work or upgrade their skills. The program also provides temporary financial assistance to workers who are sick, pregnant, or caring for a newborn, a newly adopted child, a critically ill child or a family member who is seriously ill with a significant risk of death.
In this chapter, EI benefits include regular benefits (created in 1940), fishing benefits (created in 1956), special benefits—namely maternity benefits (created in 1971), parental benefits (created in 1990), sickness benefits (created in 1971), compassionate care benefits (created in 2004) and benefits for parents of critically ill children (created in 2013)—as well as work-sharing benefits (created in 1977).
The amount paid in EI benefits is derived from three key factors: the number of claims, the average weekly benefit rate (that is, the benefit level) and the duration of benefits. In general, an increase in one of these indicators will have a positive impact on the amount paid. The number of claims, amount paid and benefit levels are discussed in the next section (Section 1.1), and the duration of benefits is dealt with later, in the sections on the various types of benefits (sections 2, 3, 4 and 5). Section 1.2 discusses combined-benefit claims, which are a new analysis element in this report. Section 1.3 provides an analysis of the Family Supplement provision, and Section 1.4 deals with support for apprentices under the EI program. Lastly, Section 1.5 provides an analysis of the impact of the premium refund provision, and Section 1.6 discusses income redistribution from EI benefits.
In this part, “EI claim” is a claim for which at least one dollar has been paid in EI benefits.
1.1 Employment Insurance claims, amount paid and level of benefits
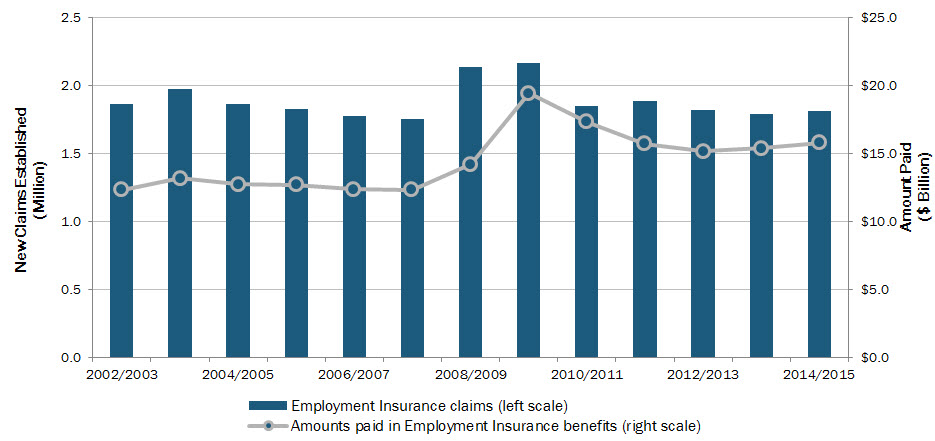
In 2014/2015, the total number of new EI claims edged up 1.0% to 1.81 million. This was the first increase after two consecutive years of decline.
As shown in Chart 1, the number of new claims established in 2014/2015 is below the peak of 2.17 million in 2009/2010, which was the culmination of the effects of the 2008 recession, and below the annual levels in the following years, until 2012/2013.
Show Data Table
| Million | $ Billion | |
|---|---|---|
| Employment Insurance claims (left scale) | Amounts paid in Employment Insurance benefits (right scale) | |
| 2002/2003 | 1.87 | $12.3 |
| 2003/2004 | 1.97 | $13.2 |
| 2004/2005 | 1.86 | $12.7 |
| 2005/2006 | 1.83 | $12.7 |
| 2006/2007 | 1.78 | $12.4 |
| 2007/2008 | 1.76 | $12.3 |
| 2008/2009 | 2.14 | $14.2 |
| 2009/2010 | 2.17 | $19.4 |
| 2010/2011 | 1.85 | $17.3 |
| 2011/2012 | 1.88 | $15.7 |
| 2012/2013 | 1.82 | $15.2 |
| 2013/2014 | 1.79 | $15.4 |
| 2014/2015 | 1.81 | $15.8 |
- 1 Includes claims for which at least $1 of Employment Insurance benefits was paid.
- Source: ESDC, Employment Insurance (EI) administrative data. Data are based on a sample of 10% of the EI administrative data.
The main reason for the increase in 2014/2015 was an increase in special benefit claims (+1.8%)—especially sickness benefits (+2.5%)—and regular benefit claims (+1.3%) [see Table 1]. This increase was entirely the result of an increase of 16.4% (23,970 claims) in the number of claims from Alberta, which had experienced an economic slowdown during the year.
In 2014/2015, an average of 755,550 claimants were receiving EI benefits each month, down 0.8% compared with the average of 761,820 claimants in 2013/2014, according to Statistics Canada. Footnote 5 This number is the number of EI claimants who received at least one dollar in EI benefits during the reference period within the given month (usually the week of the 15th day of the month). The number is affected by the inflow of new EI claimants and the outflow of EI claimants no longer receiving benefits, mainly because they have exhausted the number of weeks of benefits to which they were entitled or because they have returned to work.
Usually, EI claims and the number of claimants tend to change in the same direction, except when there is a change in the duration of benefits or a large, sudden jump or decrease in the number of claims. During an economic shock, the number of claims increases faster than the number of claimants because there is a lag between the time that the new claims are received and the time that the benefit period is established and benefits are payable. Conversely, if the number of claims decreases, the number of claimants will remain high for a time, because of earlier claims for which benefits continue to be paid, until the benefits are exhausted or the claimants find work.
Like the number of EI claims, the amount paid in benefits also increased in 2014/2015 to $15.8 billion, up 2.8% compared with 2013/2014 (see Chart 1).
The increase in benefits paid is mainly the result of a 2.3% increase in the amount paid in regular benefits and a 4.1% increase in amount paid in special benefits. This is the second consecutive year in which the total benefits paid has increased following the decrease in 2012/2013 relative to 2011/2012. This increase in benefits paid is also the result of an increase in average weekly benefits and the number of claims established in 2014/2015.
| Type of Employment Insurance Benefits | New Claims Established1 | |
|---|---|---|
| 2013/2014 | 2014/2015 | |
| Regular Benefits | 1,325,810 | 1,342,610 |
| Fishing Benefits | 26,700 | 26,250 |
| Special Benefits2 | 516,820 | 526,100 |
| Maternity Benefits | 169,640 | 169,080 |
| Parental Benefits (Biological Parents) | 189,480 | 189,740 |
| Parental Benefits (Adoptive Parents) | 1,640 | 1,580 |
| Sickness Benefits | 336,800 | 345,070 |
| Compassionate Care Benefits | 6,150 | 6,120 |
| Parents of Critically Ill Children Benefits | 1,470 | 2,560 |
| Work-sharing Benefits | 11,830 | 8,260 |
| Canada3 | 1,793,420 | 1,811,360 |
- Note: Totals may not add due to rounding.
- 1 Includes claims for which at least $1 of Employment Insurance benefits was paid.
- 2 The numbers for Employment Insurance (EI) special benefits do not add up to the total presented because EI claimants can apply for multiple types of EI benefits in one EI claim.
- 3 The numbers in this table do not add up to the total presented because Employment Insurance (EI) claimants can apply for multiple types of EI benefits in one EI claim.
- Source: ESDC, Employment Insurance (EI) administrative data. Data are based on a 10% sample of EI administrative data.
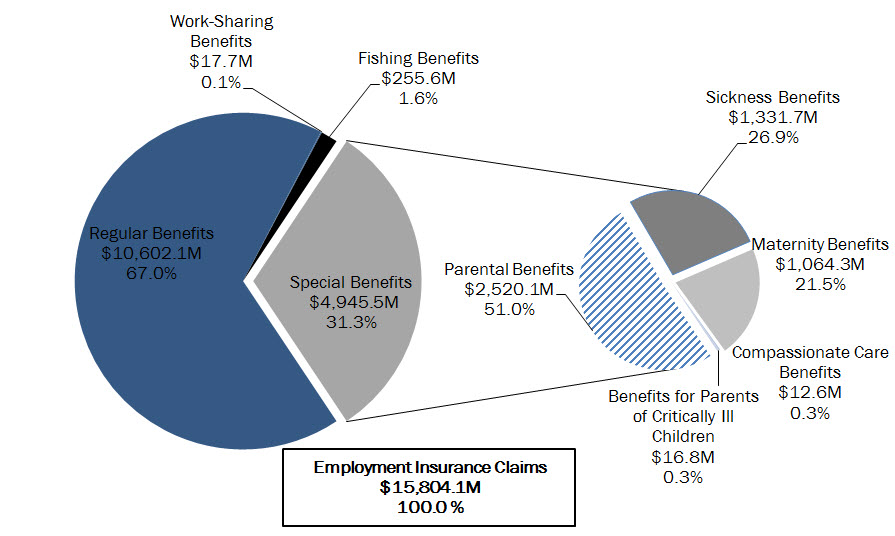
In 2014/2015, of the $15.8 billion paid in EI benefits, regular benefits accounted for 67.0% of the total, while special benefits accounted for 31.3% (see Chart 2).
The other types of benefits, such as fishing and work-sharing benefits, accounted for 1.7% of the total EI benefits paid in 2014/2015.
Show Data Table
| $ Million | % Share | |
|---|---|---|
| Regular Benefits | 10,602.1 | 67.0 |
| Work-Sharing Benefits | 17.7 | 0.1 |
| Fishing Benefits | 255.6 | 1.6 |
| Special Benefits | 4,945.5 | 31.3 |
| Parental Benefits | 2,520.1 | 51.0 |
| Sickness Benefits | 1,331.7 | 26.9 |
| Maternity Benefits | 1,064.3 | 21.5 |
| Compassionate Care Benefits | 12.6 | 0.3 |
| Benefits for Parents of Critically Ill Children Benefits | 16.8 | 0.3 |
| Total | 15,821.0 | 100.0 |
- 1 Amounts are expressed in millions of dollars.
- Source: ESDC, Employment Insurance (EI) administrative data. Data are based on a sample of 10% of the EI administrative data.
Economic cycles and labour market conditions tend to have a greater effect on the number of regular benefit claims and the amount paid in regular benefits than on the number of special benefit claims. For example, the unemployment rate fell 0.1 percentage points, from 7.0% in 2013/2014 to 6.9% in 2014/2015. This modest decline is consistent with the slight increases of 1.3% in the number of regular benefits and 2.3% in the amount paid, which are smaller than the increases for special benefits: the number of special benefit claims rose 1.8% and the amount paid climbed 4.1%. These data suggest that the number of special benefit claims and the associated amounts are in general more greatly affected by demographic changes and changes in the characteristics of the labour force.
In 2014/2015, the average weekly benefit rate was $431, up 3.4% compared with the 2013/2014 level ($417).
1.1.1 Employment insurance claims, amount paid and level of benefits, by province and territory
Provincial and territorial labour markets vary in their demographic and sectoral composition. Therefore, the provincial and territorial distribution of EI claims and amount paid in benefits do not necessarily align with the geographic distribution of employment, as shown in Table 2.
| Province and Territory | New Claims Established1
(Share) |
Amount Paid (Share) |
Employment (Share) |
|---|---|---|---|
| Newfoundland and Labrador | 4.5% | 5.5% | 1.3% |
| Prince Edward Island | 1.2% | 1.3% | 0.4% |
| Nova Scotia | 4.4% | 4.7% | 2.5% |
| New Brunswick | 4.7% | 5.2% | 2.0% |
| Quebec2 | 27.2% | 22.2% | 22.8% |
| Ontario | 31.0% | 33.4% | 38.6% |
| Manitoba | 3.2% | 3.2% | 3.5% |
| Saskatchewan | 2.6% | 2.8% | 3.2% |
| Alberta | 9.4% | 9.5% | 12.8% |
| British Columbia | 11.5% | 11.8% | 12.8% |
| Yukon3 | 0.1% | 0.2% | Not applicable |
| Northwest Territories3 | 0.1% | 0.2% | Not applicable |
| Nunavut3 | 0.1% | 0.1% | Not applicable |
| Canada | 100.0% | 100.0% | 100.0% |
- Note: Totals may not add due to rounding.
- 1 Includes claims for which at least $1 of Employment Insurance benefits was paid.
- 2 Quebec data does not include maternity and parental benefits, as the province has its own program—the Quebec Parental Insurance Plan (QPIP)—to administer such benefits.
- 3 Due to operational difficulties inherent to remote locations, Statistics Canada uses an alternate methodology in the administration of the Labour Force Survey in the territories. To ensure data consistency, the territories are excluded from analysis for employment.
- Sources: ESDC, Employment Insurance (EI) administrative data (for data on claims and amount paid); and Statistics Canada, Labour Force Survey, CANSIM Table 282-0001 (for data on employment). ESDC data are based on a 10% sample of EI administrative data.
Comparing the distribution of EI claims to the distribution of employment reveals that the Atlantic provinces and Quebec were overrepresented in terms of the number of claims relative to their share of employment. Conversely, Ontario and the western provinces were underrepresented. For example, the Atlantic provinces accounted for 14.8% of all new EI claims established in 2014/2015, but they accounted for 6.2% of jobs across Canada. Conversely, Ontario accounted for 31.0% of all EI claims established in 2014/2015, but it accounted for 38.6% of jobs across Canada.
Except for Quebec, the distribution is similar for amount paid in EI benefits. In 2014/2015, the Atlantic provinces received 16.7% of the amount paid in benefits (but accounted for 6.2% of jobs), while Ontario and the western provinces received 60.8% of the amount paid (but accounted for 71.0% of jobs).
In 2014/2015, Alberta was the jurisdiction with the greatest increase in EI claims, up 23,790 claims (+16.4%). Saskatchewan (up 3,460 claims or +7.8%) and British Columbia (up 3,190 claims or +1.6%) had more modest increases, while Ontario had a decrease of 11,360 claims (-2.0%). The number of new claims did not change significantly in the other provinces and territories.
The increase in EI claims in Alberta is mainly the result of a 25.9% increase in new regular benefit claims in response to the province’s economic decline toward the end of 2014/2015.
Between 2013/2014 and 2014/2015, the amount paid in EI benefits rose in all jurisdictions except New Brunswick and the three territories. The greatest percentage increases were in Alberta (+9.0%), Saskatchewan (+5.7%) and Prince Edward Island (+5.7%). Two factors are behind the increases: a greater number of new claims and a rise in average weekly benefit rates. Although the average weekly benefit rate went up in each province and territory, the greatest percentage increases were in Saskatchewan (+4.6%) and Alberta (+4.2%). The average weekly benefit rate varied from a minimum of $412 in New Brunswick to a maximum of $495 in the Northwest Territories, with the three territories and Alberta posting the highest rates.
1.1.2 Employment Insurance claims, amount paid and level of benefits, by gender and age
After two consecutive years of decline, the number of EI claims established by both men and women rose in 2014/2015. The greatest increase was among men (1.8% or +17,470 claims). By contrast, the increase among women was small (+0.1%), or 470 claims more than in the previous year. In 2014/2015, women established 45% of EI claims, and men, 55%.
The amount paid in EI benefits increased in similar proportions among men (+2.8%) and women (+2.9%) in 2014/2015. Women received 49% of the amount paid in 2014/2015, compared with 51% for men.
In 2014/2015, the average weekly benefit rate for men was $457, significantly higher than the rate for women ($395). This gap has existed for numerous years.
The age group distribution of claimants who established EI claims in 2014/2015 shows that those aged 25 to 44 years had the most claims, namely 48%. They were followed by claimants aged 45 to 54 years (22%), those aged 55 years or older (20%) and those aged 24 years or younger (10%). It was found that the number of claims went up for two age groups when the number decreased for the other two groups. Specifically, claims by those aged 25 to 44 years and those aged 55 years or older climbed 1.4% (+12,020 claims) and 4.0% (+14,120 claims), respectively, compared with 2013/2014, while claims by those aged 24 years or younger and those aged 45 to 54 years fell 0.2% (-360 claims) and 2.0% (-7,840 claims), respectively. Note that the number of new claims has increased each year since 2010/2011 for claimants aged 55 years or older, while it has decreased each year for claimants aged 24 years or younger over the same period.
Population aging in Canada has led to a considerable increase in the number of older workers in the labour force, which may be the cause of the increase in EI claims by this age group. Since 2010/2011, the number of workers aged 55 years or older has increased 18.3% (+543,330). Over the same period, the number of workers aged 25 to 44 years has increased only 4.4% (+320,720), and the number of workers aged 15 to 24 years, only 1.7% (+42,620). As for the number of workers aged 45 to 54 years, it has decreased 2.7% (-116,890).
Similar to previous years, the average weekly benefit rate for youth ($394) was lower than the rate for claimants aged 55 years and older ($417), 45 to 54 years ($434) and 25 to 44 years ($442).
1.1.3 Employment Insurance claims, amount paid and level of benefits, by Employment Insurance claimant category Footnote 6
The breakdown of data on new claims by claimant category shows that, in 2014/2015, occasional claimants represented the majority of claimants (59%), while long-tenured workers and frequent claimants represented 23% and 18% of claimants, respectively. An analysis of the number of claimants shows that the increase in the number of benefits in 2014/2015 (+1.0%) is the result of an increase in the number of occasional claimants (+7.3%), because the number of new claims established for long-tenured workers and frequent claimants decreased 10.6% and 1.8%, respectively.
The average weekly benefit rate in 2014/2015 was higher for long-tenured workers ($468) than for frequent claimants ($439) and for occasional claimants ($414). However, the increase in the average weekly benefit rate was greater for occasional claimants (+4.3%) than for long-tenured workers (+3.3%) and for frequent claimants (+2.6%).
As for amount paid, 55% went to occasional claimants, while long-tenured workers and frequent claimants received 25% and 20%, respectively. As a result, occasional claimants received a smaller proportion of the amount paid relative to their proportion of number of new claims (55% versus 59%). This difference is mainly the result of their average weekly benefit rate being lower than that of claimants in the other two categories. Comparing 2013/2014 with 2014/2015, it can be seen that the amount paid to long-tenured workers fell 11.4%, while amount paid to occasional claimants climbed 11.6% and amount paid to frequent claimants remained relatively stable (+0.6%).
1.2 Combined Employment Insurance claims
The EI program allows a claimant to receive multiple types of benefits in a single benefit period. Under certain provisions, all benefits can be combined, with the exception of regular and fishing which cannot be combined in the same claim. Table 3 provides the distribution of pure and combined benefits for the 2014/2015 fiscal year. Pure claims are those claims in which an EI claimant receives only one benefit type, while claims where the claimant is in receipt of more than one benefit type are referred to as combined or mixed claims.
| Benefit Type2 | Pure Claims | Combined Claims | Total | |||||
|---|---|---|---|---|---|---|---|---|
| (One Benefit Type) | Claims With One Additional Benefit Type (Two Benefit Types) |
Claims With Two or More Additional Benefit Types (Three Benefit Types or More) |
||||||
| Total | Major Groupings | All Other | Total | Major Groupings | All Other | |||
| Regular | 90% | 9% | Sickness: 9% | 0% | 0% | None | 0% | 100% |
| Fishing | 90% | 10% | Sickness: 10% | 0% | 0% | None | 0% | 100% |
| Maternity | 2% | 84% | Parental: 82% Sickness: 2% |
1% | 14% | Parental + Sickness: 12% Regular + Sickness: 1% |
0% | 100% |
| Parental3 | 14% | 73% | Maternity: 72% Regular: 1% |
0% | 12% | Maternity + Sickness: 11% Maternity + Regular: 1% |
0% | 100% |
| Sickness | 56% | 37% | Regular: 35% | 2% | 6% | Maternity + Parental: 6% | 0% | 100% |
| Compassionate Care | 62% | 32% | Sickness: 16% Regular: 16% |
0% | 6% | Sickness + Regular: 5% | 0% | 100% |
| Work-sharing | 79% | 20% | Regular:16% Sickness: 3% |
0% | 1% | None | 0% | 100% |
| All Claims | 83% | 15% | 1% | 100% | ||||
- Note: Total may not add up due to rounding.
- 1 Includes all claims where at least one dollar in Employment Insurance benefits was paid.
- 2 Excludes benefits for parents of critically ill children.
- 3 Parental benefits for biological parents and parental benefits for adoptive parents are grouped together.
As can be seen from Table 3, in 2014/2015 pure claims accounted for 83% of all claims. Pure claims represented the highest proportion of claims for most benefit types, with the exception of maternity and parental benefits, which were pure in only 2% and 14% of cases, respectively. Those claims which contained two benefit types accounted for 15% of total claims, while claims with three or more benefit types accounted for just 1%.
Maternity claims had the highest proportion of two benefit type claims, which represented 84% of all maternity claims. The maternity and parental grouping accounted for 82% of all maternity claims, reflecting the similar circumstances under which the benefits are taken, and 72% of all parental claims, demonstrating the fact that most parental benefits are taken by women.
When considering claims with two additional benefit types, a combination of maternity, parental and sickness benefits was the largest grouping at 12% of total maternity claims (or 11% and 6% of parental and sickness claims respectively). According to a 2013 study, Footnote 7 98% of females living outside of Quebec Footnote 8 who claimed maternity or parental with sickness benefits took sickness benefits first. This may suggest that the common grouping of maternity and sickness claims could be attributed to difficult pregnancies, as maternity benefits are available only eight weeks prior to the child’s expected date of birth.
Sickness benefits accounted for the third largest proportion of claims with two or more benefit types, with approximately 44% of claims being mixed. Sickness benefits was most frequently claimed with regular benefits, accounting for 35% of all sickness claims, or 9% of all regular claims. Claims which received both fishing and sickness benefits accounted for 10% of all fishing claims.
When combined, compassionate care benefits (CCB) were most frequently claimed with regular and sickness benefits. According to a 2014 study, the rate of pure compassionate care benefits has been increasing since it became available in 2003/2004, at which time only 41% of CCB claims were pure. Footnote 9 The study also found that, of the CCB claims grouped with regular benefits, 41% received compassionate care benefits first, while of those grouped with sickness benefits, 72% of cases began with the CCB. The study proposed that the high rate of CCB preceding sickness benefits may be caused by the stress of caring for a family member with a serious medical condition. In 5% of compassionate care claims, the benefit is grouped with both sickness and regular.
Finally, although work-sharing claims were generally pure (79%), when grouped the benefits were most often combined with regular benefits, with the work-sharing and regular grouping making up 16% of total work-sharing claims. This is primarily driven by the similar circumstances under which the two benefit types are taken; specifically, work-sharing is provided to those at risk of lay-off while regular benefits are provided for those who have already been laid off. In addition, to receive work-sharing benefits a claimant must have accumulated sufficient a sufficient number of hours to qualify for regular benefits, and as such would be automatically eligible for regular benefits in the event they are laid off.
1.3 Family supplement provision
Targeting low-income families, the family supplement provides additional benefits to EI claimants with one or more children (under the age of 18) who receive the Canada child tax benefit (CCTB), Footnote 10 and who have an annual family net income of less than or equal to $25,921. Footnote 11 For eligible claimants, the family supplement can increase the benefit rate, from 55% of weekly insurable earnings to a maximum of 80% of their weekly insurable earnings, and is available for all benefit types. Footnote 12 Claimants are eligible to receive the full family supplement if their family net income is less than $20,921. After $20,921, the family supplement is reduced gradually until the family net income reaches $25,921, after which the supplement is equal to zero.
The amount of the family supplement also takes into account the number and ages of the children for whom the claimant receives the CCTB. Table 4 shows how the amount of the family supplement is calculated for selected family income ranges, on the condition that it cannot exceed 25% (i.e., 80% minus 55%) of the claimant’s weekly insurable earnings.
| Number and Age of Children | Selected Family Income Range | |||
|---|---|---|---|---|
| Less than $20,921 | $21,751 to $22,000 | $23,751 to $24,000 | $25,751 to $25,921 | |
| Number of Children | ||||
| One | $31.30 | $24.45 | $10.70 | $0.70 |
| Two | $58.70 | $46.25 | $20.70 | $1.40 |
| Three | $86.10 | $68.20 | $31.05 | $2.10 |
| Top-ups for Each Additional Child | $27.45 | $22.85 | $11.90 | $0.95 |
| Age of Children | ||||
| Age Supplement for Each Child Under 7 Years Old | $4.15 | $3.45 | $1.80 | $0.15 |
- Source: Employment Insurance Regulations, section 34.
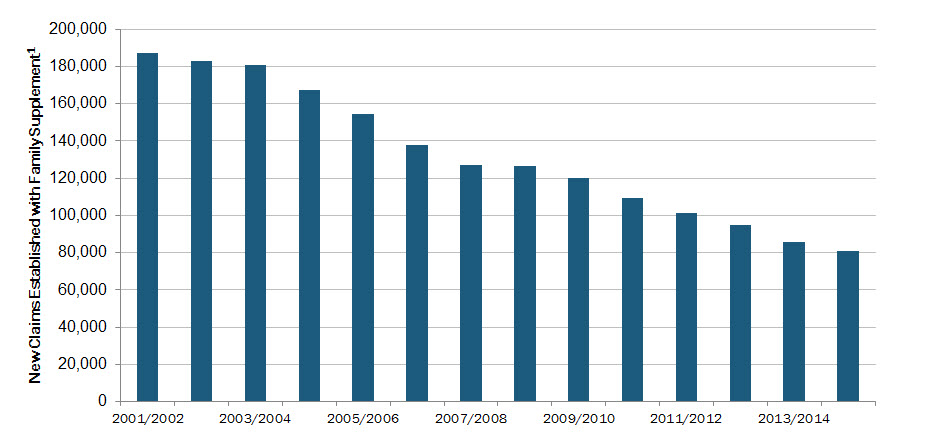
A total of 80,910 claims qualified for the family supplement in 2014/2015, a decrease of 5.9% from the previous year. As Chart 3 indicates, the number of EI claimants receiving the family supplement has now decreased for 13 consecutive years, falling from 187,320 in 2001/2002 to 80,910 in 2014/2015, representing a 56.8% decrease. As a proportion of total EI claims, claims with family supplement have consistently dropped since 2006/2007 (from 7.7% in 2006/2007 to 4.5% in 2014/2015). Over the same time period, the share of family supplement benefits to total EI benefits has decreased from 1.2% to 0.6%. The overall decline in these claims can be partially attributed to the fact that the family income threshold has been held constant at $25,921 since 1997, while family incomes have continued to rise resulting in fewer EI claimants eligible. From 2001 to 2013, the median family income increased by 43.1%, from $53,500 to $76,550. Footnote 13
Show Data Table
| Employment Insurance Claims with Family Supplement | |
|---|---|
| 2001/2002 | 187,320 |
| 2002/2003 | 182,890 |
| 2003/2004 | 181,080 |
| 2004/2005 | 167,370 |
| 2005/2006 | 154,730 |
| 2006/2007 | 137,630 |
| 2007/2008 | 127,340 |
| 2008/2009 | 126,310 |
| 2009/2010 | 120,290 |
| 2010/2011 | 109,590 |
| 2011/2012 | 101,130 |
| 2012/2013 | 94,860 |
| 2013/2014 | 86,000 |
| 2014/2015 | 80,910 |
- 1 Includes claims for which at least $1 of Employment Insurance benefits with family supplement was paid.
- Source: ESDC, Employment Insurance (EI) administrative data. Data are based on a 10% sample of EI administrative data.
Almost 70% of claims with family supplement were established in Ontario (35%), Quebec (22%) and British Columbia (12%). The number of claims declined in all provinces except Manitoba, and the largest percentage decreases occurring in Newfoundland and Labrador (-14%) and Prince Edward Island (-12%).
Women accounted for 79% of new claims receiving the family supplement in 2014/2015. For their part, claimants aged 25 to 44 made up the majority of claims with family supplement (70%), while those aged 45 to 54 years, under 25 years old, and 55 years and older were responsible for 15%, 13% and 2% of them, respectively. Both women and men, as well as all age groups witnessed a decrease in their number of claims with family supplement in 2014/2015, compared to 2013/2014.
In 2014/2015, low-income families received $90.0 million in additional benefits through the family supplement, a decrease of 5.5% from the previous year. The amount paid for the family supplement in 2014/2015 decreased by 8.4% for men and by 4.8% for women. Women accounted for 82% of family supplement benefits, while men accounted for 18%.
1.3.1 Family supplement benefit rate
As previously mentioned, the family supplement can increase the replacement rate of a claimant’s weekly insurable earnings by a maximum of 25 percentage points (from 55% to 80%). In 2014/2015, the average weekly top-up for the family supplement was $41 compared to $43 in 2013/2014 In fact, because of the family supplement provision, the average weekly benefit rate of claimants receiving the supplement increased by 14%, from $295 to $336.
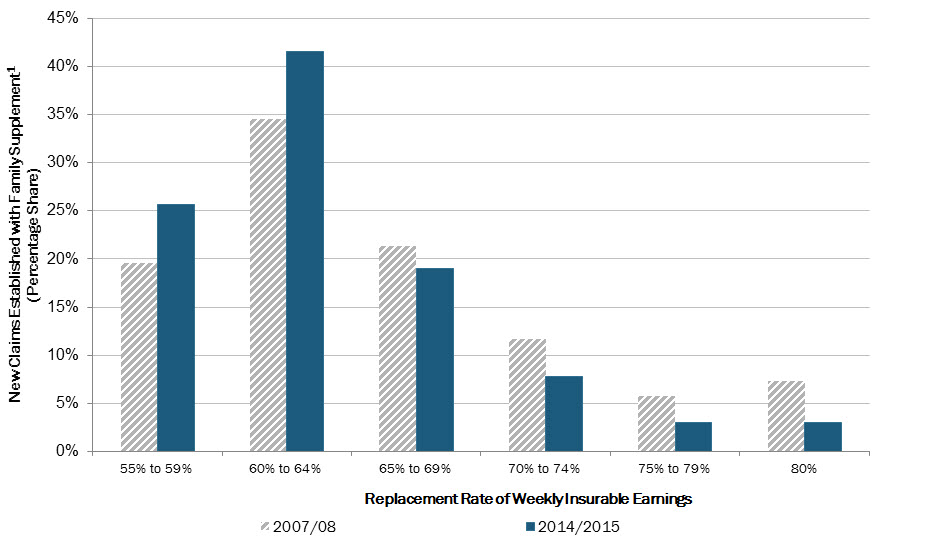
As shown in Chart 4, the distribution of claims with family supplement by replacement rate of earnings slightly shifted between 2007/2008 and 2014/2015, with a higher percentage of claims having a lower replacement rate in 2014/2015 compared to 2007/2008. Conversely, in 2014/2015, the proportion of claims with a higher replacement rate was lower than what was experienced in 2007/2008. In 2014/2015, 3.0% of claims with family supplement received a benefit rate that was equal to 80% of the claimant’s weekly insurable earnings, which was 4.3 percentage points lower than what was witnessed in 2007/2008 (7.3%).
Show Data Table
| Replacement Rate of Weekly Insurable Earnings | 2007/2008 | 2014/2015 |
|---|---|---|
| 55% to 59% | 19.6% | 25.7% |
| 60% to 64% | 34.5% | 41.5% |
| 65% to 69% | 21.3% | 19.0% |
| 70% to 74% | 11.7% | 7.8% |
| 75% to 79% | 5.7% | 3.0% |
| 80% | 7.3% | 3.0% |
- 1 Includes claims for which at least $1 of Employment Insurance benefits with family supplement was paid.
- Source: ESDC, Employment Insurance (EI) administrative data. Data are based on a 10% sample of EI administrative data.
These results are mainly driven by the fact that the parameters of the family supplement provision have been held constant for many years, resulting in an average top-up that has remained relatively unchanged over time (roughly $42). A constant family top-up combined with an increasing average benefit rate has caused the share of claims with family supplement leading to higher benefit rates to decrease from 2007/2008 to 2014/2015.
1.4 Employment Insurance support for apprentices
Apprenticeship is a key means by which individuals gain the skills and experience they need to be certified in the skilled trades. The skilled trades are a key part of the Canadian labour market, and a large number of employed Canadians work in skilled trades that are designated for apprenticeship training.
In Canada, the apprenticeship system is an industry-driven learning system that combines on-the-job training and technical training. On-the-job training (during which the apprentice is an employee and earns a wage) is under the direction of a qualified person. Technical training is the theoretical instruction, at a college or other training institution, to support what is learned in the workplace.
In most jurisdictions, to enter an apprenticeship program, a prospective apprentice must be at least 16 years old and have successfully completed Grade 12, or have an equivalent amount of work experience or related education. In addition, the potential apprentice must find a job with an employer who will sponsor and train him or her under the mentorship of a qualified person.
Each province or territory is responsible for apprenticeship training within its jurisdiction. As a result, apprenticeship programs in Canada, including the duration and delivery method of technical training, vary across trades and across provinces and territories. In Quebec, for example, apprentices complete all of their technical training at a college or training institution before beginning on-the job-training. In the rest of Canada, apprentices start with on-the-job training which is followed by technical training through a variety of approaches, including in-class learning, self-learning, distance learning, night classes or day release programs.
To help Canadians continue their apprenticeship and become certified journeypersons, the Employment Insurance program offers temporary income support to those who stop working for the sole purpose of attending full-time technical training (sometimes referred to as block-release training) provided that their respective province or territory refers them under section 25 of the Employment Insurance Act and that they meet the other EI eligibility requirements (e.g., have sufficient hours of insurable employment during their qualifying period).
Under the EI program, apprentices are required to serve only one two-week waiting period for the full duration of their apprenticeship, even if it involves multiple blocks of full-time in-class technical training. In addition, they can take advantage of applying for EI benefits up to seven days before the end of work and can elect to be exempt from bi-weekly reporting requirements while receiving EI benefits during full-time technical training. Apprentices attending full-time technical training also receive a special reference code issued by their province or territory or their training institution that facilitates faster processing of their EI claims. This reference code is issued for each block of full-time technical training.
Furthermore, employers may choose to offer Supplemental Unemployment Benefit (SUB) plans to increase the weekly earnings of their apprentices during their periods of technical training, up to 95% of the apprentice’s normal weekly earnings. Footnote 14
Outside of periods of full-time technical training, apprentices who lose their job due, for instance, to seasonal unemployment or termination of employment may also be eligible for EI regular benefits. Eligibility for EI in these cases would require that apprentices have a valid job separation and have accumulated enough hours of insurable employment during their qualifying period (usually the 52-week period prior to making a claim). In addition, apprentices who are sick, pregnant, caring for a newborn, newly adopted or critically ill child, or caring for a family member who has a serious medical condition with a significant risk of death may also apply for EI special benefits.
Furthermore, apprentices may be entitled to receive financial support under Part II of the Employment Insurance Act, which is delivered by the provinces and territories under the Labour Market Development Agreements, to help cover accommodation, child care, transportation and other costs while attending technical training. Other financial support from the Government of Canada is also available through programs such as the Canada Apprentice Loan and various apprenticeship grants.
The amount paid to apprentices in EI benefits is driven by three key indicators: the number of claims from apprentices, the duration of benefits, and the average weekly benefit rate (level of benefits). In general, an increase in one of these three indicators will have a positive impact on the total amount paid. In section 1.4.2, the number of claims and amount paid are discussed, while the duration and level of benefits are discussed in section 1.4.3. For the purpose of these sections, EI claims from apprentices refer to claims from apprentices referred under section 25 of the Employment Insurance Act for which at least $1 of Employment Insurance benefits was paid.
1.4.1 Employment Insurance claims from apprentices and amount paid
In 2014/2015, the number of new EI claims from apprentices increased by 2.4% compared to 2013/2014, from 52,730 claims to 54,010 claims. As a result, the amount paid in EI benefits reached $290.3 million in 2014/2015, representing an increase of 2.5% from the previous year when the amount paid was $283.1 million.
As mentioned in section 1.4.1, outside of periods of full-time training and during the benefit period of a claim, an apprentice may lose her or his job due to reasons such as lack of work or may need to take time off work to, for instance, care for a newborn child. If he or she meets the eligibility requirements, he or she may therefore receive EI regular or special benefits. Of the 54,010 claims established for apprentices in 2014/2015, 37% (or 20,100 claims) contained at least one week of regular benefits, and 3% (or 1,550 claims) included at least one week of special benefits.
The amount paid to apprentices in regular benefits was $76.9 million (representing 26% of the total amount of $290.3 million), whereas the amount paid in special benefits was $5.6 million (representing 2% of the total amount paid). Nearly the entire difference, specifically $207.3 million (or 71% of the total amount paid), represents the amount paid to apprentices while attending full-time technical training.
1.4.1.1 Employment Insurance claims from apprentices and amount paid, by province and territory
As Table 5 shows, in 2014/2015, 76% of EI claims from apprentices were established in Alberta (with a share of 38%), Ontario (with 23%), and British Columbia (with 15%). Alberta led all provinces and territories not only for the level of new claims established, but also for annual growth, with an increase of 1,840 claims in 2014/2015. In Ontario, the jurisdiction with second-largest number of claims from apprentices, the number of new claims established decreased by 370 claims.
In 2014/2015, total benefits paid to apprentices significantly increased in Alberta ($12.2 million) and decreased in Ontario (-$6.2 million), while there was little variation in the other provinces and territories. Of $290.3 million paid to apprentices in benefits, Alberta (with a share of 37%), Ontario (with 22%), and British Columbia (with 15%) accounted for 74% of benefits.
| Province and Territory | New Claims Established for Apprentices1 | Amount Paid | ||||
|---|---|---|---|---|---|---|
|
2013/2014 |
2014/2015 |
(Share) 2014/2015 |
($ Million) 2013/2014 |
($ Million) 2014/2015 |
(Share) 2014/2015 |
|
| Newfoundland and Labrador | 2,150 | 1,880 | 3% | 15.7 | 15.4 | 5% |
| Prince Edward Island | 50 | 280 | 1% | 0.3 | 1.6 | 1% |
| Nova Scotia | 1,560 | 1,360 | 3% | 9.9 | 8.2 | 3% |
| New Brunswick | 1,770 | 1,630 | 3% | 10.7 | 10.7 | 4% |
| Ontario | 12,920 | 12,550 | 23% | 70.7 | 64.5 | 22% |
| Manitoba | 2,910 | 3,040 | 6% | 15.0 | 15.6 | 5% |
| Saskatchewan | 4,310 | 4,390 | 8% | 19.7 | 21.7 | 7% |
| Alberta | 18,480 | 20,320 | 38% | 95.2 | 107.4 | 37% |
| British Columbia | 8,320 | 8,300 | 15% | 44.6 | 43.3 | 15% |
| Territories | 260 | 260 | 0% | 1.2 | 1.9 | 1% |
| Canada | 52,730 | 54,010 | 100% | 283.1 | 290.3 | 100% |
- Note: Totals may not add up due to rounding.
- 1 Includes claims from apprentices referred under section 25 of the Employment Insurance Act for which at least $1 of Employment Insurance benefits was paid.
- 2 No value are included for Quebec, which reflects its unique program design in which apprentices complete all of the in-class technical training prior to beginning on-the-job training.
- Source: ESDC, Employment Insurance (EI) administrative data. Data are based on a 10% sample of EI administrative data.
1.4.1.2 Employment Insurance claims from apprentices and amount paid, by gender and age
In 2014/2015, there were more male than female apprentices who received EI benefits while participating in apprenticeship programs and attending full-time technical training. Indeed, men made 96% of claims from apprentices, while women established only 4% of them, which is similar to data from previous years. The low number of claims for women is consistent with the low number of women who register in apprenticeship programs. Footnote 15 Out of $290.3 million paid to apprentices in 2014/2015, men received 95% of total benefits, while women accounted for 5% of benefits (see Table 6).
Also similar to previous years, claimants aged 25 to 44 years and those aged 25 and under tended to participate much more than older claimants (45 years and older) in apprenticeship programs and full-time technical training for which they received EI benefits. Table 6 shows that claimants aged 25 to 44 years were responsible for the highest percentage of claims from apprentices with 51%, followed by those under 25 years with 46%, and individuals aged 45 years and more were responsible for only 3% of new claims established for apprentices. In terms of benefits, claimants aged 25 to 44 years received 54% of benefits, while those aged less than 25 years and those aged 45 years and older received, respectively, 42% and 4% of amount paid in benefits.
According to a research paper, the low participation of older claimants (45 years and older) may be explained, among other things, by the fact that older employees may be choosing to forgo training for personal reasons. For example, being close to retirement may cause them to be less interested in training related to career advancement. Footnote 16 Another other study, Footnote 17 which found that the incidence of training declines with age, corroborates this finding.
| Gender and Age Group | New Claims Established for Apprentices1 | Amount Paid | ||||
|---|---|---|---|---|---|---|
|
2013/2014 |
2014/2015 |
(Share) 2014/2015 |
($ Million) 2013/2014 |
($ Million) 2014/2015 |
(Share) 2014/2015 |
|
| Gender | ||||||
| Men | 50,680 | 51,610 | 96% | 269.9 | 276.3 | 95% |
| Women | 2,050 | 2,400 | 4% | 13.2 | 14.0 | 5% |
| Age | ||||||
| 24 Years and Under | 24,610 | 24,940 | 46% | 119.8 | 123.2 | 42% |
| 25 to 44 Years | 26,470 | 27,310 | 51% | 151.8 | 155.4 | 54% |
| 45 Years and Older | 1,650 | 1,760 | 3% | 11.5 | 11.7 | 4% |
| Canada | 52,730 | 54,010 | 100% | 283.1 | 290.3 | 100% |
- Note: Totals may not add up due to rounding.
- 1 Includes claims from apprentices referred under section 25 of the Employment Insurance Act for which at least $1 of Employment Insurance benefits was paid.
- Source: ESDC, Employment Insurance (EI) administrative data. Data are based on a 10% sample of EI administrative data.
1.4.1.3 Employment Insurance claims from apprentices and amount paid, by industry and occupation
Similar to the past four years, apprentice claimants from the Construction industry, Manufacturing industry, the Other Services (excluding Public Administration) industry, and the Retail Trade industry received more EI benefits than claimants working in other industries.
As Table 7 shows, apprentices from the Construction industry were responsible for the largest number of new claims established in 2014/2015, with 56% of all claims for apprentices. Apprentices from the Manufacturing industry were next with 9% of all claims in 2014/2015. Apprentices from the Other Services (excluding Public Administration) industry had the third-highest portion of EI claims from apprentices with 7% of all claims. In terms of amount paid in benefits, claimants employed in the Construction (59%), Manufacturing (9%) and Other Services (7%) industries received 75% of total benefits paid to apprentices in 2014/2015.
An examination of the distribution of new claims by occupation of apprentices confirms the trend observed for the industrial distribution of EI claims from apprentices. Indeed, 90% of these new claims in 2014/2015 came from apprentices in the Trades and Skilled Transport and Equipment Operators occupation group, whose occupation subgroups are chiefly related to the Construction industry. Footnote 18 Claimants from this occupational group received, in 2014/2015, 90% of total benefits paid to apprentices compared to 10% for claimants working in other occupations.
| Industry and Occupation | New Claims Established for Apprentices1 | Amount Paid | ||||
|---|---|---|---|---|---|---|
|
2013/2014 |
2014/2015 |
(Share) 2014/2015 |
($ Million) 2013/2014 |
($ Million) 2014/2015 |
(Share) 2014/2015 |
|
| Industry | ||||||
| Construction | 30,850 | 30,480 | 56% | 173.3 | 171.7 | 59% |
| Manufacturing | 4,950 | 4,670 | 9% | 26.9 | 26.2 | 9% |
| Other Services (excluding Public Administration) | 3,800 | 4,010 | 7% | 16.2 | 19.4 | 7% |
| Other Industries | 13,130 | 14,850 | 27% | 66.7 | 73.0 | 25% |
| Occupation | ||||||
| Trades and Skilled Transport and Equipment Operators | 47,580 | 48,710 | 90% | 255.6 | 262.0 | 90% |
| Other Occupations | 5,150 | 5,300 | 10% | 27.5 | 28.3 | 10% |
| Canada | 52,730 | 54,010 | 100% | 283.1 | 290.3 | 100% |
- Note: Totals may not add up due to rounding.
- 1 Includes claims from apprentices referred under section 25 of the Employment Insurance Act for which at least $1 of Employment Insurance benefits was paid.
- Source: ESDC, Employment Insurance (EI) administrative data. Data are based on a 10% sample of EI administrative data.
1.4.2 Level and actual duration of Employment Insurance benefits for apprentices
In 2014/2015, the average weekly benefit rate payable to apprentices increased by 3.8 % from $453 in 2013/2014 to $470. Consistent with previous years the average weekly benefit rate for apprentices was higher than that for the EI program overall ($470 compared to $434).
In 2014/2015, claimants from Alberta received the highest average weekly benefit rate (with $494) while those from Prince Edward Island had the lowest level of benefit (with $415). Furthermore, on average, the level of benefit received by men ($472) was 5.8% higher than what women ($446) received in 2014/2015. In addition, among all different age groups, claimants aged 25 years and older had, on average, the highest average weekly benefit rate ($480) while claimants under 25 years had the lowest ($458).
In 2014/2015, on average, the actual duration of all types of EI benefits that apprentices received was 11.4 weeks compared to 11.8 weeks in 2013/2014. Of these 11.4 weeks, 8.1 weeks of benefits were paid for training purposes during periods of full-time technical training and the remainder were for regular or special benefits outside of these periods.
The average actual duration of benefits received by apprentices for periods of full-time technical training was the highest in the territories (9.3 weeks), followed by Manitoba (8.4 weeks) and Ontario (8.4 weeks). In contrast, the lowest average actual durations were recorded in Prince Edward Island (6.5 weeks) and Nova Scotia (6.7 weeks).
There were no difference by gender; the duration of benefits was 8.0 weeks for men and 8.1 weeks for women, on average, in 2014/2015. By age group, little variation was observed as well: older apprentices (45 years and older) had a duration of 7.9 weeks, while apprentices aged 25 to 44 and those aged under 25 received 8.0 and 8.1 weeks of benefits respectively.
Finally, apprentices who only received EI benefits while attending full-time in-class technical training received an average of 7.8 weeks of benefits in 2014/2015. On the other hand, apprentices who, during their benefit period, received benefits while attending technical training and regular (or special) benefits outside of their block of full-time in-class training received an average of 17.2 weeks of benefits.
1.5 Premium refund provision Footnote 19
The EI program has specific provisions for contributors who are unlikely to qualify for benefits. Employees with insurable earnings of $2,000 or less are eligible for a full refund of their EI premiums when they file an income tax return. Footnote 20
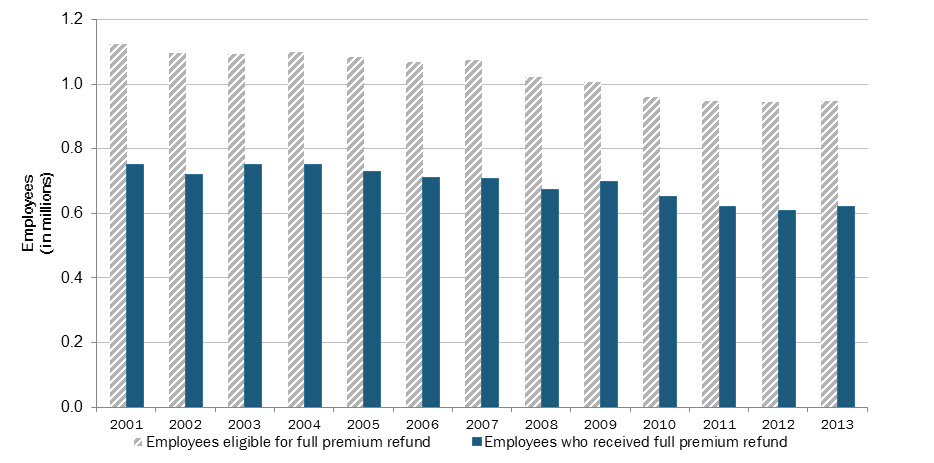
According to Canada Revenue Agency (CRA) data on T4 slips from employers, 947,000 individuals were eligible for the full EI premium refund as they had insurable earnings in 2013 of $2,000 or less. These cases represented 5.5% of those with insurable earnings.
From this group, 621,000 individual tax filers with insurable earnings of $2,000 or less in 2013 paid EI premiums and received a full EI premium refund, according to the CRA T1 individual tax filer data. Footnote 21 In total, $10.7 million in full EI premiums were refunded in 2013, a 35.9% decline since 2001 ($16.7 million). The average refund in 2013, among those who received the full refund, was $17.29. This represents an increase from 2009 when it was $16.15, but remains below the 2001 average refund of $22.33. Overall, the premium refund has declined by 22.6% (-$5.04) since 2001, which has been driven primarily by a decrease in the EI premium rate from 2.25% in 2001 to 1.88% in 2013. Footnote 22
Chart 5 provides a historical breakdown of individuals who were eligible for and received the full EI premium refund. In 2013, 947,000 individuals were eligible for the full EI premium refund, a decrease of 15.6% (-176,000) since 2001. Similarly, 621,000 individuals actually received the full premium refund in 2013, representing a decline of 17.3% (-130,000) over the same period. These declines can mainly be attributed to the fact that the income threshold for full refund has been fixed at $2,000 since it was introduced in 1997, while the average hourly wage has increased by 39.8% over the same time period (from $17.22 in 2001 to $24.07 in 2013). Footnote 23 Over time, the combination of a fixed income threshold for premium refund and a steady increase in hourly wages has led to gradual declines in the number of people who are eligible for and receiving the full EI premium refund.
Show Data Table
| Employees eligible for full premium refund (in millions) |
Employees who received full premium refund (in millions) |
|
|---|---|---|
| 2001 | 1.1 | 0.8 |
| 2002 | 1.1 | 0.7 |
| 2003 | 1.1 | 0.8 |
| 2004 | 1.1 | 0.8 |
| 2005 | 1.1 | 0.7 |
| 2006 | 1.1 | 0.7 |
| 2007 | 1.1 | 0.7 |
| 2008 | 1.0 | 0.7 |
| 2009 | 1.0 | 0.7 |
| 2010 | 1.0 | 0.7 |
| 2011 | 0.9 | 0.6 |
| 2012 | 0.9 | 0.6 |
| 2013 | 0.9 | 0.6 |
- Source: Canada Revenue Agency (CRA), T4 tax slip data with insurable employment income (for data on employees eligible for a full premium refund); and CRA, T1 tax return data (for data on employees who received a full premium refund). CRA data are based on a 10% sample of T4 slips with insurable employment income. and T1 tax returns with employment income.
In 2013, 66% of all individuals eligible for the full EI premium refund filed an income tax return and received a refund of their premiums. This implies that a substantial proportion (34%) of those eligible for the full EI premium refund did not file an income tax return. From 2001 to 2013, between 64% and 70% of all individuals eligible for the full EI premium refund filed an income tax return and received a refund.
1.6 Impact of Employment Insurance benefits on income redistribution Footnote 24
The EI program is considered by many to be a mechanism for income redistribution in Canada, as EI benefits are transferred towards individuals in the lower part of the income distribution. A 2012 evaluation study Footnote 25 showed that the benefit and contribution sides of the program are redistributive and that the impact of the program on the redistribution of earnings increased substantially during the 2008 recession.
In this report, to measure the extent of income redistribution of total EI benefits, the amount of EI benefits paid to each province and territory, selected demographic group (by sex and age group) or industry are divided by the total amount of EI premiums collected. This provides a set of total benefits-to-contributions (B/C) ratios. These ratios are then normalized, with the ratio for Canada set at 1.0. Footnote 26 The resulting ratios–the adjusted total benefits-to-contributions ratios–for each sub-population indicate whether the province or territory, demographic group or industry receives more in EI benefits than it contributes to the program, relative to Canada as a whole. For this section, the amount of EI premiums collected is based on the latest available Canada Revenue Agency tax data, which are for 2013. EI benefit data used for this analysis of B/C ratios are therefore for 2013 as well.
The B/C ratio calculation is based on employee and employer contributions paid at source, which means that premium reductions due to the Quebec Parental Insurance Plan (QPIP) Footnote 27 and the Premium Reduction Program (PRP) Footnote 28 , both administered at source, have been taken into account.
A province or territory, demographic group or industry with an adjusted ratio higher than 1.0 means that the underlying sub-population is a net beneficiary of the EI program, while those with an adjusted ratio lower than 1.0 are net contributors to the program relative to Canada as a whole. Annex 2.23 provides a detailed account of EI premiums collected and benefits paid across different provinces and territories, demographic groups (sex and age group) and industries. The following sections summarize the key findings.
1.6.1 Adjusted total benefits-to-contributions ratios, by province and territory Footnote 29
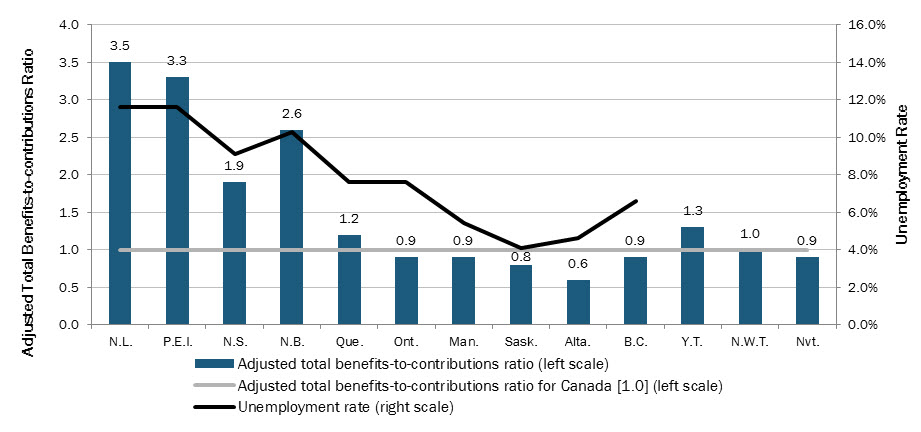
The Atlantic provinces, Quebec and Yukon continued to be net beneficiaries of total EI benefits in 2013, as they were in previous years, with adjusted ratios greater than 1.0, while Ontario, the Western provinces and Nunavut remained net contributors, with adjusted ratios below 1.0. Northwest Territories was the only jurisdiction with an adjusted ratio equal to 1.0.
Generally, provinces with higher adjusted total benefits-to-contributions ratios also have higher unemployment rates. In 2013, the four Atlantic provinces were the four largest net beneficiaries of total EI benefits, and they also had the highest unemployment rates of all provinces (see Chart 6).
Show Data Table
| Adjusted total benefits-to-contributions ratio | Unemployment rate | |
|---|---|---|
| N.L. | 3.5 | 11.6% |
| P.E.I. | 3.3 | 11.6% |
| N.S. | 1.9 | 9.1% |
| N.B. | 2.6 | 10.3% |
| Que. | 1.2 | 7.6% |
| Ont. | 0.9 | 7.6% |
| Man. | 0.9 | 5.4% |
| Sask. | 0.8 | 4.1% |
| Alta. | 0.6 | 4.6% |
| B.C. | 0.9 | 6.6% |
| Y.T. | 1.3 | |
| N.W.T. | 1.0 | |
| Nvt. | 0.9 | |
| Canada | 1.0 |
- Note: The unemployment rates for Yukon, Northwest Territories and Nunavut are not available.
- Source: Canada Revenue Agency [CRA], T4 slips with employment income (for data on contributions); ESDC, Employment Insurance (EI) administrative data (for data on benefits); and Statistics Canada, Labour Force Survey, CANSIM Table 282-0087 (for data on unemployment rates). CRA data are based on a 10% sample of T4 slips with employment income, and ESDC data are based on a 10% sample of EI administrative data.
1.6.2 Adjusted total benefits-to-contributions ratios, by gender, age group and income
In 2013, women were net beneficiaries from the EI program, with an adjusted total benefits-to-contributions ratio of 1.1, while men were net contributors with an adjusted ratio of 0.9. The reason for this difference can be primarily attributed to the fact that women have historically received higher proportions of special benefits (maternity, parental, sickness and compassionate care benefits) than men, even though they have historically had a lower unemployment rate (0.9 percentage point lower for women in 2013). For example, in 2014/2015, women received $4.1 billion in special benefits compared with $0.8 billion for men, representing close to a 5:1 ratio, which is consistent with previous years.
Among different age groups, claimants aged 15 to 24 (youth) and claimants aged 25 to 44 had adjusted total benefits-to-contributions ratios of 1.1 and 1.2 respectively, as they made up the majority of maternity and parental benefit recipients. Claimants aged 45 to 54 years and claimants aged 55 and older were net contributors, with adjusted ratios of 0.8 and 0.9 respectively.
A study on the financial impact of receiving EI benefits Footnote 30 concluded that the EI program has a considerable positive income redistribution effect, with lower income families having a higher adjusted total benefits-to-contributions ratio than higher income families. In fact, families with after-tax incomes below the median received 34% of total EI benefits and paid 18% of all premiums, representing an adjusted total benefits-to-contributions ratio of close to 2.0.
1.6.3 Adjusted total benefits-to-contributions ratios, by industry
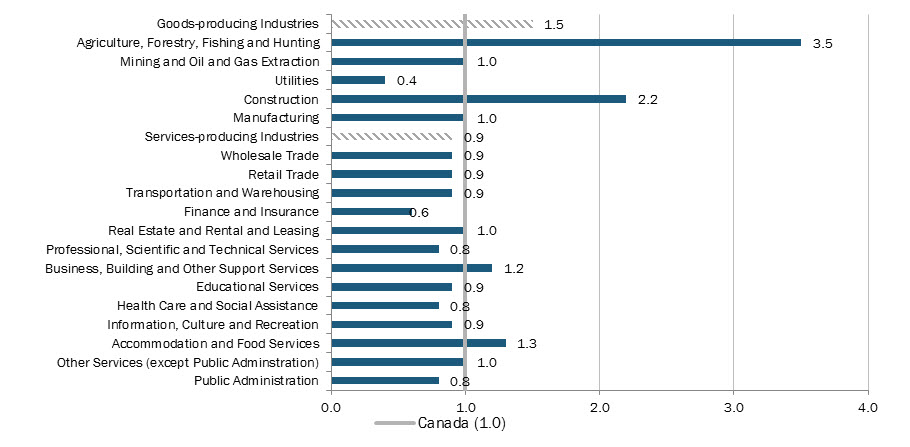
In 2013, the goods-producing industries were collectively a net beneficiary of EI benefits, with an adjusted benefits-to-contributions ratio of 1.5, while the services-producing industries were, as a whole, net contributors, with an adjusted ratio of 0.9 (see Chart 7). These results are also in line with the higher unemployment rate in the goods-producing industries (6.3% in 2013) than in the services-producing industries (4.0%). Within the goods sector, the Agriculture, Forestry, Fishing and Hunting industry and the Construction industry had the highest adjusted total benefits-to-contributions ratios (3.5 and 2.2, respectively).
Show Data Table
| Adjusted total benefits-to-contributions ratio | |
|---|---|
| Goods-producing Industries | 1.5 |
| Agriculture, Forestry, Fishing and Hunting | 3.5 |
| Mining and Oil and Gas Extraction | 1.0 |
| Utilities | 0.4 |
| Construction | 2.2 |
| Manufacturing | 1.0 |
| Services-producing Industries | 0.9 |
| Wholesale Trade | 0.9 |
| Retail Trade | 0.9 |
| Transportation and Warehousing | 0.9 |
| Finance and Insurance | 0.6 |
| Real Estate and Rental and Leasing | 1.0 |
| Professional, Scientific and Technical Services | 0.8 |
| Business, Building and Other Support Services | 1.2 |
| Educational Services | 0.9 |
| Health Care and Social Assistance | 0.8 |
| Information, Culture and Recreation | 0.9 |
| Accommodation and Food Services | 1.3 |
| Other Services (except Public Adminstration) | 1.0 |
| Public Administration | 0.8 |
| Canada | 1.0 |
- Source: Canada Revenue Agency [CRA], T4 slips with employment income (for data on contributions); and ESDC, Employment Insurance (EI) administrative data (for data on benefits). CRA data are based on a 10% sample of T4 slips with employment income, and ESDC data are based on a 10% sample of EI administrative data.