
Employment Insurance Monitoring and Assessment Report 2014/2015 Chapter II - 4. Supporting working Canadians and their families: Employment Insurance special benefits
4. Supporting working Canadians and their families: Employment Insurance special benefits
In addition to assisting Canadians during unemployment, the Employment Insurance (EI) program provides temporary financial assistance to employees and insured self-employed persons who are sick, pregnant, caring for a newborn, newly adopted or critically ill child, or caring for a family member who has a serious medical condition with a significant risk of death. These benefits play an important role in supporting working Canadians to balance work and family responsibilities.
To be eligible for EI special benefits, individuals who are employees must have accumulated a minimum of 600 hours of insurable employment in their qualifying period (usually the 52-week period prior to making a claim). Footnote 134 Self-employed persons are also eligible if they opted into the EI program at least one full year prior to claiming special benefits, paid EI premiums and met the minimum self-employment earnings threshold in the calendar year preceding the claim. This threshold was $6,515 (2013 earnings) for claims established in 2014 and was $6,645 (2014 earnings) for claims established in 2015. Self-employed fishers can also qualify for special benefits if they have fishing earnings of at least $3,760.
In the following sections, each type of EI special benefits is discussed one by one. Section 4.1 analyzes the EI special benefits as a whole. Section 4.2 examines the maternity and parental benefits. Sickness benefits are discussed in Section 4.3. Section 4.4 analyses the compassionate care benefits, while benefits for parents of critically ill children are examined in Section 4.5. Finally, Section 4.6 looks at the usage of special benefits by self-employed persons.
Sections 4.1, 4.2 and 4.6 do not include data or analysis on maternity and parental benefits for employees or self-employed persons residing in Quebec, as these benefits are available for residents of this province under the Quebec Parental Insurance Plan (QPIP). However, information on sickness, compassionate care and parents of critically ill children benefits paid to workers residing in Quebec is included in their respective sections.
4.1 Employment Insurance Special Benefits
The amount paid in EI special benefits is driven by three key indicators: the number of claims, the average weekly benefit rate (i.e. the level of benefits) and the duration of benefits. In general, an increase in one of these indicators will have a positive impact on the amount paid. The number of claims and amount paid are discussed in the next section (Section 4.1.1), while the level of benefits will be analysed in Section 4.1.2. The duration of benefits is discussed later, in the sections on the various types of special benefits (sections 4.2, 4.3, 4.4, and 4.5). In this part (Section 4.1 and its subsections), special claims refer to claim for which at least $1 of special benefits was paid.
4.1.1 Employment Insurance Special Claims and Amount Paid
Economic cycles and labour market conditions tend to have a smaller effect on the number of special claims and the amount paid in benefits than on the number of regular claims. However, the figures for special claims are in general more affected by demographic changes and changes in the characteristics of the labour force.
In 2014/2015, 526,000 special claims were established, which represented a 1.8% increase from 2013/2014. This annual increase-the fourth in a row-follows a 1.3% increase in 2013/2014. For the sixth consecutive year, the percentage annual growth of special claims outpaced that of regular claims, due mainly to improvements in economic conditions that have been observed since the 2008 recession and which led to a decline in the number of regular claims.
Moreover, in 2014/2015, an average of 231,300 claimants were receiving special benefits each month, up 1.0% from 229,000 claimants in 2013/2014, according to Statistics Canada. Footnote 135 This number is the number of EI claimants who received at least one dollar in special benefits during the reference period within the given month (usually the week of the 15th day of the month). The number is affected by the inflow of new EI claimants and the outflow of EI claimants no longer receiving special benefits, mainly because they have exhausted the number of weeks of benefits to which they were entitled or because they have returned to work.
Usually, EI claims and the number of claimants tend to move together, except when there is a change in the duration of benefits or a large, sudden increase or decrease in the number of claims. When there is a sudden rise, the number of claims increases faster than the number of claimants because there is a lag between the time that the new claims are received and the time that the benefit period is established and benefits are payable. Conversely, if the number of claims decreases, the number of claimants will remain high for a time, because of earlier claims for which benefits continue to be paid, until the benefits are exhausted or the claimants return to work.
Among the different types of special benefits, the number of claims for parents of critically ill children (PCIC) recorded the largest increase (+74.1%), which is explained by the fact that PCIC benefits were available during the entire 12 months of a year for the very first time since its introduction. Footnote 136 A rise was also recorded in the number of EI sickness claims, with a 2.5% increase, while parental claims decreased by 3.7% during the same period compared with 2013/2014. There was little variation in the other benefits (see Table 45).
The 526,000 special claims established in 2014/2015 led to payments of $4,95 billion in benefits, a 4.1% increase compared with 2013/2014. This is the fourth consecutive annual increase. Furthermore, for the fifth year in a row, the amount paid in special benefits rose more rapidly than regular benefits.
| Type of Benefits | New Claims Established1,2 | Amount Paid ($ Million) |
||
|---|---|---|---|---|
| 2013/2014 | 2014/2015 | 2013/2014 | 2014/2015 | |
| Maternity | 169,640 | 169,080 | 1,029.5 | 1,064.3 |
| Parental (Biological) | 189,480 | 189,740 | 2,401.0 | 2,501,6 |
| Parental (Adoptive) | 1,640 | 1,580 | 20.6 | 18.4 |
| Sickness | 336,800 | 345,070 | 1,276.8 | 1,331,7 |
| Compassionate Care | 6,150 | 6,120 | 13.1 | 12.6 |
| Parents of Critically Ill Children | 1,470 | 2,560 | 7.9 | 16.8 |
| Canada | 515,820 | 526,100 | 4,748.9 | 4,945.6 |
- Note: Totals may not add up due to rounding.
- 1 Includes claims for which at least $1 of special benefits was paid.
- 2 The numbers in this table do not add up to the total presented because Employment Insurance (EI) claimants can receive multiple types of EI benefits in one claim.
- Source: ESDC, Employment Insurance (EI) administrative data. Data are based on a 10% sample of EI administrative data.
Benefits for parents of critically ill children recorded the highest increase in the amount paid (+112.7%), while parental benefits (adoptive) displayed the most significant decrease, namely -10.7%. Sickness benefits, up 4.3%, also recorded a significant increase.
In the provinces and territories, the number of new special claims was little changed, except in British Columbia (+3,770 claims or 5.3%) and Alberta (+3,560 claims or 6.5%) whose increases explain nearly all the national 1.8% growth (see Table 46). In percentage, Yukon (+13,6%) and Prince Edward Island (+7.1%) experienced the largest increases.
The amount paid increased in almost all the provinces, but declined in the three territories. The most significant increase was recorded in Prince Edward Island (+20.3%), followed by Alberta (+6.9%), British Columbia (+6.5%) and Nova Scotia (+6.5%).
| Provinces and Territories | New Claims Established1 | Amount Paid ($ Million) |
||
|---|---|---|---|---|
| 2013/2014 | 2014/2015 | 2013/2014 | 2014/2015 | |
| Newfoundland and Labrador | 11,660 | 11,970 | 93.5 | 98.0 |
| Prince Edward Island | 5,930 | 6,350 | 33.0 | 39.7 |
| Nova Scotia | 21,150 | 21,660 | 154.2 | 164.3 |
| New Brunswick | 24,220 | 24,920 | 157.3 | 156.8 |
| Quebec | 105,400 | 107,700 | 367.5 | 375.2 |
| Ontario | 185,180 | 184,240 | 2,105.9 | 2,176.8 |
| Manitoba | 19,610 | 18,990 | 206.0 | 212.6 |
| Saskatchewan | 15,270 | 14,790 | 187.3 | 188.0 |
| Alberta | 54,880 | 58,440 | 712.7 | 761.7 |
| British Columbia | 75,580 | 75,350 | 705.4 | 750.9 |
| Yukon | 590 | 670 | 8.1 | 7.7 |
| Northwest Territories | 690 | 600 | 10.7 | 8.5 |
| Nunavut | 380 | 350 | 6.0 | 5.0 |
| Missing Data | 280 | 70 | 1.2 | 0.4 |
| Canada | 515,820 | 526,100 | 4,748.9 | 4,945.5 |
- Note: Totals may not add up due to rounding.
- 1 Includes claims for which at least $1 of special benefits was paid.
- 2 The numbers in this table do not add up to the total presented because Employment Insurance (EI) claimants can receive multiple types of EI benefits in one claim.
- Source: ESDC, Employment Insurance (EI) administrative data. Data are based on a 10% sample of EI administrative data.
Women had a substantial proportion (66%) of special claims established in 2013/2014 and received 83% of total amount paid. These figures are similar to those observed in previous years. Three main factors explain why women receive such a large proportion of special benefits. First, only women are eligible for maternity benefits, which comprised 22% of total amount paid in special benefits in 2014/2015. Second, women accounted for 86% of the biological parental claims established in 2014/2015. Finally, women tend to receive benefits for a longer duration when compared with men. For example, in 2014/2015, the average duration of biological parental benefits was 32.1 weeks for women and 16.7 weeks for men.
4.1.2 Level of Employment Insurance Special Benefits
En 2014/2015, the average weekly benefit rate rose 2.7%, from $403 to $414. This increase is in line with that of the maximum insurable earnings (MIE). MIE increased by 1.9% in 2014, from $47,400 to $48,600, and by 2,5% in 2015, from $48,600 to $49,500. The growth in the average weekly benefit rate was positive across all special benefit types (see Table 47).
| Type of Special Benefits | Average Weekly Benefit Rate | ||
|---|---|---|---|
| ($) | ($) | (Annual Percentage Change) | |
| 2013/2014 | 2014/2015 | 2014/2015 | |
| Maternity | 416 | 427 | 2,6% |
| Parental (Biological) | 425 | 436 | 2,6% |
| Parental (Adoptive) | 464 | 473 | 1,9% |
| Sickness | 388 | 398 | 2,6% |
| Compassionate Care | 414 | 428 | 3,4% |
| Parents of Critically Ill Children | 416 | 427 | 2,6% |
| Canada | 403 | 414 | 2.7% |
- Note: Totals may not add up due to rounding
- Source: ESDC, Employment Insurance (EI) administrative data. Data are based on a 10% sample of EI administrative data.
A way to assess the level of benefit support is to look at the proportion of claimants receiving the maximum weekly benefit rate. In 2014/2015, 41% of special benefit claimants received the maximum weekly benefit rate compared with 42% in 2013/2014. Footnote 137 This proportion is higher than levels observed between 2007/2008 and 2012/2013, when they hovered between 37% and 38%. This spike in the proportion of special claims receiving the maximum weekly benefit rate could be attributed to a higher proportion of special claims made by men, who accounted for 33.8% of all EI special benefit claims in 2014/2015, compared with 31,7% in 2007/2008. Indeed, the average weekly benefit rate for men was higher than that for women. The increase could also be the result of an increase in earnings from women making special claims.
4.2. Employment Insurance Maternity and Parental Benefits
Since 1971, the Employment Insurance (EI) program offers replacement income to contributors who must take a leave from work following a pregnancy, a birth or the adoption of a child.
Maternity benefits are offered to biological mothers during their pregnancy, and for a specific time period surrounding the birth of the child. The principle underlying these benefits under the current EI program is to provide biological mothers with a certain level of protection against earnings loss caused by their physical inability to work or to seek work in the weeks surrounding the birth of the child. Maternity benefits are different from parental benefits, which are offered to parents caring for a child.
To receive maternity benefits under the EI program, claimants must demonstrate that they meet the required eligibility conditions for this type of benefit, namely that they must have had an interruption of earnings and accumulated 600 insurable hours or more during the qualifying period. Footnote 138 A qualified EI claimant may receive up to 15 weeks of maternity benefits per benefit period (with a two-week waiting period). They may be paid as early as eight weeks before the expected date of birth and may end as late as 17 weeks after the actual date of birth.
As for EI parental benefits, they have been offered since 1990 to parents who take a leave from work to care for a newborn or a newly adopted child. They may be paid to either one of the biological or foster parents or shared between the two parents for a combined total maximum of 35 weeks of benefits (with a two-week waiting period).
To receive parental benefits under the EI program, claimants must demonstrate that they meet the required eligibility conditions related to these benefits, which are identical to maternity benefits. Furthermore, they must provide proof of the child's date of birth, or in the case of an adoption placement, the date of the child's placement in their home; they must also provide the name of the adoption agency or the agency authorized to act in this capacity.
Furthermore, it should be noted that the maternity and parental benefits offered under the EI program only apply to parents who reside outside of Quebec. In this province, it is the Quebec Parental Insurance Plan (QPIP) that provides benefits to workers and self-employed individuals who are eligible to take a maternity, paternity, parental or adoption leave. Footnote 139
The amount paid in EI maternity and parental benefits is driven by three key factors: the number of claims, the duration of benefits, and the average weekly benefit rate (level of benefits). In general, an increase in one of these three factors will have a positive impact on the total amount paid. In the section 4.2.1 the number of claims and amount paid will be discussed, while the duration and level of benefits will be discussed in sections 4.2.3 and 4.2.4.
For the purpose of these sections, EI maternity claims refer to claims for which at least $1 of maternity benefits was paid. And EI parental claims refer to claims for which at least $1 of parental benefits was paid.
4.2.1 Employment Insurance Maternity and Parental Claims and Amount Paid
4.2.1.1 Employment Insurance Maternity Claims and Amount Paid
Unlike the decrease in the total number of claims, total EI maternity benefits increased by 3.4% ($34.8 million), from $1,029.5 million in 2013/2014 to $1,064.3 million in 2014/2015. This increase in benefits is attributable to a 2.6% increase in average weekly benefit rate and in average duration of benefits in some provinces which have recorded a rise in the number of claims, as shown in Annex 2.12.
In 2014/2015, according to Statistics Canada, there was an average of 48,526 beneficiaries receiving EI maternity benefits each month, an increase of 1.3% from the average of 47,923 maternity beneficiaries in 2013/2014. Footnote 140 The beneficiary count represents the number of EI claimants who received at least $1 of EI maternity benefits during the reference period for the month (usually the week of the 15th day) and is affected by the inflow of new EI maternity claimants and the outflow of EI maternity claimants who have stopped receiving benefits, principally because they have exhausted their benefits entitlement or have returned to work.
Generally speaking, claims and beneficiaries tend to move together, except when there are changes in the average duration of benefits or a sudden, significant increase or decrease in new claims. When there is a rapid but temporary increase, claim volumes will increase ahead of beneficiaries, due to the lag between when a new claim is received and when a benefit period is established and benefits are made payable. The beneficiary count will remain elevated after the volume of new claims have subsided as previous claims remain in pay, until benefits are exhausted or the claimants have returned to work.
4.2.1.2 Employment Insurance Maternity Claims and Amount Paid, by Province, Territory, Age, and Industry
In 2014/2015, the total number of new claims and amount paid varied by claimants' provinces and territories of residence, age, and the industry they worked in prior to their maternity leave.
The number of new maternity claims established by claimants increased in five provinces, while it decreased in the others. The largest increase in the number of claims took place in Nova Scotia (+12.2%), whereas the most pronounced decline was observed in Manitoba (-9.2%), as shown in Annex 2.12. Furthermore, as in 2013/2014, 82% of new claims were established by claimants from Ontario, Alberta, and British Columbia.
As seen in Annex 2.12, the total number of maternity claims declined slightly for all age groups. Among claimants, those aged 25 years and older established 89% of new EI maternity claims, while those under 25 years accounted for 11% of total new claims, as in the previous two years.
Furthermore, similar to what was observed in the previous year, in 2014/2015, around 68% of new EI maternity claims were established by claimants working in the following industrial sectors: Healthcare and Social Assistance (16.4%), Public Administration (11.2%), Educational Services (11.0%), Retail Trade (10.0%), Accommodation and Food Services (7.2%), Professional, Scientific and Technical Services (6.1%), and Finance and Insurance (6.4%).
Amount Paid to Mothers with a Child up to 12 Months Old
In 2014/2015, the total amount of maternity benefits paid to mothers during their pregnancy and the period surrounding the birth of their child rose in eight provinces and decreased in all territories and two provinces (see Annex 2.12). These increases and decreases are attributable primarily to changes to the average weekly benefit rate and to the number of claims, as shown in Annex 2.12.
As per the previous years, the amounts paid to claimants from all provinces and territories were proportional to the number of claims they established, as shown in Table 48. For example, the Atlantic Provinces, which accounted for 7.9% of the total number of claims, received 7.8% of the total amount paid in 2014/2015.
| Provinces and Territories | Claims | Share (%) | Amount Paid | Share (%) |
|---|---|---|---|---|
| Newfoundland and Labrador | 2,730 | 1.6 | 17.6 | 1.7 |
| Prince Edward Island | 1,060 | 0.6 | 6.9 | 0.6 |
| Nova Scotia | 5,430 | 3.2 | 32.1 | 3.0 |
| New Brunswick | 4,230 | 2.5 | 25.6 | 2.4 |
| Quebec | 0.0 | 0.0 | 0.0 | 0.0 |
| Ontario | 82,350 | 48.7 | 522.4 | 49.1 |
| Manitoba | 8,090 | 4.8 | 49.5 | 4.7 |
| Saskatchewan | 7,780 | 4.6 | 48.2 | 4.5 |
| Alberta | 31,070 | 18.4 | 198.1 | 18.6 |
| British Columbia | 25,690 | 15.2 | 159.7 | 15.0 |
| Yukon | 250 | 0.1 | 1.5 | 0.1 |
| Northwest Territories | 260 | 0.2 | 2.0 | 0.2 |
| Nunavut | 140 | 0.1 | 0.8 | 0.1 |
| Total (Canada) | 169,080 | 100.0% | 1,064.3 | 100.0% |
- Note: Totals may not add up due to rounding
- Source: ESDC, Employment Insurance (EI) administrative data. Data are based on a 10% sample of EI administrative data.
In terms of benefits, of the total maternity benefits of 1,064.3 million paid in 2014/2015, claimants from Ontario, Alberta and British Columbia, who established 82% of all maternity claims, received 82% of benefits. Additionally, among claimants, those aged 25 years and older received 92% of the total benefits compared to 8% for those aged under 25 years. Furthermore, 70% of the total benefits were paid to claimants working in the following industries: Health and Social Assistance; Public Administration; Educational Services; Retail Trade; Accommodation and Food Services; Professional, Scientific and Technical Services; and Finance and Insurance.
Furthermore, out of the 169,080 maternity claims for which payments were made in 2014/2015, 161,660 included parental claims (161,660) and 23 970 contained sickness claims. As a result, the EI program paid to claimants $52.4 million for illness; $399.7 million for parental benefits to allow mothers to care for their child; and $6.4 million for regular benefits (see Table 49).
| Type of Benefits | 2013/2014 | 2014/2015 |
|---|---|---|
| Maternity Benefits, of which: | $1,029.5 | $1,064.3 |
| Sickness Benefits | $48.1 | $52.4 |
| Parental Benefits | $377.7 | $399.8 |
| Regular Benefits | $6.9 | $6.5 |
- Note: Totals may not add up due to rounding
- Source: ESDC, Employment Insurance (EI) administrative data. Data are based on a 10% sample of EI administrative data.
4.2.1.3 Employment Insurance Parental (Biological) Claims and Amount Paid
In 2014/2015, the total number of parental (biological) claims as well as the total of amount paid increased compared to the previous year, although not in the same way.
The number of claims slightly increased by 0.1%, from 189,480 in 2013/2014 to 189,740 in 2014/2015 (see Annex 2.13). This slight increase is primarily attributable to a decline in the number of claims made in Ontario (-1,650) and Manitoba (-600). Furthermore, these 189,740 claims resulted in the payment of $2,501.6 million in benefits, a 4.2% increase compared with the previous year. This increase is primarily driven by the rise in average weekly benefits rate, which has increased by 2.6% to reach $436 in 2014/2015, as shown in Annex 2.13.
4.2.1.4 Employment Insurance Parental (Biological) Claims and Amount Paid, by Province and Territory, Gender, Age, and Industry
In 2014/2015, the number of parental claims established by biological parents increased in four provinces and territories, and decreased in others. The most significant increases in the number of claims were recorded in Nova Scotia and Alberta .In contrast, the sharpest decreases in the number of parental claims were observed in Manitoba and Newfoundland and Labrador. Furthermore, similar to 2013/2014, 82% of parental (biological) claims were established by claimants from Ontario, Alberta, and British Columbia.
In 2014/2015, according to Statistics Canada, there was an average of 115,458 beneficiaries receiving EI parental (biological) benefits each month, an increase of 1.0% from the average of 114,507 beneficiaries in 2013/2014. Footnote 141 The beneficiary count represents the number of EI claimants who received at least $1 of EI parental (biological) benefits during the reference period for the month (usually the week of the 15th day) and is affected by the inflow of new EI parental (biological) claimants and the outflow of EI parental (biological) claimants who have stopped receiving benefits, principally because they have exhausted their benefits entitlement or have returned to work.
In terms of benefits, in 2014/2015, the total of benefits paid to claimants of almost provinces increased, except for claimants from New Brunswick and Saskatchewan who witnessed a decrease in their benefits, as shown in Annex 2.13. The most significant increases in amount paid for biological parental claims were recorded in Prince Edward Island and Newfoundland and Labrador. Additionally, among claimants, those from Ontario, Alberta and British Columbia received 83% of the total amount paid in 2014/2015.
Of the 189,740 biological parental claims, it must be noted that 86% were established by women, while 14% come from men. And as the Annex 2.13 shows, in 2014/2015, women received 92% of the total amount of benefits and men received 8%.
In addition, the distribution of claimants by age groups shows that those aged 25 to 44 years and those under 25 years accounted for 91% and 8%, respectively, of the total number of claims and they received 93% and 7%, respectively, of the total amount paid in benefits, as shown in Annex 2.13.
Furthermore, among claimants who established claims in 2014/2015, those working in Public Administration established the highest number of EI parental claims (14.5%). They were followed by claimants employed in Healthcare and Social Assistance (14.1%), Educational Services (10.0%), Retail Trade (9.0%), Accommodation and Food Services (6%), Professional Scientific and Technical Services (6%), Manufacturing (6.0%), and Finance and Insurance (6%). Together, claimants from these industries accounted for 71% of the total number of claims established in 2014/2015 compared to 73% in the previous years, and they received 74% of benefits over the past two years. In the other hand, claimants who established fewer claims worked in the following industrial sectors: Utilities; Management of Companies and Enterprises; Arts, Entertainment and Recreation; Mining; Oil and Gas; and Agriculture, Forestry, Fishing and Hunting. Together, claimants from these industries who accounted for 4% of the total number of claims, established in 2014/2015, received 4% of the total amount paid in benefits.
4.2.1.5 Employment Insurance Parental (Adoptive) Claims and Amount Paid
The number of parental (adoptive) claims established decreased in 2014/2015 by 3.7% to 1,580 claims. The number of parental (adoptive) claims made by self-employed individuals was negligible. Adoptive parents received a total of $18.4 million in benefits, a 10.7% decrease compared to the previous year.
The entitlement to this benefit is often shared. For the purpose of this report, unless otherwise indicated, the average duration figure provided will be the number of weeks used per family basis. The average duration of EI parental (adoptive) claims Footnote 142 was 25 weeks per family in 2014/2015, a decrease of 6.4% (-1.7 week) compared with the duration in 2013/2014 (26.7 weeks). In 2014/2015, the average duration of biological parental claims was 30 weeks per claim, 5 weeks higher than parental (adoptive) claims, versus 3.7 weeks the previous year.
4.2.2 Accessibility to Employment Insurance Maternity and Parental Benefits
According to the 2014 Employment Insurance Coverage Survey (EICS), the number of mothers with a child up to 12 months old increased by 2.7% in 2014, to 411,358 individuals, compared to 400,456 in 2013. A total of 74.7% of these mothers had insured income before giving birth to, or adopting their child, compared with 77.0% in 2013. Among these insured mothers, 89.0% received maternity or parental benefits, a decrease of 2.9 percentage points from 2013 (91.9 %). Overall, 66.5% of mother with a child up to 12 months received maternity and/or parental benefits in 2014, which represents two-thirds of all new mothers. Footnote 143
The proportion of fathers who took or intended to take parental leave decreased, from 30.8% in 2013 to 27.1% in 2014.
In Quebec, the Quebec Parental Insurance Plan (QPIP) has had a major impact on the number of fathers who claimed or intended to claim parental benefits. QPIP includes leave that is available exclusively to biological fathers (paternal leave). Since its introduction on January 1, 2006, the proportion of fathers in Quebec who took or intended to take parental leave has increased, from 27.8% % to 78.3% in 2014. However, this proportion decreased by 4.7 percentage points compared to 2013 (83.0%). The statistics reported above originate from the 2014 Employment Insurance Coverage Survey and include parents in Quebec receiving benefits from the provincial program.
4.2.3 Level of Employment Insurance Maternity and Parental Benefits
In 2014/2015, the average weekly maternity benefit rate continued to increase to reach $427 (+2.6%) compared to $416 in 2013/2014.
With regard to biological parental benefits, the average weekly benefit rate increased by 2.6%, from $425 in 2013/2014 to $436 in 2014/2015. And 53% of claimants received the maximum weekly benefit rate in 2014/205 compared to 53.1% in 2013/2014.
The average weekly benefit rate paid to adoptive parents who established claims, in 2014/2015, increased by 1.9%, from $464 in 2013/2014 to $473 in 2014/2015. And 71% of adoptive parental claimants received the maximum weekly benefit rate in 2014/2015 compared to 67% in 2013/2014, an increase of 4 percentage points.
4.2.4 Duration of Employment Insurance Maternity and Parental Benefits
For assessment purposes, various time periods in EI administrative data are used to ensure accuracy when analyzing the duration of EI special benefits. In this report, to assess the average claim duration of EI parental benefits, only claims established in the first half of 2014/15 were used, to ensure data were based on as many completed EI parental claims as possible. Given the shorter duration of maternity benefits, all claims established in 2014/15 were used.
As in previous years, in 20142015, claimants used almost all of the EI maternity and parental weeks to which they were entitled. Although the vast majority of mothers (90.5 %) used the full 15 weeks available, the average duration of maternity benefits remained at 14.6 weeks.
However, the average duration of parental claims can be adjusted to reflect the fact that parents can share the 35 weeks of parental benefits available to them. In 2014/2015, the average duration of biological parental claims, as calculated on a family basis, was 32.5 weeks for parents who decided to share the parental benefits and 32.1 weeks for those who decided not to share. Claimants who received both maternity and parental benefits used 47.1 weeks of the 50 weeks of maternity and parental benefits available to them on average in 2014/2015, of which 32.5 weeks were parental benefits and 14.6 weeks were maternity benefits. Similar to last year, low-income claimants receiving maternity and parental benefits as well as the Family Supplement collected an average of 46.6 weeks of maternity and parental benefits, namely 32 weeks of parental benefits and 14.6 weeks of maternity benefits.
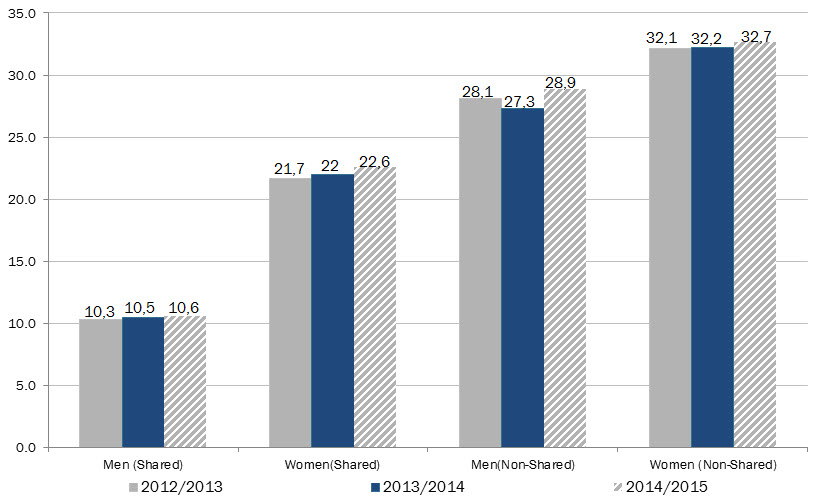
Furthermore, the decision to share parental (biological) benefits has a limited effect on the average duration of benefits. As shown in Chart 45, in 2014/15, when parental benefits were shared, on average, women collected 22.6 weeks, while men collected 10.6. When parental benefits are not shared, women collect 32.7 weeks on average, while men collect 28.8 weeks on average. Similar results were observed in the past few years.
Show Data Table
| 2012/2013 | 2013/2014 | 2014/2015 | |
|---|---|---|---|
| Men (Shared) | 10.3 | 10.5 | 10.6 |
| Women (Shared) | 21.7 | 22.0 | 22.6 |
| Men (Non-Shared) | 28.1 | 27.3 | 28.9 |
| Women (Non-Shared) | 32.1 | 32.2 | 32.7 |
- Source: EI administrative data.
4.3. Employment Insurance Sickness Benefits
Employment Insurance (EI) provides up to 15 weeks of temporary financial assistance to qualified claimants who are unable to work because of illness, injury or quarantine. The exact maximum duration that a sickness claimant is entitled to depends on the recommendation from their physician. In conjunction with corresponding job protection through the Canada Labour Code and provincial / territorial labour statutes, EI sickness benefits allow claimants time to restore their health and maintain their attachment to the labour market. Employers who offer sickness wage loss plans to their employees that are at least equivalent to the EI sickness benefit can register their plans with the Employment Insurance Commission to obtain a reduction in their EI premiums through the Premium Reduction Program (PRP).
The amount paid in EI sickness benefits is driven by three key indicators: the number of claims, the duration of benefits, and the average weekly benefit rate (level of benefits). In general, an increase in one of these three indicators will have a positive impact on the total amount paid. In the section 4.3.1 the number of claims and amount paid will be discussed, while the duration and level of regular benefits will be discussed in sections 4.3.2 and 4.3.3. For the purpose of these sections, EI sickness claims refer to claims for which at least $1 of sickness benefits was paid.
4.3.1 Employment Insurance Sickness Claims and Amount Paid
In 2014/2015, the number of EI sickness claims established increased by 2.5% to 345,070, from 336,800 claims in 2013/2014. Similarly, the amount paid in EI sickness benefits increased by 4.3%, from $1,277 million in 2013/2014 to $1,331.7 million in 2014/2015. This increase is attributable to an increase in the number of claims (2.5%), the duration of benefits (2.0%), and average weekly benefit rates (2.6%).
In 2014/2015, according to Statistics Canada, there was an average of 67,330 beneficiaries receiving EI sickness benefits each month, an increase of 1.2% from the average of 66,514 sickness beneficiaries in 2013/2014. Footnote 144 The beneficiary count represents the number of EI claimants who received at least $1 of EI sickness benefits during the reference period for the month (usually the week of the 15th day) and is affected by the inflow of new EI sickness claimants and the outflow of EI sickness claimants who have stopped receiving benefits, principally because they have exhausted their benefits entitlement or have returned to work.
Generally speaking, claims and beneficiaries tend to move together, except when there are changes in the average duration of benefits or a sudden, significant increase or decrease in new claims. When there is a rapid but temporary increase, claim volumes will increase ahead of beneficiaries, due to the lag between when a new claim is received and when a benefit period is established and benefits are made payable. The beneficiary count will remain elevated after the volume of new claims have subsided as previous claims remain in pay, until benefits are exhausted or the claimants have returned to work.
4.3.1.1 Employment Insurance Sickness Benefits Claims and Amounts Paid, by Province / Territory, Gender and Age
The total number of EI sickness claims increased in 2014/15 across all regions in Canada, with the exception of Saskatchewan, which witnessed a decrease of 2.3%. Provinces that witnessed the largest increase in the number of sickness claims established were Prince Edward Island (9.3%) and British Columbia (7.3%). There were also large percentage increases reported in the number of EI sickness claims established (and amount paid in EI sickness benefits) in the territories.
Similarly, amount paid in sickness benefits increased in all provinces, with the exception of Nova Scotia, which registered a decrease of 1.7% in 2014/2015. Provinces that witnessed the largest increases in amount paid included British Columbia (10.9%), Manitoba (9.5%) and Prince Edward Island (8.3%).
In 2014/2015, EI sickness claims made my men increased by 3.7% while those made by women increased by 1.5%. In addition, their respective share of claims remained similar to the proportion in the previous year – approximately 57 % and 43%, each. The amount paid in sickness benefits to men and women followed a similar upward trend – increasing by 3.3% for men to $621.1 million and by 5.2% for women, to reach $710.6 million.
Sickness claimants aged 25-44 years accounted for 41% of all EI sickness claims established in 2014/2015 and 40% of total benefits paid. This is not surprising given that this group represents the largest category of workers in the labour force (43%). Conversely, claimants aged 55 years and older, who represented 20% of the labour force, accounted for 26 % of all claims and received 27% of total benefits paid, indicating that this age group is overrepresented in the number of sickness claims. Among the age groups that experienced an increase in their number of sickness claims established, the largest increase occurred in claims established by those aged 55 years and older (7%), followed by those aged 25 to 44 years (2%). In contrast to the variation in their number of claims, all age groups recorded an increase in total sickness benefits paid in 2014/2015, with claimants aged 55 years and older recording the largest increase in benefits paid (8%). The number of sickness claims made by older workers (those aged 55 and older) as well as the amount paid to older workers, is expected to continue to increase, as the Canadian population ages.
4.3.1.2 Employment Insurance Sickness Benefits Claims and Amounts Paid, by Claimant category, and Industry
As was the case in 2013/2014, sickness claims were more likely to be made by occasional claimants and long-tenured workers than frequent claimants. Indeed, of the 345,070 EI sickness claims established in 2014/2015, 57% were paid to occasional claimants, 31% to long-tenured workers, and 12% to frequent claimants, compared to 53%, 35% and 12% in the previous year. Footnote 145 In fact, as shown in Table 1 below, the share of new sickness claims established and total amount paid to occasional and claimants grew significantly at 9.8% and 14.7%, respectively.
| EI Claimant Category2 | New Claims1 Established | Amount Paid | ||||
|---|---|---|---|---|---|---|
| 2013/2014 | 2014/2015 | 2013/2014 | 2014/2015 | |||
| Share | ($ Million) | ($ Million) | Share | |||
| Long-Tenured Workers | 117,200 | 105,780 | 31% | $514.2 | $479.5 | 36% |
| Occasional Claimants | 179,110 | 196,750 | 57% | $622.8 | $715.6 | 54% |
| Frequent Claimants | 40,490 | 42,540 | 12% | $139.8 | $136.6 | 10% |
| Canada | 336,800 | 345,070 | 100% | $1,276.8 | $1,331.7 | 100% |
- Note: Totals may not add up due to rounding
- 1 Includes claims for which at least $1 of special benefits was paid.
- Source: ESDC, Employment Insurance (EI) administrative data. Data are based on a 10% sample of EI administrative data.
Among EI sickness claims established in 2014/2015, the largest share of claims were paid to individuals working in the following industries, as shown in the Table 51: Retail Trade (12%), Health Care and Social Assistance (12%) and Manufacturing (11%) and Construction (10%). Table 2 shows a similar industrial decomposition of amount paid in sickness benefits.
| Industry | New Claims1 Established | Amount Paid | ||||
|---|---|---|---|---|---|---|
| 2013/2014 | 2014/2015 | 2013/2014 | 2014/2014 | |||
| Share | ($ Million) | ($ Million) | Share | |||
| Goods-Producing Industries | 88,970 | 88,630 | 25,7% | $362.8 | $362.0 | 27.2 |
| Agriculture, Forestry, Fishing and Hunting | 13,370 | 13,060 | 3.8% | 43.4 | $44.0 | 3.3% |
| Mining and Oil and Gas Extraction | 3,010 | 3,050 | 0.9% | 15.7 | $13.0 | 1.0% |
| Utilities | 520 | 490 | 0.1% | 2.0 | $2.7 | 0.2% |
| Construction | 32,600 | 33,820 | 9.8% | 148.9 | $146.2 | 11% |
| Manufacturing | 39,470 | 38,210 | 11.1% | 152.9 | $156.1 | 11.7% |
| Services-Producing Industries | 247,830 | 256,440 | 74.3% | $914.0 | $969.7 | 72.8% |
| Wholesale Trade | 13,390 | 13,040 | 3.8% | 52.8 | $52.5 | 4.0% |
| Retail Trade | 41,630 | 41,730 | 12.1% | 130.1 | $136.8 | 10.3% |
| Transportation and Warehousing | 18,130 | 17,470 | 5.1% | 81.1 | $77.9 | 6.0% |
| Finance and Insurance | 4,370 | 4,600 | 1.3% | 18.0 | $20.9 | 1.6% |
| Real Estate and Rental and Leasing | 5,260 | 5,820 | 1.7% | 20.0 | $22.0 | 1.7% |
| Professional, Scientific and Technical Services | 9,000 | 9,520 | 2.8% | 36.1 | $37.7 | 2.8% |
| Business, Building and Other Support Services2 | 26,570 | 26,820 | 7.8% | 96.7 | $105.1 | 7.9% |
| Educational Services | 9,760 | 9,320 | 2.7% | 33.1 | $34.1 | 2.6% |
| Health Care and Social Assistance | 39,820 | 40,870 | 11.8% | 160.8 | $164.2 | 12.3% |
| Information, Cultural and Recreation3 | 7,600 | 7,030 | 2.0% | $27.3 | $25.7 | 1.9% |
| Accommodation and Food Services | 26,330 | 25,140 | 7.3% | 77.4 | $80.9 | 6.1% |
| Other Services (Excluding Public Administration) | 14,550 | 14,070 | 4.1% | 54.4 | $52.1 | 3.9% |
| Public Administration | 21,070 | 22,040 | 6.4% | 95.9 | $101.5 | 7.6% |
| Unclassified | 10,350 | 18,970 | 5.5% | 30.4 | $58.2 | 4.4% |
| Canada | 336,800 | 345,070 | 100.0% | 1,276.8 | $1,331.7 | 100% |
- Note: Totals may not add up due to rounding
- 1 Includes claims for which at least $1 of special benefits was paid.
- 2 This industry comprises the industries with codes 55 (management of companies and enterprises) and 56 (administrative and support, waste management and mediation services) from the North American Classification System.
- 3 This industry comprises the industries with codes 51 (information and cultural industries) and 71 (arts, entertainment and recreation) from the North American Classification System.
- Source: ESDC, Employment Insurance (EI) administrative data. Data are based on a 10% sample of EI administrative data.
4.3.2 Level of Employment Insurance Sickness Benefits
As with regular benefits, the level of EI sickness benefits paid to sickness is tied to the maximum insurable earnings. Under the Employment Insurance Act, the rate of EI weekly benefits that may be paid to individuals who became unable to work because of sickness, injury or quarantine is 55% of their average insurable weekly earnings, up to a maximum rate of EI weekly benefits. As of January 1, 2014, the maximum yearly insurable earnings amount was $48,600 and the maximum amount a claimant could receive was $514 per week. For qualified low-income claimants with dependent children, the rate of weekly benefits may be increased by the amount of the family supplement as high as 80% of their average insurable weekly earnings.
In 2014/2015, the average weekly sickness benefits rose by 2.6% to reach $398. The proportion of claims that were paid the maximum benefit rate (based on the MIE) in 2014/2015 was 33%, which was comparable 2013/2014 (at 34%).
Sickness claims made by men received, on average, $438 per week while women received an average of $368 per week in 2014/2015. Regardless of gender, claimants aged 25 to 44 years and 45 to 54 years received the highest amount average weekly sickness benefits ($406 and $407, respectively in 2014/2015).
Among the claimant categories, long-tenured workers received the highest average weekly sickness benefits in 2014/2015 ($439) followed by frequent claimants ($426 in 2014/2015) during the same period. Although occasional claimants accounted for 57% of all claims established in 2014/2015, they received the lowest average weekly sickness benefits during that period at $370.
In 2014/2015, claimants who worked in the Mining, Oil and Gas Extraction industry had the highest average weekly sickness benefits ($504 per claim) followed by individuals working in the Construction industry who received ($480 per claim). In contrast, claimants who worked in the Accommodations and Food Services industry had the lowest average weekly sickness benefits ($304 per claim) followed by individuals from the Retail Trade industry ($323 per claim).
4.3.3 Entitlement, Duration and Exhaustion of Employment Insurance Sickness Benefits
4.3.3.1 Entitlement to and Duration of Employment Insurance Sickness Benefits
The number of weeks for which EI sickness benefits may be paid to qualified claimants because of illness, injury or quarantine is capped at 15 weeks pursuant to the Employment Insurance Act. In 2014/2015, the average actual duration of sickness benefits was 10 weeks, representing 66.7% of the maximum duration of 15 weeks, compared to 9.7 weeks or 65 % of the maximum duration in the past two years. However, it should be noted that the average duration of EI sickness benefits also varied across provinces and territories, gender, age, industries, and claimant categories.
In 2014/2015, the average actual duration of EI sickness benefits was higher in the Western provinces (10.7 weeks in British Columbia and Alberta) than in the other provinces (8.7 weeks in New Brunswick). The average duration was also slightly higher for women (10.1 weeks), compared to men (9.9 weeks), as well as for older age categories – 10.7 weeks for those 55 years and older, compared to 9.0 weeks for those under 25 years old. This is consistent with the trends found in the previous year.
EI sickness claimants who worked in Administrative and Support, Waste Management, and Retail Trade had the longest average actual duration of sickness benefits (10.4 weeks, respectively) while, in contrast, claimants working in the Agriculture, Forestry, Fishing and Hunting industry had the lowest average actual duration of benefits (8.1 weeks) in 2014/2015. In comparison, in 2013/2014, EI sickness claimants who worked in Finance and Insurance had the highest average actual duration of EI sickness benefits (10.6 weeks) while those who worked in Agriculture, Forestry, Fishing and Hunting had, on average, the lowest duration of benefits (7.9 weeks).
4.3.3.2 Exhaustion of Employment Insurance Sickness Benefits
As Table 52 shows, of all EI sickness claims completed in 2014/2015, 34.8% of claimants exhausted the maximum 15 weeks of benefit entitlement. This figure represents an increase of 1.4 percentage point compared to claims completed in the previous year, and this is the third consecutive year of increase. It is important to note that while there is a maximum entitlement of 15 weeks, not all sickness claimants are entitled to the entire 15 weeks, as the duration depends on the recommendation from a physician.
| Provinces and Territories | 2013/2014 | 2014/2015 |
|---|---|---|
| Newfoundland and Labrador | 35.0% | 32.8% |
| Prince Edward Island | 22.5% | 20.4% |
| Nova Scotia | 30.7% | 33.0% |
| New Brunswick | 21.6% | 23.7% |
| Quebec | 27.3% | 29.5% |
| Ontario | 39.1% | 39.6% |
| Manitoba | 36.5% | 40.5% |
| Saskatchewan | 38.6% | 39.2% |
| Alberta | 40.0% | 41.3% |
| British Columbia | 38.1% | 39.4% |
| Yukon | 29.6% | 16.7% |
| Northwest Territories | 32.4% | 46.2% |
| Nunavut | 25.0% | 33.3% |
| Gender | ||
| Male | 31.3% | 32.4% |
| Female | 35.0% | 35.9% |
| Age | ||
| Under 25 years | 23.0% | 27.4% |
| 25-44 years | 30.1% | 31.4% |
| 45-54 years | 36.3% | 36.5% |
| 55 years and plus | 39.8% | 41.3% |
| Claimant Categories | ||
| Long-Tenured Workers | 37.1% | 38.6% |
| Occasional Claimants | 34.8% | 36.2% |
| Frequent Claimants | 17.1% | 18.5% |
| Canada | 33.4% | 34.8% |
- Note: Totals may not add up due to rounding
- Source: ESDC, Employment Insurance (EI) administrative data. Data are based on a 10% sample of EI administrative data.
As shown in Table 52, claimants across the various dimensions (province, age, gender, claimant categories) experienced an increase in their entitlement exhaustion of EI sickness benefits, with exception of those from Newfoundland and Labrador, and Prince Edward Island whose entitlement exhaustion rates decreased Footnote 146 .
4.3.4 Premium Reduction Program
The EI program supports the delivery of sickness benefits through employers via the Premium Reduction Program (PRP). For participating employers and employees, the PRP provides a premium reduction in exchange for companies offering their employees sickness benefits that are at least equivalent to those available through EI, and the employer plan is the first payer.
In 1971, when the federal government extended unemployment insurance benefits to insured workers temporarily absent from work because of illness, injury or quarantine, it amended at the same time Unemployment Insurance Act to introduce the PRP to encourage employers to continue to offer their wage-loss replacement plans and assume the risk of the first-payer position when their employees were temporarily out of work because of illness or injury. As a result, when an employer provides their employees with wage-loss replacement plans in case of illness or injury that would have the effect of reducing EI sickness payable to those insured employees, they may be eligible for EI premium reductions, provided that these plans were registered with the Canada Employment Insurance Commission and met certain requirements stipulated in the Employment Insurance Act and Employment Insurance Regulations.
To be eligible for EI premium reductions, a wage-loss replacement plan offered by an employer to his or her employees must be registered with the Commission and meet or exceed certain requirements specified in the EI Regulations, including the following:
- Provide at least 15 weeks of disability benefits for short-term disability;
- Match or exceed the level of benefits provided under the EI sickness program;
- Pay benefits to employees within 14 days of illness or injury;
- Be accessible to employees within three months of hiring;
- Cover employees on a 24-hour-a-day basis; and
- Pass at least five-twelfths (5/12) of the premium reduction on to the employees covered by the plans.
Under the PRP there are two types and four categories of wage-loss replacement plans for which EI premium reductions may be granted. The two types of plans that could be considered as qualifying plans under EI Regulations are Weekly Indemnity Plans and Cumulative Paid Sick Leave Plans. Footnote 147
Based on the findings of the most recent departmental supplemental study on the PRP, Footnote 148 in 2013, there were 26,650 employers receiving EI premium reductions through the PRP, down from 31,040 participating employers in 2000. This represents a decrease of 2.2% in participation rate for 2013. Larger firms were found to be more likely to participate in the PRP. Indeed, 59.3% of firms with more than 500 employees participated in 2013 in the PRP; 31.7% of firms with 200-499 employees; 17.1% of firms with 100-199 employees. The participation rate for firms with fewer than 50 employees was under 10.0%. However, the changes observed in employer participation did not result in a decline in the percentage of workers covered: both the number of workers and the proportion of workers covered increased over the period. As of 2013, 7.1 million (34.8%) of workers had employment in firms receiving a premium reduction. The average number of employees covered by firms generally also increased from 182 employees in 2000 to 268 employees in 2013. Furthermore, in 2013, firms in Saskatchewan and Manitoba had the highest participation rates, at 4.8% and 3.8%, respectively, while firms in the Atlantic region were less likely to participate in PRP.
Premium reductions were observed for one-third of businesses in Public Administration and about one-fifth (22.1%) of businesses in the Utilities sector. Other industry sectors have participation rates of under 5%, except Educational Services (7%), Manufacturing (6.7%), Finance and Insurance (5.6%) and Information and Cultural Services (5.1%). Interestingly, many of those industries with the highest sickness claims volumes (as indicated section 4.3.1.2) are overrepresented in the participation rate of PRP; specifically, Retail Trade, Wholesale Trade and Manufacturing have the highest number of sickness claims established but remain overrepresented in the number of firms participating in PRP. These three industries represent 9.8%, 7.9% and 12.4% of participating firms in Canada, but only 8.0%, 4.0% and 4.0% of all firms in Canada, respectively.
4.4. Employment Insurance Compassionate Care Benefits
For individuals facing the difficult situations where a family member is dying or at risk of death, the emotional and financial demands related to caring for individuals can affect both a person’s employment and their financial security. The Employment Insurance (EI) program offers up to 6 weeks of compassionate care benefits (CCB) to employees needing to take time away from work to provide care or support to family members who are gravely ill and who face significant risk of dying within 26 weeks.
Self-employed individuals who have opted to contribute to EI are also eligible to receive CCB after 12 months from confirmation of their registration for EI. Self-employed workers in Quebec are eligible to claim CCB through the Employment Insurance program, rather than through the Quebec Parental Insurance Plan, which is used by self-employed workers in Quebec for maternity, paternity, and parental benefits.
For the purposes of this section (except for subsection 4.4.2), EI compassionate care claims refer to claims for which at least $1 of compassionate care benefits were paid.
4.4.1. Employment Insurance Compassionate Care Claims and Amount Paid
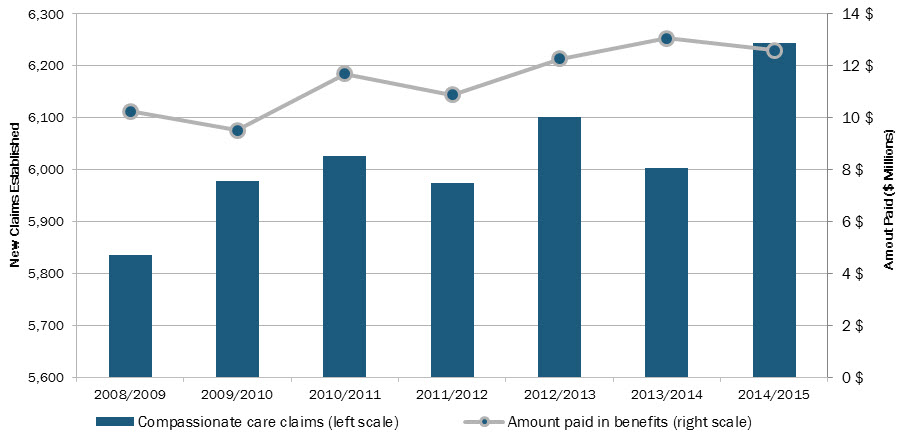
In 2014/2015, there were 6,244 new claims established for CCB, a 4.0% increase compared to the number of claims established in 2013/2014 (6,003). The amount paid in benefits totalled $12.6 million in 2014/2015, a 3.8% decrease from the $13.1 million in total compassionate care benefits paid in 2013/2014 (see Chart 46).
Show Data Table
| Compassionate care claims | Amount paid in compassionate care benefits ($ Millions) | |
|---|---|---|
| 2008/2009 | 5,837 | 10.3 |
| 2009/2010 | 5,978 | 9.5 |
| 2010/2011 | 6,027 | 11.7 |
| 2011/2012 | 5,975 | 10.9 |
| 2012/2013 | 6,102 | 12.3 |
| 2013/2014 | 6,003 | 13.1 |
| 2014/2015 | 6,244 | 12.6 |
- Source: EI administrative data.
In 2014/2015, 44% of all CCB claims established in Canada were from Ontario, 17% were from Quebec, and 15% were from British Columbia. As shown in Table 53, there has been little variation in the percentage shares of CCB claims established in each province since 2011/2012, even though there have been some fluctuations for amounts paid, especially in Ontario, Alberta and Quebec.
| Province and Territory | New Claims Established1 | Amounts Paid | ||||||
|---|---|---|---|---|---|---|---|---|
| 2011/2012 | 2012/2013 | 2013/2014 | 2014/2015 | 2011/2012 | 2012/2013 | 2013/2014 | 2014/2015 | |
| Newfoundland and Labrador | 1% | 1% | 1% | 1% | 1% | 1% | 1% | 1% |
| Prince Edward Island | 1% | 1% | 1% | 1% | 1% | 1% | 1% | 0% |
| Nova Scotia | 3% | 3% | 3% | 3% | 4% | 2% | 3% | 4% |
| New Brunswick | 2% | 2% | 2% | 2% | 2% | 2% | 2% | 2% |
| Quebec | 17% | 17% | 15% | 17% | 16% | 15% | 12% | 14% |
| Ontario | 46% | 44% | 45% | 44% | 46% | 48% | 44% | 43% |
| Manitoba | 4% | 4% | 4% | 4% | 5% | 2% | 4% | 5% |
| Saskatchewan | 3% | 2% | 3% | 3% | 3% | 3% | 4% | 2% |
| Alberta | 8% | 9% | 9% | 11% | 8% | 10% | 13% | 12% |
| British Columbia | 15% | 16% | 16% | 15% | 17% | 14% | 17% | 16% |
| Territories | 0% | 0% | 0% | 0% | 0% | 0% | 0% | 1% |
| Canada | 100% | 100% | 100% | 100% | 100% | 100% | 100% | 100% |
- Note: Totals may not add up due to rounding.
- 1 Includes all claims for which at least $1 in compassionate care benefits was paid.
- Source: ESDC, Employment Insurance (EI) administrative data. Data are based on a 100% sample of EI administrative data, except for amount paid, which is based on a 10% sample.
The provinces which reported the largest year-over-year increases in the number of claims established in 2014/2015 were Alberta (+22%), Newfoundland and Labrador (+19%), and New Brunswick (+17%), while the provinces that reported the largest percentage declines in the number of claims made between 2013/2014 and 2014/2015 were Saskatchewan (-21%) and Manitoba (-7%).
In 2014/2015, four out of ten provinces witnessed an increase in the amount of CCB paid, while five provinces experienced declines. The provinces of New Brunswick (+50%) and Nova Scotia (+25%) witnessed the highest rate of increase in total benefits paid. In contrast, the provinces of Prince Edward Island, Saskatchewan and British Columbia witnessed the most significant percentage decreases in the amount of CCB paid.
The wide variability of percentage increases and decreases in the amount of total claims and benefits paid between years is primarily due to the low total counts of claims established and amounts paid in most provinces and territories, meaning that comparatively small shifts in the total number of claims made or amounts paid between years can impact annual percentage changes significantly.
Women made 71% of compassionate care claims in 2014/2015, while men made 29% of them. When compared with the labour force as a whole, in 2014/2015, women represented 47.6% of the labour force while men represented 52.4%. From 2013/2014 to 2014/2015, the number of CCB claims established increased at a faster rate for men (+11%) while the number of CCB claims for women remained stable (+1%). Between 2012/2013 and 2014/2015 men have reported higher rates of increases in the number of claims established than women, opting to take advantage of CCB available to them more frequently on average, while the number of women who have opted to claim CCB has remained comparatively stable over the same period.
The age group responsible for the largest share of compassionate care claims in 2014/2015 were those between the ages of 25 to 54 years (68% of all claims), followed by those 55 years of age and older (30% of all claims) and those 25 years or younger (2% of all claims). When compared to Canada’s labour force as a whole, youth (15 to 24 years) represented 15%, core-aged workers (25-54) represented 65.6% and older workers (over 55) represented 19.4% of the labour force. Based on these results, compassionate care claimants in 2014/2015 were over representative of older workers in the labour force and underrepresented the share of youth in the labour force as a whole.
Compared to the previous fiscal year, the number of claims increased most for youth (+18% between 2013/2014 and 2014/2015), while claims made by people aged 25 to 54 years of age increased the least (+2%). The large percentage increase in claims by those under 25 years of age is partly attributable to this age group making a small total number of all claims for CCB in both years (equivalent to 2% of all CCB claims initiated in 2014/2015), meaning that small changes in totals reported year over year are reflected as large percentage changes in annual totals.
4.4.2. Accessibility to Employment Insurance Compassionate Care Benefits
When applying for CCB, claimants are required to indicate their relationship to the spouse or other family member they are caring for, and provide a medical certificate proving that the family member is seriously ill and at significant risk of death within 26 weeks. Since June 2006, regulatory amendments have broadened the definition of a ‘family member’ to include siblings, grandparents, grandchildren, in-laws (e.g. aunts, uncles, cousins, nieces and nephews), foster parents, wards and any other individuals considered family members by the gravely-ill person being cared for, or those considered family members by his or her representative, to be eligible to claim compassionate care benefits.
| Type of Relationship | Share of Compassionate Care Applicants |
|---|---|
| Mother of Father | 55.9% |
| Spouse or Partner | 26.0% |
| Child | 6.8% |
| Sister or Brother | 4.4% |
| Other | 6.9% |
| Canada | 100.0% |
- Note: Totals may not add up due to rounding.
- 1 Table includes all applications under which a claim for compassionate care benefits was made, not only those in which at least $1 in compassionate care benefits were paid.
- Source: ESDC, Compassionate Care Bevefits: Update. (Ottawa: ESDC, Evaluation Directorate, 2015).
A supplementary study completed in 2015 on data for compassionate care claimants in 2012/2013 found that a large majority (81.9%) of CCB applicants Footnote 149 were those that needed to care for a parent (55.9%), or for a spouse or partner (26.0%) in 2012/2013. Footnote 150 Individuals that applied for CCB to care for a child (either their own child, the child of a spouse or the child of a common law partner) represented 6.8% of all applicants, while those who applied to care for a sibling represented 4.4%. These proportions were consistent with rates reported in previous years.
The same study also found that the acceptance rate (defined as the share of all CCB applications, by type of family relationship, where benefits were paid) of CCB claims was highest among applicants who sought benefits to care for a sister or brother (70.8%), followed by a spouse or partner (69.3%) and mother or father (68.1%). CCB applicants looking to receive benefits for a child reported the lowest acceptance rate (52.4%) of claims established. Finally, the study also found that 75.9% of those who received care from individuals claiming CCB were over the age of 55, and that claims where the care recipient was over 55 years old also reported the highest acceptance rates of CCB claims that were established.
4.4.3. Level of Employment Insurance Compassionate Care Benefits
In 2014/2015, the average weekly benefit rate for CCB increased to $428 (+3.4% compared to an average weekly benefit rate of $414 in 2013/2014). As mentioned in previous sections, increases in weekly benefit rates are explained in part by increases in average weekly nominal earnings and increases in maximum insurable earnings (MIE) for Employment Insurance from year to year.
4.4.4. Maximum Duration and Actual Duration of Employment Insurance Compassionate Care Benefits
The maximum duration of compassionate care benefits is 6 weeks per claim and benefits can be shared with other family members if they are also eligible for these benefits. On average, EI claimants used 4.7 weeks of compassionate care benefits, equal to 78% of the maximum entitlement of 6 weeks for CCB in 2014/2015. The proportion of CCB claimants who used all of their 6 week entitlement was 71% in 2014/2015, and this proportion was slightly lower than that observed in 2013/2014 (72%) and 2012/2013 (73%) for this measure.
Although eligible family members can share the 6 weeks of entitlement for CCB, there were only 123 claims (2% of all CCB claims established) where benefit sharing was done in 2014/2015. The rate of uptake and the amount of use of CCB sharing was similar to previous years.
A recent study on the use and duration of CCB found that the main reason a claimant does not receive or claim the entire 6 weeks of benefits is that the recipient of care passes away while the claimant is receiving CCB. The same study also found that claimants caring for a spouse are more likely to use the entire 6 week benefit period than those caring for other kinds of family members, and those living with a gravely ill recipient are more likely to use the entire 6-week period than those who do not live with the care recipient. Finally, claimants who combine CCB with another type of EI benefit are more likely to use the full 6 weeks available to them than those who only received CCB. Footnote 151
4.5 Parents of Critically Ill Children Benefits
EI special benefits for Parents of Critically Ill Children (PCIC) first became available to eligible insured workers, and to self-employed individuals who have opted into EI, on June 9, 2013. Under PCIC benefits, claimants are provided with up to 35 weeks of benefits (with a two week waiting period) that can be split into segments of a claimant’s 52 week qualification period, and benefits can also be shared among eligible parents.
Claimants for PCIC benefits must be able to demonstrate that their regular weekly earnings from work, or the amount of time used by a claimant to devote to their business for self-employed persons, have declined by more than 40% in order to provide care for a critically ill or injured child; must be the parent of a child who is critically ill or injured; and demonstrate that their child is under 18 years of age at the time the 52-week window during which benefits can be paid is opened (based on the date that a specialist medical doctor states that the child became critically ill or injured).
Eligible employees must have worked a minimum of 600 hours during their qualifying period to be eligible to claim PCIC benefits, while self-employed workers must demonstrate that they have confirmed their registration for EI special benefits twelve months prior to submitting a claim, and demonstrate that they meet the minimum earnings requirement for the year where they apply.
The amount paid in PCIC benefits is impacted by three key indicators: the number of claims, the duration of benefits, and the average weekly benefit rate (level of benefits). In general, an increase in one of these indicators will lead to increases in the total amount of benefits paid.
The following sections will discuss the amount paid, number of claims, the level and duration of PCIC benefits in the two years where the benefit has been available. For the purposes of this section, PCIC claims established refers to claims for which at least $1 of PCIC benefits was paid. The reported amounts paid in PCIC benefits also factor in payments provided under the Family Supplement for those who claimed PCIC benefits.
Generally speaking, changes in the number of claims and beneficiaries tend to move together, with the exception of changes to the average duration of benefits or a sudden, significant increase or decrease in new claims. The beneficiary count will remain elevated after the volume of new claims subsides and previous claims remain in pay, until benefits are exhausted or the claimant returns to work.
As PCIC claims continue to be processed using a manual pay system unlike other EI benefits, and given the benefit is relatively new compared to other special benefits, the level of data available to examine the benefits continues to be limited. Footnote 152 For example, data on claim duration taking into account the sharing of benefits by parents, and data on the industry of occupation for claimants, were not available at the time of publication for the 2014/2015 EI Monitoring and Assessment Report.
4.5.1. Parents of Critically Ill Children Claims Established and Benefits Paid
2014/2015 marked the first full fiscal year where PCIC benefits were available to Canadians year-round, and as a result a significant increase was reported in the number of new claims established. The number of new PCIC claims established across Canada increased by 74%, from 1,469 claims in 2013/2014 to 2,560 claims in 2014/2015.
Claimants residing in the province of Ontario established the largest number of PCIC claims in 2014/2015 with 893 (35% of all claims), followed by the province of Quebec with 637 claims (25% of all claims) and Alberta with 350 claims (14% of all claims). The shares of new PCIC claims across provinces in 2014/2015 did not change significantly from shares observed for 2013/2014.
The provinces which reported the largest year-over-year increases in the number of claims made in 2014/2015 were Newfoundland and Labrador (+211%), New Brunswick (+177%) and Alberta (+132%), while the province that reported the smallest percentage increase was Nova Scotia (+77%). The significant percentage increases observed between years are partly attributable to PCIC benefits being available to claimants year-round in 2014/2015, compared to 2013/2014 when PCIC benefits were only offered for ten months of the fiscal year. There were no provinces or territories which reported declines in the number of claims established between 2013/2014 and 2014/2015.
The amount of PCIC benefits paid in 2014/2015 more than doubled in 2014/2015, rising 113% to reach $16.8 million compared to $7.9 million in PCIC benefits paid in 2013/2014. All ten provinces witnessed an increase in the amount of PCIC paid, while the Northwest Territories and Nunavut (-21%), combined Footnote 153 , were the only jurisdictions to report declines in the amount of benefits paid. New Brunswick witnessed the largest increase in total benefits paid (+300%), followed by Quebec (+186%) and British Columbia (+164%). In contrast, the provinces of Prince Edward Island and Saskatchewan witnessed the smallest percentage increases in the amount of PCIC paid (+46% and +50%, respectively).
Women represented 78% of all PCIC claims established and 79% ($13.2 million) of all PCIC benefits paid in 2014/2015, while men represented 22% of all PCIC claims established and 21% ($3.6 million) of all PCIC benefits paid.
Claimants between the ages of 25 and 44 years represented the overwhelming majority of both total claims established (86%) and benefits paid (85%) in 2014/2015, consistent with results reported for 2013/2014 (84% of total claims established and 84% of total benefits paid). Those between the ages of 45 and 54 reported the second highest share of total claims established (6%) and benefits paid (10%) in 2014/2015, followed by claimants under the age of 24 (6% of total claims and 5% of benefits paid).
4.5.2. Level of Parents of Critically Ill Children Benefits
In 2014/2015, the average weekly benefit rate for PCIC increased to $427 (+2.6% compared to an average weekly benefit rate of $416 for PCIC claimants in 2013/2014). The provinces with the highest weekly benefit rates in 2014/2015 were Saskatchewan ($453), Alberta ($447) and Ontario ($427), while the provinces with the lowest average weekly benefit rates were Prince Edward Island ($368), Nova Scotia ($396) and New Brunswick ($406). Canada’s territories reported the highest average weekly benefit rates, however these rates are influenced by the small number of total claims and benefits paid in each territory in 2014/2015.
Women ($420) continued to report lower average weekly benefit rates for PCIC than men ($453) in 2014/2015, however the annual increases in average weekly benefit rates for women (+4.5%) continued to rise while the average weekly benefit rate for men declined (-1%) between 2013/2014 and 2014/2015.
Those between the ages of 25 and 44 ($433) reported the highest average weekly benefit rate among all age groups, while those 24 years and under ($337) reported the lowest average weekly benefit rate in 2014/2015. All age groups reported increases in their average weekly benefit rates for 2014/2015 compared to 2013/2014, with older workers (+9.5%) reporting the largest increases in average weekly benefit rates and younger workers (+1%) reporting the smallest increases.
As mentioned in previous sections, increases in weekly benefit rates are determined in part by increases in average weekly nominal earnings and increases in maximum insurable earnings (MIE) for EI from year to year.
4.5.3 Duration of Parents of Critically Ill Children Benefits
On average, PCIC claimants used 16.0 weeks of benefits in 2014/2015, an increase of 17% compared to the national average of 13.7 weeks reported in 2013/2014. The national average duration of PCIC claims in 2014/2015 was equivalent to 46% of the maximum entitlement available for PCIC at 35 weeks. A total of 414 claims (16% of all PCIC claims made) exhausted their full entitlement of 35 weeks for PCIC benefits in 2014/2015, while 855 claims (33% of all PCIC claims made) in 2014/2015 lasted 20 weeks or longer.
Given the limitations of available data on PCIC due to claims being processed manually, the average duration of claims does not account for spouses who opt to share PCIC benefits, since current tabulations count each spouse as a separate claimant. It is likely that the count of benefit exhautees reflects only claimants who are single parents, since couples or spouses claiming PCIC only report the duration of their individual claim of each partner in the available data, not the average duration of the shared benefit for both partners. The manual pay system used to process PCIC claims currently provides no clear way to link claims established as shared benefits, and thus the averages listed above likely understate the duration of PCIC claims.
The province which reported the highest average duration in 2014/2015 was Newfoundland and Labrador at 21.8 weeks, followed by Nova Scotia with 18.5 weeks and Saskatchewan at 16.9 weeks, while provinces reporting the lowest average duration were Prince Edward Island at 10.1 weeks, Manitoba at 15.0 weeks, and Quebec at 15.1 weeks.
The provinces which reported the most significant percentage increases in average duration of PCIC benefits between 2013/2014 and 2014/2015 were Saskatchewan (+48%), New Brunswick (+40%) and Nova Scotia (+27%), while the provinces that reported the largest declines were Prince Edward Island (-33%) and Manitoba (-27%).
Women, at 16.4 weeks, reported claiming slightly longer average durations for PCIC benefits than those reported for men at 14.6 weeks, however men (17.7%) reported a higher rate of increase between years in reported average duration than women (+14.7%).
Table 55 provides a general overview of reported results for PCIC benefits in 2014/2015.
| New Claims | % of All PCIC Claims Made | Average Weekly Benefit Rate ($ per Week) | Amount Paid ($ Millions)2 |
|
|---|---|---|---|---|
| Province/Territory | ||||
| Newfoundland and Labrador | 28 | 1% | $408 | $0.2 |
| Prince Edward Island | 8 | 0.3% | $368 | $0.0 |
| Nova Scotia | 62 | 2.4% | $396 | $0.5 |
| New Brunswick | 72 | 2.8% | $406 | $0.4 |
| Quebec | 637 | 24.9% | $419 | $4.0 |
| Ontario | 893 | 34.9% | $427 | $6.0 |
| Manitoba | 82 | 3.2% | $424 | $0.5 |
| Saskatchewan | 51 | 2.0% | $453 | $0.3 |
| Alberta | 350 | 13.7% | $447 | $2.4 |
| British Columbia | 305 | 11.9% | $425 | $2.1 |
| Yukon Territory1 | 5 | Not availablec | Not availablec | $0.0 |
| Northwest Territories | ||||
| Nunavut1 | ||||
| Missing Data | 67 | 2.6% | Data not available | $0.4 |
| Gender | ||||
| Men | 563 | 22.0% | $453 | $3.6 |
| Women | 1,997 | 78.0% | $420 | $13.2 |
| Age | ||||
| 24 Years and Under (Youth) | 162 | 6.3% | $337 | 0.8 |
| 25 to 44 Years | 2,193 | 85.7% | $433 | 14.3 |
| 45 to 54 Years | 194 | 7.6% | $425 | 1.7 |
| 55 Years and Over (Older Workers) | 11 | 0.4% | $391 | 0.1 |
| Canada1 | 2,560 | 100.0% | $427 | $16.8 |
- Note: Totals may not add up due to rounding
- 1 For confidentiality reasons, some data for the territories have been combined. As a result, the total number of claims may not add up to the total presented.
- 2 Includes all claims for which at least $1 in PCIC benefits were paid.
- c Not available for confidentialité reasons
- Source: ESDC, Employment Insurance (EI) administrative data. Data are based on a 100% sample of EI administrative data.
4.6 Employment Insurance Special Benefits for Self-employed Persons
Self-employed workers have been able to opt into the EI program on a voluntary basis since January 31, 2010, by entering into an agreement with the Canada Employment Insurance Commission (CEIC) to pay EI premiums in order to obtain access to EI special benefits. Special benefits available to self-employed persons are the same as those offered to the salaried employees. EI special benefits for self-employed persons became payable as of January 1, 2011.
To be eligible for EI special benefits for self-employed persons, an individual must:
- register with the CEIC;
- waits for 12 months from the date of his or her confirmed registration before claiming EI special benefits;
- have reduced the amount of time devoted to his or her business by more than 40%;
- have earned the minimum amount of self-employed earnings during the calendar year preceding the year he or she applies for benefits. This threshold was $6,515 (2013 earnings) for claims established in 2014 and was $6,645 (2014 earnings) for claims established in 2015.
- pay EI premium at the same rate as salaried employees for at least one year before he or she may claim benefits. Footnote 155
As shown in the Table 56, from April 1, 2014 to March 30, 2015, 1,448 new self-employed workers entered into a voluntary agreement with the CEIC to be eligible for EI special benefits and 498 opted out, bringing the total number of self-employed persons who are enrolled in the Employment Insurance program since January 2010 to 15,842 participants.
| Fiscal Year | Participants to the Program (Opted in) | Registrants Who Cancelled or Terminated Participation to the Program (Opted Out) | Net Enrolments | Net Enrolments – Cumulative Total at the End of Fiscal Year |
|---|---|---|---|---|
| (Number of Participants) | (Number of Participants) | (Number of Participants) | (Number of Participants) | |
| 2009/2010 (January 31 to March 31, 2010) |
2,145 | 191 | 1,954 | 1,954 |
| 2010/2011 | 6,806 | 1,646 | 5,160 | 7,114 |
| 2011/2012 | 4,887 | 1,526 | 3,361 | 10,475 |
| 2012/2013 | 3,315 | 926 | 2,389 | 12,864 |
| 2013/2014 | 2,063 | 533 | 1,530 | 14,394 |
| 2014/2015 | 1,946 | 498 | 1,448 | 15,842 |
- Note: Totals may not add up due to rounding
- Source: ESDC, administrative data from My Service Canada Account.
4.6.1 Employment Insurance Special Benefits for Self-employed Persons, Claims and Amount Paid
In 2014/2015, 749 special claims were established for self-employed workers. The amount paid in benefits was $7.7 million.
The benefit type most frequently used by self-employed persons were parental benefits, which made up 62% of the amount paid to self-employed.
Furthermore, special claims made by self-employed were principally established in Ontario (at 46%) and for women (at 96%) (see Table 57).
|
Type of Benefits, Province and Territory, and Gender |
New Claims Established1 | Amount Paid ($ Millions) |
||||||||
|---|---|---|---|---|---|---|---|---|---|---|
| 2010/ 2011 |
2011/ 2012 |
2012/ 2013 |
2013/ 2014 |
2014/ /2015 |
2010/ 2011 |
2011/ 2012 |
2012/ 2013 |
2013/ 2014 |
2014/ 2015 |
|
| Type of Benefits2 | ||||||||||
| Maternity | 190 | 455 | 497 | 558 | 565 | 0.5 | 1.8 | 1.9 | 2.1 | 2.8 |
| Parental | 214 | 505 | 548 | 593 | 602 | 0.2 | 4.3 | 3.5 | 5.8 | 4.8 |
| Sickness | 41 | 107 | 135 | 162 | 148 | 0.0 | 0.3 | 0.3 | 0.3 | 0.1 |
| Compassionate Care | 0 | 3 | 2 | 4 | 4 | 0.0 | 0.0 | 0.0 | 0.0 | 0.0 |
| Parents of Critically Ill Children | 0 | 0 | 0 | 1 | 2 | 0.0 | 0.0 | 0.0 | 0.0 | 0.0 |
| Province and Territory | ||||||||||
| Newfoundland and Labrador | 7 | 11 | 11 | 8 | 17 | 0.0 | 0.2 | 0.0 | 0.1 | 0.3 |
| Prince Edward Island | 4 | 2 | 3 | 3 | 6 | 0.0 | 0.0 | 0.0 | 0.0 | 0.0 |
| Nova Scotia | 5 | 14 | 14 | 20 | 24 | 0.0 | 0.1 | 0.0 | 0.0 | 0.0 |
| New Brunswick | 3 | 13 | 14 | 15 | 12 | 0.0 | 0.4 | 0.1 | 0.3 | 0.1 |
| Quebec | 11 | 15 | 34 | 48 | 29 | 0.0 | 0.0 | 0.1 | 0.0 | 0.1 |
| Ontario | 130 | 270 | 309 | 332 | 341 | 0.2 | 2.3 | 2.3 | 3.6 | 3.5 |
| Manitoba | 7 | 22 | 19 | 22 | 34 | 0.0 | 0.1 | 0.2 | 0.0 | 0.2 |
| Saskatchewan | 9 | 19 | 25 | 28 | 27 | 0.1 | 0.1 | 0.0 | 0.4 | 0.1 |
| Alberta | 33 | 112 | 98 | 110 | 114 | 0.2 | 1.6 | 1.0 | 1.7 | 0.8 |
| British Columbia | 49 | 137 | 158 | 167 | 143 | 0.1 | 1.5 | 1.8 | 2.0 | 2.3 |
| Yukon | 0 | 1 | 0 | 0 | 2 | 0.0 | 0.1 | 0.0 | 0.0 | 0.2 |
| Northwest Territories | 0 | 1 | 0 | 0 | 0 | 0.0 | 0.0 | 0.0 | 0.0 | 0.0 |
| Nunavut | 0 | 0 | 0 | 1 | 0 | 0.0 | 0.0 | 0.0 | 0.0 | 0.0 |
| Missing Data | 1 | 0 | 0 | 1 | 0 | 0.0 | 0.0 | 0.0 | 0.0 | 0.0 |
| Gender | ||||||||||
| Men | 23 | 29 | 23 | 37 | 29 | 0.0 | 0.2 | 0.1 | 0.2 | 0.3 |
| Women | 236 | 588 | 662 | 718 | 720 | 0.7 | 6.2 | 5.6 | 8.1 | 7.4 |
| Canada | 259 | 617 | 685 | 755 | 749 | 0.7 | 6.4 | 5.7 | 8.2 | 7.7 |
- Note: Totals may not add up due to rounding
- 1 Includes claims for which at least $1 of Employment Insurance special benefits was paid to self-employed persons.
- 2 The numbers for claims by type of benefits do not add up to the total presented because EI claimants can receive multiple types of EI benefits in one claim.
- Source: ESDC, Employment Insurance (EI) administrative data. Data are based on a 100% sample of EI administrative data, except for the amount paid which is based on a 10% sample.
4.6.2 Level of Employment Insurance Special Benefits for Self-employed Persons
In 2014/2015, the average weekly benefit rate for special benefits paid to self-employed workers was $309 per claim. In comparison, the average weekly benefit rate for the same benefits paid to salaried employees was $414.