
Employment Insurance Monitoring and Assessment Report 2014/2015 Chapter II - 5. Employment Insurance work-sharing benefits
5. Employment Insurance work-sharing benefits
The Work-sharing program is an adjustment program designed to help employers and workers avoid layoffs when there is a temporary reduction in the normal level of economic activity that is a result of factors beyond the control of the employer. It provides income support in the form of Employment Insurance (EI) Work-Sharing benefits to eligible employees who agree to work a temporarily reduced work week while their employer recovers. The goal is for all the participating employees to return to normal levels of working hours by the end of the Work-Sharing agreement.
The program assists employers to retain skilled and valuable employees while avoiding the costly process of training and recruiting new employees when the business recovers. The program also helps workers maintain their employment and skills while supplementing their wages with Work-Sharing benefits for the days they are not working but would have otherwise been willing to work under normal business operations.
Work-sharing agreements are signed for a duration period of between 6 to 26 consecutive weeks, with a possible extension of up to 12 additional weeks (up to 38 weeks total) under exceptional circumstances such as an unanticipated and prolonged period of economic contraction. To be eligible for work-sharing benefits, an affected group of employees in a work unit must experience a minimum 10% reduction in their normal weekly earnings.
Under a work-sharing agreement, available work is redistributed through a reduction in hours worked by all employees within one or more work units of a company. Affected workers must be year-round employees, meet the eligibility criteria to receive EI regular benefits, and must agree to a reduction in their normal amount of working hours to be eligible to participate in a work-sharing agreement.
To be eligible to participate, the employer must be either a publicly held company, private business or non-profit organization experiencing reductions in business activity that are beyond their control and be in operation year-round in Canada for at least two years prior to applying. The employer must be willing to implement a recovery plan to return affected work units to normal staffing levels and hours of work by the end of the agreement period. To qualify for Work-Sharing, the employer must also employ a minimum of two EI-eligible employees within the Work-Sharing unit and agreements must be signed by the affected employees, employer, and Service Canada.
Employers who provide temporary or seasonal work arrangements, or which are subject work stoppages due to a labour dispute, are not considered eligible for work-sharing agreements.
Employers experiencing reduced business activity that is attributable to a predictable seasonal shortage of work or any other recurring production slowdown are not eligible for Work-Sharing. Employers directly involved in a work stoppage attributable to a labour dispute are also not eligible for work-sharing agreements.
An internal evaluation of the Work-Sharing program was finalized in 2014/2015 to assess and determine the overall impacts and effects of the temporary policy changes introduced during and after the 2008 recession. The evaluation found that the program continues to be relevant and was particularly effective during the economic downturn. Results of the evaluation demonstrate that firms which participated in Work-Sharing were unlikely to completely shut-down after the termination of their agreement. This suggests that the program is not delaying closures of failing businesses, but rather supporting companies who are facing work shortages due to temporary business downturns. For example, evidence from the evaluation's review of program files confirmed that 74% of the 226 approved Work-Sharing agreement files reviewed returned to normal levels of business activity by the end of the agreement. Footnote 156
The evaluation proposed a number of recommendations, including:
- exploring ways to improve reporting processes for smaller companies;
- improving the speed of benefit delivery to employees;
- examining ways to further streamline multiple signing authorities for agreements where laid-off workers are called back to employment;
- increasing outreach activities for employers and employees;
- improving the consistency and efficiency of program delivery across regions; and
- finding more ways to increase the use of the program by non-manufacturing sectors.
The amount paid in EI work-sharing benefits is impacted by three key indicators: the number of claims, the duration of benefits, and the average weekly benefit rate (level of benefits). In general, an increase in one of these indicators will increase the total amount of benefits paid. The following sections will discuss the amount paid, number of claims, the level and duration of work-sharing benefits in recent years. For the purposes of this section, EI work-sharing claims refers to claims for which at least $1 of work-sharing benefits was paid.
5.1 Employment Insurance Work-Sharing claims Footnote 157 and amounts paid
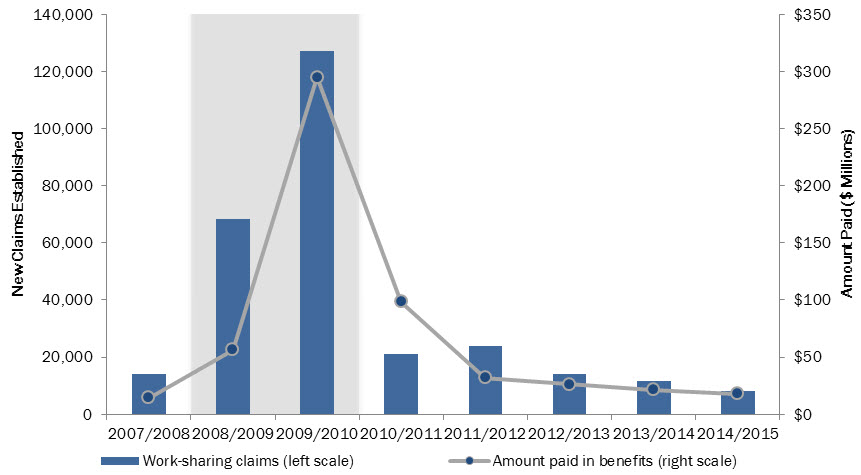
The rate of use of work-sharing benefits is countercyclical. The total number of claims established and amount paid in Employment Insurance benefits normally increase during time periods of labour market contraction, and decline during time periods of economic expansion. As illustrated in Chart 47, the number of new work-sharing claims peaked in 2009/2010, reaching a total of just over 127,000 claims as a result of the impacts from the 2008 recession and temporary Employment Insurance changes introduced by the Government. Footnote 158 As the economy began to recover in the following years, the number of work-sharing claims declined significantly. In 2014/2015, there were 8,024 new work-sharing claims established, representing a decrease of 31% compared to claims reported in 2013/2014. The economy continuing to improve between 2013/2014 and 2014/2015 meant that the number of work-sharing claims was well below pre-recession levels as fewer employers needed support to keep their businesses operating at normal levels.
Show Data Table
| 2007/2008 | 2008/2009 | 2009/2010 | 2010/2011 | 2011/2012 | 2012/2013 | 2013/2014 | 2014/2015 | |
|---|---|---|---|---|---|---|---|---|
| Work-sharing Claims | 14,047 | 68,437 | 127,033 | 20,929 | 23,755 | 13,890 | 11,673 | 8,024 |
| Amount Paid in Work-sharing Benefits ($ Millions) | 14.5 | 56.4 | 294.7 | 98.3 | 31.7 | 26.1 | 21.3 | 17.7 |
- 1 Includes claims for which at least $1 of work-sharing benefits were paid.
- Note: Shaded area corresponds to a recesionary period for the Canadian economy. The shaded area also corresponds to the introduction of temporary measures related to the Work-Sharing program.
- Source: ESDC, Employment Insurance administrative data, based on a 100% sample.
In 2014/2015, there was an average of 2,685 beneficiaries receiving work-sharing benefits each month, a decrease of 26% from the monthly average of 3,636 beneficiaries reported in 2013/2014. Footnote 159 The count of beneficiaries represents the number of claimants who received at least $1 of EI work-sharing benefits during the reference period for the month (usually the week of the 15th day) and is affected by the inflow of new claimants and the outflow of claimants who have stopped receiving work-sharing benefits.
Generally speaking, changes in the number of claims and beneficiaries tend to move together, with the exception of changes to the average duration of benefits or a sudden, significant increase or decrease in new claims. When there is an economic shock, claim volumes will increase ahead of beneficiaries due to a lag between when a new claim is received and when a benefit period is established and benefits are made payable. The beneficiary count will remain elevated after the volume of new claims subsides and previous claims remain in pay, until benefits are exhausted, the claimant has returned to their regular working hours, or the work-sharing agreement ends.
The amount paid in Work-Sharing benefits grew significantly during the aftermath of the 2008 recession but has since declined. In 2014/2015, total Work-Sharing benefits paid to Employment Insurance claimants amounted to $17.7 million, a 17% decrease from the $21.3 million reported in 2013/2014 and a large decline from the peak of $295 million in benefits paid that was reached in 2009/2010.
Factors which contributed to the significant increase in Work-Sharing benefits paid in recent years include a higher volume of claims established in the 2008 recession, as well as temporary policy changes introduced under previous Budgets for 2009, 2010, and 2011.
5.1.1 Employment Insurance Work-sharing Claims and Amount Paid, by Province and Territory, Gender, Age, and Industry
As demonstrated in Table 58, Quebec accounted for 45% of Work-Sharing claims established and amounts paid in 2014/2015, while Ontario accounted for 28% of work-sharing claims established and 30% of the total amount paid. Together, these two provinces accounted for 73% of all claims established and 76% of all amounts paid in 2014/2015.
The province of Saskatchewan saw the largest increases in the total number of new claims established and amounts paid under work-sharing between 2013/2014 (1% of claims made and 1% of benefits paid) and 2014/2015 (9% of claims made and 14% of benefits paid). Together, the Atlantic provinces represented 1% of all new claims made and 2% of amounts paid in 2014/2015, while the Western provinces represented 26% of all new claims and 23% of amounts paid in 2014/2015. There were no new work-sharing claims established for, or benefits paid to, individuals working in Canada's Territories in 2014/2015.
Men continue to be more likely to make use of the Work-Sharing program, accounting for 74% of new Work-Sharing claims and 80% of Work-Sharing benefits paid in 2014/2015. By age, workers aged 25 to 44 were the heaviest users of the Work-sharing program, accounting for 43% of work-sharing claims and 47% of work-sharing benefits in 2014/2015. Together, core aged labour force participants (those aged 25 to 54) accounted for 73% of all work-sharing claims and 76% of benefits paid, representing a higher share of work-sharing claimants than their share of total employment in Canada. Youth were under-represented for the number of new claims established and benefits paid in terms of their total share of employment (see Table 58).
Work-Sharing has been utilized most frequently by employees in the manufacturing industry historically, and this trend continued in 2014/2015. Employees in the manufacturing industry accounted for 63% of EI Work-Sharing Claims and 63% of EI Work-Sharing benefits paid, despite accounting for just 10% of total employment share for Canadian industries (see Table 58). These totals are slightly below the share of EI Work-Sharing claims and benefits paid attributed to the manufacturing industry in previous years (73% of claims and 69% of benefits paid in 2013/2014, and 77% of claims and 73% of benefits paid in 2012/2013). This indicates that the manufacturing industry continues to be over-represented in the number of Work-Sharing claims initiated and benefits paid, relative to its share of total employment across all industries.
| Categories | New Claims Established | Amount Paid | Employment |
|---|---|---|---|
| Province and Territory | |||
| Quebec | 45% | 45% | 23% |
| Ontario | 28% | 31% | 39% |
| Saskatchewan | 9% | 14% | 3% |
| All Other Provinces and Territories | 18% | 11% | 35% |
| Gender | |||
| Male | 74% | 80% | 52% |
| Female | 26% | 20% | 48% |
| Age | |||
| 24 Years and Under (Youth) | 6% | 5% | 14% |
| 25 to 54 Years | 73% | 76% | 66% |
| 55 Years and Older (Older Workers) | 21% | 19% | 20% |
| Industry | |||
| Manufacturing | 63% | 63% | 10% |
| Professional, Scientific and Technical Services | 11% | 13% | 8% |
| Wholesale Trade | 11% | 14% | 15% |
| All Other Industries | 16% | 11% | 68% |
| Canada | 100% | 100% | 100% |
- 1 Includes claims for which at least $1 of work-sharing benefits was paid.
- Source: ESDC, Employment Insurance administrative data (for data on new claims established and amounts paid); and Statistics Canada, Labour Force Survey, CANSIM Table 282-0087 (for data on employment). ESDC data is based on a 100% sample of Employment Insurance administrative data.
- Note: Totals may not add up due to rounding.
5.2 Level and duration of Employment Insurance Work-sharing benefits
The following section outlines the level of benefits received by Work-Sharing participants, and the average duration of benefits provided under work-sharing agreements entered into by Service Canada, employers and employees.
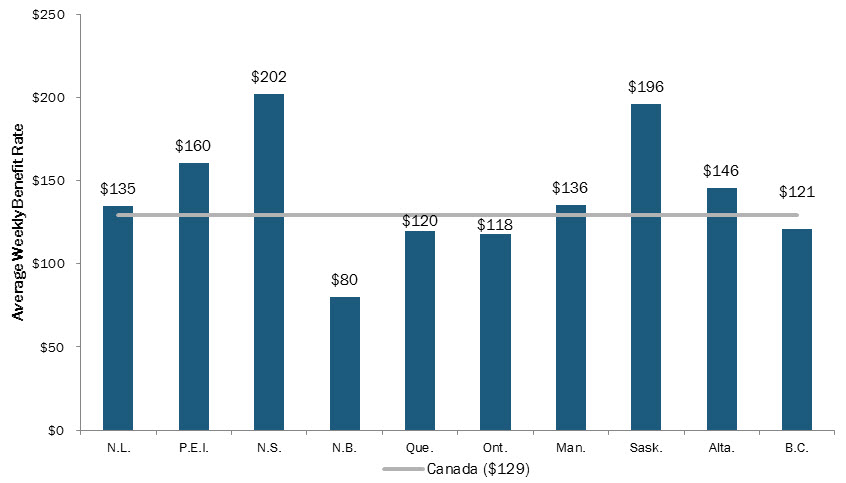
In 2014/2015, the average benefit rate of work-sharing benefits was $129 per week in 2014/2015, an increase of 10.3% compared to the average weekly benefit of $117 reported in 2013/2014. This represents the third consecutive annual increase in the level of average weekly work-sharing benefits, and was higher than the level of benefits paid during the aftermath of the 2008 recession, in line with improving economic conditions and wage increases reported during that time.
Nova Scotia ($202) and Saskatchewan ($196) received the highest average weekly benefit rates, while those from New Brunswick ($80) received the lowest. Similar to previous years, there was a high level of variability between the averages for weekly benefits paid in each province in 2014/2015 (see Chart 48).
Show Data Table
| 2014/2015 | |
|---|---|
| N.L. | $135 |
| P.E.I. | $160 |
| N.S. | $202 |
| N.B. | $80 |
| Que. | $120 |
| Ont. | $118 |
| Man. | $136 |
| Sask. | $196 |
| Alta. | $146 |
| B.C. | $121 |
| Canada | $129 |
- Note: No work-sharing claim was established in the Northest Territories. Yukon or Nunavut in 2014/2015.
- Source: ESDC, Employment Insurance (EI) administrative data. Data are based on a 100% sample of EI administrative data.
Men received an average weekly benefit rate of $135, while women received average weekly benefit rate of $112 in 2014/2015.
The industry which reported the highest average weekly benefit for Work-Sharing was the Mining, Oil and Gas Extraction industry ($198), followed by the Wholesale Trade industry ($169) and Transportation and Warehousing industry ($157). The industries which reported the lowest average weekly benefit rate for Work-Sharing were the Utilities industry (no benefits were paid to this industry) and the Arts, Entertainment and Recreation industry ($83) in 2014/2015. Similar to figures reported on a provincial basis, there was also significant variation in average weekly benefits on the basis of industry classification, attributable in part to significant variability of average wages across professions in these industries and the number of claims made per industry.
The average duration of Work-Sharing claims established in 2014/2015 was 15.5 weeks, an increase from 2013/2014 (14.3 weeks) and 2012/2013 (13.6 weeks). The current average duration is also above the average duration of 13.1 weeks for claims established in 2007/2008, before the recession.
5.3 Employment Insurance Work-Sharing agreements
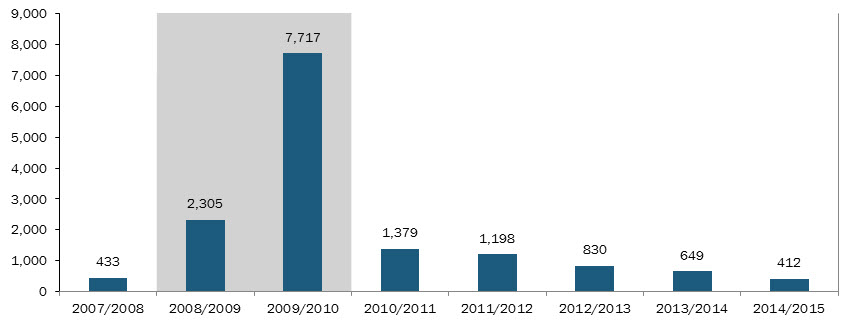
Similar to the number of Work-Sharing claims established and amounts paid, the numbers of Work-Sharing Agreements that are agreed to in a given fiscal year tend to follow a counter cyclical pattern, with the number of new agreements established increasing during periods of economic shocks and declining during periods of economic growth.
Consistent with the ongoing period of economic recovery in 2014/2015, the number of new Work-Sharing agreements declined for the fifth consecutive year, from 649 agreements in 2013/2014 to 412 in 2014/2015, equivalent to a decline of 36.5%. The number of new agreements has decreased significantly since the peak of 7,717 agreements in 2009/2010 and for the first time since the start of the 2008 recession the number of new agreements initiated fell below pre-recession levels in 2014/2015 (see Chart 49).
Show Data Table
| Total Count of Work-Sharing Agreements | |
|---|---|
| 2007/2008 | 433 |
| 2008/2009 | 2,305 |
| 2009/2010 | 7,717 |
| 2010/2011 | 1,379 |
| 2011/2012 | 1,198 |
| 2012/2013 | 830 |
| 2013/2014 | 649 |
| 2014/2015 | 412 |
- Note: Shaded area corresponds to a recessionary period for the Canadian economy. The shaded area also corresponds to the introduction of temporary measures related to the Work-Sharing program.
- Source:ESDC, Common System for Grants and Contributions.
5.3.1. Employment Insurance Work-Sharing Agreements by Province and Territory, Industry and Enterprise Size
In 2014/2015, Ontario (137 agreements) and Quebec (173 agreements) together represented 75% of all Work-Sharing agreements. Western provinces, with 89 agreements total, made up 22% of all agreements, while the Atlantic provinces accounted for 3% of all Work-Sharing agreements in 2014/2015. There were no Work-Sharing agreements started in Canada's territories in 2014/2015.
The industry which reported the largest number of work-sharing agreements in 2014/2015 was the manufacturing industry with 227 agreements. This amount was equivalent to 55% of all agreements made. The manufacturing industry was followed by firms in the Professional, Scientific and Technical Services industry with 56 agreements (14% of all agreements), the Wholesale Trade industry with 34 agreements (8% of all agreements), and the Construction industry with 28 agreements (7% of all agreements). Similar to the case of Work-Sharing claims and benefits paid, Work-Sharing agreements in the Manufacturing industry were heavily over-represented among industries since manufacturing represented 10% of all employment positions in Canada during 2014/2015 (see Table 59). Based on observed results since 2007/2008, the goods-producing industries of Canada`s economy represented the majority of all work-sharing agreements initiated (over 60% of all agreements for each year reviewed) than firms in the services-producing industries of the economy.
| 2007/ 2008 | 2008/ 2009 | 2009/ 2010 | 2010/ 2011 | 2011/ 2012 | 2012/ 2013 | 2013/ 2014 | 2014/ 2015 | |
|---|---|---|---|---|---|---|---|---|
| Goods-producing Industries | 63% | 69% | 63% | 61% | 68% | 68.5% | 69% | 65% |
| Construction | 1% | 2% | 5% | 7% | 6% | 5% | 5.5% | 7% |
| Manufacturing | 61% | 65% | 56% | 52.5% | 61% | 62% | 59% | 55% |
| Services-producing Industries | 13% | 22% | 36% | 39% | 32% | 31.5% | 31% | 35% |
| Wholesale Trade | 2% | 5.5% | 8% | 7% | 7% | 5% | 7% | 8% |
| Retail Trade | 1% | 3% | 4% | 6.5% | 6% | 6% | 4% | 4% |
| Professional, Scientific and Technical Services | 4% | 5% | 9% | 9% | 8% | 9% | 12% | 14% |
| Unclassified Industries | 24% | 9% | 1% | 0% | 0% | 0% | 0% | 0% |
| Canada | 100% | 100% | 100% | 100% | 100% | 100% | 100% | 100% |
- Note: Totals may not add up due to rounding. Chart reflects percentage shares of top five industries who have initiated work-sharing agreements, as well as for all Good-producing and Services-producing industries.
- Source: ESDC, Common System for Grants and Contributions.
When assessed by firm size, micro (firms with less than 5 employees) and small-sized enterprises (fewer than 50 employees) comprised 75.7% of all Work-sharing agreements in 2014/2015. Combined, micro, small and medium sized enterprises accounted for 99.8% of all Work-sharing agreements, consistent with previous years. There was only one agreement made that involved a large-sized enterprises (500 employees or more). Results for 2014/2015 were consistent with results from previous years since the 2008 recession, with a significant share of all Work-sharing agreements being initiated to assist micro, small and medium sized businesses recover from disruptions to their normal levels of business activity.
5.3.2. Employment Insurance Work-Sharing Agreements Subject to Early Termination
Early termination is a concept referring to a Work-Sharing agreement ending before the anticipated end date of the agreement, indicating that the firm subject to the agreement has either returned to operating at normal levels of business activity ahead of the timelines provided in their recovery plan, or that a firm is no longer interested in participating in the program for other reasons. Of the 412 Work-sharing agreements established in 2014/2015, a total of 124 were terminated earlier than their scheduled end date, accounting for 30% of all agreements during that year.
Of the 124 agreements that ended earlier than anticipated, 110 agreements (89%) concluded due to the participating firms returning to their normal level of employment, while in 11% of cases where agreements ended earlier than anticipated, the level of employment did not return to normal levels (see Table 60).
The proportion of Work-sharing agreements that ended ahead of schedule in 2014/2015 (30%) was lower than the corresponding proportion in 2013/2014 (41%) and 2012/2013 (43%). Manufacturing industries concentrated in Ontario (23 agreements), Quebec (28 agreements) and British Columbia (8 agreements) were the firms that reported the majority (56.4%) of cases where Work-Sharing agreements were terminated early because they returned to normal levels of business.
| Category | Count | Share of All Work-sharing Agreements (2014/2015) |
|---|---|---|
| Agreements Terminated on Schedule | 288 | 70% |
| Agreements Terminated Earlier than Scheduled End Date | 124 | 30% |
| Early Termination Because Level of Employment Returned to Normal Levels | 110 | 27% |
| Early Termination with Employment Not Returning to Normal Levels | 14 | 3% |
| Canada | 412 | 100% |
- Note: Totals may not add up due to rounding
- Source: ESDC, Common System for Grants and Contributions.
5.4. Number of estimated layoffs averted from Work-Sharing agreements
One of the main goals of the Work-Sharing program is to attempt to avert the number of layoffs a firm will have to face and to return participating employees to normal working hours by the end of the term of the Work-Sharing agreement.
A recent program study undertaken by ESDC attempts to quantify the number of layoffs averted as a result of the intervention of a work-sharing agreement. Footnote 160 When assessing results of the Work-sharing program since 2007/2008, the number of layoffs averted in each fiscal year varied from a low of 1,546 in 2007/2008 to a high of 24,906 in 2009/2010. Footnote 161
The number of layoffs averted or postponed by Work-Sharing agreements tends to vary in proportion to the number of Work-Sharing participants in a given year. As well, net layoffs averted by Work-Sharing agreements, as a share of the total estimated layoffs averted or postponed, tends to decrease during peak recessionary periods while the number of layoffs averted tends to increase during periods of initial economic recovery as the economy returns to growth. As a result, the performance reported of Work-Sharing agreements helping to avert layoffs during recessionary periods is reinforced by Work-Sharing agreements performing even more effectively when it attempts to avert layoffs during times of economic expansion, when the circumstances of the interruptions in normal business activity faced by firms are more local or targeted in nature (e.g. specific to local economic conditions) or based on economic downturns of shorter and less intense duration.
Since the beginning of 2010/2011, the proportion of net layoffs averted from Work-sharing agreements has fluctuated from a low of 66% in 2010/2011 to a high of 83% in 2014/2015 with each year since 2011/2012 reporting proportions of net layoffs averted above 70% (see Table 61).
| Fiscal Year | Total Estimated Layoffs Averted or Postponed under WS Agreements2 | Number of Actual Layoffs Observed3 | Net Layoffs Averted4 | Net Layoffs Averted as a Share of Total Estimated Layoffs Averted or Postponed under WS Agreements |
|---|---|---|---|---|
| 2007/2008 | 4,000 | 2,947 | 1,053 | 26% |
| 2008/2009 | 22,000 | 10,811 | 11,189 | 51% |
| 2009/2010 | 35,500 | 11,115 | 24,385 | 69% |
| 2010/2011 | 6,000 | 2,047 | 3,953 | 66% |
| 2011/2012 | 7,000 | 1,959 | 5,041 | 72% |
| 2012/2013 | 4,500 | 1,346 | 3,154 | 70% |
| 2013/2014 | 3,500 | 1,057 | 2,443 | 70% |
| 2014/2015 5 | 2,500 | 435 | 2,065 | 83% |
| Totals | 85,000 | 31,717 | 53,283 | 63% |
- Note:
- 1 Assumes total work reduction is equal under Work-sharing or layoff alternatives. Also assumes that the average work reduction is the same during the weeks which could not be assessed.
- 2 The estimated number of layoffs averted listed in this column is not equal to the number of Work-Sharing claims made. The number of estimated layoffs averted or postponed is assumed to be equal to the number of positions in the affected work unit that would have been laid off if the Work-Sharing agreement had not occurred.
- 3 The number of layoffs is equal to the number of Work-sharing claimants who claimed regular EI benefits within 26 weeks of receiving their last Work-Sharing benefit.
- 4 The number of net layoffs averted is estimated as the difference between the number of positions in the affected work unit that would have been laid off minus the number of layoffs experienced by a company within 26 weeks of receiving their last Work-Sharing weekly benefit payment.
- 5 Results for 2014/2015 are likely to change in future years as some lag time exists for receiving information for completed Work-Sharing claims.
- Source: ESDC, Employment Insurance administrative data based on a 100% sample.