
Employment Insurance Monitoring and Assessment Report for the fiscal year beginning April 1, 2017 and ending March 31, 2018
Chapter 2 - 1 Employment Insurance benefits overview
From: Employment and Social Development Canada
On this page
2.1. Employment Insurance benefits overview
The Employment Insurance (EI) program provides temporary income support to partially replace employment income for eligible unemployed contributors to the program while they look for new employment or upgrade their skills, and for those who are absent from work due to specific life circumstances (such as sickness, pregnancy, or caring for a newborn or a newly adopted child, a critically ill family member or a gravely ill family member with significant risk of death).
In this chapter, EI benefits refer to regular benefits, special benefits, fishing benefits and Work-Sharing benefits. Special benefits include maternity benefits, parental benefits, sickness benefits, family caregiver benefits for adults or children, and compassionate care benefits. All EI benefit types are paid at 55% of average weekly insurable earnings, except for extended parental benefits, which are paid at 33%. Subsection 2.1.1 covers the number of new claims established in the fiscal year, total amount paid over the fiscal year and benefit levels of claims established. Subsection 2.1.2 examines combined (or mixed) benefit claims. Subsection 2.1.3 provides an analysis of the usage of EI benefits relative to EI contribution premiums.
| Benefit type | Circumstance | Insurable Employment entrance requirement | Maximum entitlement |
|---|---|---|---|
| Regular | Unemployed with a valid reason for separation and searching for suitable employment or retraining in certain cases | 420 to 700 hours depending on the Variable Entrance Requirement1 | 14 to 45 weeks, depending on insurable employment2 |
| Fishing | Self-employed fishers without available work | Value of a catch between $2,500 and $4,200 depending on the Variable Entrance Requirement1 | 26 weeks per season (summer or winter) |
| Work-Sharing | Firm avoiding layoffs during a slowdown in business activity for reasons beyond the firm’s control with a recovery plan and a Work-Sharing agreement in place | 420 to 700 hours depending on the Variable Entrance Requirement and must be a year-round employee | 6 to 26 weeks, with the possibility of an extension by 12 weeks if warranted3 |
| Special4 | |||
| Maternity | Unavailable to work because of pregnancy or has recently given birth | 600 hours | 15 weeks |
| Standard Parental | Caring for a newborn or a newly adopted child | 600 hours | 35 weeks5 |
| Extended Parental | Caring for a newborn or a newly adopted child | 600 hours | 61 weeks5 (at a lower replacement rate6) |
| Sickness | Unavailable to work because of illness, injury or quarantine | 600 hours | 15 weeks |
| Family caregiver for children (formerly Parents of Critically Ill Children)7 |
Providing care or support to a critically ill or injured person under the age of 18 | 600 hours | 35 weeks5 |
| Family caregiver for adults7 | Providing care or support to a critically ill or injured person 18 years or older | 600 hours | 15 weeks5 |
| Compassionate care | Providing care to a person of any age who requires end-of-life care | 600 hours | 26 weeks5 |
- 1 Prior to July 3, 2016, new entrants and re-entrants were required to meet an entrance requirement of 910 hours for regular benefits and $5,500 for fishing benefits. Under the current rules, new entrants and re-entrants now face the same eligibility requirements as other claimants in the region where they live.
- 2 Budget Implementation Act, 2016, No. 1 extended the duration of EI regular benefits up to a maximum of 70 weeks of regular benefits for some claimants (see subsection 2.2.4 for further details on the measure).
- 3 A temporary Work-Sharing measure was announced to support re-employment and needs for long-term adjustments in the forestry sector. This measure extends the duration of Work-Sharing agreements across Canada from a maximum of 38 weeks to 76 weeks. It came into effect on July 30, 2017 and will continue until March 28, 2020.
- 4 Self-employed workers (other than fishers) who have opted into EI special benefits must meet an insurable earnings threshold for the calendar year preceding the claim. The threshold was $6,888 for claims established in 2017 and $6,947 for claims established in 2018.
- 5 Benefits can be shared between eligible claimants (i.e. parents or family members).
- 6 As of December 3, 2017, parents can choose between standard parental benefits at a 55% replacement rate and extended parental benefits at a 33% replacement rate.
- 7 As of December 3, 2017 the family caregiver benefit for adults and children became available to caregivers who are away from work to support a critically ill or injured family member. Before, Parents of Critically Ill Children was available only to parents of children under 18.
2.1.1 Employment Insurance claims, amount paid and level of benefits
For the period starting on April 1, 2017 and ending on March 31, 2018 (FY1718), the number of new claims decreased by 0.2% (-2,800) to remain at approximately 1.8 million new EI claims. Total EI benefits increased by $193.7 million (+1.0%) to reach $18.7 billion, the highest level recorded since the $19.4 billion recorded in FY0910 (see Chart 1).
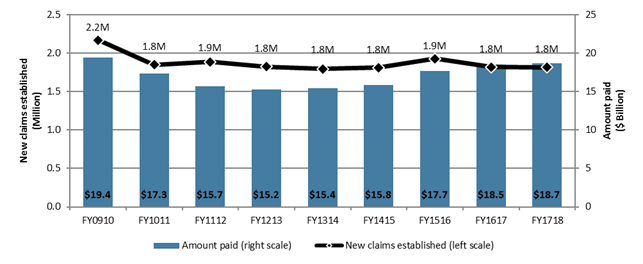
Chart 1 – Text version
| Fiscal year | Employment Insurance claims (millions) (left scale) | Amount paid in Employment Insurance benefits ($ billion) (right scale) |
|---|---|---|
| FY0910 | 2.2 | $19.4 |
| FY1011 | 1.8 | $17.3 |
| FY1112 | 1.9 | $15.7 |
| FY1213 | 1.8 | $15.2 |
| FY1314 | 1.8 | $15.4 |
| FY1415 | 1.8 | $15.8 |
| FY1516 | 1.9 | $17.7 |
| FY1617 | 1.8 | $18.5 |
| FY1718 | 1.8 | $18.7 |
- Note: Includes all claims for which at least $1 of Employment Insurance benefits was paid.
- Source: Employment and Social Development Canada, Employment Insurance (EI) administrative data. Data are based on a 10% sample of EI administrative data.
According to Statistics Canada, there were 773,900 beneficiaries receiving EI benefits on average each month in FY1718, a decrease of 6.3% from 826,300 beneficiaries during the previous reporting period.Footnote 2 The average weekly benefit rate grew from $447 in FY1617 to $454 to FY1718.Footnote 3 The proportion of claimants receiving the maximum weekly benefit increased slightly from 45.6% in FY1617 to 46.5% in FY1718.
New Employment Insurance claims established
The slight decrease in new EI claims registered in the reporting period was mostly driven by regular claims and Work-Sharing claims, and was partially offset by increases in sickness benefit claims (see Table 2).
| Type of Employment Insurance benefits | New claims established | ||
|---|---|---|---|
| FY1617 | FY1718 | Change (%) | |
| Regular | 1,321,130r | 1,299,710 | -21,420 (-1.6%) |
| Fishing | 28,934 | 30,055 | +1,121 (+3.9%) |
| Work-sharing | 11,936 | 3,708 | -8,228 (-68.9%) |
| Special | 563,380 | 597,090 | +33,710 (+6.0%) |
| Maternity | 170,330 | 171,470 | +1,140 (+0.7%) |
| Parental | 195,960 | 198,050 | +2,090 (+1.1%) |
| Sickness | 378,700 | 411,870 | +33,170 (+8.8%) |
| Parents of Critically Ill Children/Family Caregiver for Children* | 4,238r | 4,903 | +665 (+15.7%) |
| Family Caregiver for Adults* | n/a | 2,635 | n/a |
| Compassionate Care | 10,193 | 11,010 | + 817 (+8.0%) |
| Canada | 1,818,340 | 1,815,540 | -2,800 (-0.2%) |
- Notes: Totals may not add up due to rounding. Includes all claims for which at least $1 of Employment Insurance benefits was paid. The sum of claims by benefit type does not add up as multiple benefit types can be combined in one single claim.
- r Revised data
- * As of December 3, 2017 the Family caregiver benefit for adults and children became available to caregivers who are away from work to support a critically ill or injured family member. Before, Parents of Critically Ill Children was available only to parents of children under 18.
- Source: Employment and Social Development Canada, Employment Insurance (EI) administrative data. Data are based on a sample of 10% of the EI administrative data, except for fishing, family caregiver, Work-Sharing and compassionate care benefits (100%).
Following a decrease in new EI claims established across Canada from FY1516 to FY1617, all jurisdictions experienced modest increases with the exception of Quebec (-700), Yukon (-100), and Alberta, which reported the most significant decrease (-31,300) (see Table 3).
| New claims established | |||
|---|---|---|---|
| FY1617 | FY1718 | Change (%) | |
| Province or territory | |||
| Newfoundland and Labrador | 74,000 | 81,090 | +9.6% |
| Prince Edward Island | 22,540 | 22,720 | +0.8% |
| Nova Scotia | 82,710 | 85,300 | +3.1% |
| New Brunswick | 88,910 | 91,130 | +2.5% |
| Quebec | 483,700 | 482,990 | -0.1% |
| Ontario | 552,030 | 562,570 | +1.9% |
| Manitoba | 59,250 | 61,440 | +3.7% |
| Saskatchewan | 49,850 | 51,250 | +2.8% |
| Alberta | 201,610 | 170,270 | -15.5% |
| British Columbia | 197,770 | 200,820 | +1.5% |
| Yukon | 2,300 | 2,200 | -4.3% |
| Northwest Territories | 2,380 | 2,420 | +1.7% |
| Nunavut | 1,290 | 1,340 | +3.9% |
| Gender | |||
| Men | 984,150 | 974,660 | -1.0% |
| Women | 834,190 | 840,880 | +0.8% |
| Age category | |||
| 24 years old and under | 178,010 | 172,810 | -2.9% |
| 25 to 44 years old | 883,950 | 876,270 | -0.9% |
| 45 years to 54 years old | 370,360 | 363,410 | -1.9% |
| 55 years old and over | 386,020 | 403,050 | +4.4% |
| EI claimant category | |||
| Long-tenured workers | 543,960 | 525,560 | -3.4% |
| Occasional claimants | 960,300 | 970,360 | +1.0% |
| Frequent claimants | 314,080 | 319,620 | +1.8% |
| Canada | 1,818,340 | 1,815,540 | -0.2% |
- Notes: Totals may not add up to the total due to rounding. Includes claims for which at least $1 of EI benefits was paid.
- Source: Employment and Social Development Canada, Employment Insurance (EI) administrative data. Data are based on a sample of 10% of the EI administrative data.
The number of new claims established by men decreased slightly (-9,500 or -1.0%) during FY1718, representing 53.7% of all new claims established. Levels of new EI claims decreased for every age group except older workers (aged 55 years or older). Over half of all new EI claims came from occasional claimants.Footnote 4
Total amount paid in Employment Insurance benefits
The slight increase in EI benefits (+0.2 billion or +1.0%) during the reporting fiscal year to a total of $18.7 billion was mainly driven by an increase in sickness benefit payments (+$144.6 million). The rise could also be partly attributed to the legislative change made to the Employment Insurance Act that reduced the waiting period from two weeks to one week starting on January 1, 2017. With this measure, as eligible claimants have to wait one less week for benefit payments to become payable, some claimants received an additional week of benefits.Footnote 5 A recent studyFootnote 6 by ESDC looking at the preliminary impacts of the waiting period reduction estimated that among completed claims who served a waiting period, 65.8% of regular claims, 71.1% of special benefit claims and 61.6% of fishing claims benefitted from the measure by receiving an extra week of benefits.
The share of EI benefits paid by benefit type remains relatively unchanged compared to the previous reporting period. Regular benefits (67.6%) and special benefits (30.7%) accounted for 98.3% of total EI benefit payments, while fishing and work-sharing benefits represented less than 2.0% of total EI benefits paid (see Chart 2).
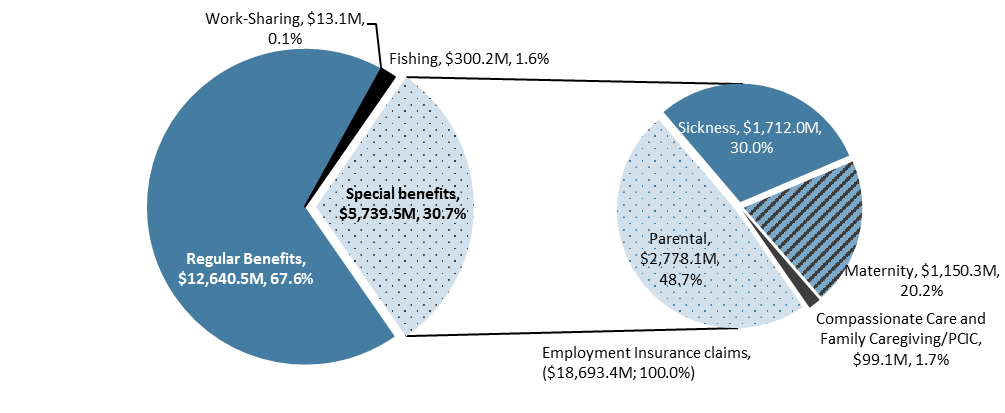
Chart 2 – Text version
| $ million | % share | |
|---|---|---|
| Regular benefits | $12,640.5 | 67.6% |
| Work-Sharing benefits | $13.1 | 0.1% |
| Fishing benefits | $300.2 | 1.6% |
| Special benefits | $5,739.5 | 30.7% |
| Parental benefits | $2,778.1 | 48.7% |
| Sickness benefits | $1,712.0 | 30.0% |
| Maternity benefits | $1,150.3 | 20.2% |
| Compassionate care and Family caregiving/PCIC benefits | $99.1 | 1.7% |
- *The total amount paid reported in Chart 2 does not correspond to the total reported in Table 4 because data on compassionate care benefits and family caregiver benefits can only be reported on a 100% sampling bases on an aggregate level.
- Source: Employment and Social Development Canada, Employment Insurance (EI) administrative data. Data are based on a sample of 10% of the EI administrative data, except for family caregiver benefits, Work-Sharing and compassionate care benefits (100%).
Amounts paid in EI benefits increased in all jurisdictions, with the exception of Alberta (-15.9%) where the province experienced the first decrease in benefits paid since FY1213 (see Table 4). Nunavut saw the largest increase in EI benefits paid, followed by Newfoundland and Labrador.
| Amount paid ($ millions) | |||
|---|---|---|---|
| FY1617 | FY1718 | Change (%) | |
| Province or territory | |||
| Newfoundland and Labrador | $1,040.2 | $1,185.2 | +13.9% |
| Prince Edward Island | $230.7 | $248.1 | +7.5% |
| Nova Scotia | $841.3 | $892.2 | +6.0% |
| New Brunswick | $919.0 | $954.0 | +3.8% |
| Quebec | $3,430.7 | $3,558.2 | +3.7% |
| Ontario | $5,443.2 | $5,657.7 | +3.9% |
| Manitoba | $587.3 | $631.3 | +7.5% |
| Saskatchewan | $671.5 | $700.9 | +4.4% |
| Alberta | $3,158.3 | $2,655.3 | -15.9% |
| British Columbia | $2,064.2 | $2,089.5 | +1.2% |
| Yukon | $27.3 | $27.8 | +1.6% |
| Northwest Territories | $29.9 | $30.9 | +3.2% |
| Nunavut | $17.6 | $23.6 | +33.9% |
| Gender | |||
| Men | $9,868.8 | $9,678.0 | -1.9% |
| Women | $8,592.2 | $8,976.6 | +4.5% |
| Age category | |||
| 24 years old and under | $1,522.2 | $1,443.0 | -5.2% |
| 25 to 44 years old | $9,869.4 | $9,908.0 | +0.4% |
| 45 years to 54 years old | $3,450.0 | $3,431.5 | -0.5% |
| 55 years old and over | $3,619.4 | $3,872.1 | +7.0% |
| EI claimant category | |||
| Long-tenured workers | $9,048.8 | $9,277.6 | +2.5% |
| Occasional claimants | $3,191.8 | $3,476.3 | +8.9% |
| Frequent claimants | $6,220.4 | $5,890.2 | -5.3% |
| Canada | $18,461.0 | $18,654.7 | +1.0% |
- Notes: Totals may not add up to the total due to rounding. Percentage change is based on unrounded numbers. Includes claims for which at least $1 of EI benefits was paid.
- *Excludes Parents of Critically Ill Children/Caregiver benefits due to incompatibility of administrative data sources.
- Source: Employment and Social Development Canada, Employment Insurance (EI) administrative data. Data are based on a sample of 10% of the EI administrative data.
EI benefits paid increased for women while men saw a decrease in benefits paid. It also increased for claimants aged 55 years or older and claimants aged 25 to 44, and decreased for young claimants and claimants aged 45 to 54.
Level of benefits
The average weekly benefit rate for all claims increased 1.5% nationwide to $454 during the reporting period.
In about half of all provinces, the increase was $5 or less, with the highest increases reported in Newfoundland and Labrador (+$11), Quebec (+$10) and Nunavut (+$20). Northwest Territories continued to have the highest proportion of claimants receiving the maximum benefit rate (80.6%), with Nunavut, Yukon and Alberta at 78.4%, 69.5% and 64.6% respectively. New Brunswick continued to have the lowest proportion of claimants receiving the maximum benefit rate at 35.2%.
The average weekly benefit rate increased to $480 for male claimants and $423 for women. About 57.8% of claims established by men received the maximum benefit rate, while only 33.5% of women’s claims were at the maximum rate. Claimants aged 45-54 saw the highest increase in average benefit rate to $460, while claimants aged 25-44 continued to have the highest average weekly benefit rate at $468 and were most likely to be at the maximum benefit rate (51.3%). Claimants under 25 had the lowest at $403 and only 27.6% hit the maximum benefit rate.
The average weekly benefit rate was the highest among long-tenured workers at $490. Long-tenured workers were also most likely to be at the maximum benefit rate (61.6%). Frequent claimants received an average of $467 in weekly benefits and just over half received the maximum benefit rate, while occasional claimants received an average of $429 and 37.1% received the maximum rate.
Variable best weeks (VBW)
Under the VBW provision the weekly benefit rate is calculated based on an EI claimant’s highest (best) weeks of insurable earnings during the qualifying period. The number of weeks used to calculate the weekly benefit rate ranges from 14 to 22, depending on the monthly regional unemployment rate.*
| Unemployment rate | Number of weeks |
|---|---|
| 6.0% and under | 22 |
| 6.1% to 7.0% | 21 |
| 7.1% to 8.0% | 20 |
| 8.1% to 9.0% | 19 |
| 9.1% to 10.0% | 18 |
| 10.1% to 11.0% | 17 |
| 11.1% to 12.0% | 16 |
| 12.1% to 13.0% | 15 |
| More than 13.0% | 14 |
- *The monthly regional unemployment rates used for the EI program are a moving average of seasonally adjusted rates of unemployment produced by Statistics Canada, as per section 17 of the Employment Insurance Regulations.
Family supplement provision
The Family supplement provision, which targets low-income families, provides additional benefits to EI claimants with children under the age of 18 who have an annual family net income equal to or less than $25,921. The claimant must also receive the Canada Child Benefit. Under the Family Supplement Provision, which is available to claims in all benefit types, the weekly amount of family supplement can increase a claimant’s benefit rate from 55% to a maximum of 80% of his or her weekly insurable earnings, subject to the maximum weekly benefit. The supplement provided to eligible claimants is determined by the claimant’s family net income, the number of children in the claimant’s family, and the age of the claimant’s children.
Approximately 76,000 claims received the family supplement in FY1718, a decrease of 4.4% from FY1617. The number of EI claims receiving the family supplement has now decreased for 16 consecutive years from a high of 187,300 claims in FY0102. Women (79.1%), claimants aged 25 to 44 (71.2%) and occasional EI claimants (84.6%) continue to be the main demographic groups benefitting from the family supplement provision.
During FY1718, low-income families received a total of $89.7 million in additional benefits through the family supplement. Family supplements averaged $44 per week and have remained relatively unchanged since FY0001. However, the consumer price index increased by 36.5%Footnote 7 between FY0001 and FY1718, decreasing the purchasing power of the average family supplement. Furthermore, as reported in a studyFootnote 8, because weekly top-ups have remained unchanged since 1997, fewer claims are reaching the maximum replacement rate of 80% of the claimant’s weekly income (only 2.9% of family supplement claims in FY1718).
Estimated anti-poverty effects of the Employment Insurance program
A recent study by ESDC* looked at the extent to which the EI program helps to prevent unemployed EI beneficiaries and their families from living in households with low-income status.
The study found a 15-percentage point difference between the low-income rate of unemployed EI beneficiaries who received at least $4,000 in EI benefits and unemployed people who did not receive EI benefits in 2015. Furthermore, EI benefit recipients (of at least $4,000 EI benefits) in 2015 had a significantly lower poverty gap ratio (26%) compared to the unemployed who did not receive EI benefits (45%). Results also seem to indicate that the effects of EI was larger during the 2009 recession, which could be partly attributed to the Extended Duration of EI Regular Benefits measure extending entitlements by five additional weeks during that period.
- *ESDC. Assessment of anti-poverty effect of Employment Insurance program. (Ottawa: ESDC, Social Policy Directorate, 2019).
2.1.2 Combined Employment Insurance claims
Under certain provisions of the EI program, a claimant may receive multiple types of benefits as part of a single claim, assuming that the claimant meets each benefit type’s eligibility requirements.Footnote 9 A “pure” claim is one in which an EI claimant receives a single benefit type, while a “combined” claim is one in which the claimant receives more than one benefit type.Footnote 10 Pure claims represented 82.0% of all completed claims in FY1718 (see Table 5).
| Benefit type* | Total claims | Pure claims | Combined claims | Benefit type most often combined with (Share of combined claims) |
||
|---|---|---|---|---|---|---|
| Level (‘000s) | Level (‘000s) | Share (%) |
Level (‘000s) | Share (%) |
||
| Regular | 1,498.3 | 1,312.3 | 87.6% | 186.0 | 12.4% | Sickness (91.8%) |
| Fishing | 30.6 | 26.6 | 86.9% | 4.0 | 13.1% | Sickness (82.5%) |
| Work-sharing | 11.3 | 8.5 | 74.9% | 2.8 | 25.1% | Regular (82.0%) |
| Maternity | 174.0 | 2.6 | 1.5% | 171.4 | 98.5% | Parental (98.3%) |
| Parental** | 204.3 | 30.7 | 15.0% | 173.6 | 85.0% | Maternity (97.1%) |
| Sickness | 435.6 | 232.6 | 53.4% | 203.0 | 46.6% | Regular (84.1%) |
| Compassionate care | 12.3 | 7.2 | 58.9% | 5.1 | 41.1% | Sickness (59.5%) |
| All claims | 1,976.8 | 1,620.5 | 82.0% | 746.9 | 18.0% | n/a |
- Note: Data may not add up to the total due to rounding. Includes claims for which at least $1 of EI benefits was paid. Completed claims include those that are terminated and those that are dormant and remained inactive as of August the following fiscal year.
- *Excludes benefits for Parents of Critically Ill Children/Family Caregiver Benefits
- **Parental benefits include benefits for biological parents and adoptive parents.
- The total number of claims and of combined claims is lower than the sum of claims associated with each benefit type, because mixed claims are only counted once even though they appear in more than one benefit type. This explains why the total number of claims here is different from the total number of claims in Chart 1.
- Source: Employment and Social Development Canada, Employment Insurance (EI) administrative data. Data are based on a 10% sample of EI administrative data.
Women were almost three times more likely to claim more than one type of EI benefit (28.0%) than men (9.8%). This is mostly due to their high probability of claiming both maternity and parental benefits. Maternity benefits were most likely to be combined with other benefit types, most often with parental benefits. However, a significant proportion also claimed sickness benefits with maternity benefits, resulting in the claimant leaving work before becoming eligible for maternity benefits, as maternity benefits are only available twelve weeks prior to the child’s expected date of birth.Footnote 11 The combination of maternity, parental and sickness benefits was the most common among claims with three or more benefit types, with 25,900 during FY1718.
Claims for parental benefits were combined at a slightly lower rate than maternity, as only 12.7% of men who claimed parental also received another benefit payment. Of those male claimants, 86.9% received regular benefits and 14.6% claimed sickness benefits. For women, 99.4% of those who had combined parental benefits shared with maternity, while 15.4% of women who had combined parental and maternity claims also claimed sickness benefits.
Sickness benefits were the third most likely to be combined with other benefit types, mostly with regular benefits. Men combined their sickness benefits predominantly with regular benefits (96.5%), while sickness claims from women were most often combined with regular (72.1%), maternity (26.5%) and parental benefits (25.3%). Sickness also represented the greatest share of combined regular claims.
One quarter of all work-sharing claims were combined with other benefit types, predominantly regular benefits. This is attributable to the fact that both benefit types are typically used during a downturn in business activity, which increases the risk of layoffs (work-sharing benefits) and actual layoffs (regular benefits). Regular benefits are usually claimed following work-sharing benefits, reflecting a continued downturn in a participating firm’s activity that eventually leads to a downsizing of the firm’s labour force.
Compassionate care benefits are most often shared with sickness benefits or regular benefits (51.8%). Men tended to combine compassionate care benefits with regular benefits (71.0%) more often than women (44.6%). Women were most likely to combine compassionate care benefits with sickness benefits (66.0%) compared to men (42.0%).
While fishers do have the possibility of sharing fishing benefits with other benefit types (under some restrictions), only 13.1% of fishing claims were combined claims. 82.5% were combined with sickness benefits. No fishing claims were shared with maternity, parental, compassionate care or work-sharing during the reporting period.
2.1.3 Benefits-to-Contributions ratios
The benefits-to-contribution ratio (B/C ratio) is a measure of income benefits paid by the program as a share of the contributions paid. It provides an estimate of the use of the EI program by claimants compared to the premiums paid. This section highlights key findings regarding the adjusted total B/C ratio and the adjusted regular B/C ratio for 2016.Footnote 12 As EI contributions are not assigned to a specific benefit type, the regular B/C ratio accounts for reductions in EI contributions related to special benefits.Footnote 13
In Canada, total EI benefits paid as a share of total EI premiums paid increased from 0.72 in 2015 to 0.77 in 2016 (total unadjusted B/C ratio). The unadjusted B/C ratio for regular benefits also increased from 0.43 in 2015 to 0.47 in 2016. Both of these ratios are normalized to 1.0 in Chart 3 and Table 6 in order to provide a base to derive the adjusted B/C ratios for each demographic group.
Methodological note: Adjusted benefits-to-contributions ratios
The total and regular B/C ratios presented in this section are normalized, with Canada’s ratio set at 1.0. An adjusted ratio higher than 1.0 means that the underlying sub-population (such as province or territory, industry) is a net beneficiary of the EI program, while those with an adjusted ratio lower than 1.0 are net contributors to the program relative to Canada as a whole.
ProvincesFootnote 14 with high numbers of seasonal claimants generally exhibit adjusted total B/C ratios that are above the national average. In 2016, Newfoundland and Labrador, Prince Edward Island, Nova Scotia and New Brunswick received more in EI benefits than they contributed, when compared to the national average (see Chart 3), highlighting these provinces’ greater usage of regular benefits compared to other regions. On the other hand, Ontario, Manitoba, British Columbia and the Territories received fewer EI benefits and regular benefits per dollar contributed in premiums than the national average.

Chart 3 – Text version
| Region | Adjusted total Benefits-to-Contributions ratio (left scale) | Adjusted Regular Benefits-to-Contributios ratio (left scale) | Adjusted total Benefits-to-Contributions ratio for Canada (1.0) (left scale) | Unemployment rate (right scale) |
|---|---|---|---|---|
| Newfoundland and Labrador | 3.71 | 4.56 | 1.0 | 13.4 |
| Prince Edward Island | 3.10 | 3.27 | 1.0 | 10.7 |
| Nova Scotia | 1.76 | 1.92 | 1.0 | 8.3 |
| New Brunswick | 2.40 | 2.79 | 1.0 | 9.5 |
| Quebec | 1.04 | 1.11 | 1.0 | 7.1 |
| Ontario | 0.74 | 0.65 | 1.0 | 6.5 |
| Manitoba | 0.86 | 0.75 | 1.0 | 6.1 |
| Saskatchewan | 1.02 | 0.98 | 1.0 | 6.3 |
| Alberta | 1.19 | 1.26 | 1.0 | 8.1 |
| British Columbia | 0.83 | 0.75 | 1.0 | 6.0 |
| Nunavut | 0.63 | 0.59 | 1.0 | 5.6 |
| Northwest Territories | 0.73 | 0.68 | 1.0 | 7.4 |
| Yukon | 0.88 | 0.95 | 1.0 | 14.9 |
- Sources: Canada Revenue Agency (CRA), T4 slips with employment income (for data on contributions); Employment and Social Development Canada (ESDC), Employment Insurance (EI) administrative data (for data on benefits); and Statistics Canada Labour force characteristics, Table 14-10-0090-01 (for data on unemployment rates). CRA data are based on a 10% sample of T4 slips with employment income, and ESDC data are based on a 10% sample of EI administrative data.
In 2016, women continued to receive more in EI benefits than they contributed in premiums compared to male claimants, with adjusted B/C ratios of 1.03 and 0.98 respectively (see Table 6). Women aged 25 to 44 in particular receive more in benefits than they contribute with an adjusted B/C ratio of 1.42, compared to women aged 45 to 54 with the lowest total adjusted B/C ratio among women of 0.63. This is likely due to the fact that women aged 25 to 44 claim maternity and/or parental benefits – their adjusted regular B/C ratio is much lower at 0.66.
| Age category | Adjusted total B/C ratio | Adjusted regular B/C ratio | ||||
|---|---|---|---|---|---|---|
| Men | Women | Total | Men | Women | Total | |
| 24 years old and under | 1.31 | 0.85 | 1.10 | 1.60 | 0.51 | 1.12 |
| 25 to 44 years old | 0.91 | 1.42 | 1.14 | 1.13 | 0.66 | 0.92 |
| 45 to 54 years old | 0.86 | 0.63 | 0.75 | 1.11 | 0.76 | 0.95 |
| 55 years old and over | 1.14 | 0.71 | 0.95 | 1.48 | 0.86 | 1.21 |
| Total | 0.98 | 1.03 | 1.00 | 1.23 | 0.71 | 1.00 |
- Sources: Canada Revenue Agency (CRA), T4 slips with employment income (for data on contributions); Employment and Social Development Canada (ESDC), Employment Insurance (EI) administrative data (for data on benefits). CRA data are based on a 10% sample of T4 slips with employment income, and ESDC data are based on a 10% sample of EI administrative data.
For regular B/C ratios, the gender gap is reversed as men have a ratio of 1.23 and women are at 0.71. For regular benefits, men from all age groups have an adjusted regular B/C ratio above the national average, representing that they are more likely to receive more in benefits than they contribute compared to female beneficiaries.
EI beneficiaries working in goods-producing industries had an average adjusted regular B/C ratio of 1.97, above the national average. On the other hand, service-producing industries were below the national average with an adjusted regular B/C ratio of 0.67 (see Chart 4). The greater reliance of workers from the goods-producing sector on EI regular benefits relative to those from the services-producing industries can be connected to the larger share of seasonal employment, which is associated with construction (adjusted regular B/C ratio of 3.24 in 2016) and agriculture, forestry, fishing and hunting (adjusted regular B/C ratio of 3.56 in 2016) industries.
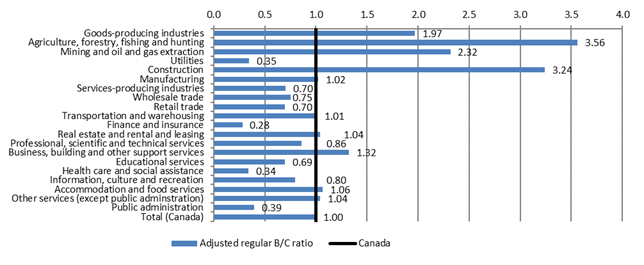
Chart 4 – Text version
| Adjusted Regular Benefits-to-Contributions Ratio | |
|---|---|
| Goods-producing industries | 1.97 |
| Agriculture, forestry, fishing and hunting | 3.56 |
| Mining and oil and gas extraction | 2.32 |
| Utilities | 0.35 |
| Construction | 3.24 |
| Manufacturing | 1.02 |
| Services-producing industries | 0.70 |
| Wholesale trade | 0.75 |
| Retail trade | 0.70 |
| Transportation and warehousing | 1.01 |
| Finance and insurance | 0.28 |
| Real estate and rental and leasing | 1.04 |
| Professional, scientific and technical services | 0.86 |
| Business, building and other support services | 1.32 |
| Educational services | 0.69 |
| Health care and social assistance | 0.34 |
| Information, culture and recreation | 0.80 |
| Accommodation and food services | 1.06 |
| Other services (except public administration) | 1.04 |
| Public administration | 0.39 |
| Canada | 1.00 |
- Sources: Canada Revenue Agency (CRA), T4 slips with employment income (for data on contributions); Employment and Social Development Canada (ESDC), Employment Insurance (EI) administrative data (for data on benefits). CRA data are based on a 10% sample of T4 slips with employment income, and ESDC data are based on a 10% sample of EI administrative data.
Implicit income redistribution and the Employment Insurance program
Due to differences in income support provided by the EI program across socio-economic sub-populations, the program can act as an implicit income redistribution mechanism in Canada, providing greater income support (relative to contributions) to individuals in the lower part of the income distribution as compared to those with greater earnings. A 2012 evaluation study* showed that the benefit and contribution aspects of the program tend to be redistributive and that the impact of the program on the redistribution of earnings increased substantially during the late 2000s recession.
Moreover, a study on the financial impact of receiving EI benefits** concluded that the EI program has a considerable positive income redistribution effect, with lower income families having a higher adjusted total benefits-to-contributions ratio than higher income families. In fact, families with after-tax incomes below the median received 34% of total EI benefits and paid 18% of all premiums, representing an adjusted total benefits-to-contributions ratio of close to 2.0.
- *Ross Finnie and Ian Irvine, The Redistributional Impact of Employment Insurance 2007 to 2009 (Ottawa: HRSDC, Evaluation Directorate, 2013).
- **Constantine Kapsalis, Financial Impacts of Receiving Employment Insurance (Ottawa: Data Probe Economic Consulting Inc., 2010).