
Chapter 2: Impact and effectiveness of Employment Insurance benefits (Part I of the Employment Insurance Act)
From: Employment and Social Development Canada
Official title: Employment Insurance Monitoring and Assessment Report for fiscal year beginning April 1, 2020 and ending March 31, 2021: Chapter 2: Impacts and effectiveness of Employment Insurance benefits (Part I of the Employment Insurance Act)
In chapter 2
- List of abbreviations
- 2.0 Introduction
- 2.1 Employment Insurance benefits overview
- 2.2 Employment Insurance regular benefits
- 2.3 Employment Insurance support while on training
- 2.4 Employment Insurance fishing benefits
- 2.5 Employment Insurance Work-Sharing benefits
- 2.6 Employment Insurance special benefits
- 2.7 Employment Insurance financial information
List of abbreviations
This is the complete list of abbreviations for the Employment Insurance Monitoring and Assessment Report for the fiscal year beginning April 1, 2020 and ending March 31, 2021.
Abbreviations
- AD
- Appeal Division
- ADR
- Alternative Dispute Resolution
- ASETS
- Aboriginal Skills and Employment Training Strategy
- B/C Ratio
- Benefits-to-Contributions ratio
- BDM
- Benefits Delivery Modernization
- CAWS
- Client Access Workstation Services
- CCDA
- Canadian Council of Directors of Apprenticeship
- CCIS
- Corporate Client Information Service
- CEIC
- Canada Employment Insurance Commission
- CERB
- Canada Emergency Response Benefit
- CESB
- Canada Emergency Student Benefit
- CEWB
- Canada Emergency Wage Subsidy
- COLS
- Community Outreach and Liaison Service
- CPP
- Canada Pension Plan
- CRA
- Canada Revenue Agency
- CRB
- Canada Recovery Benefit
- CRCB
- Canada Recovery Caregiving Benefit
- CRF
- Consolidated Revenue Fund
- CRSB
- Canada Recovery Sickness Benefit
- CSO
- Citizen Service Officer
- CX
- Client Experience
- EBSM
- Employment Benefits and Support Measures
- ECC
- Employer Contact Centre
- EI
- Employment Insurance
- EI ERB
- Employment Insurance Emergency Response Benefit
- EICS
- Employment Insurance Coverage Survey
- eROE
- Electronic Record of Employment
- ESDC
- Employment and Social Development Canada
- eSIN
- Electronic Social Insurance Number
- FY
- Fiscal Year
- G7
- Group of Seven
- GDP
- Gross Domestic Product
- GIS
- Guaranteed Income Supplements
- HCCS
- Hosted Contact Centre Solution
- IQF
- Individual Quality Feedback
- ISET
- Indigenous Skills and Employment Training
- IVR
- Interactive Voice Response
- LFS
- Labour Force Survey
- LMDA
- Labour Market Development Agreements
- LMI
- Labour Market Information
- LMP
- Labour Market Partnerships
- MIE
- Maximum Insurable Earnings
- MSCA
- My Service Canada Account
- NAICS
- North American Industry Classification System
- NESI
- National Essential Skills Initiative
- NIS
- National Investigative Services
- NOM
- National Operating Model
- OAS
- Old Age Security
- PAAR
- Payment Accuracy Review
- PPE
- Premium-paid eligible individuals
- PRAR
- Processing Accuracy Review
- PRP
- Premium Reduction Program
- PTs
- Provinces and Territories
- QPIP
- Quebec Parental Insurance Plan
- R&I
- Research and Innovation
- ROE
- Record of Employment
- RPA
- Robotics Process Automation
- SAT
- Secure Automated Transfer
- SCC
- Service Canada Centre
- SDP
- Service Delivery Partner
- SEPH
- Survey of Employment, Payrolls and Hours
- SIN
- Social Insurance Number
- SIR
- Social Insurance Registry
- SST
- Social Security Tribunal
- STDP
- Short-term disability plan
- SUB
- Supplemental Unemployment Benefit
- TRF
- Targeting, Referral and Feedback
- TTY
- Teletypewriter
- UV
- Unemployment-to-vacancy
- VBW
- Variable Best Weeks
- VER
- Variable Entrance Requirement
- VRI
- Video Remote Interpretation
- WCAG
- Web Content Accessibility Guidelines
- WWC
- Working While on Claim
2.0 Introduction
This chapter of the Employment Insurance Monitoring and Assessment Report assesses income support provided by Employment Insurance (EI) Part I benefits: regular benefits, fishing benefits, Work-Sharing benefits and special benefits. This chapter includes several key indicators, such as the number of new claims established, total amount paid, level of benefits, maximum duration and actual duration of benefits as well as the exhaustion of benefits. Throughout the chapter, key EI program provisions and recent changes made to the EI program are discussed. Indicators related to level of claims and level of benefits are presented for claims established within the fiscal year for which at least 1 dollar in EI benefits was paid. Indicators such as maximum and actual duration are based on claims completed during the fiscal year for which at least 1 dollar was paid in EI benefits. Indicators related to the amount of EI benefits paid are presented on a cash basis, which means the expenses are accounted for during the fiscal year in which they are paid. More information on the definitions of the indicators presented throughout this chapter can be found in annex 2.1 of this report.
This chapter covers the period beginning April 1, 2020, and ending March 31, 2021 (FY2021). This period was characterised by major economic and labour market disruptions due to the COVID-19 pandemic. In response, the Government implemented the Canada Emergency Response Benefit (CERB) between March 15, 2020 and October 3, 2020Footnote 1 to provide income support to eligible employed and self-employed Canadians who stopped working and lost their income due to COVID-19. As a result, no new claims for EI regular or sickness benefits were establishedFootnote 2 during the weeks the CERB was in effect. However, claims for all other types of EI benefits could be established.
To continue supporting eligible workers, the Government transitioned from the CERB to a simplified EI program. Recognizing that many workers had lost their jobs or worked reduced hours, a set of temporary measures were introduced to facilitate access to EI benefits for all new claims established between September 27, 2020 and September 25, 2021. Table 1 lists the temporary measures and compares them to their associated original EI rules. The main temporary measures were:
- a 1-time hours credit to allow workers to qualify for EI benefits with 120 hours of insurable employment, applicable to the first EI claim
- a minimum benefit rate of $500 per week, or $300 per week for extended parental benefits
- a maximum of 50 weeks of regular benefitsFootnote 3, and
- a minimum unemployment rate of 13.1% applying to all EI economic regions across Canada
New EI claims established between September 27, 2020 and March 31, 2021 were subject to different rules and were provided a different level of income support than EI claims established prior to September 27, 2020 under the original EI rules. Consequently, some of the key indicators in this chapter are presented for 2 distinct periods:
- from April 1, 2020 to September 26, 2020, referred to as “the first half of FY2021”, during which the original EI rules applied and no new claims for EI regular or sickness benefits were established, and
- from September 27, 2020 to March 31, 2021, referred to as “the second half of FY2021”, during which new EI claims were established under the EI temporary measures
The results on amount of EI benefits paid, however, cover the full period of FY2021 (from April 1, 2020 to March 31, 2021). Year-over-year comparisons are not reported, unlike reports from previous years.
On September 27, 2020, the Government also implemented 3 temporary recovery benefits to provide income support to Canadian workers who were no longer employed or self-employed for reasons related to COVID-19. Those benefits were: the Canada Recovery Benefit (CRB), the Canada Recovery Sickness Benefit (CRSB), and the Canada Recovery Caregiving Benefit (CRCB). These 3 recovery benefits applied to specific circumstances and could not be claimed at the same time as EI benefits. That said, the income support provided to Canadian workers through any of the CERB, CRB, CRSB and CRCB is not included in this chapter.
This chapter relies on several sources of information to provide a comprehensive analysis of the EI program. EI administrative data, generally based on a 10% sample, underpins the majority of the analysis. Some sections of this chapter also make use of tax data provided by the Canada Revenue Agency related to T4 tax slips with employment income or T1 returns. Statistics Canada’s Labour Force Survey, as well as Records of Employment, provide the basis for analysis of coverage, eligibility and access to EI benefits for unemployed people. Throughout the chapter, results by sociodemographic characteristics are discussed and compared to previous years.
Annex 2 of the report presents additional statistical information on benefits analyzed in this chapter and annex 7 provides an overview of major changes to the EI program between April 1996 and December 2021.
| Original EI rules for claims established prior to September 27, 2020 | EI temporary measures in effect for claims established between September 27, 2020 and September 25, 2021, or otherwise indicated |
|---|---|
| The EI program uses monthly regional unemployment rates that are a moving average of seasonally adjusted monthly rates of unemployment produced by Statistics Canada. | Same rule but a minimum unemployment rate of 13.1% was applied to all regions across Canada,1 resulting in:
|
| A minimum of 420 to 700 hours of insurable employment to qualify for EI regular benefits based on the regional unemployment rate. A minimum of 600 hours of insurable employment to qualify for EI special benefits. | 120 hours of insurable employment to qualify for regular and special benefits due to the 1-time credit of 300 hours for claims for regular benefits and 480 hours for claims for special benefits.2 |
| The benefit rate is calculated by averaging the 14 to 22 highest weeks of insurable earnings depending on the regional unemployment rate. | The benefit rate was calculated by averaging the 14 highest weeks of insurable earnings. A minimum benefit rate of $500 per week, or $300 per week for extended parental benefits, was applied if the claimant’s calculated rate was lower. |
| Between 14 and 45 weeks of regular benefits depending on the regional unemployment rate and the number of hours of insurable employment. | A maximum of 50 weeks of regular benefits.3 |
| A one-week waiting period must be served before a claimant can begin to receive EI benefits. | The one-week waiting period was waived for all EI claims established between January 31, 2021 and September 25, 2021.4 |
| The qualifying period is the shorter of the 52-week period immediately before the start date of an EI claim, or the period since the start of a previous claim. | The qualifying period was extended by 28 weeks if a claimant received CERB.5 |
| All reasons for separation from any employment within the qualifying period are considered in determining EI eligibility. | Only contentious reasons for separation in the 12 weeks before the Sunday where the claimant lost their job were assessed. |
| Separation monies are allocated against EI benefits. | Separation monies were not allocated against EI benefits. |
| Sickness benefit claimants must provide a medical certificate signed by a doctor or approved medical practitioner. | The need to submit a medical certificate for sickness benefits was waived between September 27, 2020 and September 25, 2021. |
| Work-Sharing agreements provide 6 to 26 weeks of benefits, with the possibility of an extension by 12 weeks if warranted. | Between March 15, 2020 and September 25, 2022, Work-Sharing agreements provided up to 76 weeks of benefits. |
| Between $2,500 and $4,200 insurable earnings threshold for fishers to qualify for fishing benefits depending on the regional unemployment rate. $3,760 insurable earnings threshold for fishers to qualify for special benefits. | $2,500 insurable earnings threshold for fishers to qualify for fishing or special benefits. The claim could be based on their earnings in their current qualifying period, or the earnings used to establish a fishing claim of the same type (summer or winter) from 1 of the 2 previous years, whichever amount was the highest. |
| The EI fishing benefit rate is calculated by using the earnings for the current claim. | The EI fishing benefit rate was calculated using either the earnings in the current qualifying period, or the earnings used to establish a fishing claim of the same type (summer or winter) from 1 of the 2 previous years, whichever was the highest. |
| In 2020, $7,279 earnings threshold (2019 earnings) for self-employed workers who opted-in EI to qualify for special benefits. | Between January 3, 2021 and September 25, 2021, $5,000 earnings threshold (2020 earnings) for self-employed workers who opted-in EI to qualify for special benefits. |
| The annual premium rate is set based on a 7-year break-even mechanism. | The EI premium rate was frozen at the 2020 premium rate for 2 years. |
- 1 Individuals in EI regions with an unemployment rate lower than 13.1% had their EI parameters calculated on the basis of the 13.1% rate, while those in regions with a higher rate had their parameters calculated using the actual higher rate. This temporary measure was supposed to end on September 11, 2021. The measure was extended to September 25, 2021 in Budget 2021.
- 2 The hours credit measure was retroactive to March 15, 2020 for CERB claimants who were looking to switch to EI special benefits (except sickness benefits) or Work-Sharing benefits during the first half of FY2021, but couldn’t because they did not have enough hours.
- 3 When the temporary measures started on September 27, 2020, claimants were entitled to receive between 26 and 45 weeks of regular benefits. This was increased to 50 weeks in March 2021 and was applied retroactively to all regular claims established since September 27, 2020.
- 4 The waiting period was also waived for all EI claims established between September 27, 2020 and October 25, 2020; and for new EI sickness claims established between September 27, 2020 and September 25, 2021.
- 5 The qualifying period was extended by 16 weeks for EI claims established before July 5, 2020 and by 24 weeks for claims established on or after July 5, 2020 for claimants who received CERB and needed to transition to special benefits (except sickness benefits) or Work-Sharing benefits during the first half of FY2021.
2.1 Employment Insurance benefits overview
In this section
- 2.1.1 Employment Insurance claims and amount paid
- 2.1.2 Combined Employment Insurance claims
- 2.1.3 Benefits-to-Contributions ratios
The Employment Insurance (EI) program provides temporary income support to partially replace employment income for eligible unemployed contributors to the program while they search for work or upgrade their skills, and for those who are absent from work due to specific life circumstances (such as sickness, pregnancy, providing care to a newborn or newly adopted child, providing care or support to a critically ill or injured person or someone needing end-of-life care).
In this chapter, EI benefits refer to regular benefits, special benefits, fishing benefits and Work-Sharing benefits (consult table 2). Special benefits include maternity benefits, parental benefits, sickness benefits, family caregiver benefits for adults or children, and compassionate care benefits. Subsection 2.1.1 covers the number of new claims established in the fiscal year and total amount paid over the fiscal year, and provides information on benefit levels of claims. Subsection 2.1.2 examines combined (or mixed) benefit claims. Subsection 2.1.3 provides an analysis of the usage of EI benefits relative to EI premiums contributed.
| Benefit type | Circumstance | Insurable employment entrance requirement (first half of FY2021) | Insurable employment entrance requirement (second half of FY20211) | Maximum entitlement in FY2021, or otherwise indicated |
|---|---|---|---|---|
| Regular | Unemployed with a valid reason for separation and searching for suitable employment or retraining in certain cases | Not available due to the CERB | 120 hours due to the one-time credit of 300 hours | Claims established in the second half of FY2021: 50 weeks |
| Fishing | Self-employed fishers without available work | Value of a catch between $2,500 and $4,200 depending on the Variable Entrance Requirement | Value of a catch of $2,500 that can be based on the current qualifying period, or the earnings used to establish a fishing claim of the same type (summer or winter) from 1 of the 2 previous years, whichever is highest. | 26 weeks per season (summer or winter) |
| Work-Sharing | Firm avoiding layoffs during a slowdown in business activity for reasons beyond the firm’s control with a recovery plan and a Work-Sharing agreement in place | 420 to 700 hours depending on the Variable Entrance Requirement and must be a year-round employee | 120 hours due to the one-time credit of 300 hours | 76 weeks2 |
| Special3 - Maternity | Unavailable to work because of pregnancy or has recently given birth | 600 hours | 120 hours due to the one-time credit of 480 hours | 15 weeks |
| Special3 - Parental | Caring for a newborn or a newly adopted child | 600 hours | 120 hours due to the one-time credit of 480 hours | Standard parental: 40 weeks available to share, with no parent able to receive more than 35 weeks Extended parental (at a lower replacement rate): 69 weeks available to share, with no parent able to receive more than 61 weeks |
| Special3 - Sickness | Unavailable to work because of illness, injury or quarantine | Not available due to the CERB | 120 hours due to the one-time credit of 480 hours | 15 weeks |
| Special3 - Family caregiver for children | Providing care or support to a critically ill or injured child under the age of 18 | 600 hours | 120 hours due to the one-time credit of 480 hours | 35 weeks4 |
| Special3 - Family caregiver for adults | Providing care or support to a critically ill or injured person 18 years or older | 600 hours | 120 hours due to the one-time credit of 480 hours | 15 weeks4 |
| Special3 - Compassionate care | Providing care to a person of any age who requires end-of-life care | 600 hours | 120 hours due to the one-time credit of 480 hours | 26 weeks4 |
- 1 The hours credit measure was applicable to the first EI claim established between September 27, 2020 and September 25, 2021. It could be retroactive to March 15, 2020 for CERB claimants who were looking to switch to EI special benefits (except sickness benefits) or Work-Sharing benefits during the first half of FY2021, but couldn’t because they did not have enough hours.
- 2 Temporary Work-Sharing special measures between March 15, 2020 and September 24, 2022.
- 3 Self-employed workers (other than fishers) who have opted into EI special benefits must meet an insurable earnings threshold for the calendar year preceding the claim. The threshold was $7,279 for claims established in 2020 and temporarily set to $5,000 for claims established in 2021 (until September 25, 2021).
- 4 Benefits can be shared between eligible claimants (i.e. parents or family members).
2.1.1 Employment Insurance claims and amount paid
There were 3.0 million new EI claims established in FY2021 (consult table 3). This is substantially higher than usual as, on average, 1.8 million EI claims were established annually over the last 10 fiscal years. The larger number of claims in FY2021 is attributable to the economic and labour market disruptions due to the COVID-19 pandemic and to the related EI temporary measures introduced during the reporting period (consult section 2.0). Total EI benefit payments were also significantly higher, reaching $32.1 billion during FY2021.
| Types of Employment Insurance benefit | New claims established FY1920 | New claims established first half of FY2021 | New claims established second half of FY2021 | New claims established total FY2021 | Amount paid ($ millions) FY1920 | Amount paid ($ millions) FY2021 |
|---|---|---|---|---|---|---|
| Regular | 1,367,080 | n/a | 2,472,860 | 2,472,860 | $11,064.4 | $24,930.1 |
| Fishing | 30,385 | 10,923 | 17,365 | 28,288 | $303.1 | $323.6 |
| Work-Sharing | 11,046 | 65,608 | 17,383 | 82,991 | $16.5 | $183.5 |
| Special* | 619,270 | 112,860 | 558,400 | 671,260 | $6,150.1 | $6,655.7 |
| Maternity | 167,690 | 74,330 | 92,580 | 166,910 | $1,208.1 | $1,324.7 |
| Parental | 212,750 | 97,960 | 115,140 | 213,100 | $2,921.7 | $3,177.8 |
| Sickness | 421,140 | n/a | 450,350 | 450,350 | $1,888.8 | $1,999.3 |
| Family caregiver for children | 5,403 | 2,272 | 3,250 | 5,522 | $36.3 | $41.2 |
| Family caregiver for adults | 11,592 | 4,190 | 8,018 | 12,208 | $55.7 | $69.3 |
| Compassionate care | 7,581 | 2,518 | 4,284 | 6,802 | $39.6 | $43.4 |
| Canada | 1,874,480 | 185,630 | 2,863,060 | 3,048,690 | $17,502.7 | $32,075.0 |
- Notes: Totals may not add up due to rounding. Includes all claims for which at least $1 of Employment Insurance benefits was paid. The sum of claims by benefit type does not add up as multiple benefit types can be combined in 1 single claim.
- * Starting in FY2021, data on family caregiver benefits are included in the total number of special benefit claims, which could affect comparisons with previous years. They were previously excluded due to the incompatibility of administrative data sources.
- Source: Employment and Social Development Canada, Employment Insurance (EI) administrative data. Data are based on a sample of 10% of the EI administrative data, except for family caregiver, Work-Sharing and compassionate care benefits as well as claims for fishing benefits (100%).
According to Statistics Canada,Footnote 4 there were 588,600 beneficiaries receiving EI benefits on average each month during the first half of FY2021. This number was higher than the amount of new EI claims established during that period (consult table 3). This is because some claims that were established in the previous fiscal year still received EI benefits in FY2021. The number increased to 1.8 million beneficiaries on average each month over the second half of FY2021 when regular and sickness benefits resumed.
New Employment Insurance claims established
The high number of new EI claims observed during the reporting period is largely due to claims for regular benefits established in the second half of FY2021. The share of regular claims among all new claims established increased from 72.9% in FY1920 to 81.1% in FY2021. Conversely, the share of claims for sickness benefits ─ which are the second most common benefit type claimed ─ decreased from 22.5% to 14.8% during the same period.
All provinces and territories experienced a higher number of new EI claims in FY2021 compared to the previous fiscal year (consult table 4). The distribution of new claims among regions also remained fairly stable, except for Ontario. The share of claims established in this province increased by 3.8 percentage points, from 31.2% in FY1920 to 35.0% in FY2021.
| Category | New claims established FY1920 | New claims established first half of FY2021 | New claims established second half of FY2021 | New claims established total FY2021 | Amount paid ($ millions) FY1920 | Amount paid ($ millions) FY2021 |
|---|---|---|---|---|---|---|
| Newfoundland and Labrador | 81,790 | 6,450 | 93,660 | 100,110 | $992.5 | $1,274.8 |
| Prince Edward Island | 21,770 | 1,700 | 23,490 | 25,190 | $226.0 | $293.8 |
| Nova Scotia | 82,540 | 7,530 | 95,530 | 103,060 | $851.3 | $1,187.6 |
| New Brunswick | 89,380 | 4,800 | 105,870 | 110,670 | $925.1 | $1,248.4 |
| Quebec | 475,220 | 17,760 | 731,550 | 749,310 | $3,210.3 | $6,547.8 |
| Ontario | 585,670 | 78,180 | 989,710 | 1,067,890 | $5,680.5 | $11,347.0 |
| Manitoba | 64,780 | 10,700 | 91,410 | 102,110 | $631.2 | $1,082.2 |
| Saskatchewan | 57,280 | 6,160 | 71,340 | 77,500 | $639.3 | $952.5 |
| Alberta | 200,450 | 25,900 | 338,520 | 364,420 | $2,266.4 | $4,304.4 |
| British Columbia | 210,060 | 25,620 | 314,770 | 340,390 | $2,004.3 | $3,734.2 |
| Yukon | 2,300 | 260 | 2,950 | 3,210 | $26.0 | $39.5 |
| Northwest Territories | 2,030 | 270 | 2,590 | 2,860 | $29.7 | $37.0 |
| Nunavut | 1,210 | 300 | 1,670 | 1,970 | $20.0 | $25.7 |
| Male | 1,018,710 | 78,350 | 1,527,190 | 1,605,540 | $8,833.7 | $16,252.2 |
| Female | 855,770 | 107,280 | 1,335,870 | 1,443,150 | $8,669.0 | $15,822.8 |
| 24 years old and under | 171,760 | 9,280 | 431,680 | 440,960 | $1,302.6 | $3,601.1 |
| 25 to 44 years old | 914,700 | 129,980 | 1,252,340 | 1,382,320 | $9,554.9 | $15,819.2 |
| 45 to 54 years old | 352,040 | 23,750 | 500,800 | 524,550 | $2,915.8 | $5,272.4 |
| 55 years old and over | 435,980 | 22,620 | 678,240 | 700,860 | $3,729.3 | $7,382.4 |
| Canada | 1,874,480 | 185,630 | 2,863,060 | 3,048,690 | $17,502.7 | $32,075.0 |
- Notes: Totals may not add up to the total due to rounding. Includes claims for which at least $1 of EI benefits was paid.
- Source: Employment and Social Development Canada, Employment Insurance (EI) administrative data. Data are based on a sample of 10% of the EI administrative data.
Men continued to account for just over half (52.7%) of all new claims in FY2021. However, during the first half of the reporting period, their share of all claims established drop to 42.2% because no new claims for regular or sickness benefits could be established at that time, and men are less likely to claim parental benefits and cannot receive maternity benefits.
All age groups registered a higher number of new EI claims in FY2021 compared to FY1920. The share of claims established by claimants 25 to 54 years old declined, while it remained unchanged for claimants 55 years old and over. The number of new EI claims more than doubled for claimants 24 years old and under in FY2021 compared to the previous fiscal year. Younger claimants established only 9.2% of the total number of claims in FY1920, whereas they established 14.5% of all claims in FY2021. This can be attributable, in part, to the EI temporary measure allowing claimants to qualify for benefits with as little as 120 hours of insurable employment (consult section 2.0).
Early impact of COVID-19 on Employment Insurance benefits and the Canadian labour market
At the beginning of 2020, the COVID-19 pandemic and the ensuing health measures including provincial lockdowns led to an unprecedented number of Canadian workers that either suffered a job loss or experienced a reduction in their number of hours worked. The Government introduced the Canadian Emergency Response Benefit (CERB) to provide support to workers who had stopped working due to the pandemic.
A recent departmental study* analyzed different sources of EI administrative data** to examine patterns of job separations, EI applications and EI claims established in the weeks leading up to the coming into force of the CERB on March 15, 2020. The study compared the data in the weeks before CERB to the same period in 2019 to examine the early impact of COVID-19 on the EI program. This comparison using EI administrative data yielded a wealth of information about changes in the labour market.
A significant increase in job separations was observed in the 5-week period before CERB when compared to the same period in 2019 (+14.5% or about 100,000 more job separations). The majority of this increase was for job separations due to shortage of work (layoff), and illness or injury. Inversely, job separations related to quit or dismissal decreased.
The study found that individuals who were laid-off during this 5-week period were significantly different compared to those laid-off during the same period in 2019. In general, they worked fewer weekly hours and had lower employment income. When examining the factors associated with the probability of having a job separation in 2020 compared to 2019 (using a regression analysis), the study found that the industry sector of previous work was a more important predictor of having a job separation than employment income. Workers in the Art, entertainment and recreation sector, and those from the Accommodation and food services sector experienced the highest increase in the probability of having a job separation. In addition, the probability of having a job separation in 2020 compared to 2019 was higher in British Columbia and Alberta. This seemed to be related to job separations in the Educational services sector, probably due to the timing of winter school breaks in these regions.
In terms of EI applications, data showed a significant increase in volume but only in the week before the coming into force of CERB.
Analysis on the number of EI claims established for regular or sickness benefits showed an increase in the 6-week period before CERB when compared to the same period in 2019. However, this increase was lower than the one in job separations, which might indicate that a portion of laid-off workers were not eligible for EI benefits. In addition, while the study found some differences in the characteristics of laid-off workers between 2019 and 2020 (such as, lower employment income), there was no such difference for EI claimants (such as, similar distribution of employment income between 2019 and 2020).
- * ESDC, Early impact of COVID-19 on Employment Insurance benefits and the Canadian Labour Market (Ottawa: ESDC, Evaluation Directorate, 2022).
- ** Datafile on Records of Employment (ROEs) for job separations, Status Vector file for EI claims established, and Appliweb for EI applications.
Total amount paid in Employment Insurance benefits
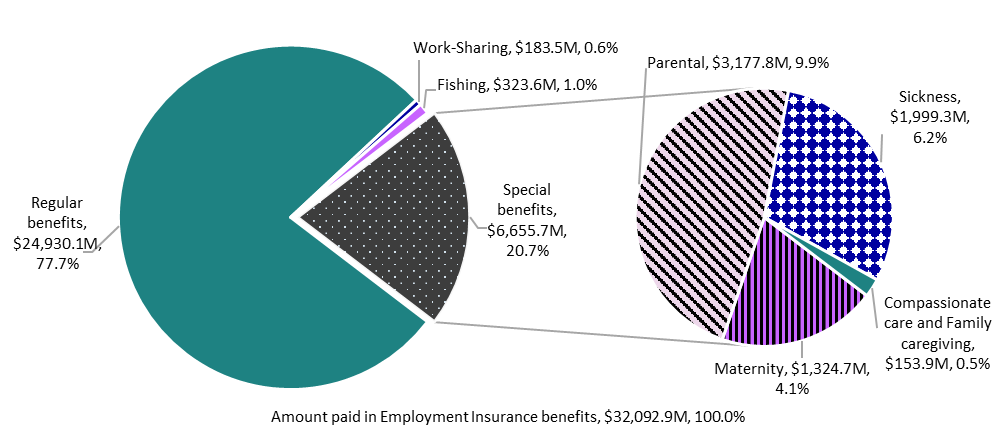
The amount paid for all types of EI benefits combined reached $32.1 billion in FY2021 compared to $17.5 billion in FY1920. This increase was mainly attributable to the high number of EI regular claims established in the second half of FY2021 and to the EI temporary measures generally providing a higher weekly benefit rate to claimants relative to the original EI rules (consult section 2.0 and the box on the initial impacts of temporary EI measures in Canadian communities during the pandemic). The share of EI benefits paid by benefit type also changed compared to the previous reporting period. The shares of regular and Work-Sharing benefits increased (+14.6 and +0.5 percentage points, respectively), whereas the shares of special benefits and fishing benefits decreased in FY2021 (‑14.3 and ‑0.7 percentage points, respectively).
Text description of Chart 1
| Benefit type | $ million | % share |
|---|---|---|
| Regular benefits | $24,930.1 | 77.7% |
| Work-Sharing benefits | $183.5 | 0.6% |
| Fishing benefits | $323.6 | 1.0% |
| Special benefits | $6,655.7 | 20.7% |
| Parental benefits | $3,177.8 | 9.9% |
| Sickness benefits | $1,999.3 | 6.2% |
| Maternity benefits | $1,324.7 | 4.1% |
| Compassionate care and Family caregiving benefits | $153.9 | 0.5% |
| Amount paid in Employment Insurance benefits | $32,092.9 | 100.0% |
- * The total amount paid reported in chart 1 does not correspond to the total reported in Tables 3 and 4 because data on compassionate care benefits and family caregiver benefits can only be reported on a 100% sampling basis on an aggregate level.
- Source: Employment and Social Development Canada, Employment Insurance (EI) administrative data. Data are based on a sample of 10% of the EI administrative data, except for Work-Sharing, family caregiver and compassionate care benefits (100%).
Claimants in Ontario and Quebec received higher shares of the amount paid in EI benefits in FY2021 compared to the previous fiscal year (+2.9 and +2.1 percentage points, respectively). As observed with the number of new claims, claimants 24 years old and under also saw their share of EI benefits paid increase by 3.8 percentage points, from 7.4% in FY1920 to 11.2% in FY2021.
Initial impacts of temporary Employment Insurance measures in Canadian communities during the pandemic
As presented in section 2.0, a set of EI temporary measures were introduced to facilitate access to EI benefits for all new claims established between September 27, 2020 and September 25, 2021. A recent departmental study* examined the initial impacts of the additional income support provided by the main temporary measures compared to what would have been provided under the original EI rules. The study covered the period from September 27, 2020 to April 3, 2021, which is virtually identical to the second half of FY2021. Since the EI temporary measures were in effect until September 25, 2021, the study did not cover the entire period of the measures.
Some temporary measures allowed claimants to qualify for benefits with only 120 hours of insurable employment. Among claims established during the study period, 13.2% of regular claims (about 326,000) and 7.6% of special benefit claims (about 37,000) benefitted from these measures. Those claimants would not have been able to qualify for EI benefits if the original eligibility requirements had been in place.
As part of the temporary measures, claimants could receive an increased benefit rate in 1 of 2 ways; either from a minimum $500 weekly benefit rate or, because the benefit rate was calculated based on their best 14 weeks of earnings. Among claims established during the study period, 65.6% of regular claims and 57.2% of special benefit claims had a higher weekly benefit rate than what they would have been entitled to without the temporary measures.
Among claimants who benefitted from the minimum weekly benefit rate of $500,** they received, on average, an additional $199 per week for regular claims and $167 per week for special benefit claims.*** Among claims with a weekly benefit rate above $500 and that benefitted from a higher benefit rate, claimants received, on average, an additional $56 per week for regular claims and $34 per week for special benefit claims.
Up to 50 weeks of regular benefits were available to eligible claimants under the temporary measures. All regular claims could potentially benefit from additional weeks (19 more weeks on average) compared to their original maximum entitlement. However, only a small proportion of claims (16.5%) had benefitted from additional weeks at the end of the study period. This is because most of the claimants had not exhausted their original entitlement at that time, and consequently, they had not started using the additional weeks of regular benefits offered to them.
The study also estimated the additional cost generated by the main EI temporary measures between September 27, 2020 and April 3, 2021. The additional cost represents the amount of EI benefits that would not have been paid if the temporary measures had not been implemented. Overall, around $6.1 billion was paid in additional income support through the EI temporary measures over the study period. The largest share is associated with the minimum $500 weekly benefit rate ($4.6 billion over the study period).
- * ESDC, Initial impacts of temporary Employment Insurance measures in Canadian communities during the pandemic (Ottawa: ESDC, Employment Insurance Policy Directorate, 2022).
- ** Minimum $300 weekly benefit rate for extended parental benefits.
- *** The additional weekly benefit rate for claims of extended parental benefits is calculated using the 55% replacement rate in order to reflect the cost on the same scale than other EI benefit types.
Calculation of the benefit rate
The weekly benefit rate to which EI claimants are entitled is typically subject to the Variable Best Weeks (VBW) provision. Under this provision, the weekly benefit rate is calculated based on an EI claimant’s highest (best) weeks of insurable earnings during their qualifying period. The number of weeks used to calculate the weekly benefit rate ranges from 14 to 22, depending on the monthly regional unemployment rate.
| Unemployment rate* | Number of weeks |
|---|---|
| 6.0% and under | 22 |
| 6.1% to 7.0% | 21 |
| 7.1% to 8.0% | 20 |
| 8.1% to 9.0% | 19 |
| 9.1% to 10.0% | 18 |
| 10.1% to 11.0% | 17 |
| 11.1% to 12.0% | 16 |
| 12.1% to 13.0% | 15 |
| More than 13.0% | 14 |
- *The monthly regional unemployment rates used for the EI program are a moving average of seasonally adjusted rates of unemployment produced by Statistics Canada, as per section 17 of the Employment Insurance Regulations.
The weekly benefit rate is paid as 55%Footnote 5 of the average weekly insurable earnings, up to the maximum weekly benefit rate.Footnote 6 Claimants with children (under the age of 18 years) and low annual family income may be eligible for the Family Supplement provision.Footnote 7
However, the COVID-19 pandemic may have had a negative impact on a worker’s weekly earnings either because they lost their job or saw their hours of work reduced. Therefore, as part of the EI temporary measures (consult section 2.0), the Government introduced a minimum benefit rate for new EI claims established between September 27, 2020 and September 25, 2021. Claimants could receive a minimum benefit rate of $500 per week, or $300 per week for extended parental benefits, less applicable taxes, up to the maximum weekly benefit rate.
In addition, the Government applied a minimum unemployment rate of 13.1% to all EI economic regions across Canada until September 25, 2021. As a result, the number of best weeks of earnings used in the calculation of the weekly benefit rate was 14 for all claims established between September 27, 2020 and September 25, 2021. If a claimant’s benefit rate based on this calculation was higher than the minimum $500, their benefit rate was set to that amount up to the maximum weekly benefit rate.
Consequently, the weekly benefit rate calculation was different depending on when a claim was established during FY2021. New EI claims established during the first half of FY2021 were subject to the Variable Best Weeks provision, whereas new EI claims established during the second half of FY2021 benefitted from the temporary measures.
Results on average weekly benefit rates by benefit type and by FY2021’s first or second half are presented throughout the chapter in their respective section.
Family Supplement provision
The Family Supplement provision, which targets low-income families, provides additional benefits to EI claimants with children under the age of 18 who have an annual family net income equal to or less than $25,921. The claimant must also receive the Canada Child Benefit. Under the Family Supplement provision, which is available to claims in all benefit types, the weekly amount of family supplement can increase a claimant’s benefit rate from 55% to a maximum of 80% of his or her weekly insurable earnings, up to the maximum weekly benefit rate. The supplement provided to eligible claimants is determined by the claimant’s family net income, the number of children in the claimant’s family, and the age of the claimant’s children.Footnote 8
In FY2021, low-income families received a total of $108.6 million in additional benefits through the Family Supplement provision. A total of 95,070 claims received the family supplement in FY2021, which represents 3.1% of all claims established during the reporting period, compared to 3.5% in FY1920. The proportion of EI claims receiving the family supplement has now decreased for the past 20 years, from a high of 10.7% of all claims in FY0001. This decrease can be explained by the fact that the eligibility threshold has not been indexed over time, as well as by changes in family composition and wage growth. Women (83.2%) and claimants aged 25 to 44 (72.8%) continue to be the main demographic groups benefitting from the Family Supplement provision. The average weekly family supplement was $39 in FY2021 which is slightly lower than the previous year ($45) mainly due to the EI temporary measures generally providing a higher weekly benefit rate to claimants relative to the original EI rules (consult annex 2.22 for more statistics on the Family Supplement provision).
Supplemental Unemployment Benefit plans
While the temporary support from EI benefits provide an income floor for claimants, employers can use a Supplemental Unemployment Benefit (SUB) plan to increase their employees’ weekly earnings when they are unemployed due to a temporary stoppage of work, training, illness, injury or quarantine.Footnote 9 These SUB plans need to be registered with Service Canada so that supplemental payments (or top-ups) are not considered as earnings and are not deducted from EI benefits. The combined weekly payments from the plan and EI weekly benefits cannot exceed 95% of the employee’s normal weekly earnings.
Employers can also provide supplemental payments to maternity, parental (including adoption), compassionate care and family caregiver benefits.Footnote 10 These plans do not have to be registered with Service Canada. The top-up amounts are not deducted from EI benefits if the combined weekly payments do not exceed 100% of the employee’s normal weekly earnings and the plan does not use the supplemental payments to reduce other accumulated employment benefits (such as banked sick leave, vacation leave credits or severance pay).
Results on average weekly benefit rates presented in this chapter do not include any supplemental payments made to EI claimants.
Study on Supplemental Unemployment Benefit plans
A departmental study* examined the characteristics of employers and employees with SUB plans**, and their utilization pattern of the EI program. From 2008 to 2017, an annual average of over 6,800 firms (0.5% of all firms in Canada) had active SUB plans, increasing over time. Around 63% of these plans were for illness, injury or quarantine, while plans for temporary stoppage of work, training and plans consisting of a combination of top-up plans accounted for around 10%, 7% and 20% respectively. Firms offering SUB plans were generally larger in size and more likely to be associated with the services industries.
Overall, EI claims that receive top-up payments through SUB plans constituted between 40,000 and 60,000 claims per year (around 3% of all EI claims). Most of these claims were for EI regular benefits, followed by claims for EI sickness benefits.
When firms offering SUB plans are compared with firms having similar characteristics but that do not offer SUB plans, results showed that the average number of EI claims and number of claims per worker were higher for firms offering SUB plans. However, EI claimants from firms offering SUB plans had shorter duration of EI benefits and lower EI exhaustion rates.
One of the main rationales behind a firm offering a SUB plan to their employees is to maintain the employee-employer relationship and facilitate employee retention. When comparing regular benefit claimants who previously worked in firms offering SUB plans, those who received SUB top-ups were more likely to return to the same firm after a claim compare to those who did not receive top-ups.***
- * ESDC, Supplemental Unemployment Benefit Plans (Ottawa: ESDC, Evaluation Directorate, 2021).
- ** Excluding SUB plans for maternity, parental (including adoption), compassionate care, and family caregiver benefits.
- *** The study found that among all EI claimants within SUB firms, only 13% received a top-up payment over the period examined. This suggests that not all employees in a given firm are entitled to SUB payments.
2.1.2 Combined Employment Insurance claims
Under certain provisions of the EI program, a claimant may receive multiple types of benefits as part of a single claim, assuming that the claimant meets each benefit type’s eligibility requirements.Footnote 11 A “pure” claim is one in which an EI claimant receives a single benefit type, while a “combined” claim is one in which the claimant receives more than 1 benefit type. The combination of EI benefit types in a single claim is examined using claims completed in FY2021, regardless of the year in which the claim was established. Pure claims represented 79.8% of all completed claims in FY2021 (consult table 5).
| Benefit type | Total claims level ('000s) | Pure claims level ('000s) | Pure claims share (%) | Combined claims level ('000s) | Combined claims share (%) | Benefit type most often combined with (share of combined claims) |
|---|---|---|---|---|---|---|
| Regular | 1,470.7 | 1,248.2 | 84.9% | 222.5 | 15.1% | Sickness (89.9%) |
| Fishing | 30.3 | 26.2 | 86.5% | 4.1 | 13.5% | Sickness (90.0%) |
| Work-Sharing | 49.7 | 41.1 | 82.8% | 8.5 | 17.2% | Regular (75.5%) |
| Maternity | 172.0 | 2.2 | 1.3% | 169.8 | 98.7% | Parental (98.7%) |
| Parental* | 225.1 | 47.6 | 21.2% | 177.5 | 78.8% | Maternity (94.4%) |
| Sickness | 414.9 | 180.9 | 43.6% | 234.0 | 56.4% | Regular (85.5%) |
| Compassionate care | 7.4 | 4.3 | 58.7% | 3.0 | 41.3% | Sickness (59.2%) |
| Family caregiver for children** | 4.1 | 3.1 | 74.3% | 1.1 | 25.7% | Regular (56.6%) |
| Family caregiver for adults** | 11.4 | 7.4 | 64.9% | 4.0 | 35.1% | Regular (74.1%) |
| All claims*** | 1,957.1 | 1,561.0 | 79.8% | 396.1 | 20.2% | n/a |
- Note: Data may not add up to the total due to rounding. Includes completed claims for which at least $1 of EI benefits was paid. The sum of claims by benefit type for the “Total claims” and “Combined claims” columns does not add up to the total because more than 1 benefit type can be part of the same claim. This does not apply to pure claims that include only 1 benefit type.
- *Parental benefits include benefits for biological parents and adoptive parents.
- ** Starting in FY2021, data on family caregiver benefits are included in the analysis on combined claims. They were previously excluded due to the incompatibility of administrative data sources.
- *** The total number of claims is based on claims completed during the fiscal year. This explains why the total number of claims here is different from the total numbers of claims in Tables 3 and 4 which are based on established claims.
- Source: Employment and Social Development Canada, Employment Insurance (EI) administrative data. Data are based on a 10% sample of EI administrative data.
Women were more likely to claim more than 1 type of EI benefit (31.6%) than men (11.7%), mostly due to their high probability of claiming both maternity and parental benefits.
In fact, maternity benefits were the benefits most often combined with other types of benefits, usually parental benefits. However, a significant proportion also claimed sickness benefits with maternity benefits (15.3%), resulting in the claimant starting her leave before becoming eligible for maternity benefits (available 12 weeks prior to the child’s expected date of birth). The combination of sickness, maternity and parental benefits was the most common among claims with 3 or more benefit types (24,970 claims representing 14.5% of completed claims for maternity benefits in FY2021).
Claims for parental benefits were combined at a slightly lower rate than maternity, as only 16.5% of men who claimed parental also received another benefit payment. Of those male claimants, 86.7% received regular benefits and 16.9% claimed sickness benefits. Among women, virtually all (99.4%) who combined parental benefits with other types of benefits combined them with maternity benefits.
Sickness benefits were the third most likely to be combined with other benefit types, mostly with regular benefits. Men combined their sickness benefits predominantly with regular benefits (95.2%), while sickness claims from women were most often combined with regular (75.7%), maternity (22.2%) and parental benefits (21.4%). Sickness also represented the greatest share of combined regular claims.
When combined, compassionate care benefits are shared with sickness benefits (59.2%) or regular benefits (58.9%). Men tended to combine compassionate care benefits with regular benefits (68.4%) more often than women (54.5%). Women were most likely to combine compassionate care benefits with sickness benefits (62.2%) compared to men (52.6%).
Similarly to compassionate care benefits, family caregiver benefits for children were most often combined with regular benefits by men (84.6%), while women were more likely to combine them with sickness benefits (70.1%). Conversely, when family caregiver benefits for adults were combined, both men and women most often received them with regular benefits (84.2% and 68.3%, respectively).
Less than one-fifth of all Work-Sharing claims were combined with other benefit types (17.2%), predominantly regular benefits. This is attributable to the fact that both benefit types are typically used during a downturn in business activity, which increases the risk of layoffs (Work-Sharing benefits) and actual layoffs (regular benefits). Regular benefits are usually claimed following Work-Sharing benefits, reflecting a continued downturn in a participating firm’s activity that eventually leads to a downsizing of the firm’s labour force.
While it is possible for fishers to combine fishing benefits with other benefit types (under some restrictions), only 13.5% of fishing claims were combined claims. Of those claims, 90.0% were combined with sickness benefits. No fishing claims were shared with maternity, parental, compassionate care or Work-Sharing benefits during the reporting period.
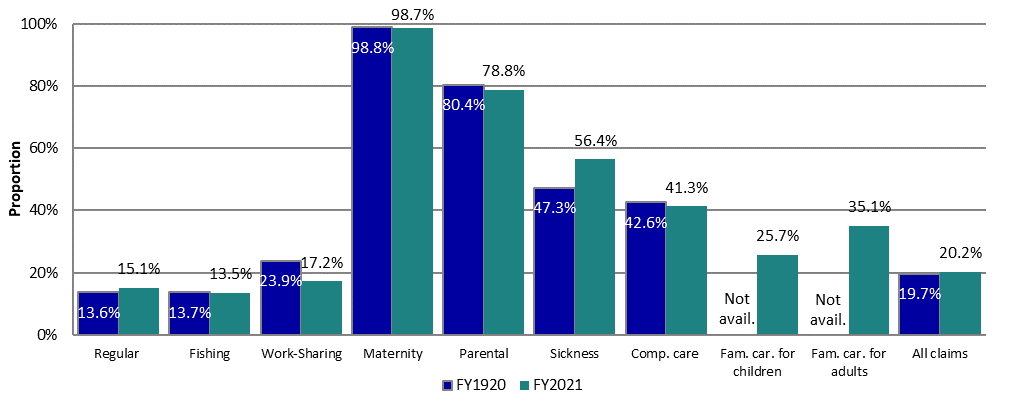
Trends in combined claims are relatively stable over time. However, in FY2021, the proportion of claims combining sickness benefits with other benefit types increased compared to the previous fiscal year, whereas the proportion of claims receiving Work-Sharing benefits with other benefit types decreased (consult chart 2). The fact that no pure EI sickness claims could be established during the first half of FY2021 could explain that there were less pure sickness claims among all sickness claims completed in FY2021. In terms of Work-Sharing benefits, the labour market and economic conditions which improved throughout the reporting period could, in part, explain that firms using Work-Sharing were less likely to lay employees off compared to previous years. Therefore, a lower proportion of completed Work-Sharing claims were combined with other benefit types (generally regular benefits) in FY2021.
Text description of Chart 2
| Benefit type | FY1920 | FY2021 |
|---|---|---|
| Regular | 13.6% | 15.1% |
| Fishing | 13.7% | 13.5% |
| Work-Sharing | 23.9% | 17.2% |
| Maternity | 98.8% | 98.7% |
| Parental | 80.4% | 78.8% |
| Sickness | 47.3% | 56.4% |
| Compassionate care | 42.6% | 41.3% |
| Family caregiver for children | not available | 25.7% |
| Family caregiver for adults | not available | 35.1% |
| All claims | 19.7% | 20.2% |
- Note: Includes completed claims for which at least $1 of EI benefits was paid.
- * Starting in FY2021, data on family caregiver benefits are included in the analysis on combined claims. They were previously excluded due to the incompatibility of administrative data sources.
- Source: Employment and Social Development Canada, Employment Insurance (EI) administrative data. Data are based on a 10% sample of EI administrative data.
2.1.3 Benefits-to-contributions ratios
The EI benefits paid to eligible claimants are financed solely by the mandatory contributions (that is, EI premiums) made by employers and employees, and by the self-employed who have opted into the EI program. The amount of EI benefits paid relative to the contributions made provides valuable insights into the usage of the program, especially when the claimants are analyzed by their socio-demographic characteristics. This subsection examines this using 2 different ratios: the total benefits-to-contributions ratio (total B/C ratio) and the regular benefits-to-contributions ratio (regular B/C ratio) for 2019.Footnote 12 As EI contributions are not assigned to specific benefit types, the regular B/C ratio accounts for reductions in EI contributions related to special benefits.Footnote 13
The total B/C ratios and the regular B/C ratios presented below are normalized, with the ratio for Canada set at 1.0. Consequently, the adjusted total and regular B/C ratios provide a quick interpretation of the net usage of the EI program by socio-demographic characteristic relative to the national level. An adjusted ratio higher than 1.0 means that the underlying sub-population (such as region or industry) received comparatively more benefits than contributions made than the Canadian average, and thus is a net beneficiary of the EI program. On the other hand, an adjusted ratio less than 1.0 means that the representing sub-population received comparatively less benefits than contributions made relative to the national level, and is a net contributor.
In 2019, the Atlantic provinces and Saskatchewan had adjusted total B/C ratios above the national level, meaning claimants in these provinces received comparatively more in EI benefits than the contributions made (consult chart 3). Generally, regionsFootnote 14 with a larger share of seasonal claimants exhibit adjusted total B/C ratios that are above 1.0, highlighting the greater use of EI benefits by claimants in these regions compared with other regions. On the other hand, Ontario, British Columbia and Nunavut had adjusted total B/C ratios below the national average, as claimants in these regions received comparatively less in EI benefits than the contributions made to the EI program. Quebec, Manitoba, Alberta, Yukon and the Northwest Territories had ratios very close to the national level.
A similar pattern can be observed when the payments for EI special benefits are excluded. In 2019, the Atlantic provinces, Quebec and Saskatchewan had adjusted regular B/C ratios above the national average; while Ontario, British Columbia and Nunavut had ratios below the national average. Manitoba, Alberta, Yukon and the Northwest Territories had ratios very close to the national level.

Text description of Chart 3
| Province or territory | Adjusted total benefits-to-contributions ratio (left scale) | Adjusted regular benefits-to-contributions ratio (left scale) | Adjusted total benefits-to-contributions ratio for Canada (1.0) (left scale) | Unemployment rate (right scale) |
|---|---|---|---|---|
| Newfoundland and Labrador | 4.22 | 5.65 | 1.0 | 12.3 |
| Prince Edward Island | 3.21 | 3.47 | 1.0 | 8.8 |
| Nova Scotia | 1.92 | 2.24 | 1.0 | 7.4 |
| New Brunswick | 2.56 | 3.07 | 1.0 | 8.1 |
| Quebec | 1.02 | 1.08 | 1.0 | 5.1 |
| Ontario | 0.79 | 0.70 | 1.0 | 5.6 |
| Manitoba | 1.02 | 0.98 | 1.0 | 5.3 |
| Saskatchewan | 1.17 | 1.20 | 1.0 | 5.6 |
| Alberta | 0.97 | 0.95 | 1.0 | 7.0 |
| British Columbia | 0.81 | 0.70 | 1.0 | 4.7 |
| Yukon | 0.93 | 1.03 | 1.0 | 3.7 |
| Northwest Territories | 0.96 | 1.03 | 1.0 | 7.8 |
| Nunavut | 0.74 | 0.74 | 1.0 | 13.4 |
- Sources: Canada Revenue Agency (CRA), T4 slips with employment income (for data on contributions); Employment and Social Development Canada (ESDC), Employment Insurance (EI) administrative data (for data on benefits); and Statistics Canada, Labour Force Survey, Tables 14-10-0287-01 and 14-10-0292-01 (for data on unemployment rates). CRA data are based on a 10% sample of T4 slips with employment income, and ESDC data are based on a 10% sample of EI administrative data.
As outlined in table 6, in 2019 women received approximately $1.12 in EI benefits for each dollar they contributed in premiums (adjusted total B/C ratio of 1.12). In particular, women aged between 25 and 44 years received the highest level of EI benefits relative to their contributions compared to those in other age groups (adjusted total B/C ratio of 1.57). This is likely due to the fact that women aged between 25 and 44 years are more likely to receive EI maternity and/or parental benefits. In comparison, men received approximately 90 cents in EI benefits for each dollar contributed in premiums (adjusted total B/C ratio of 0.90). However, this was reversed when only EI regular benefits were considered—the overall adjusted regular B/C ratio for men was higher than that for women (1.19 versus 0.76, respectively). Notably, the adjusted regular B/C ratios for men in all age groups were higher than the national average and greater than those for women.
| Age category | Adjusted total B/C ratio men | Adjusted total B/C ratio women | Adjusted total B/C ratio total | Adjusted regular B/C ratio men | Adjusted regular B/C ratio women | Adjusted regular B/C ratio total |
|---|---|---|---|---|---|---|
| 24 years old and under | 1.06 | 0.87 | 0.98 | 1.31 | 0.50 | 0.96 |
| 25 to 44 years old | 0.81 | 1.57 | 1.13 | 1.04 | 0.68 | 0.88 |
| 45 to 54 years old | 0.82 | 0.65 | 0.74 | 1.11 | 0.79 | 0.96 |
| 55 years old and over | 1.14 | 0.79 | 0.99 | 1.57 | 1.01 | 1.32 |
| Total | 0.90 | 1.12 | 1.00 | 1.19 | 0.76 | 1.00 |
- Sources: Canada Revenue Agency (CRA), T4 slips with employment income (for data on contributions); Employment and Social Development Canada (ESDC), Employment Insurance (EI) administrative data (for data on benefits). CRA data are based on a 10% sample of T4 slips with employment income, and ESDC data are based on a 10% sample of EI administrative data.
As illustrated in chart 4, claimants who had worked in the goods-producing industries were net beneficiaries of EI benefits with both adjusted B/C ratios above the national average in 2019, while those who had worked in the services-producing industries were net contributors. The greater use of EI regular benefits by claimants who had worked in the goods-producing industries relative to those who had worked in the services-producing industries may be due to the higher proportion of seasonal employment in these industries, particularly the Agriculture, forestry, fishing and hunting industry and the Construction industry. As seasonal employment fluctuates during certain periods of the year, workers employed in these industries generally rely on EI benefits during the “off-seasons”, leading to higher adjusted regular B/C ratios. The difference between the goods-producing industries and the services-producing industries is less significant for the adjusted total B/C ratio. This may partly be due to the larger proportion of women working in certain services-producing industries, such as the Health care and social assistance industry and the Educational services industry, who can claim EI maternity and/or parental benefits and thus increase the relative use of EI in these industries.

Text description of Chart 4
| Industry | Adjusted regular benefits-to-contributions ratio | Adjusted total benefits-to-contributions ratio |
|---|---|---|
| Goods-producing industries | 1.91 | 1.53 |
| Agriculture, forestry, fishing and hunting | 3.90 | 4.05 |
| Mining and oil and gas extraction | 1.58 | 1.19 |
| Utilities | 0.41 | 0.46 |
| Construction | 3.28 | 2.28 |
| Manufacturing | 0.94 | 0.85 |
| Services-producing industries | 0.74 | 0.85 |
| Wholesale trade | 0.78 | 0.72 |
| Retail trade | 0.71 | 0.82 |
| Transportation and warehousing | 0.97 | 0.87 |
| Finance and insurance | 0.29 | 0.54 |
| Real estate and rental and leasing | 0.95 | 0.92 |
| Professional, scientific and technical services | 0.70 | 0.73 |
| Business, building and other support services* | 1.37 | 1.21 |
| Educational services | 0.96 | 1.01 |
| Health care and social assistance | 0.35 | 0.86 |
| Information, culture and recreation** | 0.92 | 0.84 |
| Accommodation and food services | 1.14 | 1.15 |
| Other services (except public administration) | 1.02 | 1.03 |
| Public administration | 0.47 | 0.71 |
| Canada | 1.00 | 1.00 |
- *Includes Management of companies and enterprises and Administrative support, waste management and remediation services.
- ** Includes Information and cultural industries and Arts, entertainment and recreation services.
- Sources: Canada Revenue Agency (CRA), T4 slips with employment income (for data on contributions); Employment and Social Development Canada (ESDC), Employment Insurance (EI) administrative data (for data on benefits). CRA data are based on a 10% sample of T4 slips with employment income, and ESDC data are based on a 10% sample of EI administrative data.
Implicit income redistribution and the Employment Insurance program
Due to differences in income support provided by the EI program across socio-economic sub-populations, the program can act as an implicit income redistribution mechanism in Canada, providing greater income support (relative to contributions) to individuals in the lower part of the income distribution as compared to those with greater earnings. A 2012 evaluation study* showed that the benefit and contribution aspects of the program tend to be redistributive and that the impact of the program on the redistribution of earnings increased substantially during the late 2000s recession.
Moreover, a study on the financial impact of receiving EI benefits** concluded that the EI program has a considerable positive income redistribution effect, with lower income families having a higher adjusted total benefits-to-contributions ratio than higher income families. In fact, families with after-tax incomes below the median received 34% of total EI benefits and paid 18% of all premiums, representing an adjusted total benefits-to-contributions ratio of close to 2.0.
- *Ross Finnie and Ian Irvine, The Redistributional Impact of Employment Insurance 2007 to 2009 (Ottawa: HRSDC, Evaluation Directorate, 2013).
- **Constantine Kapsalis, Financial Impacts of Receiving Employment Insurance (Ottawa: Data Probe Economic Consulting Inc., 2010).
2.2 Employment Insurance regular benefits
In this section
- 2.2.1 Employment Insurance regular claims and benefits paid
- 2.2.2 Coverage and eligibility to Employment Insurance regular benefits
- 2.2.3 Level of Employment Insurance regular benefits
- 2.2.4 Employment Insurance regular benefit entitlement
- 2.2.5 Employment Insurance regular benefits and seasonal claimants
- 2.2.6 Exhaustion of Employment Insurance regular benefits
- 2.2.7 Working while on claim
Employment Insurance (EI) regular benefits are designed to provide temporary income support to partially replace lost employment income for eligible claimants while they search for work or upgrade their skills.
As explained in section 2.0, no new claims for EI regular benefits were established during the first half of FY2021, and some of the main indicators covered in the following subsections are presented separately for the first and the second half of FY2021.Footnote 15
Under the EI temporary measures, to qualify for EI regular benefits in the second half of FY2021, the claimant must:
- be unemployed and available for work
- have worked a minimum number of 420 hours of insurable employment (essentially 120 hours with the one-time 300 hours credit) and paid EI premiums during the qualifying period (defined as either the previous 52 weeks (or 80 weeks for claimants who received CERB) or since the establishment of their last claim, whichever is shorter), and
- have had a valid reason for job separation according to the Employment Insurance Act
2.2.1 Employment Insurance regular claims and benefits paid
Since no new EI regular claims could be established between April 1, 2020 and September 26, 2020, the reporting period of new EI regular claims is limited to only the second half of FY2021. However, the total amounts paid is reported on the entirety of FY2021 as EI regular benefits from previously established claims continued to be paid throughout the whole year.
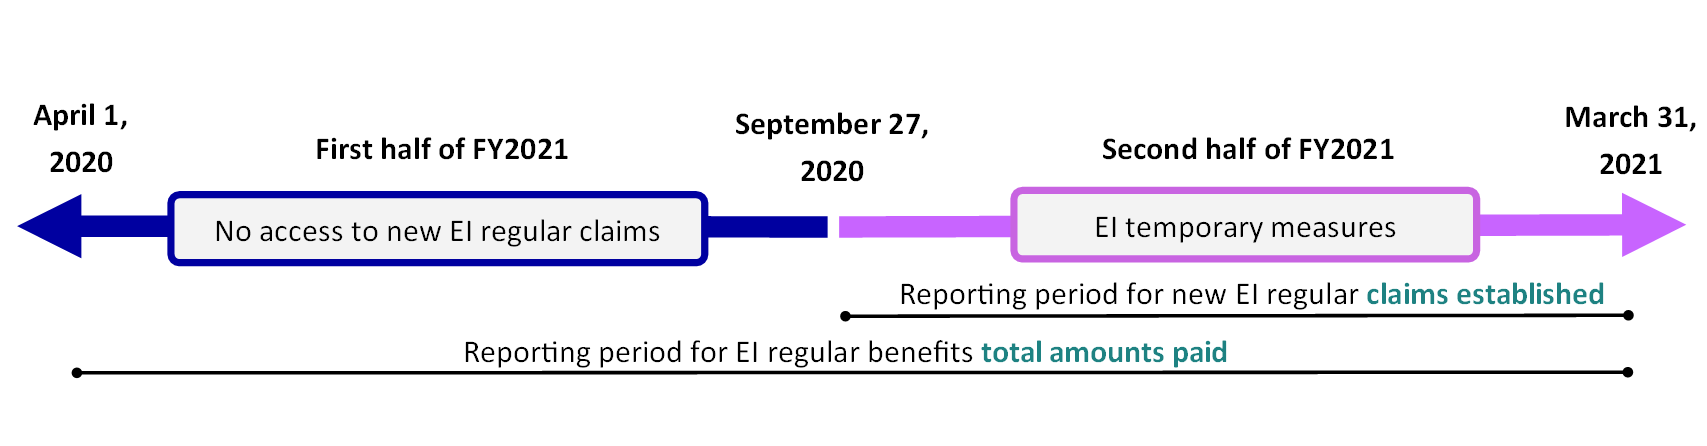
Text description of Chart 5
| Category | Timeline |
|---|---|
| Reporting period for EI regular benefits total amounts paid | First and second half of FY2021, between April 1, 2020 and March 31, 2021 |
| Reporting period for new EI regular claims established | Second half of FY2021, between September 27, 2020 and March 31, 2021 |
| No access to new EI regular claims | First half of FY2021, between April 1, 2020 and September 27, 2020 |
| EI temporary measures | Second half of FY2021, between September 27, 2020 and March 31, 2021 |
The number of new claims established during a given period tends to be influenced by labour market conditions and overall economic cycles, as well as initiatives such as EI pilot projects or changes to the program design. During periods of economic growth and robust labour market conditions, fewer claims for EI regular benefits are established, while the opposite is true during periods of economic stagnation and unfavourable labour market conditions. As discussed in chapter 1, the COVID-19 pandemic and the public health measures in place to limit its spread had an unprecedented negative impact on the economy and the labour market in terms of employment losses aligned with each wave of the pandemic. In the second half of FY2021, 2.47 million new EI regular claims were established. This is almost double the number of claims established in the entire FY1920 (1.37 million). However, given the temporary changes to the EI program and the unprecedented labour market conditions and benefit schemes available in FY2021, this is not comparable with previous years. Therefore, year-over-year comparisons of the number of new EI regular claims established are not examined in this section.
The total amount of EI regular benefits paid increased from $11.1 billion in FY1920 to $24.9 billion in FY2021. The increase in the total amount of EI regular benefits paid in FY2021 is attributable to the temporary changes to the EI programFootnote 16 and the relatively higher number of EI regular claims established.
There was an average of 1.5 million beneficiaries receiving EI regular benefits each month in the second half of FY2021 when the EI temporary measures were in place.Footnote 17 This is significantly higher than the 344,200 average monthly EI regular beneficiaries in the first half of FY2021.Footnote 18
Because the number of beneficiaries is based on previously established claims, these 2 measures generally trend in the same direction, with the count of beneficiaries usually lagging behind the number of new claims established. To illustrate this, suppose there is an increase in the number of claims established for EI regular benefits after an economic shock. The number of beneficiaries will increase following the increase in claims. However, the count of beneficiaries can still remain elevated even after the volume of new claims has subsided once the labour market conditions improve, as payments continue to be made on previously established claims until benefits are exhausted or the claimants have found employment. Because no new EI regular claims could be established between April 1 and September 26, 2020, the number of beneficiaries of EI regular benefits in the first half of FY2021 were solely from claims established in the previous fiscal year and were decreasing each month. When EI regular benefits were made available again on September 27, 2020 under the temporary measures, there was a large increase in new EI regular claims established and the number of beneficiaries climbed. The effect of the increase in the number of claims established will likely continue to be reflected on the number of beneficiaries in the next reporting period.
Employment Insurance regular claims and amount paid by province or territory, gender and age
Table 7 outlines the number of EI regular claims established in the second half of FY2021 and the total amount paid over the entire reporting period by province or territory, gender and age. The columns presenting the percentage point change (p.p.) show the change of the shares of each respective category over the total population in FY2021 in comparison to their relative shares in FY1920. While both the number of new EI regular claims established and total amount paid increased in every category in FY2021, changes in certain categories were more significant than in others in terms of their relative shares.
| Category | Number of claims and share FY1920 | Number of claims and share Second half of FY2021 | p.p. change of relative share compared to FY1920 | Amount paid ($ million) and share FY1920 | Amount paid ($ million) and share FY2021 | p.p. change of relative share compared to FY1920 |
|---|---|---|---|---|---|---|
| Newfoundland and Labrador | 62,980 (4.6%) | 81,400 (3.3%) | -1.3 | $759.2 (6.9%) | $1,029.1 (4.1%) | -2.7 |
| Prince Edward Island | 14,860 (1.1%) | 18,820 (0.8%) | -0.3 | $155.5 (1.4%) | $211.6 (0.8%) | -0.6 |
| Nova Scotia | 62,100 (4.5%) | 81,630 (3.3%) | -1.2 | $588.6 (5.3%) | $905.1 (3.6%) | -1.7 |
| New Brunswick | 68,720 (5.0%) | 91,520 (3.7%) | -1.3 | $680.0 (6.1%) | $989.9 (4.0%) | -2.2 |
| Quebec | 400,460 (29.3%) | 653,980 (26.4%) | -2.8 | $2,622.2 (23.7%) | $5,906.0 (23.7%) | 0.0 |
| Ontario | 393,950 (28.8%) | 848,920 (34.3%) | +5.5 | $3,011.1 (27.2%) | $8,352.1 (33.5%) | +6.3 |
| Manitoba | 42,900 (3.1%) | 76,120 (3.1%) | -0.1 | $370.7 (3.4%) | $785.2 (3.1%) | -0.2 |
| Saskatchewan | 40,800 (3.0%) | 60,370 (2.4%) | -0.5 | $405.9 (3.7%) | $700.7 (2.8%) | -0.9 |
| Alberta | 140,540 (10.3%) | 296,840 (12.0%) | +1.7 | $1,354.1 (12.2%) | $3,304.1 (13.3%) | +1.0 |
| British Columbia | 135,800 (9.9%) | 257,310 (10.4%) | +0.5 | $1,068.7 (9.7%) | $2,675.9 (10.7%) | +1.1 |
| Yukon | 1,680 (0.1%) | 2,440 (0.1%) | 0.0 | $17.0 (0.2%) | $27.6 (0.1%) | 0.0 |
| Northwest Territories | 1,520 (0.1%) | 2,200 (0.1%) | 0.0 | $19.5 (0.2%) | $26.4 (0.1%) | -0.1 |
| Nunavut | 770 (0.1%) | 1,310 (0.1%) | 0.0 | $12.2 (0.1%) | $16.4 (0.1%) | 0.0 |
| Men | 830,770 (60.8%) | 1,371,140 (55.4%) | -5.3 | $7,348.8 (66.4%) | $14,578.4 (58.5%) | -7.9 |
| Women | 536,310 (39.2%) | 1,101,720(44.6%) | +5.3 | $3,715.6 (33.6%) | $10,351.7 (41.5%) | +7.9 |
| 24 years old and under | 122,860 (9.0%) | 381,160 (15.4%) | +6.4 | $939.3 (8.5%) | $3,157.6 (12.7%) | +4.2 |
| 25 to 44 years old | 603,290 (44.1%) | 1,042,340 (42.2%) | -2.0 | $4,783.1 (43.2%) | $10,578.0 (42.4%) | -0.8 |
| 45 to 54 years old | 286,640 (21.0%) | 445,220 (18.0%) | -3.0 | $2,342.4 (21.2%) | $4,660.7 (18.7%) | -2.5 |
| 55 years old and over | 354,290 (25.9%) | 604,140 (24.4%) | -1.5 | $2,999.6 (27.1%) | $6,533.9 (26.2%) | -0.9 |
| Canada | 1,367,080 (100.0%) | 2,472,860 (100.0%) | 0.0 | $11,064.4 (100.0%) | $24,930.1 (100.0%) | 0.0 |
- Note: Data may not add up to the total due to rounding. Percentage point change is based on unrounded numbers. Includes claims for which at least $1 of EI regular benefits was paid.
- Source: Employment and Social Development Canada, Employment Insurance (EI) administrative data. Data are based on a 10% sample of EI administrative data.
Specifically, the relative share of claims established for EI regular benefits increased in Ontario (+5.5 p.p.), Alberta (+1.7 p.p.), and British Columbia (+0.5 p.p.) in the second half of FY2021 compared to the previous fiscal year. The relative share of claims for EI regular benefits decreased across all Atlantic provinces and Saskatchewan, while staying relatively unchanged in Manitoba and all 3 territories. The most significant relative decrease in the share of EI regular claims established was observed in Quebec (-2.8 p.p.). The relative share of total amount paid in EI regular benefits similarly increased in Ontario (+6.3 p.p.), British Columbia (+1.1 p.p.) and Alberta (+1.0 p.p.) in FY2021 compared to FY1920. It stayed relatively unchanged in all 3 territories, Quebec and Manitoba, while decreasing slightly in the Atlantic provinces and Saskatchewan. Similar to previous years, Ontario and Quebec continued to account for more than half (60.8%) of total EI regular claims established in the second half of FY2021. They also made up over half (57.2%) of the total amount paid in EI regular benefits in FY2021, up from 50.9% in FY1920.
The relative share of new claims established by women increased by 5.3 percentage points during this period. Despite this, men still accounted for the majority (55.4%) of EI regular claims in the second half of FY2021, similar to previous reporting periods. In FY2021, men accounted for the over half (58.5%) of the total amount paid in EI regular benefits. This share has remained relatively stable in recent years as well.
Those aged 24 years and under had the most significant increase in their relative shares of new claims, from 9.0% in FY1920 to 15.4% in the second half of FY2021 (+6.4 p.p.). In terms of total amount paid in EI regular benefits, the share of younger claimants also had the highest increase (+4.2 p.p.) in FY2021 from FY1920. Similar to the previous years, claimants aged between 25 and 44 years continued to account for the largest share of new regular claims (42.2%) in the second half of FY2021 as well as the total amount paid in FY2021 (42.4%). Despite the largest relative increases among age groups, those aged 24 years and under still had the smallest shares (15.4% of total claims and 12.7% of total amount paid, respectively).
Employment Insurance regular claims and amount paid by industry
As outlined in Table 8, the relative share of new EI regular claims established in the second half of FY2021 increased in services-producing industries (+9.0 p.p.) from FY1920. This increase was driven mostly by increases in the share of new claims in Accommodation and food services (+7.5 p.p.) and Retail trade (+6.0 p.p.), 2 sectors heavily impacted by closures and economic shutdowns during the COVID-19 pandemic. Among the goods-producing industries, the overall share of new claims established in FY2021 decreased in all industries with a total relative decline of 11.3 percentage points from the previous reporting period. A notable relative decrease was observed in the Construction industry (‑7.0 p.p.). The relative share of new claims in the Unclassified industries category also increased by 2.3 percentage points. This was due to the missing information in the EI claims that is required to classify them. This indicates that the increases in the number of EI regular claims in some industries in FY2021 would have been even higher if these unclassified claims had been categorized. Similar to previous reporting periods, the Construction sector continued to hold the largest share of new claims established among all industry groups (14.2%).
| Industry | Number of claims and share FY1920 | Number of claims and share Second half of FY2021 | p.p. change of relative share compared to FY1920 | Amount paid ($ million) and share FY1920 | Amount paid ($ million) and share FY2021 | p.p. change of relative share compared to FY1920 |
|---|---|---|---|---|---|---|
| Goods-producing industries | 523,350 (38.3%) | 667,470 (27.0%) | -11.3 | $4,590.7 (41.5%) | $7,138.4 (28.6%) | -12.9 |
| Agriculture, forestry, fishing, and hunting | 51,240 (3.7%) | 59,370 (2.4%) | -1.3 | $525.8 (4.8%) | $689.3 (2.8%) | -2.0 |
| Mining and oil and gas extraction | 24,130 (1.8%) | 33,730 (1.4%) | -0.4 | $270.0 (2.4%) | $430.8 (1.7%) | -0.7 |
| Utilities | 4,870 (0.4%) | 3,980 (0.2%) | -0.2 | $42.2 (0.4%) | $46.8 (0.2%) | -0.2 |
| Construction | 289,330 (21.2%) | 350,210 (14.2%) | -7.0 | $2,592.1 (23.4%) | $3,691.3 (14.8%) | -8.6 |
| Manufacturing | 153,780 (11.2%) | 220,180 (8.9%) | -2.3 | $1,160.7 (10.5%) | $2,280.1 (9.1%) | -1.3 |
| Services-producing industries | 801,070 (58.6%) | 1,671,510 (67.6%) | +9.0 | $6,151.8 (55.6%) | $16,428.9 (65.9%) | +10.3 |
| Wholesale trade | 41,670 (3.0%) | 83,080 (3.4%) | +0.3 | $425.2 (3.8%) | $937.8 (3.8%) | -0.1 |
| Retail trade | 76,100 (5.6%) | 286,270 (11.6%) | +6.0 | $610.1 (5.5%) | $2,405.4 (9.6%) | +4.1 |
| Transportation and warehousing | 64,460 (4.7%) | 114,250 (4.6%) | -0.1 | $499.1 (4.5%) | $1,131.8 (4.5%) | 0.0 |
| Finance and insurance | 12,480 (0.9%) | 22,230 (0.9%) | 0.0 | $148.8 (1.3%) | $258.8 (1.0%) | -0.3 |
| Real estate, rental, and leasing | 18,800 (1.4%) | 39,840 (1.6%) | +0.2 | $174.8 (1.6%) | $445.6 (1.8%) | +0.2 |
| Professional, scientific, and technical services | 55,220 (4.0%) | 87,120 (3.5%) | -0.5 | $516.5 (4.7%) | $996.0 (4.0%) | -0.7 |
| Business, building, and other support services* | 85,720 (6.3%) | 170,190 (6.9%) | +0.6 | $768.0 (6.9%) | $1,845.5 (7.4%) | +0.5 |
| Educational services | 170,300 (12.5%) | 120,670 (4.9%) | -7.6 | $823.5 (7.4%) | $793.5 (3.2%) | -4.3 |
| Health care and social assistance | 50,050 (3.7%) | 105,120 (4.3%) | +0.6 | $359.2 (3.2%) | $978.2 (3.9%) | +0.7 |
| Information, culture, and recreation** | 39,900 (2.9%) | 110,510 (4.5%) | +1.6 | $317.1 (2.9%) | $1,156.8 (4.6%) | +1.8 |
| Accommodation and food services | 72,130 (5.3%) | 317,070 (12.8%) | +7.5 | $489.4 (4.4%) | $3,383.5 (13.6%) | +9.1 |
| Other services (excluding Public administration) | 45,450 (3.3%) | 116,740 (4.7%) | +1.4 | $376.7 (3.4%) | $1,126.7 (4.5%) | +1.1 |
| Public administration | 68,790 (5.0%) | 98,420 (4.0%) | -1.1 | $643.4 (5.8%) | $969.2 (3.9%) | -1.9 |
| Unclassified*** | 42,660 (3.1%) | 133,880 (5.4%) | +2.3 | $321.8 (2.9%) | $1,362.9 (5.5%) | +2.6 |
| Canada | 1,367,080 (100.0%) | 2,472,860 (100.0%) | 0.0 | $11,064.4 (100.0%) | $24,930.1 (100.0%) | 0.0 |
- Note: Data may not add up to the total due to rounding. Percentage point change is based on unrounded numbers. Includes claims for which at least $1 of EI regular benefits was paid.
- * This industry sector comprises the industries with codes 55 (Management of companies and enterprises) and 56 (Administration and support, waste management and remediation services).
- ** This industry sector comprises the industries with codes 51 (Information and cultural industries) and 71 (Arts, entertainment and recreation).
- *** For some claims, this information was not available in the data.
- Source: Employment and Social Development Canada, Employment Insurance (EI) administrative data. Data are based on a 10% sample of EI administrative data.
Similar to new EI regular claims established, the relative share of EI regular benefits paid to claimants in the services-producing industries saw a significant increase (+10.3 p.p.) in FY2021, whereas the relative share paid to claimants in goods-producing industries declined by 12.9 percentage points from FY1920. The Accommodation and food services industry saw the largest relative share increase (+9.1 p.p.), followed by Retail trade (+4.1 p.p.), and unclassified industries (+2.6 p.p.). Among goods-producing industries, Construction saw the largest decline in the relative share of amounts paid (-8.6 p.p.), followed by the Agriculture, forestry, fishing, and hunting (-2.0 p.p.) industry. Despite the decline in its relative share, Construction remained the industry with the highest total amount paid, at $3.7 billion, closely followed by Accommodation and food services ($3.4 billion), Retail trade ($2.4 billion), and Manufacturing ($2.3 billion).
The Employment Insurance benefit repayment provision
EI benefit payments are taxable income, regardless of the type of benefits. Depending on their net income and whether they were paid EI regular benefits, including fishing benefits, individuals may be required to repay some of the EI benefits at the time they file income tax returns.
In accordance with the Employment Insurance Act, claimants must repay a percentage of EI benefits they received if their net income* in a given year exceeds 1.25 times the maximum yearly insurable earnings. In the 2019 taxation year**, claimants whose net income exceeded $66,375*** were required to repay 30% of the lesser of:
- the net income in excess of $66,375, or
- the total regular benefits, including regular fishing benefits, paid in the taxation year
Claimants who received EI special benefits were exempt from the benefit repayment requirement.**** In addition, claimants who received less than 1 week of EI regular or fishing benefits in the preceding 10 taxation years were also exempt from repaying benefits.
In the 2019 taxation year, around 178,500 EI claimants repaid a total of $259.4 million in EI benefits. On average, each claimant subject to the EI benefit repayment provision repaid $1,453 while they received $6,075 in EI benefits. Similar to previous years, individuals who resided in Quebec, Ontario and Alberta together represented more than two-thirds (69.0%) of the total number of claimants who repaid benefits and almost three-fifths (59.5%) of the total amount repaid in 2019. Among those who repaid benefits, men and core-aged individuals (aged between 25 and 54 years) are generally over-represented—in 2019, men accounted for 88.3% of the total claimants who repaid benefits and 89.6% of the total amount repaid. These proportions were 68.4% and 63.2%, respectively, for core-aged individuals. By industry classification, claimants who had worked in the goods-producing industries accounted for 66.7% of the total number of individuals who repaid benefits and 64.9% of the total amount repaid in 2019. In particular, claimants who had worked in the Construction industry accounted for the largest proportions of individuals who repaid benefits as well as the total amount repaid (46.1% and 41.9%, respectively). These proportions have remained relatively unchanged in recent years.
A recent departmental study***** looked at the sociodemographic characteristics and claim patterns of individuals subject to the EI benefit repayment provision over the period 2011 to 2019. The study found that these individuals, on average, had income $12,500 above the repayment threshold in respective years while they repaid a yearly average of $1,430 in benefit repayment over the study period. Claimants who were men, older, worked in larger firms, resided in Alberta or worked in the Construction industry were more likely to be subject to the benefit repayment provision. Among claimants who had repaid benefits, those who were men, older, single, resided in the Atlantic provinces or worked in the primary industry repaid higher amounts of EI benefits on average.
While looking at claim patterns of individuals who had repaid EI benefits, the study found that eligible repeat claimants had a higher likelihood of receiving EI regular benefits (64.6%) than eligible first-time claimants (32.1%). Furthermore, there was no indication that the EI benefit repayment provision deterred eligible claimants from collecting EI regular benefits. The study also found that the timing of establishing a claim and its duration had an effect on the prevalence of being subject to the benefit repayment provision—claimants whose claims overlapped 2 taxation years were more prevalent among individuals who repaid benefits than those whose entire claims fell within 1 year. Claimants with claims overlapping 2 taxation years were also found to be repaying higher amounts of benefit on average during this period compared to those with an entire claim within a year.
- * Net income includes employment income and EI benefits received during the taxation year.
- ** The most recent taxation year for which data on individuals who repaid EI benefits are available is 2019. Data are as of September 2020 and preliminary, as the Canada Revenue Agency extended the 2019 tax filing deadline to June 1, 2020 and the payment due date to September 30, 2020 due to the COVID-19 crisis.
- *** The maximum annual insurable earnings in 2019 was $53,100.
- **** If claimants received a combination of regular and special benefits within the same tax year, they may still have to repay a percentage of the regular benefits received.
- ***** ESDC, Analysis of the EI Clawback Provision (Ottawa: ESDC, Evaluation directorate, 2022).
Employment Insurance regular benefits and firms
According to the 2019 tax dataFootnote 19 available from the Canada Revenue Agency (CRA), there were around 1.26 million firms operating in Canada in 2019, up slightly (+2.1%) from the previous year. Of those, 288,100 firms (22.9%) employed at least 1 employee who had received EI regular benefits in that year.
As outlined in Table 9, the proportion of firms which employed at least 1 employee receiving EI regular benefits increased with firm sizeFootnote 20, with smaller firms being less likely to be the last employer of a claimant. In 2019, 17.6% of small-sized firms had at least 1 former employee who received EI regular benefits, compared to 70.6% of small-to-medium sized firms, 93.7% of medium-to-large sized firms and 99.5% of large-sized firms.
However, when the number of claimants for EI regular benefits is compared with distribution of workforce by firm size, employees from smaller firms are found to be over-represented among EI regular claimants. As shown in table 9, smaller firms accounted for 21.2% of the total workforce while they represented 26.4% of the total EI regular benefit claimants in 2019. Similarly, employees in the small-to-medium sized firms were also over-represented among EI regular claimants, as they accounted for 19.5% of the total employees and 24.2% of the total EI regular claimants in 2019. This gap between the share of employment and the share of EI regular claimants narrows for the medium-to-large sized firms. For the large-sized firms, however, the opposite can be observed—these firms represented 43.0% of the total workforce in Canada in 2019 but accounted for only 31.7% of the total EI regular claimants. The higher proportion of usage of EI regular benefits among employees in the smaller-sized firms suggest that smaller firms are more vulnerable to difficult business or economic conditions than larger firms, and need to make broader adjustments to their workforces. This results in a larger share of their employees claiming EI regular benefits as a result of layoffs following a reduction in business activities. Moreover, this trend can also be influenced by industry-related characteristics such as the greater prevalence of seasonal jobs in small-sized firms that are generally more likely to rely on Employment Insurance, relative to the national average in some industries.Footnote 21
| Firm size* | Number of firms (all firms) | Number of firms (firms with at least 1 employee receiving EI regular benefits) | Employment distribution** (% share) | EI claimant distribution*** (% share) |
|---|---|---|---|---|
| Small | 1,138,620 | 200,750 | 21.2% | 26.4% |
| Small-medium | 96,890 | 68,380 | 19.5% | 24.2% |
| Medium-large | 16,740 | 15,680 | 16.2% | 17.8% |
| Large | 3,350 | 3,330 | 43.0% | 31.7% |
| Canada | 1,255,600 | 288,140 | 100.0% | 100.0% |
- Note: Data may not add up due to rounding.
- * The categories of firm size reflect those found in Business Dynamics in Canada, a Statistics Canada publication. Small-sized firms are defined as those that employ 1 to 19 employees. Small-to-medium sized firms employ 20 to 99 employees. Medium-to-large sized firms employ 100 to 499 employees. Large-sized firms employ 500 employees or more.
- ** The number of workers in a firm is the number of individuals with employment income in that firm, as indicated on a T4 form. The number of workers is adjusted so that each individual in the labour force is only counted once and individuals who work for more than 1 firm are taken into account. For example, if an employee that earned $25,000 in firm 1 and $25,000 in firm 2, then he or she was recorded as 0.5 employees at the first firm and 0.5 employees at the second firm.
- *** These are based on the number of people receiving EI regular benefits in 2019.
- Source: Employment and Social Development Canada, Employment Insurance (EI) administrative data. Data are based on a 100% sample of EI administrative data. Canada Revenue Agency, CRA administrative data. CRA data are based on a 100% sample.
Employment Insurance regular claims and amount paid by EI claimant category
Table 10 outlines the number of claims established for EI regular benefits in the second half of FY2021 and amount paid by EI claimant categoryFootnote 22 over the entire FY2021 year. Occasional claimants saw the highest increase in relative shares of new EI regular claims established (+7.1 p.p.) and total amount paid (+8.0 p.p.), compared to the previous reporting period. Simultaneously, frequent claimants saw the largest decrease in relative shares of new EI regular claims established (-9.3 p.p.) and total amount paid (-11.4 p.p.). This is likely due to the repercussions of the COVID-19 pandemic on non-frequent EI claimants who experienced job separations at unprecedented higher rates in FY2021.
Long-tenured workers accounted for 27.2% of all new regular claims established in the second half of FY2021, while they received 26.2% of the total amount paid in FY2021. Occasional claimants accounted for 61.1% of all new regular claims established, but received 59.9% of the total amount paid during the reporting periods. Frequent claimants, on the other hand, accounted for 11.7% of total new regular claims established and received 13.9% of the total amount paid in EI regular benefits.
| Claimant category | Number of claims and share FY1920 | Number of claims and share second half of FY2021 | p.p. change of relative share compared to FY1920 | Amount paid ($ million) and share FY1920 | Amount paid ($ million) and share FY2021 | p.p. change of relative share compared to FY1920 |
|---|---|---|---|---|---|---|
| Long-tenured workers | 340,900 (24.9%) | 670,790 (27.2%) | +2.2 | $2,518.1 (22.8%) | $6,533.0 (26.2%) | +3.4 |
| Occasional claimants | 738,600 (54.0%) | 1,511,990 (61.1%) | +7.1 | $5,746.6 (51.9%) | $14,933.4 (59.9%) | +8.0 |
| Frequent claimants | 287,580 (21.0%) | 289,080 (11.7%) | -9.3 | $2,799.7 (25.3%) | $3,463.6 (13.9%) | -11.4 |
| Canada | 1,367,080 (100.0%) | 2,472,860 (100.0%) | 0.0 | $11,064.4 (100.0%) | $24,930.1 (100.0%) | 0.0 |
- Note: Data may not add up to the total due to rounding. Percentage point change is based on unrounded numbers. Includes claims for which at least $1 of EI regular benefits was paid.
- Source: Employment and Social Development Canada, Employment Insurance (EI) administrative data. Data are based on a 10% sample of EI administrative data.
Chart 6 and chart 7 illustrate the share of new EI regular claims established and the share of total amount paid by claimant categories in the past decade, respectively. During this period, the share of EI regular claims established by occasional claimants has ranged between 51.8% (FY1112) and 57.8% (FY1415), before increasing to 61.1% in the second half of FY2021. The share of claims established by long-tenured workers has experienced some variation in the last decade, while the share by frequent claimants has remained relatively unchanged before dropping sharply to 11.7% in the second half of FY2021. This can be explained by the fact that the number of new claims by frequent claimants did not increase as much as the number of new claims by long-tenured workers and occasional claimants in the second half of FY2021, compared to previous years.
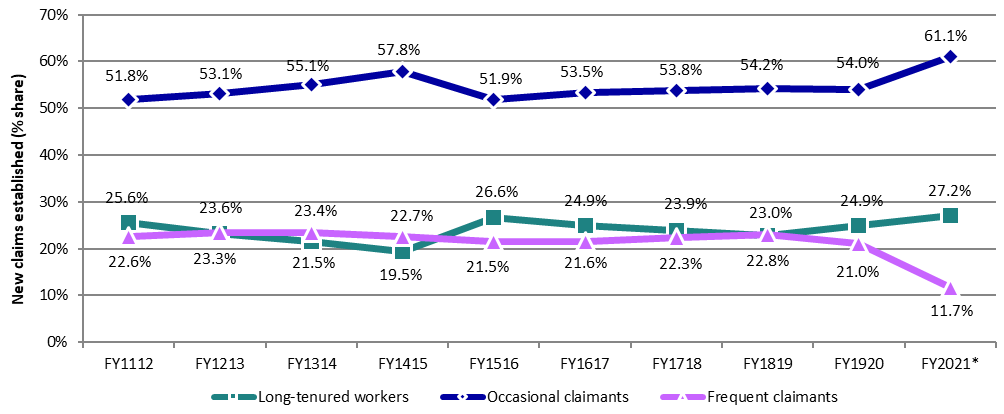
Text description of Chart 6
| Claimant category | FY1112 | FY1213 | FY1314 | FY1415 | FY1516 | FY1617 | FY1718 | FY1819 | FY1920 | FY2021* | |
|---|---|---|---|---|---|---|---|---|---|---|---|
| Long-tenured workers | 25.6% | 23.3% | 21.5% | 19.5% | 26.6% | 24.9% | 23.9% | 22.8% | 24.9% | 27.2% | |
| Occassional claimants | 51.8% | 53.1% | 55.1% | 57.8% | 51.9% | 53.5% | 53.8% | 54.2% | 54.0% | 61.1% | |
| Frequent claimants | 22.6% | 23.6% | 23.4% | 22.7% | 21.5% | 21.6% | 22.3% | 23.0% | 21.0% | 11.7% |
- Note: Includes claims for which at least $1 of EI regular benefits was paid.
- * FY2021 only includes the second half of the fiscal year, as no new claims for regular benefits were established in the first half of FY2021 because of the CERB.
- Source: Employment and Social Development Canada, Employment Insurance (EI) administrative data. Data are based on a 10% sample of EI administrative data.
The share of EI regular benefits paid to occasional claimants has trended upward in the last decade. The share paid to long-tenured workers and frequent claimants saw slight variations over time without distinctly trending in either direction, with the exception of a sharp drop in the share of frequent claimants in FY2021 to 13.9% (down from 25.3% in FY1920).
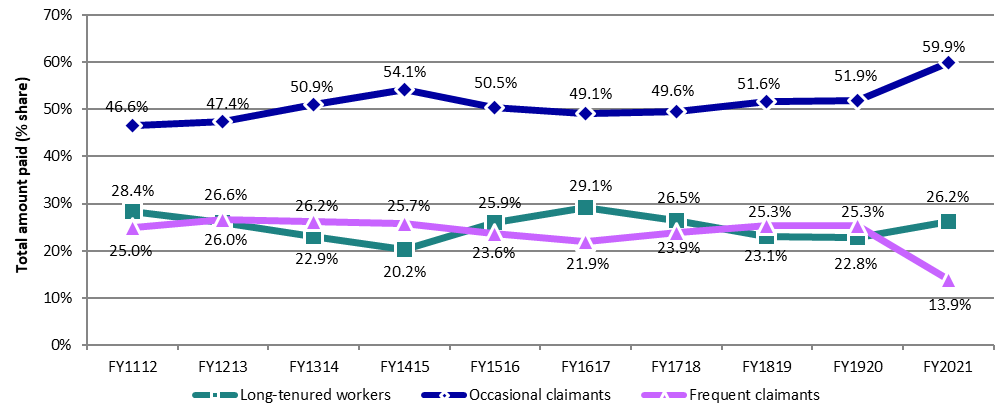
Text description of Chart 7
| Claimant category | FY1112 | FY1213 | FY1314 | FY1415 | FY1516 | FY1617 | FY1718 | FY1819 | FY1920 | FY2021* |
|---|---|---|---|---|---|---|---|---|---|---|
| Long-tenured workers | 28.4% | 26.0% | 22.9% | 20.2% | 25.9% | 29.1% | 26.5% | 23.1% | 22.8% | 26.2% |
| Occassional claimants | 46.6% | 47.4% | 50.9% | 54.1% | 50.5% | 49.1% | 49.6% | 51.6% | 51.9% | 59.9% |
| Frequent claimants | 25.0% | 26.6% | 26.2% | 25.7% | 23.6% | 21.9% | 23.9% | 25.3% | 25.3% | 13.9% |
- Note: Includes claims for which at least $1 of EI regular benefits was paid.
- Source: Employment and Social Development Canada, Employment Insurance (EI) administrative data. Data are based on a 10% sample of EI administrative data.
2.2.2 Coverage and eligibility to Employment Insurance regular benefits
As mentioned at the beginning of section 2.2, there are 3 eligibility criteria to qualify for EI regular benefits:
- the claimant must have had insurable employment and paid EI premiums during the qualifying period (defined as either the previous 52 weeks or since the establishment of their last claim, whichever is shorter). Beginning September 27, 2020, the EI temporary measures extended the qualifying period by 28 weeks for claimants who met certain criteriaFootnote 23
- have a valid reason for job separation according to the Employment Insurance Act
- have worked a minimum number of hours of insurable employment (ranging from 420 hours and 700 hours, depending on the regional unemployment rate where the claimant lived at the time of the establishment of the claim) during the qualifying period. Between September 27, 2020 and September 25, 2021, the EI temporary measures introduced a minimum unemployment rate for all EI regions of 13.1% and a one-time credit of 300 insurable hours for EI regular benefits. These allowed new EI regular claims to be established with only 120 hours of insurable employment during the qualifying period
This subsection provides an overview of the unemployed population and job separators in Canada for the second half of FY2021 in terms of these 3 eligibility criteria. The coverage and eligibility of EI regular benefits is not reported on during the first half of FY2021 as there was no access to new EI regular claims during this period due to the provisional CERB available at the time. Chart 8 outlines the timeline of rules in effect regarding coverage and eligibility during FY2021 and the original rules preceding this fiscal year.
Unlike previous Monitoring and Assessment Reports that used the Employment Insurance Coverage Survey (EICS)Footnote 24 as the base of the results, this year this subsection relies on the Labour Force Survey (LFS)Footnote 25 for coverage rates, the Records of Employment (ROE)Footnote 26 for eligibility rates, and information from the EI administrative dataFootnote 27 for a broader eligibility discussion. Because of these key changes in the source of these estimates, results from this subsection are not comparable to those of Monitoring and Assessment Reports of previous years.

Text description of Chart 8
| Criteria timeline | Coverage and eligiblity of EI regular benefits |
|---|---|
| Before March 15, 2020 | Employment Insurance original rules: In order to qualify for EI regular benefits, a worker must accumulate between 420 and 700 hours of insurable employment in the qualifying period, depending on the applicable regional rate of unemployment where the claimant resides. A higher regional unemployment rate corresponds to a lower required number of hours of insurable employment. The qualifying period is defined as the 52 weeks preceding a claim or the end of a previously established claim, whichever is shorter. EI regional unemployment rate 6.0% and under, variable entrance requirement 700 hours. EI regional unemployment rate 6.1% to 7.1%, variable entrance requirement 665 hours. EI regional unemployment rate 7.1% to 8.0%, variable entrance requirement 630 hours. EI regional unemployment rate 8.1% to 9.0%, variable entrance requirement 595 hours. EI regional unemployment rate 9.1% to 10.0%, variable entrance requirement 560 hours. EI regional unemployment rate 10.1% to 11.0%, variable entrance requirement 525 hours. EI regional unemployment rate 11.1% to 12.0%, variable entrance requirement 490 hours. EI regional unemployment rate 12.1% to 13.0%, variable entrance requirement 455 hours. EI regional unemployment rate more than 13.0%, variable entrance requirement 420 hours. |
| First half of FY2021, between April 1, 2020 and September 27, 2020 | No access to new EI regular claims |
| Second half of FY2021 (reporting period), between September 27, 2020 and March 31, 2021 | Employment Insurance temporary measures: The unemployment rate of all EI regions was temporarily set to 13.1%, effectively creating a flat entrance requirement of 420 hours of insurable employment needed to qualify for EI regular benefits. Additionally, a one-time credit of 300 hours was granted to all EI regular claimants so that they may qualify with 120 hours during the qualifying period. Finally, the qualifying period was extended by 28 additional weeks for those who received income support under CERB. |
Coverage of Employment Insurance regular benefits
The coverage rate of EI regular benefits shows the proportion of unemployed individuals who contributed to the EI program by paying EI premiums in the preceding 52 weeks prior to becoming unemployed. It is calculated by dividing the number of unemployed individuals who had insurable employment and paid EI premiums within the previous 52 weeks by the number of total unemployed individuals in Canada. This relies on Labour Force Survey data, differing from previous Monitoring and Assessment Reports, and so the results of this sub-subsection are not comparable to results published in prior years. In the second half of FY2021, the coverage rate was 64.8%, up from 63.5% in FY1920.Footnote 28
Higher coverage rates of EI regular benefits are usually observed during economic downturns, as slowing economic activities lead to layoffs that increase the share of unemployed EI contributors among all unemployed individuals. The coverage rates rose in 2009, corresponding with the FY0809 recession, and during the downturn in commodity prices in 2015 and 2016. The higher coverage rate observed in the second half of FY2021 can in turn be partially explained by the increase of unemployed EI contributors following the COVID-19 pandemic and its resulting economic impacts.
Table 11 outlines the coverage rates of EI regular benefits by province, gender, age in FY1920 and the second half of FY2021. Despite a slight decrease from the previous year, Prince Edward Island remained the province with the highest coverage rate. Nova Scotia (-8.7 p.p.), Newfoundland and Labrador (-6.5 p.p.), and British Columbia (-6.3 p.p.) all saw significant decreases in coverage rates with British Columbia having the lowest of all provinces in the second half of FY2021 at 58.4%. Conversely, Quebec saw the highest increase of 8.0 percentage points, with a coverage rate of 73.8% in the reporting period.
| Category | FY1920 | Second half of FY2021 | Change (percentage points) |
|---|---|---|---|
| Newfoundland and Labrador | 78.0% | 71.5% | -6.5 |
| Prince Edward Island | 82.4% | 81.6% | -0.8 |
| Nova Scotia | 75.2% | 66.5% | -8.7 |
| New Brunswick | 75.7% | 71.0% | -4.7 |
| Quebec | 65.7% | 73.8% | +8.0 |
| Ontario | 59.4% | 62.3% | +2.9 |
| Manitoba | 65.3% | 68.3% | +2.9 |
| Saskatchewan | 63.3% | 65.5% | +2.1 |
| Alberta | 61.6% | 61.9% | +0.2 |
| British Columbia | 64.7% | 58.4% | -6.3 |
| Men | 65.4% | 66.9% | +1.5 |
| Women | 61.4% | 62.2% | +0.9 |
| 24 years old and under | 55.4% | 58.2% | +2.8 |
| 25 to 44 years old | 65.7% | 68.4% | +2.8 |
| 45 years old and over | 67.8% | 65.8% | -2.0 |
| Canada | 63.5% | 64.8% | +1.3 |
- Source: Statistics Canada, Labour Force Survey (Public Use Microdata File), April 2019 to March 2020, October 2020 to March 2021.
Compared to FY1920, the coverage rate of both men and women saw slight increases in the second half of FY2021. Women continue to have lower coverage rates (62.2%) than men (66.9%) which can be explained by the fact that unemployed women are less likely to have recent insurable employment compared to unemployed men. The coverage rate of older unemployed individuals dropped slightly while it increased for both the unemployed 24 years and under as well as the unemployed aged between 25 and 44 years old. Despite a 2.8 percentage point increase, the coverage rate of the unemployed 24 years old and under (58.2%) remained significantly lower than the national average. This can be explained by the fact that unemployed youth are the least likely to have recent employment history (for instance, new graduates).
Eligibility for Employment Insurance regular benefits
As mentioned at the beginning of this subsection, applicants for EI regular benefits must meet 3 criteria to be considered eligible (they must have paid EI premiums, have a valid reason for job separation and have accumulated enough hours of insurable employment during their qualifying period). The eligibility rate is expressed as the share of job separatorsFootnote 29 with sufficient hours of insurable employment among those who meet the other 2 eligibility criteria. This relies on Records of Employment (ROE)Footnote 30 data, differing from previous Monitoring and Assessment Reports, and so the results of this sub-subsection are not comparable to prior years.Footnote 31 The eligibility rate is defined as the share of job separators who had enough hours of insurable employment from combined ROEs issued in the previous 52 weeks from the issue date of the latest ROE to qualify for EI regular benefits among all job separators.
The eligibility rates for EI regular benefits are sensitive to economic conditions and specific employment patterns during the reporting period. In the second half of FY2021, the eligibility rate for EI regular benefits increased significantly by 17.1 percentage points from FY1920 to 90.7%Footnote 32. Eligibility rates increased in all provinces and territories, for both genders, and for all age groups. The increase in the eligibility rate can in part be explained by the historically high number of job separations following the outbreak of the COVID-19 pandemic. Additionally, beginning in September 27, 2020, the temporary setting of the unemployment rate to 13.1% and the introduction of the one-time 300 hours credit, reduced the minimum entrance requirement and effectively allowed job separators to apply for EI regular benefits with 120 hours of insurable employment. This is significantly lower than the variable entrance requirements in place until March 15, 2020 (ranging from 420 hours to 700 hours).
As outlined in table 12, job separators in Newfoundland and Labrador had the highest eligibility rate (94.5%) among all provinces and territories in the second half of FY2021, followed by New Brunswick (93.5%) and Prince Edward Island (92.9%). The eligibility rate of Prince Edward Island increased the most (+20.5 p.p.) out of all provinces. All 3 territories also had significant increases in eligibility rates (ranging from +19.9 p.p. to +20.0 p.p.), with all having greater than the national average in the second half of FY2021. This contrasts with FY1920, where the territories had the lowest eligibility rates in Canada (ranging from 71.0% to 71.8%).
| Category* | Number of job separators (FY1920) | Number of eligible job separators*** (FY1920) | Eligibility rate (FY1920) | Number of eligible job separators (second half of FY2021) | Number of eligible job separators*** (second half of FY2021) | Eligibility rate (second half of FY2021) | Eligibility rate change (percentage points) |
|---|---|---|---|---|---|---|---|
| Newfoundland and Labrador | 86,577 | 64,301 | 74.3% | 53,866 | 50,880 | 94.5% | +20.2 |
| Prince Edward Island | 31,628 | 22,914 | 72.4% | 20,704 | 19,242 | 92.9% | +20.5 |
| Nova Scotia | 148,480 | 107,244 | 72.2% | 87,522 | 79,892 | 91.3% | +19.1 |
| New Brunswick | 128,754 | 99,659 | 77.4% | 82,322 | 76,995 | 93.5% | +16.1 |
| Quebec | 1,551,265 | 1,147,427 | 74.0% | 1,173,459 | 1,068,458 | 91.1% | +17.1 |
| Ontario | 2,224,767 | 1,605,585 | 72.2% | 1,643,600 | 1,483,139 | 90.2% | +18.1 |
| Manitoba | 277,961 | 209,355 | 75.3% | 164,740 | 148,037 | 89.9% | +14.5 |
| Saskatchewan | 139,049 | 106,499 | 76.6% | 76,717 | 69,640 | 90.8% | +14.2 |
| Alberta | 629,664 | 489,882 | 77.8% | 396,555 | 363,588 | 91.7% | +13.9 |
| British Columbia | 686,048 | 500,471 | 72.9% | 479,270 | 432,023 | 90.1% | +17.2 |
| Yukon | 7,567 | 5,373 | 71.0% | 4,264 | 3,878 | 90.9% | +19.9 |
| Northwest Territories | 8,142 | 5,844 | 71.8% | 4,554 | 4,176 | 91.7% | +19.9 |
| Nunavut | 5,191 | 3,719 | 71.6% | 2,846 | 2,608 | 91.6% | +20.0 |
| Men** | 3,160,342 | 2,412,289 | 76.3% | 2,236,396 | 2,033,480 | 90.9% | +14.6 |
| Women** | 2,938,416 | 2,074,470 | 70.6% | 2,001,848 | 1,745,074 | 87.2% | +16.6 |
| 24 years old and under | 1,440,208 | 782,344 | 54.3% | 827,789 | 693,121 | 83.7% | +29.4 |
| 25 to 44 years old | 2,653,103 | 2,119,445 | 79.9% | 1,838,925 | 1,698,529 | 92.4% | +12.5 |
| 45 to 54 years old | 875,431 | 713,928 | 81.6% | 610,271 | 570,783 | 93.5% | +12.0 |
| 55 years old and over | 1,130,016 | 871,042 | 77.1% | 1,105,570 | 1,012,046 | 91.5% | +14.5 |
| Canada | 6,098,758 | 4,486,759 | 73.6% | 4,382,555 | 3,974,479 | 90.7% | +17.1 |
- * The provinces and territories of the job separators are based on the employers’ postal codes. The sum for provinces and territories do not add up to the national total as some ROEs were missing this information.
- ** The ROEs in FY2021 are matched with a masked datafile of the Social Insurance Registry to associate them with the job separators’ gender and age. The sum for genders in FY2021 do not add up to the national total as some ROEs could not be matched.
- *** Number of job separators who met the minimum entrance requirements in the previous 52 weeks.
- Sources: Records of Employment (ROE) data (for information on hours of insurable employment in the qualifying period for job separators), Employment Insurance (EI) administrative data (for information on variable entrance requirements, and on gender and age of the job separators in FY1920) and Social Insurance Registry (for information on gender and age of the job separators in FY2021). ROE and EI administrative data are as of August 2021 and based on a 100% sample.
Compared to FY1920, the eligibility rate gap between genders closed slightly with the eligibility rate for women rising to 87.2% (versus 90.9% for men). The eligibility rate for those 24 years old and under, which historically is low (54.3% in FY1920) saw the most notable increase of +29.4 percentage points in the second half of FY2021. However, at 83.7%, this is still lower than the national eligibility rate and those of all other age groups in the reporting year. This can be interpreted as the EI temporary measures having a significantly positive impact on the eligibility for EI regular benefits of women and younger job separators.
Quits and the use of Employment Insurance regular benefits
One of the eligibility criteria to qualify for EI regular benefits is that the claimants have a valid reason for job separation according to the Employment Insurance Act. Claimants generally do not qualify for EI regular benefits if they voluntarily quit their jobs without a just cause. However, some justified reasons for quits, such as adverse working conditions, obligation to care for immediate family members, harassment or discrimination on a prohibited ground, may allow individuals to claim EI benefits.* A recent departmental study** examined the reasons for quits by demographic characteristics of individuals between 2013 and 2020. It was found that taking another job, returning to school and retirement were the main reasons for quits, together accounting for 93.1% of all quits during this period. Variations in the reasons for quits were also observed between men and women, and for individuals in different age groups. Furthermore, countercyclical patterns in the share of quits of all job separations to the business cycle was also evident.
The study also looked at the reasons for quits from the perspective of qualifying for EI benefits and found that almost 6 in every 10 quits (59.1%) during this period had a valid reason for job separation that could potentially qualify for EI benefits. However, among applicants for EI regular benefits between 2013 and 2019, only around 1 in every 10 applicants (10.6%) had quits as their reason for job separation, although the share of quits among all reasons for job separations during this period was much higher (32.7%). This implies that individuals who quit their jobs are much less likely to apply for EI regular benefits than those with other reasons for job separation. Nonetheless, a high proportion of these individuals (85.0% in 2019) were approved for EI regular benefits once they had submitted their applications.
- * Consult the Employment Insurance Act, section 29-30 for a detailed list of justified reasons for quits.
- ** ESDC, Quits and the use of Employment Insurance regular benefits (Ottawa: ESDC, Employment Insurance Policy Directorate, 2022).
2.2.3 Level of Employment Insurance regular benefits
The weekly benefit rate to which EI claimants are entitled is typically subject to the Variable Best Weeks (VBW) provision.Footnote 33 Under this provision, the weekly benefit rate that eligible claimants are entitled to receive is calculated as 55% of the average of their highest (best) weeks of insurable earnings during their qualifying period, up to the maximum weekly benefit rate.Footnote 34 The number of weeks used to calculate the weekly benefit rate ranges from 14 to 22, depending on the monthly regional unemployment rate of the claimant’s EI economic region at the time their claim is established (consult subsection 2.1.1 for the VBW table).
Claimants with children (under 18 years old) and low annual family income may be eligible for the Family Supplement provision. This can increase their benefit rate from 55% up to a maximum of 80% of their weekly insurable earnings, subject to the maximum weekly benefit rate (consult subsection 2.1.1 for additional details). The results on weekly benefit rates in this subsection include the Family Supplement amounts paid to eligible claimants.
As explained in section 2.0, in response to the COVID-19 pandemic, a minimum benefit rate was introduced under temporary EI measures for new EI claims established between September 27, 2020 and September 25, 2021. Claimants received a minimum benefit rate of $500 per week, up to the maximum weekly benefit rate. In addition, with the minimum unemployment rate set at 13.1% in all EI economic regions during this period, the number of best weeks of earnings used in the calculation of the weekly benefit rate was set to 14 weeks for all EI economic regions across Canada. If a claimant’s benefit rate based on this calculation was higher than the minimum $500, their benefit rate was set to that amount up to the maximum weekly benefit rate.
The average weekly benefit rate for EI regular benefits discussed in this subsection focuses on claims established between September 27, 2020 and March 31, 2021 for FY2021, given that CERB was in effect between April 1, 2020 and September 26, 2020 and no new claims for EI regular benefits could be established during that period (consult section 2.0 for more information).
In FY2021, the average weekly benefit rate for EI regular benefits was $534. Claimants from the territories received, on average, the highest weekly regular benefit rate at $552, followed by those from Alberta ($542), and Saskatchewan ($540). Claimants from Atlantic Canada (except for Newfoundland and Labrador) and Manitoba received the lowest weekly regular benefit rate (consult chart 9).
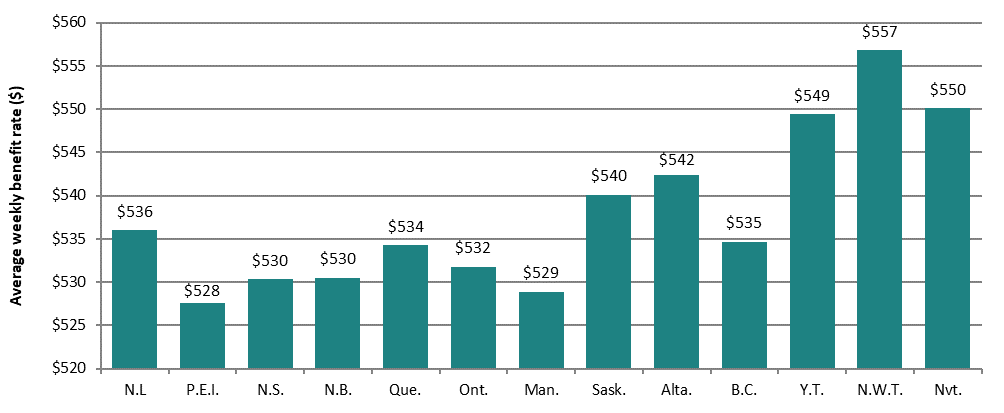
Text description of Chart 9
| Province or territory | Average weekly benefit rate ($) |
|---|---|
| NL | 536 |
| PEI | 528 |
| NS | 530 |
| NB | 530 |
| Que | 534 |
| Ont | 532 |
| Man | 529 |
| Sask | 540 |
| Alta | 542 |
| BC | 535 |
| YT | 549 |
| NWT | 557 |
| Nvt | 550 |
- Note: Includes all claims for which at least $1 of EI regular benefits was paid.
- Source: Employment and Social Development Canada, Employment Insurance (EI) administrative data. Data is based on a 10% sample of EI administrative data.
Table 13 outlines the average weekly regular benefit rates by age group for men and women in the reporting period. In FY2021, men had a higher average weekly regular benefit rate ($544) than women ($522). The overall gap in the average weekly benefit rate between men and women narrowed significantly for the first time in FY2021, from an average of $63 over the past 5 years to $22 in FY2021. This suggests that the minimum weekly benefit rate of $500 may have benefited more women than men.
Claimants aged 45 to 54 years had the highest average weekly regular benefit rate ($540) in FY2021, while those aged 24 years old and under received the lowest average weekly benefit rate ($514). When claimants are categorized by age group and gender, it can be seen that both men ($553) and women ($527) aged 45 to 54 years had the highest average weekly regular benefit rate in FY2021. However, the difference in the average weekly regular benefit rate between men and women was also the highest for claimants in this age group ($27).
| Age category | Men | Women | All claimants |
|---|---|---|---|
| 24 years old and under | $520 | $507 | $514 |
| 25 to 44 years old | $548 | $526 | $539 |
| 45 to 54 years old | $553 | $527 | $540 |
| 55 years old and over | $545 | $521 | $534 |
| Canada | $544 | $522 | $534 |
- Note: Includes all claims for which at least $1 in EI regular benefits was paid.
- Source: Employment and Social Development Canada, Employment Insurance (EI) administrative data. Data are based on a 10% sample of EI administrative data.
In terms of claimant category,Footnote 35 the average weekly regular benefit rate was the highest for both long-tenured workers and frequent claimants ($547), while the lowest was for occasional claimants ($526), which was below the national level ($534) (consult table 14).
| EI claimant category | Average weekly regular benefit rate |
|---|---|
| Long-tenured workers | $547 |
| Occasional claimants | $526 |
| Frequent claimants | $547 |
| Canada | $534 |
- Note: Includes all claims for which at least $1 in EI regular benefits was paid.
- Source: Employment and Social Development Canada, Employment Insurance (EI) administrative data. Data are based on a 10% sample of EI administrative data.
As outlined in table 15, 38.8% of all claims established for EI regular benefits in FY2021 received the maximum weekly benefit rate. The share of claims receiving the maximum weekly benefit rate established by men (52.0%) was more than double of those established by women (22.5%), which is partly attributable to the fact that a higher proportion of women work in part-time jobs than men, leading to a lower average weekly insurable earnings for them.
By age group, the share of claims receiving the maximum weekly benefit rate was the highest for claimants aged between 45 and 54 years (46.8%), while the lowest was for those who were aged 24 years and under (14.5%). Long-tenured workers and frequent claimants had the highest share of claims receiving the maximum weekly benefit rate in FY2021, both with 55.4%, while occasional claimants had the lowest share of claims (28.3%) at the maximum benefit rate.
In addition to the 38.8% at the maximum weekly benefit rate, 52.2% of claims received the minimum weekly benefit rate of $500 and the remaining 9.0% received between $500 and the maximum. The share of claims receiving the minimum weekly benefit rate was the highest for women (68.8%) compared to men (38.8%). Claimants under 24 years old had the highest share of claims receiving the minimum weekly benefit rate (79.4%), while those aged between 45 and 54 years had the lowest share of claims receiving the minimum weekly benefit rate (43.2%).
| Category | Share of claims that received the maximum weekly benefit rate | Share of claims that received the minimum weekly benefit rate |
|---|---|---|
| Men | 52.0% | 38.8% |
| Women | 22.5% | 68.8% |
| 24 years old and under | 14.5% | 79.4% |
| 25 to 44 years old | 44.0% | 46.9% |
| 45 to 54 years old | 46.8% | 43.2% |
| 55 years old and over | 39.5% | 50.7% |
| Long-tenured workers | 55.4% | 34.4% |
| Occasional claimants | 28.3% | 63.7% |
| Frequent claimants | 55.4% | 32.7% |
| Canada | 38.8% | 52.2% |
- Note: Includes all claims for which at least $1 in EI regular benefits was paid.
- * Consult annex 2.1 for definitions claimant categories referenced in this table.
- Source: Employment and Social Development Canada, Employment Insurance (EI) administrative data. Data are based on a 10% sample of EI administrative data.
2.2.4 Employment Insurance regular benefit entitlement
This subsection presents detailed analysis on the duration of EI regular benefits, both maximum entitlement and actual weeks used. Statistics presented in this subsection are based on claims that were completedFootnote 36 during the fiscal year. Statistics for the reporting fiscal year are preliminary estimates and are subject to revision in the future.
Maximum and actual duration of Employment Insurance regular benefits
Claimants who have successfully established an EI claim are entitled to a set maximum number of weeks of EI regular benefits, known as their entitlement. The maximum number of weeks for claims established prior to March 15, 2020, usually ranging between 14 and 45 weeks, was determined by the number of hours of insurable employment accumulated by claimants during the qualifying periodFootnote 37 and the effective unemployment rate in the claimant’s EI economic region at the time the claim is established.Footnote 38 As explained in section 2.0, the maximum entitlement for claims established on or after September 27, 2020 was increased to 50 weeks as part of the EI temporary measures.
The actual duration of a claim is the number of weeks of benefits an EI claimant actually receives during a claim. Average actual duration of EI regular claims is usually lower than the maximum entitlement, reflecting circumstances that can lead to reduced use of EI regular benefits over a claim’s benefit period (such as the claimant has found work and is no longer unemployed, has switched to EI special benefits or became unavailable to workFootnote 39).
Claims that were established prior to March 15, 2020 and were completed in FY2021 had an average maximum entitlement of 31.1 weeks and an average actual duration of 21.1 weeks. This is slightly higher than the claims completed in FY1920 (maximum entitlement of 29.7 weeks and average actual duration of 18.2 weeks). Out of the 2.5 million claims established in the second half of FY2021, approximately 450,000 (or 18.4%) were considered completed on March 31, 2021. These claims had an average actual duration of 8.6 weeks. Since their maximum entitlement was 50 weeks, these completed claims were relatively short. Therefore, the overall average duration is likely underestimated. Statistics based on more claims completed and more mature data will be presented in future Monitoring and Assessment Reports.
The average maximum entitlement of EI regular claims completed in FY2021 and established before March 15, 2020 varied significantly across provinces and territories, reflecting differences in regional labour market and labour force characteristics, as outlined in table 16. The EI regular claims established in Newfoundland and Labrador (39.6 weeks) had the highest average maximum entitlement, followed by Nunavut (39.2 weeks). These significantly higher maximum entitlements compared to the national average can be explained in part by the high unemployment rate observed in these jurisdictions (the unemployment rate was 14.5% in Newfoundland and Labrador and 12.2% in Nunavut in FY2021).Footnote 40 In comparison, EI regular claims established in Quebec had the lowest average entitlement (29.3 weeks), followed by British Columbia (29.5 weeks), and Ontario and Yukon (both 29.6 weeks).
The average maximum entitlement of EI regular claims was higher for men, and for claimants between 45 and 54 years old. Long-tenured workers generally have higher maximum entitlements than frequent and occasional claimants, as they are more likely to accumulate hours of insurable employment well above the minimum requirements for EI regular benefits (consult table 16).
| Category | Average maximum entitlement (weeks) for claims established before March 15, 2020 | Average maximum entitlement (weeks) for claims established in the second half of FY2021 | Average actual duration (weeks) for claims established before March 15, 2020p | Average actual duration (weeks) for claims established in the second half of FY2021p |
|---|---|---|---|---|
| Newfoundland and Labrador | 39.6 | 50 | 30.0 | 7.6 |
| Prince Edward Island | 34.3 | 50 | 24.6 | 9.0 |
| Nova Scotia | 33.8 | 50 | 24.8 | 9.6 |
| New Brunswick | 34.8 | 50 | 24.0 | 8.9 |
| Quebec | 29.3 | 50 | 18.1 | 7.5 |
| Ontario | 29.6 | 50 | 20.2 | 8.9 |
| Manitoba | 30.7 | 50 | 21.6 | 9.4 |
| Saskatchewan | 33.3 | 50 | 23.6 | 10.3 |
| Alberta | 32.6 | 50 | 23.5 | 9.4 |
| British Columbia | 29.5 | 50 | 20.4 | 9.5 |
| Yukon | 29.6 | 50 | 20.6 | 10.3 |
| Northwest Territories | 33.3 | 50 | 26.7 | 11.3 |
| Nunavut | 39.2 | 50 | 33.6 | 8.4 |
| Men | 31.6 | 50 | 21.2 | 8.7 |
| Women | 30.0 | 50 | 20.9 | 8.6 |
| 24 years old and under | 29.6 | 50 | 18.9 | 8.1 |
| 25 to 44 years old | 31.0 | 50 | 20.3 | 8.6 |
| 45 to 54 years old | 31.7 | 50 | 21.4 | 8.8 |
| 55 years old and over | 31.1 | 50 | 22.8 | 8.9 |
| Long-tenured workers* | 33.3 | 50 | 19.7 | 7.9 |
| Occasional claimants* | 29.9 | 50 | 20.6 | 8.8 |
| Frequent claimants* | 31.1 | 50 | 23.7 | 11.2 |
| Canada | 31.1 | 50 | 21.1 | 8.6 |
- Note: Includes all completed claims for which at least $1 of EI regular benefits was paid.
- * Consult annex 2.1 for definitions of EI claimant categories referenced in this table.
- P Preliminary data.
- Source: Employment and Social Development Canada, Employment Insurance (EI) administrative data. Data are based on a 10% sample of EI administrative data.
Similar to the average maximum entitlement, the average actual duration of EI regular benefits completed during the reporting period in provinces and territories were also affected by regional labour markets and labour force characteristics, leading to variations across provinces and territories.
EI regular claims established prior to March 15, 2020 and completed in FY2021 in Nunavut and in Newfoundland and Labrador had the highest average actual duration (33.6 weeks and 30.0 weeks, respectively). All provinces in the Atlantic and Prairies had an average duration higher than the national average (21.1 weeks). In comparison, Quebec (18.1 weeks), followed by Ontario (20.2 weeks) and British Columbia (20.4 weeks) posted the lowest average actual duration.
By gender, the average actual duration of claims completed for men and women was almost the same, at 21.2 weeks and 20.9 weeks, respectively. In terms of age groups, older claimants were likely to have higher average actual duration than younger claimants were (consult table 16). Furthermore, concerning claimant categories, on average, frequent claimants (23.7 weeks) benefitted longer actual duration than occasional claimants (20.6 weeks) and long-tenured workers (19.7 weeks).
In terms of industry breakdown and during the same period, EI regular claims completed by claimants from Finance, insurance, real estate, rental and leasing sector reported, on average, the highest actual duration (24.6 weeks), followed by those from Agriculture, forestry and mining and oil and gas extraction (23.6 weeks). Moreover, claims established by unemployed individuals from the Educational services sector had the lowest average actual duration (14.8 weeks) due to the seasonal nature of this sector and the relatively short and well-defined “off-season” over the summer months (consult annex 2.6.2).
For claims completed that were established in the second half of FY2021, the maximum entitlement was the same (50 weeks) for all claims. For those that no longer had any activity as of March 31, 2021, their average actual duration was 8.6 weeks. This varied across provinces and territories, with Northwest Territories having the highest average actual duration (11.3 weeks), followed by Yukon and Saskatchewan both with 10.3 weeks. Men and women registered almost the same average actual duration, 8.7 weeks and 8.6 weeks, respectively. Older claimants (55 years old and over) and frequent claimants posted the highest average actual duration, with 8.9 weeks and 11.2 weeks, respectively. From an industry perspective, EI regular claims from the Information, culture and recreation sector had the greatest average actual duration (10.4 weeks), followed by those from Agriculture, forestry and mining and oil and gas extraction (10.2 weeks).
Proportion of Employment Insurance regular benefit weeks used
As with the duration of EI regular benefits, a few factors may influence the proportion of entitlement used by claimants; for instance, the number of hours of insurable employment and the regional unemployment rates. Claimants with greater hours of insurable employment and those residing in regions with lower unemployment rates have higher entitlements and are more likely to find employment following a job separation and before they exhaust their weeks of EI benefits. Therefore, they use a lower proportion of their maximum entitlement for EI regular benefits. Consequently, greater maximum entitlements are generally associated with lower proportions of regular benefits’ weeks used.
The average proportion of EI regular benefit weeks used is defined as the average number of weeks of EI regular benefits received by claimants as a share of their maximum entitlement.
For claims completed in FY2021 that were established before March 15, 2020, the average proportion of EI regular benefit weeks used was 70.3%. The highest levels occurred in Nunavut (86.4%), Northwest Territories (81.9%) and Newfoundland and Labrador (76.8%). These higher proportions of EI regular benefits’ weeks used were associated with EI regular claims with the highest entitlements, on average. Among provinces and territories, Quebec was the only one that registered a proportion below the national level, 65.5%.
From a gender perspective, women used slightly more of their entitlement of EI regular benefits compared to men (71.0% and 69.9%, respectively). This result contrasts with what is observed historically. Indeed, during the past 5 years men used a slightly higher proportion of their entitlement weeks when compared to women.
Furthermore, the average proportion of regular benefit entitlement used increased with age—with older claimants (aged 55 and over) using the highest proportion of their regular benefits entitlement (75.6%) and younger claimants (aged 24 years or less) using the lowest proportion (66.7%).
Long-tenured workers (60.7%) used a lower portion of their EI regular benefit entitlement than occasional (71.2%) and frequent claimants (78.7%) did.Footnote 41 This discrepancy between categories of claimants can be explained by the fact that long-tenured workers generally have stronger labour market attachment, tend to have more weeks of entitlement, and collect fewer weeks of benefits. As such, they use a lower proportion of their benefit weeks. This also applies to claimants working while on claim, as they may have a stronger labour market attachment and may also defer weeks of EI regular benefits—leading to a lower proportion of their entitlement weeks used compared to claimants who did not work while on claim (consult table 17).Footnote 42
For claims established and completed during the second half of FY2021, the average proportion of weeks of EI regular benefits used was 17.2%. As indicated above, these completed claims were relatively short. Statistics on weeks of benefits used based on more mature data will be presented in future years’ report. The average proportion of weeks used varied by province and territory, gender, age group and claimant category, with Territories (20.8%) and claimants aged 55 years and older (17.9%) using a greater proportion of their regular benefit weeks in their respective categories. Women and men used almost the same proportion of their regular benefit weeks in the second period of FY2021 (17.3% and 17.1%, respectively).
| Category | Proportion of weeks of Employment Insurance regular benefits used for claims established before March 15, 2020p | Proportion of weeks of Employment Insurance regular benefits used for claims established in the second half FY2021p |
|---|---|---|
| Newfoundland and Labrador | 76.8% | 15.2% |
| Prince Edward Island | 74.4% | 17.9% |
| Nova Scotia | 75.7% | 19.1% |
| New Brunswick | 71.7% | 17.8% |
| Quebec | 65.5% | 14.9% |
| Ontario | 70.7% | 17.9% |
| Manitoba | 72.2% | 18.8% |
| Saskatchewan | 72.6% | 20.6% |
| Alberta | 74.0% | 18.9% |
| British Columbia | 71.1% | 18.9% |
| Yukon | 72.5% | 20.5% |
| Northwest Territories | 81.9% | 22.6% |
| Nunavut | 86.4% | 16.8% |
| Men | 69.9% | 17.3% |
| Women | 71.0% | 17.1% |
| 24 years old and under | 66.7% | 16.2% |
| 25 to 44 years old | 68.1% | 17.3% |
| 45 to 54 years old | 69.5% | 17.6% |
| 55 years old and over | 75.6% | 17.9% |
| Long-tenured workers* | 60.7% | 15.9% |
| Occasional claimants* | 71.2% | 17.5% |
| Frequent claimants* | 78.7% | 22.4% |
| Not working while on claim | 77.2% | 16.9% |
| Working while on claim | 64.2% | 17.7% |
| Canada | 70.3% | 17.2% |
- Note: Includes all completed claims for which at least $1 of EI regular benefits was paid.
- * Consult annex 2.1 for definitions of EI claimant categories referenced in this table.
- P Preliminary data.
- Source: Employment and Social Development Canada, Employment Insurance (EI) administrative data. Data are based on a 10% sample of EI administrative data.
Table 18 outlines the proportion of entitlement used, sorted by weeks of entitlement and regional unemployment rateFootnote 43 for claims completed in FY2021 that were established prior to March 15, 2020. The proportion of entitlement used generally fell as entitlement weeks increased, as claimants with shorter entitlement tend to use a greater proportion of their entitlement. As shown in Table 18, claimants with the lowest number of EI entitlement weeks (between 14 and 19 weeks) used 85.9% of their entitlement compared to claimants with the highest number of weeks of entitlement (45 weeks) who only used 58.3% of their entitlement in FY2021.
Furthermore, higher proportions of regular benefit weeks used were also associated with EI economic regions with higher unemployment rates. Indeed, the proportion of regular benefit weeks used generally increased with the regional unemployment rate. Regions with higher unemployment rates are often characterized by weaker labour market conditions. This is partly due to a greater importance of seasonal employment and therefore there is a larger share of frequent EI claimants in regions with high unemployment rates relative to EI economic regions with lower unemployment rates.
As illustrated in table 18, claimants in lower EI unemployment rate regions (6% or lower) used 69.4% of their weeks of entitlement compared to claimants in higher EI unemployment rate regions (13.1% and above), who used 75.2% of their entitlement.
| Category | Proportion of entitlement used for claims established before March 15, 2020p |
|---|---|
| Between 14 and 19 weeks of entitlement | 85.9% |
| Between 20 and 24 weeks of entitlement | 81.5% |
| Between 25 and 29 weeks of entitlement | 73.6% |
| Between 30 and 34 weeks of entitlement | 68.6% |
| Between 35 and 39 weeks of entitlement | 62.3% |
| Between 40 and 44 weeks of entitlement | 62.9% |
| 45 weeks of entitlement | 58.3% |
| Unemployment rate in the EI economic region of 6.0% or less | 69.4% |
| Unemployment rate in the EI economic region between 6.1% and 8.0% | 70.3% |
| Unemployment rate in the EI economic region between 8.1% and 10.0% | 66.9% |
| Unemployment rate in the EI economic region between 10.1% and 13.0% | 70.2% |
| Unemployment rate in the EI economic region of 13.1% or more | 75.2% |
| Canada | 70.3% |
- Note: Includes all completed claims for which at least $1 of EI regular benefits was paid.
- P Preliminary data.
- Source: Employment and Social Development Canada, Employment Insurance (EI) administrative data. Data are based on a 10% sample of EI administrative data.
2.2.5 Employment Insurance regular benefits and seasonal claimants
EI claimants who established at least 3 regular or fishing claims in the 5 years preceding the reference year, with at least 2 of these claims having started during the same period of the yearFootnote 44 as the current claim, are referred to as seasonal claimants. The definition of seasonal claimants is not exclusive of the definitions for other EI claimant categories.Footnote 45
The criterion that defines seasonal claimants is based on the timing of the current claims and previously established claims within past 5 years, which may or may not correspond with the timing of their seasonal layoff.
A total of 323,820 EI claims were established in the second half of FY2021Footnote 46 by seasonal claimants. Of these, 296,750 claims (91.6%) were for EI regular benefits and the remaining 27,070 claims were for EI fishing benefits.Footnote 47 The analysis presented in this subsection focuses only on seasonal regular claims.Footnote 48
Because EI regular claims in the reporting period could only be established during the second half of the fiscal year and were affected by simplified eligibility rules brought on by the temporary measuresFootnote 49 due to COVID-19, year-over-year comparison in the number of seasonal regular claims is not meaningful. Instead, this subsection mainly focuses on the distribution of claims across regions, and by gender and age groups. In addition, due to the seasonal pattern observed in the establishment of these claims,Footnote 50 only claims established in the third and fourth quarterFootnote 51 of previous fiscal years are considered.
The share of seasonal regular claims of all regular claims established in FY2021 was 12.0%, decreasing significantly from the level observed in the previous year (30.2%). Regular claims that could be identified as ‘seasonal’ remained relatively stable in FY2021 as they had to have a history of claims in the previous 5 years to meet the definition. During the same period, the number of EI regular claims established in the reporting year (2.47 million) increased by almost 1.8 times from the level observed in the previous year (1.37 million) notably because of the temporary measures that eased eligibility rules.
Table 19 outlines the number of EI seasonal regular claims in FY2021 and their share of total regular claims by regions, gender, age and industry. Generally, the share of seasonal regular claims of total regular claims are higher in the Atlantic provinces and Quebec, compared to the Western provinces and the territories. These regions also account for more than half of all seasonal regular claims in Canada. This is likely due to the composition of industries in these regions, which contains a large share of goods-producing industries, leading to a higher proportion of seasonal employment in these regions relative to the rest of the country. Among regions in FY2021, Quebec had the largest decrease in the share of seasonal regular claims of total regular claims from the previous year, followed by New Brunswick and Manitoba. The share of seasonal regular claims of total regular claims decreased significantly in FY2021 from the previous year for women, older claimants and those who worked in the services-producing industries (consult table 19).
| Category | Seasonal regular claims (number) in the second half of FY2021 | Seasonal regular claims as a share of total regular claims FY1920* | Seasonal regular claims as a share of total regular claims Second half of FY2021 | Change (% points) FY1920 to FY2021 |
|---|---|---|---|---|
| Newfoundland and Labrador | 24,750 | 44.6% | 30.4% | -14.2 |
| Prince Edward Island | 6,210 | 51.9% | 33.0% | -18.9 |
| Nova Scotia | 17,190 | 39.8% | 21.1% | -18.7 |
| New Brunswick | 26,070 | 48.0% | 28.5% | -19.5 |
| Quebec | 114,120 | 37.5% | 17.5% | -20.1 |
| Ontario | 60,960 | 26.1% | 7.2% | -18.9 |
| Manitoba | 7,290 | 28.8% | 9.6% | -19.2 |
| Saskatchewan | 7,430 | 20.8% | 12.3% | -8.5 |
| Alberta | 15,870 | 12.6% | 5.3% | -7.3 |
| British Columbia | 16,170 | 20.2% | 6.3% | -13.9 |
| Territories | 690 | 17.4% | 11.6% | -5.8 |
| Men | 230,780 | 30.8% | 16.8% | -14.0 |
| Women | 65,970 | 29.4% | 6.0% | -23.4 |
| 24 years old and under | 7,590 | 6.5% | 2.0% | -4.5 |
| 25 to 44 years old | 118,510 | 25.5% | 11.4% | -14.1 |
| 45 to 54 years old | 63,800 | 36.0% | 14.3% | -21.7 |
| 55 years old and over | 106,850 | 41.8% | 17.7% | -24.2 |
| Goods-producing industries | 169,270 | 34.6% | 25.4% | -9.3 |
| Services-producing industries | 116,380 | 27.9% | 7.0% | -21.0 |
| Unclassified** | 11,100 | 19.8% | 8.3% | -11.5 |
| Canada | 296,750 | 30.2% | 12.0% | -18.2 |
- Note: Includes claims for which at least $1 of EI regular benefits was paid. Change in percentage points are based on unrounded numbers.
- * Unlike seasonal regular claims, total regular claims generally do no vary by quarters. Hence, the full year of FY1920 is considered here to have entirety in the comparison between FY1920 and FY2021. As explained above, regular claims could only be established in the second half of FY2021.
- ** For some claims, this information was not available in the data.
- Source: Employment and Social Development Canada, Employment Insurance (EI) administrative data. Data are based on a 10% sample of EI administrative data.
Of the 296,750 seasonal regular claims established in FY2021, the largest share (38.5%) was established in Quebec, followed by claims established in the Atlantic provinces (25.0%) and Ontario (20.5%). As illustrated in chart 10, the share of seasonal regular claims established in Quebec declined in FY2021 for the fourth consecutive year, whereas in Atlantic provinces and Ontario they have remained relatively unchanged. Notably, the share of seasonal regular claims established in the Western provinces reached the highest level (15.8%) in the past 10 years during the reporting period.
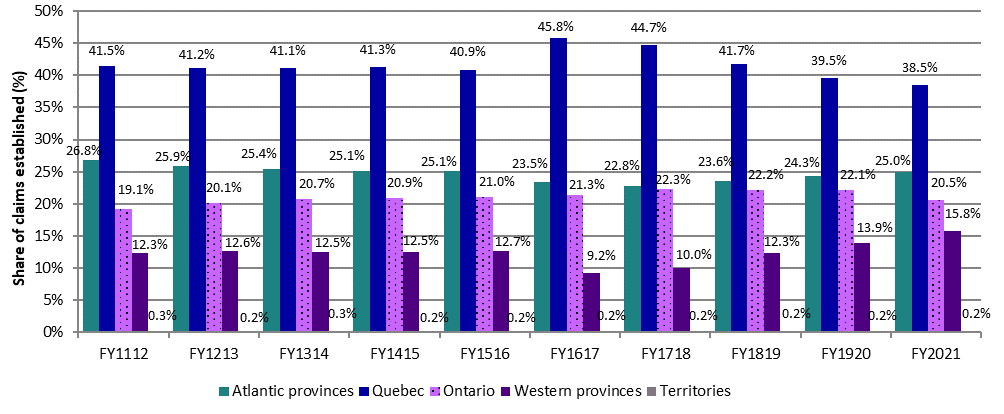
Text description of Chart 10
| Region | FY1112 | FY1213 | FY1314 | FY1415 | FY1516 | FY1617 | FY1718 | FY1819 | FY1920 | FY2021 |
|---|---|---|---|---|---|---|---|---|---|---|
| Atlantic provinces | 26.8% | 25.9% | 25.4% | 25.1% | 25.1% | 23.5% | 22.8% | 23.6% | 24.3% | 25.0% |
| Quebec | 41.5% | 41.2% | 41.1% | 41.3% | 40.9% | 45.8% | 44.7% | 41.7% | 39.5% | 38.5% |
| Ontario | 19.1% | 20.1% | 20.7% | 20.9% | 21.0% | 21.3% | 22.3% | 22.2% | 22.1% | 20.5% |
| Western provinces | 12.3% | 12.6% | 12.5% | 12.5% | 12.7% | 9.2% | 10.0% | 12.3% | 13.9% | 15.8% |
| Territories | 0.3% | 0.2% | 0.3% | 0.2% | 0.2% | 0.2% | 0.2% | 0.2% | 0.2% | 0.2% |
- Note: Includes claims for which at least $1 of EI regular benefits was paid.
- Source: Employment and Social Development Canada, Employment Insurance (EI) administrative data. Data are based on a 10% sample of EI administrative data.
Table 20 outlines the distribution of seasonal regular claims established by gender, age group and industry classification in the past 10 years. As mentioned, only claims established in the third and fourth quarter are considered for previous years so that their compositions are comparable with claims established in FY2021.
| Category | FY1112 | FY1213 | FY1314 | FY1415 | FY1516 | FY1617 | FY1718 | FY1819 | FY1920 | FY2021 | Change (% points) FY1920 to FY2021 |
|---|---|---|---|---|---|---|---|---|---|---|---|
| Men | 77.3% | 77.4% | 77.9% | 78.5% | 79.6% | 78.7% | 78.6% | 78.6% | 78.6% | 77.8% | -0.8 |
| Women | 22.7% | 22.6% | 22.1% | 21.5% | 20.4% | 21.3% | 21.4% | 21.4% | 21.4% | 22.2% | +0.8 |
| 24 years old and under | 3.9% | 3.8% | 3.5% | 3.5% | 3.4% | 3.0% | 2.8% | 2.5% | 2.5% | 2.6% | 0.0 |
| 25 to 44 years old | 38.3% | 37.8% | 38.0% | 38.3% | 38.5% | 39.6% | 39.5% | 39.4% | 39.0% | 39.9% | +0.9 |
| 45 to 54 years old | 29.4% | 28.6% | 27.6% | 26.6% | 25.9% | 24.8% | 23.6% | 23.1% | 22.7% | 21.5% | -1.2 |
| 55 years old and over | 28.4% | 29.8% | 30.9% | 31.6% | 32.1% | 32.7% | 34.1% | 34.9% | 35.8% | 36.0% | +0.3 |
| Goods-producing industries | 56.8% | 55.8% | 57.0% | 55.8% | 57.8% | 55.5% | 57.5% | 58.4% | 58.2% | 57.0% | -1.2 |
| Services-producing industries | 40.9% | 40.1% | 40.1% | 38.8% | 39.5% | 39.7% | 40.5% | 40.2% | 39.1% | 39.2% | +0.1 |
| Unclassified* | 2.3% | 4.1% | 2.8% | 5.4% | 2.7% | 4.8% | 2.0% | 1.4% | 2.7% | 3.7% | +1.0 |
- Note: Includes claims for which at least $1 of EI regular benefits was paid. Change in percentage points are based on unrounded numbers.
- * For some claims, this information was not available in the data.
- Source: Employment and Social Development Canada, Employment Insurance (EI) administrative data. Data are based on a 10% sample of EI administrative data.
Notably, the share of seasonal regular claims established by claimants aged between 45 and 54 years has been decreasing in the past 10 years, whereas the share of claims established by older claimants (aged 55 years and over) has been increasing during this period. Younger claimants (aged 24 years and under) accounted for only 2.6% of total seasonal regular claims in FY2021, slightly down from 3.9% observed a decade ago. Although younger individuals are more likely to work in seasonal jobs (consult the text box ‘Seasonal workers in the Labour Force Survey’ below), a larger share of them tend to quit jobs and return to school, which is an invalid reason for job separation under the Employment Insurance Act. Because of their ineligibility to qualify for EI regular benefits, these younger individuals are less likely to have established 3 EI regular claims in the past 5 years and meet the definition to be classified as seasonal claimants.
Not much variation in the share of claims across other categories was observed in FY2021 from the previous year, as well as over the past 10 years (consult table 20).
Seasonal workers in the Labour Force Survey
Every month, Statistics Canada provides information on employment, unemployment and other key labour market indicators by a variety of demographic characteristics through the Labour Force Survey (LFS). The LFS defines seasonal workers as those whose employment is in an industry where employment levels rise and fall with the seasons. This is different from the definition used for EI claim purposes, which is not related to a claimant’s industry of employment, but rather is based on the claimant’s recent history of EI regular or fishing benefits usage.
According to the LFS, there were 300,500 seasonal workers in Canada* for the full year in FY2021, down significantly (-25.8%) from the level observed in the previous year (405,100 seasonal workers). This is attributable to the labour market disruptions in the reporting period due to COVID-19. The number of seasonal workers decreased across all provinces in FY2021 compared with the previous year, with the most significant relative change observed in Quebec where seasonal employment was down by almost one-third (-32.0%) from the level observed in FY1920. The decrease in the number of seasonal workers in the services-producing industries was more significant than the decrease in the goods-producing industries (-27.6% and -22.4%, respectively). Seasonal employment in the Finance, insurance, real estate, rental and leasing industry (-46.9%), Other services except public administration industry (-45.6%) and the Accommodation and food services industry (-41.1%) were particularly hit by the disruptions caused by COVID-19.
Nationally, seasonal workers represented 2.0% of total employment and 17.3% of temporary employment in FY2021, down slightly from last year (2.5% and 19.6%, respectively). In Atlantic provinces, seasonal workers accounted for 4.5% of total employment in FY2021, down slightly from the previous year (5.5%). In comparison, seasonal workers accounted for only 1.9% of total employment in the Western provinces in FY2021.
Historically, younger individuals aged between 15 and 24 years are more likely to work in seasonal jobs, attributed to summer employment patterns for students. In FY2021, they represented 43.7% of total seasonal employment. Similar to the pattern observed for EI seasonal regular claims, men are over-represented in seasonal employment—in FY2021, they accounted for 65.5% of all seasonal employment, increasing slightly from the previous year (62.8%).
Seasonal employment is largely concentrated in the services-producing sector. In FY2021, slightly less than two-thirds (64.2%) of all seasonal jobs were in the services-producing sector. The Information, culture and recreation industry (14.9% of all seasonal jobs) and the Wholesale and retail trade industry (11.5% of all seasonal jobs) accounted for over a quarter (26.4%) of all seasonal jobs in Canada in FY2021. On the other hand, the Construction industry in the goods-producing sector accounted for nearly one-fifth (18.7%) of all seasonal jobs in FY2021, relatively unchanged from the previous year.
- * Statistics Canada, Labour Force Survey, Table 14-10-0071-01.
Duration of Employment Insurance regular benefits among seasonal claimants
The average maximum entitlementFootnote 52 of seasonal regular claims that were established before March 15, 2020 and completedFootnote 53 in FY2021 was 30.9 weeks, whereas for claims established and completed in the second half of FY2021 it was 50.0 weeks. The increased entitlement for claims established and completed in the second half of FY2021 was attributable to the temporary measuresFootnote 54 introduced to facilitate access to EI benefits. The average maximum entitlement of non-seasonal claims that were established before March 15, 2020 and completed in FY2021 was 31.1 weeks.
The average actual durationFootnote 55 of seasonal regular claims established before March 15, 2020 and completed in FY2021 was 20.5 weeks, whereas for those established and completed in the second half of FY2021 it was 9.3 weeks. The average actual duration of non-seasonal regular claims established before March 15, 2020 and completed in FY2021 was 21.4 weeks, whereas for those established and completed in the second half FY2021, it was 8.5 weeks. The average actual duration of claims established and completed in the second half of FY2021 is likely underestimated.Footnote 56 The average maximum duration and the average actual duration of regular benefits are generally shorter for seasonal regular claimants than for non-seasonal regular claimants, reflecting the fact that seasonal claimants typically accumulate fewer hours of insurable employment prior to establishing a claim than non-seasonal claimants. However, the higher average actual duration for seasonal regular claims in the reporting fiscal year (20.5 weeks) compared to FY1920 (16.7 weeks) are likely due to the additional weeks of EI regular benefits provided to eligible seasonal claimants under current seasonal measures that have been in place since August 2018.Footnote 57
Current seasonal measure: Additional weeks of EI regular benefits for seasonal claimants in 13 EI economic regions*
To better support seasonal workers, the Government of Canada introduced seasonal measures under a pilot project (no. 21) in August 2018. These seasonal measures provide 5 additional weeks of EI regular benefits to eligible seasonal claimants in 13 EI economic regions**, up to a maximum of 45 weeks of EI regular benefits in total. Under this measure, eligible seasonal claimants in these 13 EI economic regions who start a benefit period between August 5, 2018 and October 29, 2022 may receive additional weeks of EI regular benefits.***
Of the 252,000 eligible EI seasonal regular claims that were established on or after August 5, 2018 and were completed by March 31, 2021 in these 13 EI economic regions, a total of 106,500 claims (42.3%) received additional weeks of EI regular benefits under the current seasonal measure. The largest share of these claims that received additional weeks was in Central Quebec (17.7%), followed by Restigouche-Albert (14.5%), Newfoundland and Labrador (14.4%) and Lower Saint Lawrence and North Shore (12.4%). Together, these EI economic regions accounted for almost 3 in 5 (59.0%) of the total seasonal regular claims that received additional weeks. Men accounted for almost two-thirds (65.6%) of these claims while almost half of them (49.3%) was established by older claimants aged 55 years and over. Around 1 in 5 (20.5%) of the claims that received additional weeks were established by claimants who had worked in the Construction industry. Among services-producing industries, claimants who had worked in the Accommodation and food services industry accounted for almost 1 in 10 claims (9.2%) that received additional weeks.
Around two-thirds (66.4%) of the completed seasonal claims received the full additional 5 weeks. On average, eligible seasonal claims in these 13 EI economic regions received 4.2 additional weeks of EI regular benefits. The additional number of benefit weeks received was identical for men and women, and across different age groups. Claimants who had worked in the Educational services industry received the highest average additional weeks of benefits (4.4 weeks) while those who had worked in the Manufacturing industry had the lowest (4.0) average weeks. Overall, seasonal regular claims that received additional weeks of benefits under the seasonal measure and were completed in FY2021 received 30.7 weeks of EI regular benefits in total, compared with the average of 19.7 weeks received by seasonal regular claims completed in FY2021 in the same 13 EI economic regions that were eligible for additional weeks but did not receive any.
By the end of FY2021, a total of $181.8 million in additional benefits had been paid to eligible seasonal claims that received additional weeks under the seasonal measure. On average, each eligible claim received $1,707. Claims established by men received almost 1.3 times the additional amount received by women ($1,853 and $1,429, respectively). Seasonal claims established by those who had worked in the goods-producing industries received $1,857 on average, compared with the average of $1,558 received by those who had worked in the services-producing industries. Among all industries, seasonal claims established by individuals who had worked in the Mining, oil and gas extraction industry received the highest amount on average ($2,067).
- * Results presented here are based on a 100% sample of Employment Insurance (EI) administrative data. Data are preliminary and are as of October 2021.
- ** These selected EI economic regions are: Newfoundland-Labrador (excluding St. John’s), Charlottetown, Prince Edward Island, Eastern Nova Scotia, Western Nova Scotia, Madawaska-Charlotte, Restigouche-Albert, Gaspésie-Îles-de-la-Madeleine, Central Quebec, North Western Quebec, Lower Saint Lawrence and North Shore, Chicoutimi-Jonquière and Yukon (excluding Whitehorse).
- *** Except for EI regular claims established between September 27, 2020 and September 25, 2021, during which period no additional weeks of EI regular benefits under the current seasonal measure were provided. Claims established during this period were entitled to a maximum of 50 weeks of EI regular benefits under the temporary measures introduced to facilitate access to EI benefits following the economic and labour market disruptions caused by the COVID-19 pandemic. Consult section 2.0 for a list of these temporary measures. In addition, the Canada Emergency Response Benefit (CERB) provided up to 28 weeks of benefits between March 15, 2020 and October 3, 2020. During this period no EI regular claims could be established, and therefore no additional weeks of benefits were provided under the current seasonal measure.
Overlapping definitions of seasonal and frequent claimants
Frequent claimants are those who have had 3 or more regular or fishing claims and have collected benefits for more than 60 weeks in total within the past 5 years. There is a significant overlap between the definition of frequent and seasonal claimants.Footnote 58
In FY2021, there were 289,080 EI regular claims that were established by frequent claimants (compared with 296,750 seasonal regular claims). This suggests that many seasonal regular claimants collect less than 60 weeks of EI regular benefits over the course of 5 fiscal years, while a large proportion of frequent claimants can also be considered seasonal. This is illustrated in chart 11—in FY2021, the number of claims established by claimants who could be classified as both seasonal and frequent was 203,640, more than twice as many claims as those established by seasonal claimants who were non-frequent (93,110 claims).
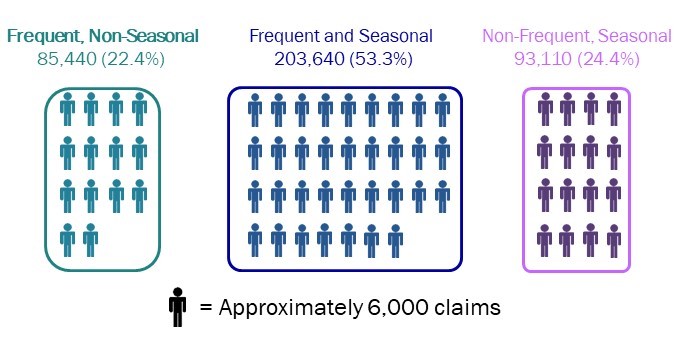
Text description of Chart 11
| Category | Level of claims | Share of total frequent and seasonal claims |
|---|---|---|
| Frequent, non-seasonal | 85,440 | 22.4% |
| Frequent and seasonal | 203,640 | 53.3% |
| Non-frequent, seasonal | 93,110 | 24.4% |
- Note: Includes claims for which at least $1 of EI regular benefits was paid.
- * Consult annex 2.1 for definitions of frequent and seasonal claimants referenced in this chart.
- Source: Employment and Social Development Canada, Employment Insurance (EI) administrative data. Data are based on a 10% sample of EI administrative data.
When the 2 non-overlapping populations by claimant type (the frequent, non-seasonal claimants and the non-frequent, seasonal claimants) are characterized in terms of average duration, proportion of regular entitlement weeks paid and exhaustion rate, some differences can be observed. Among seasonal claimants in FY2021, those who could also be classified as frequent claimants received, on average, EI regular benefits for a much longer duration, used a greater proportion of their regular entitlement weeks and were more likely to exhaust their entitlement than their non-frequent counterparts. However, once defined as frequent claimants, the differences in average duration, proportion of regular entitlement weeks paid and exhaustion rate between seasonal and non-seasonal claimants become less significant (consult table 21). In the reporting year, claimants who could be classified as both frequent and seasonal were less likely to exhaust their EI regular benefits compared to those who were frequent and non-seasonal. This was likely due to the current seasonal measures that provided additional weeks of EI regular benefits to eligible seasonal claimants in 13 EI economic regions.
| Claimant type | Average duration of EI regular benefits (in weeks)p | Proportion of regular benefits paid (%)p | Exhaustion rate (%)p |
|---|---|---|---|
| Frequent, non-seasonal | 22.3 | 72.3% | 35.3% |
| Frequent and seasonal | 22.5 | 73.2% | 27.7% |
| Non-frequent, seasonal | 13.8 | 46.5% | 12.7% |
- Note: Completed claims include those that are terminated and those that are dormant and remained inactive as of August the following fiscal year.
- * Consult annex 2.1 for definitions of frequent and seasonal claimants referenced in this chart.
- p Preliminary data.
- Source: Employment and Social Development Canada, Employment Insurance (EI) administrative data. Data are based on a 10% sample of EI administrative data.
2.2.6 Exhaustion of Employment Insurance regular benefits
As mentioned in subsection 2.2.4, entitlement for EI regular benefits depends on 2 factors—the regional unemployment rate where the applicants lived at the time of establishing the claim, and the number of hours of insurable employment accumulated in the previous 52 weeks or since the establishment of their last claim, whichever is shorter. Entitlement for claims established prior to September 27, 2020 (first half of FY2021) generally ranged from 14 weeks to a maximum of 45 weeks.Footnote 59 For claims established on or after September 27, 2020 (second half of FY2021), the maximum entitlement was increased to 50 weeks as part of the EI temporary measures (consult section 2.0).
Claimants have exhausted their entitlement to EI regular benefits when the number of weeks of benefits received (actual duration) equals the entitlement available over the course of the benefit period (the period during which an EI claimant can receive EI benefits). The incidence of exhaustion of EI regular benefit entitlement can inform analysis related to the adequacy of EI regular benefits provided to those looking for suitable employment following a job separation.
Since a claim must be completedFootnote 60 in order to determine whether the entitlement is exhausted or not, the analysis in this section focuses on EI regular claims completed during FY2021, regardless of their start date.
Entitlement exhaustion of Employment Insurance regular benefits
Of the total EI regular claims completed in the reporting fiscal year that were established before March 15, 2020, 37.0% (or 362,600) exhausted their entitlement, slightly higher than the exhaustion rate of 33.1% for EI regular claims completed in FY1920. Given the entitlement was 50 weeks, no EI regular claim established in the second half of FY2021 had exhausted its entitlement before March 31, 2021. As a result, the analysis of the entitlement exhaustion of EI regular benefits focused only on completed claims established before March 15, 2020.
The high proportion of EI regular claims completed in FY2021 with entitlement exhaustion can be attributed in part to a substantial economic slowdown observed beginning in the last quarter of FY1920.
In FY1920, the number of EI regular claims increased by 5.8%, with most of this increase occurring during the last quarter of the fiscal year. Indeed, in March 2020, employment fell by almost 1 million and the unemployment rate increased to 7.9% because of the COVID-19 pandemic. Almost all Canadian industries were affected by the COVID-19 economic shutdown. Because of the sharp decline in labour market activity starting in March 2020 and the high unemployment rates, unemployed individuals who received EI regular benefits following a job separation were not able to find employment as quickly as during stable economic times. This is reflected by the upward trend observed for the entitlement exhaustion rate in FY2021.
During the reporting period, the entitlement exhaustion rate varied across provinces and territories. Nunavut, Northwest Territories and Alberta registered the highest entitlement exhaustion rates (67.4%, 58.6% and 45.9% respectively). Conversely, Quebec and Atlantic Canada posted the lowest entitlement exhaustion rates (consult table 22).
Generally, claims established by women tend to have a higher entitlement exhaustion rate compared to those established by men. This held true in FY2021, with an entitlement exhaustion rate of 38.9% for women and 35.9% for men. This may be due to the fact that women, on average, tend to qualify for fewer weeks of entitlement of EI regular benefits. A higher proportion of women also work in part-time and/or temporary jobs than men, and thus accumulate, on average, fewer hours of insurable employment.
By age group, claimants aged 55 and over had the highest entitlement exhaustion rate (40.2%), followed by those aged 24 and under (39.1%). These claimants tend to exhaust their entitlement more often, which may reflect the challenges they face in securing new employment following a job loss. In comparison, claimants between 45 and 54 years old had the lowest entitlement exhaustion rate (34.3%), followed by those aged 25 to 44 (35.8%).
Occasional claimants tended to exhaust their entitlement more often (42.0%) than frequent claimants (32.1%) and long-tenured workers (31.3%), both of whom had lower exhaustion rates than the national level (37.0%).
| Category | Entitlement exhaustion rate Claims established before March 15, 2020p | Benefit period exhaustion rate Claims established before March 15, 2020p |
|---|---|---|
| Newfoundland and Labrador | 32.7% | 29.4% |
| Prince Edward Island | 34.2% | 24.4% |
| Nova Scotia | 39.3% | 24.2% |
| New Brunswick | 29.5% | 27.5% |
| Quebec | 29.7% | 26.6% |
| Ontario | 41.1% | 26.1% |
| Manitoba | 39.6% | 28.4% |
| Saskatchewan | 41.3% | 26.2% |
| Alberta | 45.9% | 28.1% |
| British Columbia | 42.4% | 28.4% |
| Yukon | 41.4% | 26.1% |
| Northwest Territories | 58.6% | 19.5% |
| Nunavut | 67.4% | 23.9% |
| Men | 35.9% | 25.6% |
| Women | 38.9% | 29.3% |
| 24 years old and under | 39.1% | 23.7% |
| 25 to 44 years old | 35.8% | 28.0% |
| 45 to 54 years old | 34.3% | 28.5% |
| 55 years old and over | 40.2% | 25.0% |
| Long-tenured workers | 31.3% | 30.1% |
| Occasional claimants | 42.0% | 26.5% |
| Frequent claimants | 32.1% | 24.2% |
| Canada | 37.0% | 26.9% |
- Note: Includes all completed claims for which at least $1 of EI regular benefits was paid.
- * Consult annex 2.1 for definitions of EI claimant categories referenced in this table.
- p Preliminary data.
- Source: Employment and Social Development Canada, Employment Insurance (EI) administrative data. Data are based on a 10% sample of EI administrative data.
Entitlement exhaustion versus benefit period exhaustion
While claims may end when the number of weeks of benefits received equals the entitlement over the course of the benefit period, they may also end when the benefit period ends before all potential regular benefit weeks of entitlement have been paid.Footnote 61 When this occurs, unless the claimant has stopped filing EI biweekly reports,Footnote 62 the claim is considered to have exhausted its benefit period. Generally, the benefit period exhaustion rate is lower than the entitlement exhaustion rate.
In FY2021, 26.9% of all completed EI regular claims established before March 15, 2020 exhausted their benefit period (consult table 22). At the time of analysis, no EI regular claim established during the second half of FY2021 had exhausted its benefit period by March 31, 2021. As a result, the benefit period exhaustion analysis only focused on completed claims established before March 15, 2020.
Example: Entitlement exhaustion versus benefit period exhaustion
David works as a full-time sales person at a car dealership in Saskatoon, Saskatchewan. Due to unfavourable economic conditions, car sales in Saskatoon have plummeted and he is laid off on September 6, 2019. Following the job separation, David applies for EI regular benefits. After carefully going through his application, Service Canada decides that David is eligible and entitled to receive 19 weeks of EI regular benefits based on his accumulated hours of insurable employment during the qualifying period and the regional unemployment rate. Service Canada establishes David’s benefit period (during which benefits may be collected) starting the week of September 22, 2019 for a length of 52 weeks. David starts receiving EI regular benefits in the week staring September 22, 2019.
Scenario: Entitlement exhaustion
David is unable to find suitable employment for the next 19 weeks since starting to receive EI regular benefits. As of February 1, 2020, he has received his full entitlement of 19 weeks of EI regular benefits. In this situation, David is said to have exhausted his regular benefit entitlement as the number of weeks of benefits received equals the entitlement available during the benefit period. This is illustrated below.
Figure 1
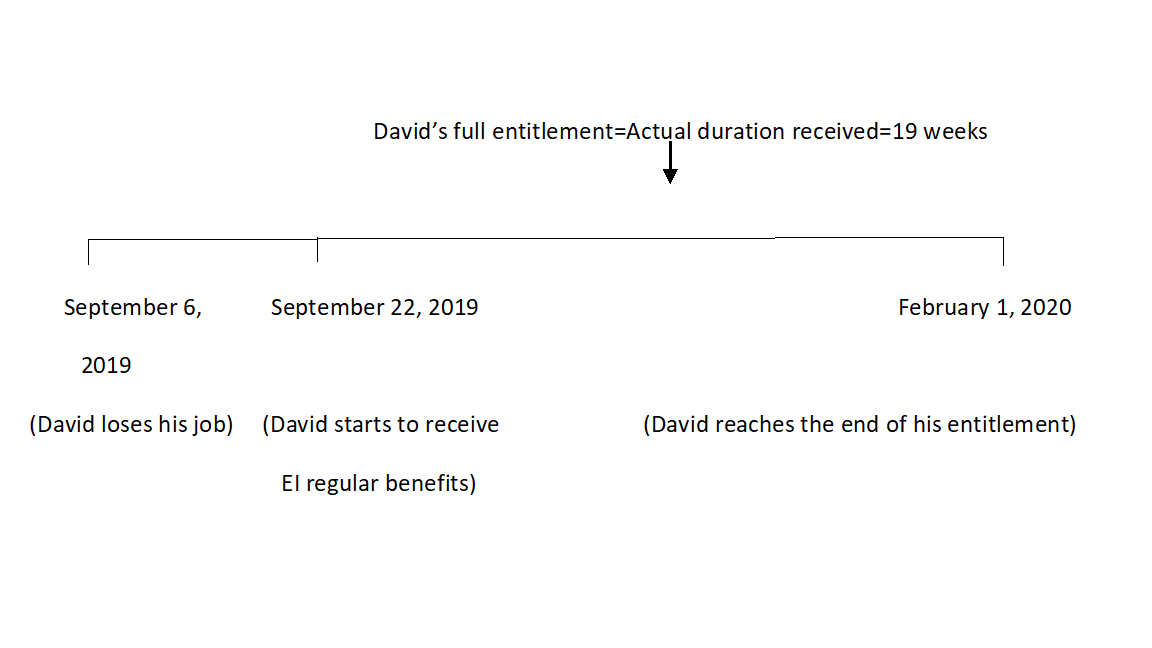
Text description of figure 1
David’s full entitlement = actual duration received = 19 weeks
September 6, 2019: David loses his job
September 22, 2019: David starts to receive EI regular benefits
February 1, 2020: David reaches the end of his entitlement
Scenario: Benefit period exhaustion
In this scenario, David started receiving EI regular benefits in the week starting September 22, 2019 and continued for the next 15 weeks until January 4, 2020. At that point, David decided to switch to parental benefits, as he became a parent on December 30, 2019. David shared his parental benefits with his spouse and received benefits for the next 37 weeks until September 19, 2020. David also found new employment as of September 20, 2020. As David’s benefit period ended before he could collect all 19 weeks of EI regular benefits that he was entitled to, in this case David is said to have exhausted his benefit period. This is illustrated below.
Figure 2
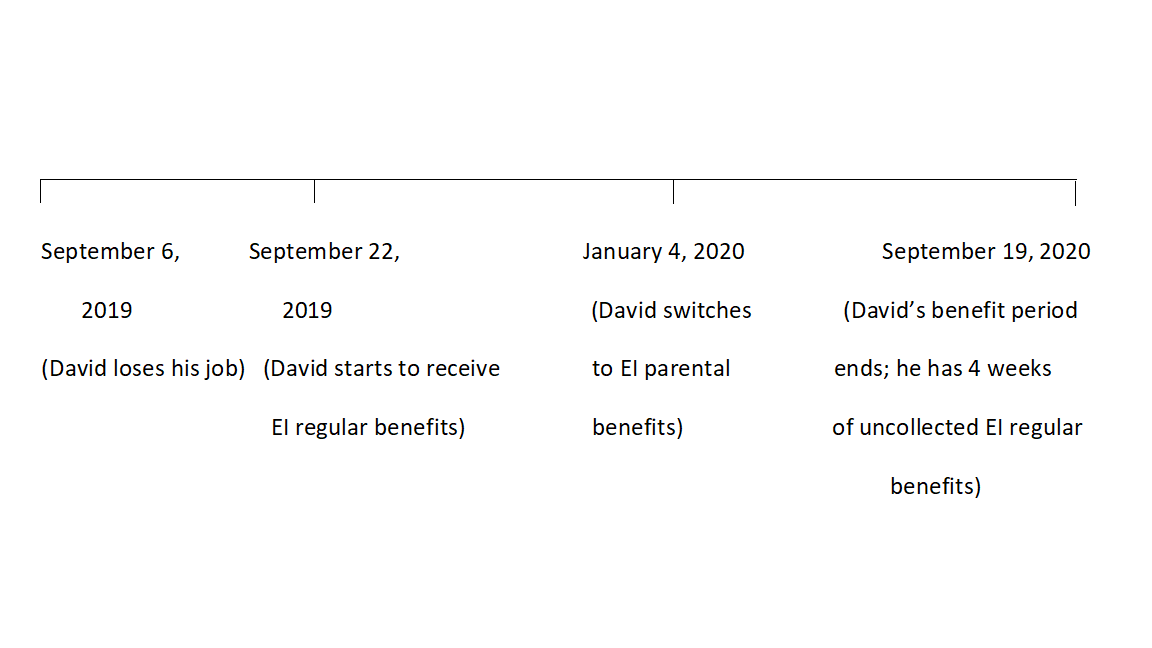
Text description of figure 2
September 6, 2019: David loses his job
September 22, 2019: David starts to receive EI regular benefits
January 4, 2020: David switches to EI parental benefits
September 19, 2020: David’s benefit period ends; he has 4 weeks of uncollected EI regular benefits
The circumstances that result in benefit period exhaustion are generally different from those associated with entitlement exhaustion. Many variables influence benefit period exhaustion, including regular benefit entitlement, weeks worked while on claim (leading to deferred benefit weeks) and the use of special benefits (adding another type of entitlement to the claim). Table 23 outlines different characteristics of completed EI regular claims by exhaustion type in the reporting year. For instance, when completed EI regular claims are categorized by their seasonality status, seasonal claims are seen to have lower entitlement exhaustion rates than non-seasonal claims, but this result is reversed when benefit period exhaustion is considered. This implies that seasonal claimants are less likely to collect EI regular benefits for the full duration of their entitlement than non-seasonal claimants, most likely due to the predictability of their work pattern.Footnote 63
In FY2021, completed EI regular claims established in EI economic regions with unemployment rates of 6.0% or less had, on average, the highest entitlement exhaustion rate (38.5%), while those established in EI economic regions with unemployment rate between 8.1% and 10.0% had, on average the highest benefit period exhaustion rate (33.6%). Furthermore, a much greater proportion of claims that exhausted the benefit period included at least 1 week worked while on claim (68.6%) compared with claims that exhausted their entitlement (34.3%). This is likely due to the Working While on Claim provision that allows claimants to defer weeks of entitlement to be used later in the benefit period. Claims that exhausted the benefit period through Working While on Claim had, on average, a greater number of weeks worked while on claim (12.8 weeks) compared with claims that exhausted their entitlement (9.4 weeks) (consult table 23).
Because a larger share of claims that exhausted their benefit period also worked while on claim, claimants who exhausted their benefit period are thus more likely to accumulate enough hours of insurable employment during their benefit period to meet the eligibility requirements to establish a new claim following the end of their claim. As a result, a much greater proportion of claimants who exhausted their benefit period requalified for a new claim within 4 weeks following the termination of their claim (39.9% in FY2021 compared with 8.8% of completed claims that exhausted their entitlement).
In FY2021, the share of completed EI regular claims combined with EI special benefits that exhausted their benefit period (23.7%) was greater compared with mixed claims that exhausted their entitlement (13.3%). Claims that exhausted their benefit period also received fewer weeks of EI regular benefits (17.8 weeks) compared with claims that exhausted their entitlement (27.2 weeks). Completed EI regular claims that exhausted their benefit period used, on average, just over half (55.4% in FY2021) of their entitlement (consult table 23).
| Category | Entitlement exhaustion for claims established before March 15, 2020P | Benefit period exhaustion for claims established before March 15, 2020P |
|---|---|---|
| Exhaustion rate – overall | 37.0% | 26.9% |
| Exhaustion rate – seasonal claims | 25.0% | 31.6% |
| Exhaustion rate – non-seasonal claims | 42.4% | 24.7% |
| Regional unemployment rate at the time of claim establishment: 6.0% or less | 38.5% | 25.1% |
| Regional unemployment rate at the time of claim establishment:6.1% to 8.0% | 38.4% | 28.5% |
| Regional unemployment rate at the time of claim establishment:8.1% to 10.0% | 33.4% | 33.6% |
| Regional unemployment rate at the time of claim establishment:10.1% to 13.0% | 32.4% | 28.6% |
| Regional unemployment rate at the time of claim establishment:13.1% to 14.0% | 29.3% | 23.5% |
| Regional unemployment rate at the time of claim establishment:14.1% or above | 31.6% | 30.0% |
| Proportion of claims involving at least 1 week worked while on claim | 34.3% | 68.6% |
| Requalification rate for EI regular benefits* | 8.8% | 39.9% |
| Average weeks worked while on claim** | 9.4 | 12.8 |
| Average weeks of EI regular benefits paid | 27.2 | 17.8 |
| Share of mixed claims (EI regular and special benefits) | 13.3% | 23.7% |
| Average proportion of regular entitlement used | 100.0% | 55.4% |
- Note: Includes all completed claims for which at least $1 of EI regular benefits was paid.
- P Preliminary data.
- * The requalification rate refers to the proportion of claimants who are able to requalify for a new claim within 4 weeks following the termination of their claim.
- ** Includes only claims with at least 1 week worked while on claim.
- Source: Employment and Social Development Canada, Employment Insurance (EI) administrative data. Data are based on a 10% sample of EI administrative data.
2.2.7 Working while on claim
In addition to providing temporary income support to eligible unemployed contributors, the Employment Insurance (EI) program is also designed to encourage claimants to accept available jobs, maintain their skills and remain connected to the labour market while they receive EI regular benefits. The Working While on Claim (WWC) provision of the Employment Insurance Act does this by allowing claimants to earn additional employment income while on claim. The WWC provision applied to all types of EI benefits in FY2021.
The WWC provision, which previously existed under legislation or pilot projects,Footnote 64 determines how EI benefits are adjusted to reflect employment income earned while being on claim. It allows claimants to keep their employment earnings while continuing to receive a portion of their EI benefits, up to a limit after which benefits are reduced to zero. If benefits are reduced to zero, the week of entitlement is deferred and can be used later during the benefit period.Footnote 65
Under WWC, claimants can keep 50 cents of their EI benefits for every dollar earned while on claim, up to a maximum of 90% of the average weekly insurable earnings used to calculate their weekly benefit rate, before benefits are deducted dollar-for-dollar.Footnote 66
Some eligible claimantsFootnote 67 may choose a temporary alternate earnings rule that allows them to earn $75 per week or 40% of weekly benefits, whichever is greater, without their EI benefits being reduced. Any amount earned above is deducted from their benefits dollar-for-dollar. This alternate earnings rule was in place for a 3-year transition period and ended on August 14, 2021.
Example: Working while on claim (illustrative example)
Sophia used to work full-time at a construction company where she earned $600 per week before getting laid off due to a reduction in workload. Following the job loss, she applies for EI regular benefits and her weekly benefit rate is calculated to be $330 (55% of $600). However, after a few weeks she finds part-time employment at a local plumbing company where she can work 3 days each week and earn $350 per week.
If Sophia decides to accept the part-time job, she simply needs to declare her earnings on her bi-weekly EI report. In that case, her weekly EI regular benefits are reduced by $175 or 50 cents for every dollar she earns at her part-time job ($350 divided by 2). This would bring her total weekly EI regular benefits to $155 ($330-$175=$155).
In the end, under the working while on claim provision, Sophia can take home $505 in total weekly income ($155 in weekly EI regular benefits and $350 from her part-time work), compared to the $330 from EI regular benefits if she decides not to accept the part-time employment.
This subsection focuses on claims and their beneficiaries who reported employment income from part-time or full-time work in at least 1 week while on claim, regardless of whether the EI benefits paid for those weeks were completed in full, partial or zero. To make the text easier to read, these claims and their beneficiaries are referred to in this subsection as having "at least 1 week worked while on claim" even if the week or weeks of work were partially completed (for example, 2 days of work). It is also important to note that the WWC provisions also apply to many other forms of income, such as pensions or severance pay, which are not included in the results presented.
Number of Employment Insurance regular claims and claimants working while on claim
The use of the WWC provision is reported using 2 different but complementary approaches. The first approach is based on EI claimants who had an open regular claim during the reporting fiscal year, regardless of when their claim was established. This focuses on the WWC activities in the fiscal year under review and therefore better reflects the labour market conditions and prevailing WWC provisions during the reporting period. The second approach is based on regular claims completed in the reporting fiscal year. This provides a better estimate of the relative incidence of WWC as it takes into consideration the entire duration of the claim and not only a specific period (such as the reporting fiscal year, as done under the first approach).
Of all EI regular benefit claimants who had an open claim in FY2021, 1,161,010 (39.5% of total) worked at least 1 week while on claim during the fiscal year (consult table 24). This share (39.5%) is lower than the levels observed in past few years (around 43.0%), likely due to the labour market disruptions caused by the COVID-19 restrictions for most of the first half of the reporting fiscal year. In comparison, 49.4% of all completed regular claims included at least 1 week worked while on claim in FY2021. In general, the claimant-based volumes are higher than the claim-based ones as the first approach, as already explained, accounts for all claimants with an open claim regardless of their establishment date, whereas the latter approach considers only those claims completed during the fiscal year. In addition, the significantly higher number of claimants with an open claimFootnote 68 in FY2021 reflects the temporary measuresFootnote 69 put in place to qualify for EI benefits in the second half of FY2021, as well as improved labour markets conditionsFootnote 70 following the gradual lifting of COVID-19 pandemic restrictions that were established in March 2020.
| Category | Claimants with an open claim during the fiscal year who have worked at least 1 week while on claim during the fiscal year (number) | Claimants with an open claim during the fiscal year who have worked at least 1 week while on claim during the fiscal year (share) | Completed claims with at least 1 week worked while on claim over a claim’s life (number)P | Completed claims with at least 1 week worked while on claim over a claim’s life (share) P |
|---|---|---|---|---|
| Newfoundland and Labrador | 47,630 | 49.9% | 35,720 | 59.5% |
| Prince Edward Island | 9,120 | 41.5% | 6,560 | 47.8% |
| Nova Scotia | 42,840 | 43.0% | 28,030 | 51.8% |
| New Brunswick | 51,810 | 48.2% | 36,580 | 57.2% |
| Quebec | 341,000 | 44.2% | 243,970 | 55.0% |
| Ontario | 360,610 | 36.3% | 181,210 | 44.1% |
| Manitoba | 33,640 | 36.4% | 19,640 | 44.9% |
| Saskatchewan | 26,050 | 34.4% | 16,680 | 42.8% |
| Alberta | 124,880 | 34.8% | 69,590 | 44.1% |
| British Columbia | 121,630 | 38.7% | 68,940 | 48.4% |
| Territories | 1,800 | 24.1% | 1,200 | 32.4% |
| Men | 611,000 | 37.1% | 433,380 | 47.6% |
| Women | 550,010 | 42.6% | 274,740 | 52.5% |
| 24 years old and under | 166,190 | 38.9% | 80,600 | 46.8% |
| 25 to 44 years old | 526,720 | 42.1% | 339,450 | 52.5% |
| 45 to 54 years old | 245,570 | 45.4% | 160,620 | 57.1% |
| 55 years old and over | 222,530 | 31.0% | 127,450 | 38.3% |
| Seasonal* | 207,700 | 53.8% | 211,210 | 60.4% |
| Non-seasonal* | 953,310 | 37.4% | 496,910 | 45.9% |
| Canada | 1,161,010 | 39.5% | 708,120 | 49.4% |
- Note: Includes all claimants (or claims) to which at least $1 of EI regular benefits was paid.
- P Preliminary.
- * Consult annex 2.1 for definitions of seasonal claimants referenced in this table.
- Source: Employment and Social Development Canada, Employment Insurance (EI) administrative data. Data are based on a 10% sample of EI administrative data.
The proportion of regular benefit claimants (or completed claims) with at least 1 week worked while on claim varies by, among other things, region and industry, which may be partly explained by local labour market conditions in the regions where the claimants resided. Generally, regions that have a higher proportion of seasonal claimants have greater shares of EI regular benefit claimants who worked at least 1 week while on claim. This may be due in part to the limited availability of work during the “off-peak season” and better re-employment opportunities should the benefit period of claimants exceed the “off-peak season” duration. In FY2021, the Atlantic provinces (46.6%) and Quebec (44.2%), and the Educational services industry (54.3%) as well as the Construction industry (45.3%), which had higher proportions of seasonal claimants, had relatively higher proportion of claimants who worked at least 1 week while on claim.
Weeks worked while on claim
This subsection analyzes the proportion and the average number of weeks worked while on claim. It examines whether employment income was reported during a week in which a claimant was entitled to receive EI regular benefits.
The first reported measure is the proportion of weeks worked while on claim among weeks for which claimants were entitled to receive EI regular benefits in the reporting fiscal year (regardless of the establishment date of the claim). It reflects the relative frequency of WWC usage among regular claimants, is indicative of local labour market conditions and WWC provisions in effect during the reporting period. The proportion of weeks worked while on claim was 20.5% nationally in FY2021, down from the 23.6% observed in the previous year (consult table 25). This decline is likely due to the economic and labour market disruptions due to COVID-19 in the reporting fiscal year. In addition, a lower share of seasonal claimantsFootnote 71 among EI regular claimants in FY2021 may have also contributed to the decrease in the proportion of weeks worked while on claim in the reporting year. Notably, the proportions of weeks worked while on claim went down by 4.3 percentage points among seasonal claimants whereas it remained relatively unchanged among non-seasonal claimants (-1.0 percentage points). This difference points out the increased difficulty of finding employment for seasonal claimants while on claim in an already disrupted labour market than their non-seasonal counterparts. This is also reflected across regions—the proportions of weeks worked while on claim decreased in FY2021 in the Atlantic provinces and Quebec, which account for more than half of all seasonal claimants in Canada. Conversely, these proportions increased slightly in FY2021 in the Western provinces which account for a comparatively lower share of seasonal claimants.Footnote 72
The second measure is the average number of weeks worked while on claim for EI regular claims completed during the fiscal year with at least 1 week of work during the entire claim period. This measure of WWC frequency is based on the entire duration of the claim, rather than a specific reference period. In FY2021, the average number of weeks worked while on claim was 9.2 weeks, down slightly from the previous year (consult table 25). This is likely due to the economic and labour market disruptions because of COVID-19 restrictions established in March 2020.
An analysis by demographic characteristics shows that the proportion of weeks worked while on claim varied in the same way as the proportion of claimants who worked at least 1 week while on claim. Seasonal claimants, women, claimants aged 25 to 44 and 45 to 54 years, and those in the Atlantic provinces and Quebec had higher proportions of weeks worked while on claim as well as proportions of claimants who worked at least 1 week while on claim than the national average in FY2021 (consult table 24 and table 25). This trend has been generally consistent with previous years.
| Category | Proportion of weeks worked* (FY1920) | Proportion of weeks worked* (FY2021) | Change (% points) | Average number of weeks worked (FY1920) r | Average number of weeks worked (FY2021) P | Change (number of weeks) |
|---|---|---|---|---|---|---|
| Newfoundland and Labrador | 27.6% | 24.1% | -3.4 | 16.2 | 14.8 | -1.4 |
| Prince Edward Island | 22.4% | 22.0% | -0.4 | 12.1 | 12.1 | 0.0 |
| Nova Scotia | 25.3% | 24.2% | -1.2 | 12.9 | 12.5 | -0.4 |
| New Brunswick | 30.4% | 28.2% | -2.2 | 15.4 | 14.8 | -0.6 |
| Quebec | 33.1% | 25.4% | -7.7 | 12.8 | 10.8 | -2.1 |
| Ontario | 17.2% | 17.3% | +0.1 | 8.0 | 6.8 | -1.1 |
| Manitoba | 12.6% | 15.1% | +2.5 | 6.1 | 5.7 | -0.3 |
| Saskatchewan | 12.8% | 15.3% | +2.5 | 6.8 | 6.6 | -0.2 |
| Alberta | 14.3% | 15.5% | +1.2 | 7.1 | 6.2 | -1.0 |
| British Columbia | 19.4% | 20.7% | +1.3 | 8.2 | 7.4 | -0.8 |
| Territories | 10.1% | 8.5% | -1.7 | 6.2 | 6.1 | -0.1 |
| Men | 22.6% | 18.4% | -4.2 | 11.3 | 9.6 | -1.6 |
| Women | 25.3% | 23.5% | -1.8 | 9.9 | 8.6 | -1.3 |
| 24 years old and under | 21.9% | 19.2% | -2.7 | 8.9 | 6.4 | -2.4 |
| 25 to 44 years old | 25.1% | 21.5% | -3.6 | 9.9 | 8.6 | -1.3 |
| 45 to 54 years old | 29.5% | 25.7% | -3.8 | 12.1 | 10.7 | -1.4 |
| 55 years old and over | 17.3% | 16.0% | -1.4 | 11.8 | 10.9 | -0.9 |
| Seasonal** | 30.5% | 26.3% | -4.3 | 12.1 | 12.3 | +0.2 |
| Non-seasonal** | 20.4% | 19.4% | -1.0 | 9.9 | 7.9 | -2.0 |
| Canada | 23.6% | 20.5% | -3.1 | 10.7 | 9.2 | -1.5 |
- Note: Changes are based on unrounded numbers. Includes all claims for which at least $1 in EI regular benefit was paid.
- * Data are based on weeks worked while on claim during the reporting fiscal year, regardless of the year in which their claim was established.
- ** Consult annex 2.1 for definitions of seasonal claims referenced in this table.
- r Revised.
- p Preliminary.
- Source: Employment and Social Development Canada, Employment Insurance (EI) administrative data. Data are based on a 10% sample of EI administrative data.
Weekly income associated with working while on claim
As outlined in table 26, there is a difference between the average weekly income of claimants who worked while on claim and those who did not. For EI regular claims completed in FY2021, claimants who worked while on claim had lower average weekly EI regular benefits ($369) for the entire claim period compared to the average weekly EI regular benefit of those who did not work ($490). However, claimants who worked while on claim had significantly higher average weekly total income ($673) compared to that of those who did not work while on claim ($490). When only the weeks worked were considered, claimants who worked while on claim received an average of $790 per week in FY2021 (consult table 26).
| Income type | Claims without working while on claim | Claims with working while on claim (all weeks*) | Claims with working while on claim (weeks worked only**) |
|---|---|---|---|
| Average weekly EI regular benefits | $490 | $369 | Not available |
| Average weekly employment earnings | n/a | $304 | $790 |
| Average weekly total income (EI regular benefits and employment earnings) | $490 | $673 | Not available |
- Note: Includes completed claims for which at least $1 of EI regular benefits was paid.
- * Includes deferred weeks of EI benefits (that have thus $0 of EI benefits paid and high amount of employment earnings). Average incomes for this category are the sum of all regular benefits paid and/or employment earnings divided by the number of weeks the claim was active.
- ** The average weekly employment earnings for this category are total employment earnings divided by the number of weeks worked while on claim.
- Source: Employment and Social Development Canada, Employment Insurance (EI) administrative data. Data are based on a 10% sample of EI administrative data.
2.3 Employment Insurance support while on training
In this section
- 2.3.1 Employment Insurance support for apprentices
- 2.3.2 Training with permission from Service Canada to keep receiving EI
Some EI program flexibilities allow unemployed EI claimants to train and get the skills they need to succeed in the labour market. Individuals who qualify for EI regular benefits may pursue training under different scenarios.
A claimant may be referred to training by a designated authority, such as a province, territory or Indigenous organization. Such training may be funded through provincial and territorial Labour Market Development Agreements (LMDA), or it may be self-funded by the claimant. In both situations, the provincial or territorial government must agree that the desired training is a reasonable part of the claimant’s return-to-work action plan. In these cases, claimants continue to receive EI regular benefits while they upgrade their skills. Consult Chapter III for more information on LMDAs.
If claimants decide on their own to take training, they must declare their training, prove that they are still able and willing to work, and are continuing to look for a job to continue receiving EI regular benefits. They must be ready to work if they receive a job offer, and to adjust or cancel their training plan if necessary. Service Canada assesses these situations on a case-by-case basis, taking into account the individual claimant’s circumstances.
Through Skills Boost, EI regular claimants who are long-tenured workers and wish to self-fund full-time training at an approved institution can request permission directly from Service Canada to continue receiving EI regular benefits while taking training that would otherwise restrict their ability to meet program requirements (that is, searching and being available for work). Skills Boost also introduced measures that took effect August 1, 2018, to provide enhanced Student Financial Assistance targeting working or unemployed Canadians looking to return to school to upgrade their skills.
Subsection 2.3.1 examines support for apprentices and subsection 2.3.2 discusses the training permission provided by Service Canada.
2.3.1 Employment Insurance support for apprentices
For many skilled trades, apprenticeship is the path to gain the skills and experience that are necessary for certification and to participate fully in the labour market. In Canada, the apprenticeship system is an industry-driven learning system that combines on-the-job and technical training. Each province or territory is responsible for apprenticeship training within its jurisdiction. As a result, apprenticeship programs in Canada, including the duration and delivery method of technical training, vary across trades and across provinces and territories.
In Quebec for instance, apprentices generally complete all of their technical training at a college (CEGEP) or at a training institution before beginning on-the-job training. In the rest of Canada, apprentices start with on-the-job training followed by technical training through a variety of approaches. These include in-class learning, self-learning, distance learning, night classes or day release programs.
In most jurisdictions, to enter an apprenticeship program, a prospective apprentice must be at least 16 years old and have successfully completed Grade 12 or have an equivalent amount of work experience or related education. In addition, the potential apprentice must find a job with an employer who will sponsor and train him or her under the mentorship of a qualified person.
To help EI contributors continue their apprenticeship and become certified journeypersons or tradespeople, the EI program offers temporary income support to those who are unemployed and attending full-time technical training (sometimes referred to as block-release training). To qualify, they must meet EI regular benefits eligibility requirements,Footnote 73 and their respective province, territory or Indigenous organization must have referred them to training under section 25 of the Employment Insurance Act for each block of full-time technical training that is required as part of their apprenticeship. Employers may also offer their apprentices Supplemental Unemployment Benefit (SUB) plans to increase their weekly income during their periods of technical training, up to 95% of the apprentice’s normal weekly earnings.Footnote 74
Apprentices can apply for EI benefits up to 7 days before their last day of work and they are only required to serve 1 waiting period for the full duration of their apprenticeship, even if it involves multiple blocks of full-time technical training, as long as they remain in the same apprenticeship program.
To help ensure that apprentices receive EI benefits without delay while they attend full-time technical training, their province, territory or Indigenous organization provides them with a special reference code issued for each block of full-time technical training. This code facilitates faster processing and payment of their EI benefits and helps speed up payment to apprentices.
Apprentices may be entitled to receive financial support under Part II of the Employment Insurance Act,Footnote 75 which is delivered by the provinces and territories (under the Labour Market Development Agreements) and Indigenous organizations (under the Indigenous Skills and Employment Training Program). These EI benefits help cover accommodation, childcare, transportation and other costs incurred while attending technical training. Other financial support from the Government of Canada is also available through programs such as the Canada Apprentice Loan and various apprenticeship grants.
The following sections present detailed statistics on the number of EI claims from apprentices, the weekly level and duration of their benefits. EI claims from apprentices are those referred under section 25 of the Employment Insurance Act and who received at least 1 dollar of EI regular benefits during a period of full-time apprenticeship training.
Employment Insurance claims from apprentices and amount paid
As enrollment in trades programs is influenced by the health of local labour markets, the implementation of government temporary measures related to COVID-19 and the closure of non-essential businesses and facilities negatively affected those enrolled in skilled trades and apprenticeship programs in FY2021.
According to the Registered Apprenticeship Information System, the number of new registrations (-43.0%) and certifications (-48.7%) in trade programs decreased by almost half in the first 9 months of 2020 compared to the same period in 2019 due to the COVID-19 pandemic. These declines, which began in March 2020, reached their highest levels in April and June, with -71.2% and -76.4% respectively (compared to the same period in 2019). This was especially the case in industry sectors where apprenticeship training is concentrated, including employment in trades, transport and equipment operators and related occupations.Footnote 76
As shown in table 27, in FY2021 the number of new claims established by apprentices decreased by 32.8% compared to the previous year (from 47,180 to 31,700).Footnote 77 This decline was largely attributable to a decrease in the number of new claims established in Alberta (-5,320 claims), Ontario (-5,150 claims), and British Columbia (-1,960 claims), although all provinces (except Quebec) and territories experienced a decrease in claims. Jurisdictions with the largest year-over-year decrease were Prince Edward Island (-65.7%), followed by Newfoundland and Labrador (-48.9%), Saskatchewan (-40.4%), and Alberta (-40.1%).
Outside of periods of full-time training and during the benefit period of a claim, an apprentice may experience a loss of employment income due to circumstances that may require the apprentice to access other types of EI benefits (for instance, regular benefits for lack of available work or special benefits for care for a newborn child). The claimant may claim those benefits if he or she meets the eligibility requirements for the relevant EI benefits. Of all claims established by apprentices in the reporting fiscal year, 40.1% (or 12,710 claims) contained at least 1 week of regular benefits paid outside of periods of full-time training. Meanwhile, 2.1% (or 660 claims) contained at least 1 week of special benefits paid outside of periods of full-time training, including 570 claims for sickness benefits.
Like the number of new claims established, the total amount of EI benefits paid to apprentices decreased by 35.5% to $212.5 million compared to the previous year. The largest relative decrease occurred in the Territories (-52.0%), followed by Prince Edward Island (-51.9%), and Saskatchewan (-47.6%). Quebec, which administers its own apprenticeship program, was the only province that experienced an increase in the amount paid.
Of the total of $212.5 million paid in benefits, $147.5 million (or 69.4% of the total EI benefits paid to apprentices) were paid while they attended full-time technical training. EI regular benefits paid outside of periods of full-time training accounted for most of the remaining benefits paid to apprentices ($59.9 million, or 28.2%), with a small fraction paid in special benefits ($5.0 million, or 2.4%).
In FY2021, 79.0% of EI claims by apprentices were established in Ontario, Alberta, and British Columbia, consistent with trends observed over past years. Total benefits paid followed a pattern very similar to the one for EI claims over the same period.
As in previous years, men established the vast majority of claims by apprentices (94.2%) and accounted for the largest share of all EI benefits paid to apprentices (92.9%) in FY2021. The low proportion of claims by women and benefits paid to them is largely due to the low share of women registering in apprenticeship-training programs (11.5% in 2020).Footnote 78
| Category | New claims established FY1920 | New claims established FY2021 | New claims established Change (%) | Amount paid ($ millions) FY1920 | Amount paid ($ millions) FY2021 | Amount paid ($ millions) Change (%) |
|---|---|---|---|---|---|---|
| Newfoundland and Labrador | 940 | 480 | -48.9% | $10.2 | $5.7 | -44.3% |
| Prince Edward Island | 350 | 120 | -65.7% | $2.0 | $1.0 | -51.9% |
| Nova Scotia | 1,470 | 1,060 | -27.9% | $10.3 | $7.3 | -29.2% |
| New Brunswick | 1,500 | 1,080 | -28.0% | $10.6 | $7.1 | -33.5% |
| Quebec* | 60 | 140 | +133.3% | $0.4 | $1.7 | +333.5% |
| Ontario | 14,700 | 9,550 | -35.0% | $102.1 | $63.1 | -38.2% |
| Manitoba | 2,710 | 2,160 | -20.3% | $17.3 | $13.5 | -22.2% |
| Saskatchewan | 2,500 | 1,490 | -40.4% | $16.8 | $8.8 | -47.6% |
| Alberta | 13,270 | 7,950 | -40.1% | $99.1 | $56.5 | -43.0% |
| British Columbia | 9,500 | 7,540 | -20.6% | $59.3 | $47.2 | -20.4% |
| Territories | 180 | 130 | -27.8% | $1.5 | $0.7 | -52.0% |
| Men | 44,680 | 29,860 | -33.2% | $309.7 | $197.4 | -36.2% |
| Women | 2,500 | 1,840 | -26.4% | $20.0 | $15.0 | -24.8% |
| 24 years old and under | 20,910 | 13,550 | -35.2% | $132.9 | $83.2 | -37.4% |
| 25 to 44 years old | 24,920 | 17,260 | -30.7% | $186.9 | $120.6 | -35.5% |
| 45 years old and over | 1,350 | 890 | -34.1% | $9.8 | $8.7 | -12.0% |
| Canada | 47,180 | 31,700 | -32.8% | $329.6 | $212.5 | -35.5% |
- Note: Totals may not add up due to rounding. Percentage change is based on unrounded numbers. Includes all claims from apprentices referred under Section 25 of the Employment Insurance Act for which at least $1 of EI benefits was paid while the claimant was on training.
- * The low number of claims from apprentices in Quebec is due to the unique program design in which apprentices complete all of the technical training prior to beginning on-the-job training.
- Source: Employment and Social Development Canada. Employment Insurance (EI) administrative data. Data are based on a 10% sample of EI administrative data.
From an age perspective, claimants between 25 and 44 years old accounted for the largest share of EI claims associated with apprenticeship programs and full-time technical training (54.4%), and for the largest share of all EI benefits paid to apprentices (56.8%). They were followed by claimants aged 15 to 24 years old, who accounted for 42.7% of all claims and 39.2% of the total amount paid in benefits. Claimants aged 45 years and over accounted for 42.4% of all EI regular claims established, but only 2.8% of all EI apprenticeship claims in FY2021. This result was expected, as the incidence of job-related training declines with age, though the gap between older and younger workers appears to be shrinking over time.Footnote 79
Similar to previous years, claimants from the Construction sector established the majority of the new apprentice claims (58.1%) and accounted for the largest share of the total amount paid in benefits (60.4%) in FY2021 (consult table 28).
From the occupational grouping perspective, the majority of EI claimants participating in apprenticeship programs and attending full-time technical training were associated with the Trades and skilled transport and equipment operators occupational groupFootnote 80 (91.3%), which also accounted for 90.2% of the total benefits paid to apprentices. While apprentice claimants from this occupational group were mainly employed in the Construction sector, they were also found in the Manufacturing, Other services (excluding Public administration) and Retail trade sectors.
| Category | New claims established FY1920 | New claims established FY2021 | New claims established Change (%) | Amount paid ($ millions) FY1920 | Amount paid ($ millions) FY2021 | Amount paid ($ millions) Change (%) |
|---|---|---|---|---|---|---|
| Construction | 27,410 | 18,430 | -32.8% | $204.8 | $128.4 | -37.3% |
| Manufacturing | 3,540 | 2,310 | -34.7% | $25.7 | $15.4 | -39.9% |
| Wholesale Trade | 2,040 | 1,480 | -27.5% | $11.5 | $7.9 | -31.3% |
| Retail Trade | 3,170 | 2,120 | -33.1% | $16.9 | $12.2 | -27.8% |
| Other services (excluding public administration) | 3,900 | 2,360 | -39.5% | $22.4 | $13.4 | -40.0% |
| Other sectors | 7,120 | 5,000 | -29.8% | $48.4 | $35.1 | -27.5% |
| Trades and skilled transport and equipment operators | 43,430 | 28,950 | -33.3% | $303.5 | $191.6 | -36.9% |
| Other occupations | 3,750 | 2,750 | -26.7% | $26.1 | $20.9 | -20.0% |
| Canada | 47,180 | 31,700 | -32.8% | $329.6 | $212.5 | -35.5% |
- Note: Totals may not add up to the total due to rounding. Percentage change is based on unrounded numbers. Includes all claims from apprentices referred under Section 25 of the Employment Insurance Act for which at least $1 of EI benefits was paid while the claimant was on training.
- Source: Employment and Social Development Canada. Employment Insurance (EI) administrative data. Data are based on a 10% sample of EI administrative data.
Level and duration of Employment Insurance benefits for apprentices
Claims established by apprentices during the second half of FY2021, received, on average, $547 per week. This amount was higher than in the previous year and was aligned with the temporary changes made to the EI program’s parameters during that period (consult section 2.0), including the $500 minimum weekly benefit rate. Consistent with previous years, the average weekly benefit rate for apprentices was also higher than the average for EI regular claims overall ($534).
Apprentice claimants from Alberta received the highest average weekly benefit rate during the reporting period ($561), while those who established claims in Nova Scotia received the lowest average weekly benefit rate ($512). In terms of gender and age, on average, the weekly benefit rate received was higher among men ($549) than women ($525) and among claimants aged 55 years old and over ($562), followed by those aged between 25 and 44 years old ($553). Claimants under 25 years old received the lowest average weekly benefit rate ($540), followed by those between 45 and 54 years old ($544).
The average duration of EI regular claims completed in FY2021 by EI claimants while on full-time technical training was 8.8 weeks,Footnote 81 relatively unchanged from FY1920 (8.9 weeks). Claims in Ontario (9.2 weeks) and Manitoba (9.1 weeks) were above the national average (8.8 weeks). As in the previous year, the average duration of EI regular benefits received by men while on full-time technical training was almost equal than women (8.8 weeks vs. 8.6 weeks). Similar to FY1920, claimants aged 55 years or older received more weeks of benefits (10.5 weeks) compared with claimants under 25 years old (8.8 weeks) and those between 25 and 54 years old (8.7 weeks) in FY2021.
Characteristics of firms that hire apprentices
A departmental study* examined the characteristics of firms that employ EI-supported apprentices from 2001 to 2016.
The study found that the share of apprentices in a firm’s workforce was positively correlated with its productivity, a pattern that has become more apparent since the FY0809 recession. Larger firms (more than 500 employees) are more likely to hire an apprentice every year and are more likely to have hired an apprentice at least once in the study period than other sizes of firms. However, smaller firms hire disproportionately more apprentices; almost half of apprentices work in a firm with 5 to 49 employees.
On average, 4 out of 5 apprentices claimed EI from a single employer from 2001 to 2012. However, apprentices in the construction sector were more likely to make claims related to multiple employers. In addition, just under 50% of apprentices stay for more than 3 years with the firm that trained them.
- *ESDC. Characteristics of firms that hire apprentices. (Ottawa: ESDC, Labour Market Information Directorate. 2020)
2.3.2 Training with permission from Service Canada to keep receiving EI
Under Skills Boost, claimants who are long-tenured workersFootnote 82 and wish to self-fund full-time training at an approved institution may request permission directly from Service Canada to continue receiving EI regular benefits during training that would otherwise restrict their ability to meet program requirements (that is, searching and being available for work). Service Canada does not offer services normally provided by the provinces and territories such as employment counselling, job search assistance, needs assessments and assistance with the development of return to work action plans.
In FY2021, Service Canada gave permission to (or “referred”) 612 claimants to continue receiving EI benefits in order to train under Skills Boost, representing a decrease of 31.7% compared to the previous year. Out of the 612 claims established during which claimants received permission from Service Canada to train in FY2021, 556 (90.8 %) contained at least 1 week of EI regular benefits while on training and 532 (86.9% ) included at least 1 week of EI regular benefits while not on training. The amount paid to claimants while on training was $6.5 million (or 57.2% of the total amount paid), while the amount paid in EI regular benefits while not on training reached $4.6 million (or 40.3% of the total amount of $11.4 million).
As in the previous year, the largest number of training referrals by Service Canada was in Quebec (30.6%), followed by Alberta (24.0%) and Ontario (20.6%). These 3 provinces also made up the bulk of EI regular claims with 26.4%, 12.0% and 34.3%, respectively.
In FY2021, claimants who had been referred by Service Canada received benefits totalling $11.4 million, representing a decrease of 1.0% from the previous year. Quebec (30.1%), Alberta (24.9%), Ontario (21.3%), and British Columbia and the territories (14.8%) accounted for 91.2% of the total amount paid in EI benefits of all types.
Like in the previous year, women accounted for over half of referrals (59.3%) and total benefits paid (58.6%). Claimants aged 44 and under established 71.4% of all referrals and total benefits paid.
From an industry perspective, claimants who previously worked in the Wholesale and retail trade sector accounted for the largest share of referrals (15.4%), followed by those from Accommodation and food services (12.3%), Manufacturing (9.3%), and Health care and social assistance sectors (8.8%). Claims associated with both the Wholesale and retail trade and Accommodation and food service sectors received the largest share of total benefits paid for all types of benefits (15.7% and 11.7%, respectively), for regular benefits while on training (14.6% and 11.5%, respectively) and EI regular benefits (17.2% and 11.9%, respectively).
For claims established during the second half of FY2021, claimants received, on average, a weekly benefit rate of $526 for all types of EI benefits, which was both lower than the average weekly EI regular benefit rate ($534) and the average weekly regular benefit rate paid to long-tenured workers claimants ($547). Furthermore, the average weekly benefit rate claimants received while on training was $530 compared to $521 for claimants looking for a job during their claim.
Using a breakdown by gender and age, the average weekly benefit rate received by claimants was higher for men ($539) than for women ($517) and for claimants over 55 years old ($535) compared to the other age groups.
In FY2021, claimants with a referral to training by Service Canada received, on average, 19.5 weeks of EI benefits while on training and 13.1 weeks of EI benefits while looking for a job during their claim period.
Claimants from the Atlantic provinces received, on average, the highest number of EI weeks while taking training (22.4 weeks), followed by those from Saskatchewan (20.4 weeks) and Alberta (20.3 weeks). Claimants from British Columbia and the territories received, on average, the highest number of EI regular benefits weeks while not on training (15.1 weeks), followed by those from Ontario (13.8 weeks) and Saskatchewan (13.3 weeks).
As in the previous year, women received, on average, more weeks of EI benefits than men while attending full-time training (20.4 weeks vs. 18.6 weeks). Conversely, when they were looking for a job, men received more weeks of regular benefits than women (13.4 weeks vs 12.7 weeks).
Claimants aged between 35 and 44 received, on average, the highest number of benefits weeks (20.3 weeks) while on training, followed by those aged 34 years and under and those aged between 45 and 54 (19.4 weeks for both age groups). Claimants aged 55 years and over received the most weeks of EI regular benefits while not on training (14.3 weeks).
| Category | New claims established FY1920 | New claims established FY2021 | New claims established Change (%) | Amount paid ($ millions) FY1920 | Amount paid ($ millions) FY2021 | Amount paid ($ millions) Change (%) |
|---|---|---|---|---|---|---|
| Atlantic provinces | 44r | 23 | -47.7% | $0.5 | $0.4 | -28.8% |
| Quebec | 248 | 187 | -24.6% | $3.1 | $3.4 | +10.7% |
| Ontario | 231 | 126 | -45.5% | $2.9 | $2.4 | -17.1% |
| Manitoba | 31 | 19 | -38.7% | $0.4 | $0.3 | -23.4% |
| Saskatchewan | 29 | 17 | -41.4% | $0.4 | $0.3 | -24.4% |
| Alberta | 192 | 147 | -23.4% | $2.7 | $2.9 | +7.5% |
| British Columbia and Territories1 | 121 | 93 | -23.1% | $1.5 | $1.7 | +13.8% |
| Men | 430 | 249 | -42.1% | $5.6 | $4.7 | -14.9% |
| Women | 466 | 363 | -22.1% | $6.0 | $6.7 | +11.9% |
| 34 years old and under | 346 | 208 | -39.9% | $4.3 | $3.7 | -13.1% |
| 35 to 44 years old | 299 | 229 | -23.4% | $4.0 | $4.4 | +10.0% |
| 45 to 54 years old | 189 | 131 | -30.7% | $2.5 | $2.4 | -4.4% |
| 55 years old and over | 62 | 44 | -29.0% | $0.7 | $0.9 | +22.2% |
| Goods-producing industries | 220 | 110 | -50.0% | $2.9 | $2.1 | -29.1% |
| Agriculture, forestry, fishing, hunting, mining and oil and gas extraction | 31 | 19 | -38.7% | $0.4 | $0.4 | -9.9% |
| Construction | 85 | 34 | -60.0% | $1.0 | $0.7 | -30.2% |
| Manufacturing2 | 104 | 57 | -45.2% | $1.5 | $1.0 | -33.5% |
| Service-producing industries | 659 | 475 | -27.9% | $8.4 | $8.9 | +5.1% |
| Wholesale and retail trade | 133 | 94 | -29.3% | $1.8 | $1.8 | +1.0% |
| Transportation and warehousing | 43 | 36 | -16.3% | $0.6 | $0.7 | +18.3% |
| Finance, insurance, real estate, rental and leasing | 47 | 23 | -51.1% | $0.6 | $0.4 | -28.3% |
| Professional, scientific, and technical services | 62 | 36 | -41.9% | $0.8 | $0.8 | -3.3% |
| Business, building, and other support services3 | 69 | 41 | -40.6% | $1.0 | $0.8 | -18.4% |
| Educational services | 53 | 24 | -54.7% | $0.5 | $0.4 | -10.6% |
| Healthcare and social assistance | 64 | 54 | -15.6% | $0.8 | $1.0 | +24.0% |
| Information, culture, and recreation4 | 45 | 29 | -35.6% | $0.6 | $0.5 | -7.9% |
| Accommodation and food services | 42 | 75 | +78.6% | $0.5 | $1.3 | +192.8% |
| Other services (excluding public administration) | 35 | 35 | 0.0% | $0.5 | $0.6 | +26.8% |
| Public administration | 66 | 28 | -57.6% | $0.9 | $0.5 | -47.6% |
| Unclassified5 | 17 | 27 | +58.8% | $0.2 | $0.5 | +130.9% |
| Canada | 896 | 612 | -31.7% | $11.6 | $11.4 | -1.0% |
- 1 For confidentiality reasons, data for the territories have been included with those for British Columbia.
- 2 For confidentiality reasons, data for Utilities industry have been combined with Manufacturing.
- 3 This industry sector comprises the industries with codes 55 (Management of companies and enterprises) and 56 (Administration and support. waste management and remediation services).
- 4 This industry sector comprises the industries with codes 51 (Information and cultural industries) and 71 (Arts, entertainment and recreation).
- 5 For some claims, this information was not available in the data.
- Source: Employment and Social Development Canada. Employment Insurance (EI) administrative data. Data are based on a 100% sample of EI administrative data.
2.4 Employment Insurance fishing benefits
In this section
- 2.4.1 Employment Insurance fishing claims and benefits paid
- 2.4.2 Seasonal component of Employment Insurance fishing benefits
- 2.4.3 Duration of Employment Insurance fishing benefits
Employment Insurance (EI) provides fishing benefits to qualifying, self-employed fishers who are actively seeking work. Unlike EI regular benefits, eligibility for EI fishing benefits is based on earnings, not hours of insurable employment.Footnote 83 Fishers may be eligible to receive regular fishing benefits as well as sickness, maternity, parental, compassionate care and/or family caregiver benefits.
Under the Employment Insurance (Fishing) Regulations, a “fisher” is defined as a self-employed person engaged in fishing activities and includes a person engaged, other than under a contract of service or for their own or another person’s sport:
- in making a catch
- in doing any work incidental to making or handling catch,Footnote 84 or
- in the construction of a fishing vessel for their own use or for the use of a crew of which the person is a member in making a catch
To be entitled to receive EI fishing benefits, applicants must:
- be unemployed and available for work
- meet the definition of a self-employed fisher
- have paid EI premium during their qualifying period
- not qualify for regular benefits
- have earned a minimum of between $2,500 and $4,200 from self-employment in fishing during their qualifying period,Footnote 85 depending on the regional unemployment rate of their residence
The weekly benefit rate is calculated by dividing the fisher’s total insurable earnings during the qualifying period by the earnings divisor associated with the claimant’s regional unemployment rate. For the first half of FY2021, chart 12 outlines the minimum insurable earnings needed to qualify for EI fishing benefits and the earnings divisor used for this calculation. This result is then multiplied by the basic rate of 55%, without exceeding the allowed maximum weekly benefit rate.
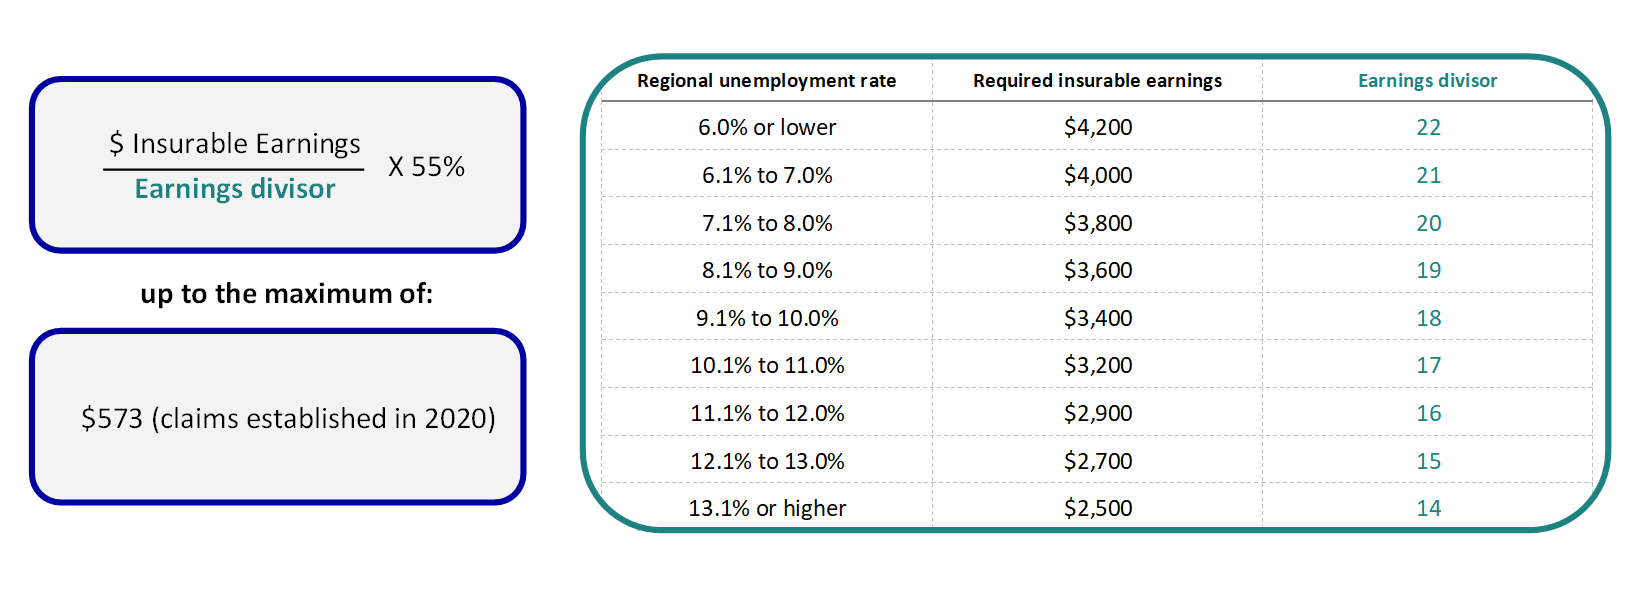
Text description of Chart 12
The formula is Insurable earnings divided by the earnings divisor multiplied by 55% up to the maximum of $573 for claims established in 2020
| Regional unemployment rate | Required insurable earnings | Earnings divisor |
|---|---|---|
| 6.0% or lower | $4,200 | 22 |
| 6.1% to 7.0% | $4,000 | 21 |
| 7.1% to 8.0% | $3,800 | 20 |
| 8.1% to 9.0% | $3,600 | 19 |
| 9.1% to 10.0% | $3,400 | 18 |
| 10.1% to 11.0% | $3,200 | 17 |
| 11.1% to 12.0% | $2,900 | 16 |
| 12.1% to 13.0% | $2,700 | 15 |
| 13.1% or higher | $2,500 | 14 |
- Note: Insurable earnings include all earnings earned from self-employment in fishing during their current qualifying period. The qualifying period is defined as either the 31 weeks prior to the new claim’s establishment or since the establishment of a previous claim, whichever is shorter.
The Government implemented EI temporary measures to support self-employed fish harvesters who rely on EI fishing benefits in the off-season. For fishing claims established between September 27, 2020 and September 25, 2021, these measures allowed claimants to establish a fishing claim based on their earnings in their current qualifying period or the earnings used to establish a fishing claim of the same type (summer or winter) in 2018 or 2019, whichever was the highest. The EI temporary measures also granted fishers the ability to request to switch to fishing benefits even if they qualified for regular benefits as a result of the hours credit.Footnote 86
The EI temporary measures also set the unemployment rate to 13.1% for all regions for one whole year for EI administrative purposes. Thus, during the second half of FY2021, the required insurable earnings was $2,500 and the earnings divisor was 14 weeks. In addition, fishing benefits were subject to the same provisional minimum benefit rate ($500) and maximum insurable earnings threshold as other types of EI benefitsFootnote 87 (a maximum benefit of $573 in 2020 and $595 in 2021), as illustrated in chart 13.
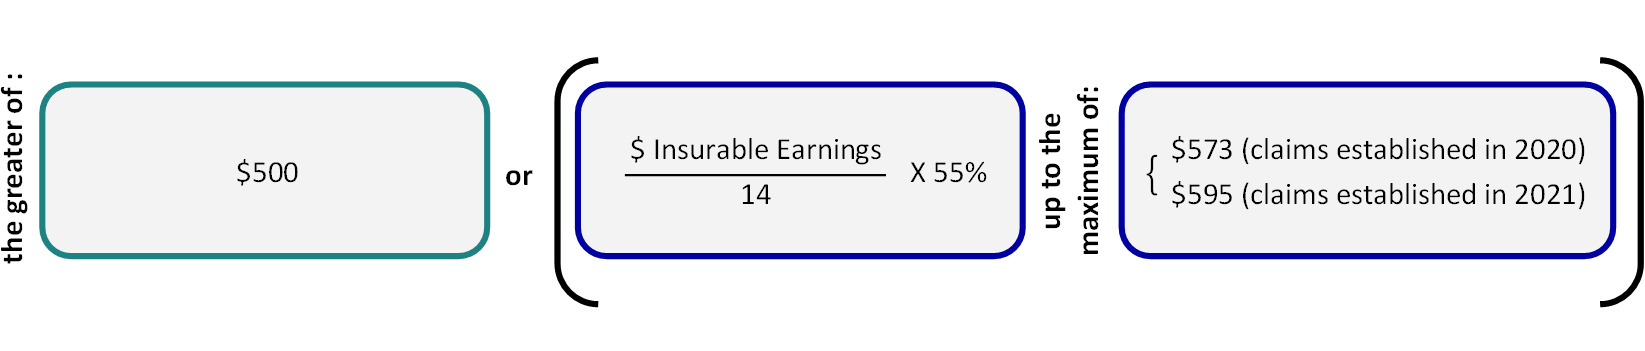
Text description of Chart 13
The greater of: $500 or ((insurable earnings divided by 14 multiplied by 55%) up to the maximum of $573 for claims established in 2020 or $595 for claims established in 2021)
- Note: Insurable earnings include all earnings earned from self-employment in fishing during their current qualifying period or their earnings used to establish a fishing claim of the same type (summer or winter) in 2018 or 2019, whichever is highest. The qualifying period is defined as either the 31 weeks prior to the new claim’s establishment or since the establishment of a previous claim, whichever is shorter.
Any claimant who qualifies for EI fishing benefits may receive a maximum entitlement of 26 weeks of EI fishing benefits per claim within the fixed benefit period, with the possibilities of establishing 2 claims a year, 1 in the winter and 1 in the summer. The benefit period for a winter claim can start as early as the week of April 1 and must end no later than the week of December 15, whereas the benefit period for a summer claim can start as early as the week of October 1 and must end no later than the week of June 15.Footnote 88 These weeks of benefits may be received consecutively or intermittently, but are limited by the fixed start and end dates of the benefit period. In some cases, claimants can defer earnings from one season to the other. For the purpose of this section, EI fishing claims refer to claims for which at least 1 dollar of EI fishing benefits were paid.
2.4.1 Employment Insurance fishing claims and benefits paid
In FY2021, after 5 consecutive years of increases, the total number of new EI fishing claims decreased to 28,288 new claims. This may be explained by many fishers in the first half of FY2021 opting to instead apply for the provisional Canada Emergency Response Benefits (CERB), which was available at the time. Despite the decline in new EI fishing claims, the total amount of EI fishing benefits paid increased to $323.6 million in FY2021 (consult chart 14). This can be partly explained by the minimum benefit rate of $500 offered under the EI temporary measures during the second half of FY2021.
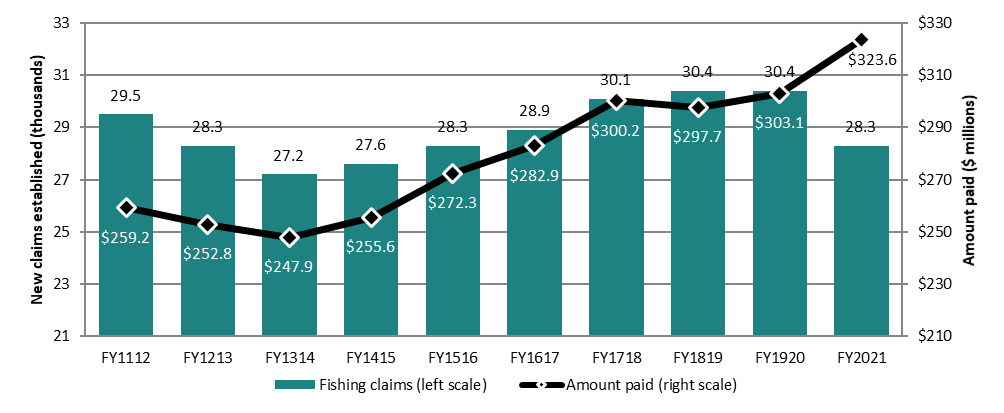
Text description of Chart 14
| Category | FY1112 | FY1213 | FY1314 | FY1415 | FY1516 | FY1617 | FY1718 | FY1819 | FY1920 | FY2021 |
|---|---|---|---|---|---|---|---|---|---|---|
| Fishing claims (in thousands) (left scale) | 29.5 | 28.3 | 27.2 | 27.6 | 28.3 | 28.9 | 30.1 | 30.4 | 30.4 | 28.3 |
| Amount paid ($ millions) (right scale) | $259.2 | $252.8 | $247.9 | $255.6 | $272.3 | $282.9 | $300.2 | $297.7 | $303.1 | $323.6 |
- Note: Includes claims for which at least $1 of fishing benefits was paid.
- Source: Employment and Social Development Canada, Employment Insurance (EI) administrative data. Data on claims are based on a 100% sample of EI administrative data, while data on amount paid are based on a 10% sample.
In FY2021, 96.6% of claimants who relied on EI fishing benefits resided in 6 provinces (Newfoundland and Labrador, Nova Scotia, New Brunswick, Prince Edward Island, British Columbia and Quebec). As outlined in Table 30, on a year-over-year basis, the number of new fishing claims established in FY2021 decreased in almost every province and territory. Table 30 also differentiates the number of new fishing claims between the first and second half of FY2021, when the significant program changes of the EI temporary measures were introduced, as outlined in the beginning of this section. There were significantly more new EI fishing claims established in the second half of FY2021 (17,365) than the first half of FY2021 (10,923). This can be partially explained by the availability of CERB in the first half of FY2021, which many fishers may have claimed instead of EI fishing benefits, as well as the lowered entrance requirement in the second half of FY2021. British Columbia saw the most notable difference between the number of fishing claims established between the first half of FY2021 (250) and the second half (2,184).
| Category | Number of claims established and share (FY1920) | Number of claims established and share (first half of FY2021) | Number of claims established and share (second half of FY2021) | Number of claims established and share (total FY2021) | Amount paid ($ million) and share (FY1920) | Amount paid ($ million) and share (FY2021) |
|---|---|---|---|---|---|---|
| Newfoundland and Labrador | 13,041 (42.9%) | 4,693 (43.0%) | 7,373 (42.5%) | 12,066 (42.7%) | $126.5 (41.7%) | $133.7 (41.3%) |
| Prince Edward Island | 3,236 (10.6%) | 1,149 (10.5%) | 1,996 (11.5%) | 3,145 (11.1%) | $30.0 (9.9%) | $36.1 (11.2%) |
| Nova Scotia | 5,750 (18.9%) | 2,659 (24.3%) | 2,710 (15.6%) | 5,369 (19.0%) | $59.2 (19.5%) | $63.4 (19.6%) |
| New Brunswick | 3,244 (10.7%) | 1,204 (11.0%) | 1,817 (10.5%) | 3,021 (10.7%) | $36.5 (12.0%) | $38.6 (11.9%) |
| Quebec | 1,372 (4.5%) | 525 (4.8%) | 764 (4.4%) | 1,289 (4.6%) | $11.6 (3.8%) | $13.0 (4.0%) |
| British Columbia | 2,424 (8.0%) | 250 (2.3%) | 2,184 (12.6%) | 2,434 (8.6%) | $26.1 (8.6%) | $26.8 (8.3%) |
| Other provinces and territories | 1,318 (4.3%) | 443 (4.1%) | 521 (3.0%) | 964 (3.4%) | $13.2 (4.4%) | $12.1 (3.7%) |
| Men | 24,203 (79.7%) | 8,958 (82.0%) | 13,650 (78.6%) | 22,608 (79.9%) | $242.9 (80.1%) | $260.2 (80.4%) |
| Women | 6,182 (20.3%) | 1,965 (18.0%) | 3,715 (21.4%) | 5,680 (20.1%) | $60.2 (19.9%) | $63.4 (19.6%) |
| 24 years old and under | 1,593 (5.2%) | 544 (5.0%) | 797 (4.6%) | 1,341 (4.7%) | $16.9 (5.6%) | $15.5 (4.8%) |
| 25 to 44 years old | 8,428 (27.7%) | 2,869 (26.3%) | 4,625 (26.6%) | 7,494 (26.5%) | $88.5 (29.2%) | $92.8 (28.7%) |
| 45 to 54 years old | 7,901 (26.0%) | 3,007 (27.5%) | 4,224 (24.3%) | 7,231 (25.6%) | $75.3 (24.8%) | $77.2 (23.9%) |
| 55 years old and over | 12,463 (41.0%) | 4,503 (41.2%) | 7,719 (44.5%) | 12,222 (43.2%) | $122.4 (40.4%) | $138.1 (42.7%) |
| Canada | 30,385 (100.0%) | 10,923 (100.0%) | 17,365 (100.0%) | 28,288 (100.0%) | $303.1 (100.0%) | $323.6 (100.0%) |
- Note: Data may not add up to total due to rounding. Includes all claims for which at least $1 in EI fishing benefits was paid.
- Source: Employment and Social Development Canada, Employment Insurance (EI) administrative data. Data are based on a 100% sample of EI administrative data, except for amount paid which is based on a 10% sample.
Atlantic Canada accounted for the largest share of all new EI fishing claims in FY2021 (83.4%), a proportion identical to the previous year. Within those provinces, Newfoundland and Labrador had the largest share of claims (42.7%), followed by Nova Scotia (19.0%), Prince Edward Island (11.1%) and New Brunswick (10.7%). Claimants in Atlantic Canada also received the largest share of EI fishing benefits (84.0%) paid in FY2021. Newfoundland and Labrador had the largest share (41.3%) of the total amount of EI fishing benefits paid, followed by Nova Scotia (19.6%), New Brunswick (11.9%) and Prince Edward Island (11.2%).
As in previous years, men still accounted for the largest shares of both new claims (79.9%) and the total amount paid in EI fishing benefits (80.4%) in FY2021. The shares of amount paid in EI fishing benefits to both men and women were proportional to their shares of claims established.
The share of EI fishing claims established by claimants aged 54 years old and under was lower in FY2021 compared to FY1920. As in previous years, older claimants (55 years and older) account for the largest shares of both new claims (43.2%) and the total amount paid in fishing benefits (42.7%), with the total amount paid to older claimants continuing to increase over time. This is illustrated in chart 15 and chart 16.
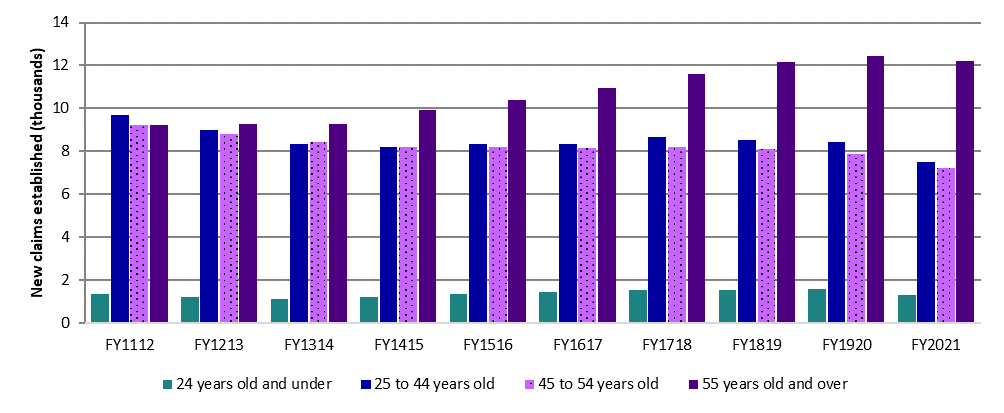
Text description of Chart 15
| Age category | FY1112 | FY1213 | FY1314 | FY1415 | FY1516 | FY1617 | FY1718 | FY1819 | FY1920 | FY2021 |
|---|---|---|---|---|---|---|---|---|---|---|
| 24 years old and under | 1,361 | 1,239 | 1,127 | 1,218 | 1,380 | 1,460 | 1,564 | 1,535 | 1,593 | 1,341 |
| 25 to 44 years old | 9,697 | 8,987 | 8,335 | 8,214 | 8,327 | 8,335 | 8,683 | 8,556 | 8,428 | 7,494 |
| 45 to 54 years old | 9,232 | 8,805 | 8,420 | 8,228 | 8,184 | 8,171 | 8,217 | 8,095 | 7,901 | 7,231 |
| 55 years old and over | 9,216 | 9,259 | 9,293 | 9,927 | 10,380 | 10,968 | 11,591 | 12,181 | 12,463 | 12,222 |
- Note: Includes claims for which at least $1 of fishing benefits was paid.
- Source: Employment and Social Development Canada, Employment Insurance (EI) administrative data. Data are based on a 100% sample of EI administrative data.
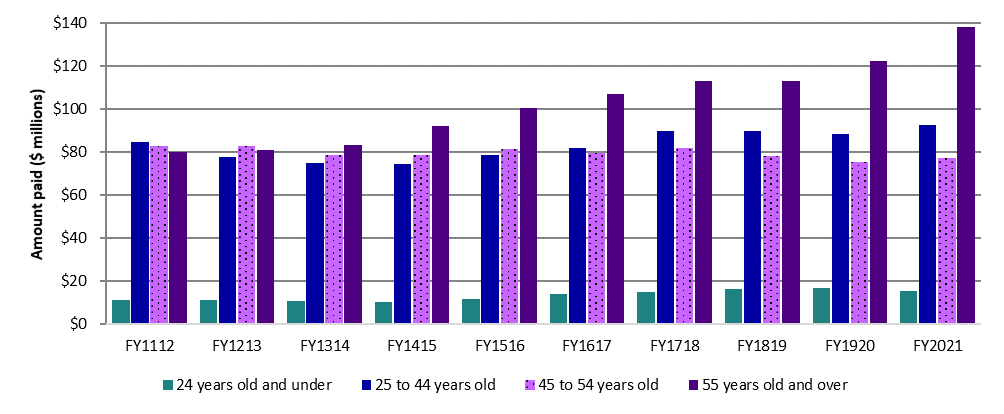
Text description of Chart 16
| Age category | FY1112 | FY1213 | FY1314 | FY1415 | FY1516 | FY1617 | FY1718 | FY1819 | FY1920 | FY2021 |
|---|---|---|---|---|---|---|---|---|---|---|
| 24 years old and under | $11.3 | $11.3 | $10.9 | $10.4 | $11.6 | $14.0 | $14.8 | $16.4 | $16.9 | $15.5 |
| 25 to 44 years old | $84.8 | $77.6 | $75.0 | $74.3 | $78.6 | $82.1 | $90.1 | $89.9 | $88.5 | $92.8 |
| 45 to 54 years old | $83.0 | $82.9 | $78.8 | $78.7 | $81.4 | $79.9 | $82.0 | $78.4 | $75.3 | $77.2 |
| 55 years old and over | $80.1 | $80.9 | $83.2 | $92.2 | $100.7 | $106.9 | $113.3 | $113.0 | $122.4 | $138.1 |
- Note: Includes claims for which at least $1 of fishing benefits was paid.
- Source: Employment and Social Development Canada, Employment Insurance (EI) administrative data. Data are based on a 10% sample of EI administrative data.
In the first half of FY2021, the average weekly fishing benefit rate was $532. This increased to $565 in the second half of FY2021, when the EI temporary measures were introduced. This rate was above the average weekly rate for EI regular benefits in the second half of FY2021 ($534), when EI regular benefits were available, consistent with previous reporting periods. Among the 6 provinces with a significant fishing industry, during the first half of FY2021, the average weekly fishing benefit rate was the highest in Quebec ($565), while it was the lowest in British Columbia ($482). During the second half of FY2021, the average weekly fishing benefit rate was the highest in New Brunswick ($573), while it was the lowest in Newfoundland and Labrador ($561). The average weekly fishing benefit rate for men ($537 for the first half of FY2021 and $567 for the second half of FY2021) was still higher than that for women ($506 and $559 for each period, respectively). Claimants who were aged between 45 and 54 years had the highest average weekly fishing benefit rate in both periods ($540 and $567, respectively) (consult annex 2.9.3).
The proportion of fishing claims that received the maximum weekly benefit rate was 69.8% in the first half of FY2021 and 70.6% in the second half of FY2021. This proportion is almost double the proportion of EI regular claims that received the maximum benefit rate in the reporting period (38.9%).Footnote 89 Table 31 further shows the proportion of fishing claims that received the maximum weekly benefit rate by those established in the first and second half of FY2021.
| Category | FY1920 | First half of FY2021 | Second half of FY2021 | Total FY2021 | Change FY1920 to FY2021 (% points) |
|---|---|---|---|---|---|
| Newfoundland and Labrador | 73.2% | 52.7% | 53.1% | 52.9% | -20.3 |
| Prince Edward Island | 81.0% | 87.0% | 92.2% | 90.3% | +9.3 |
| Nova Scotia | 80.6% | 86.9% | 74.8% | 80.8% | +0.2 |
| New Brunswick | 88.1% | 86.8% | 93.7% | 90.9% | +2.8 |
| Quebec | 91.6% | 92.4% | 85.3% | 88.2% | -3.4 |
| British Columbia | 44.1% | 54.8% | 87.1% | 83.8% | +39.7 |
| Other provinces and territories | 44.3% | 38.6% | 43.6% | 41.3% | -3.0 |
| Men | 77.5% | 73.4% | 74.4% | 74.0% | -3.5 |
| Women | 61.7% | 53.3% | 56.8% | 55.6% | -6.1 |
| 24 years old and under | 63.0% | 56.4% | 57.6% | 57.1% | -5.9 |
| 25 to 44 years old | 72.5% | 70.8% | 71.8% | 71.4% | -1.1 |
| 45 to 54 years old | 79.0% | 72.7% | 75.0% | 74.1% | -4.9 |
| 55 years old and over | 73.9% | 68.8% | 68.9% | 68.9% | -5.1 |
| Canada | 74.3% | 69.8% | 70.6% | 70.3% | -4.0 |
- Note: Includes all claims for which at least $1 in EI fishing benefits was paid.
- Source: Employment and Social Development Canada, Employment Insurance (EI) administrative data. Data are based on a 100% sample of EI administrative data.
Similar to previous reporting periods, in both the first and second half of FY2021, a lower proportion of fishing claims established by women were at the maximum weekly benefit rate (53.3% and 56.8%, respectively) compared to those established by men (73.4% and 74.4%, respectively). Claimants aged 24 years and under had the lowest proportion of fishing claims at the maximum weekly benefit rate in both the first and second half of FY2021 (56.4% and 57.6%, respectively). In the second half of FY2021, 8.1% of fishing claims received the temporary minimum weekly benefit rate of $500.
2.4.2 Seasonal component of Employment Insurance fishing benefits
EI fishing benefits are available for 2 fishing seasons per year (winter and summer), allowing eligible claimants to establish more than 1 claim in a year. The 28,288 new fishing claims established during the reporting period were established by 19,970 fishers—of them, 11,663 established a single claim while the rest (8,307 fishers) established multiple claims.
Table 32 outlines the number of fishers that established claims by season of establishment for the past 5 years. Overall, the number of fishers who established a fishing claim during the reporting period decreased by 5.9% from the previous year. The number of fishers who established solely a winter claim markedly decreased during this period by 17.8%, likely due to the introduction of the CERB that was available at the time. In contrast, the number of fishers who established solely a summer claim increased by 2.0%.
| Season of establishment | FY1617 | FY1718 | FY1819 | FY1920 | FY2021 | Change (%) FY1920 to FY2021 |
|---|---|---|---|---|---|---|
| 1 season | 12,398 | 12,709 | 12,611 | 12,054 | 11,663 | -3.2% |
| Winter | 2,720 | 3,031 | 3,145 | 3,192 | 2,624 | -17.8% |
| Summer | 9,678 | 9,678 | 9,466 | 8,862 | 9,039 | +2.0% |
| 2 seasons | 8,267 | 8,667 | 8,876 | 9,162 | 8,307 | -9.3% |
| Canada | 20,665 | 21,376 | 21,487 | 21,216 | 19,970 | -5.9% |
- Source: Employment and Social Development Canada, Employment Insurance (EI) administrative data. Data are based on a 100% sample of EI administrative data.
In FY2021, fishers who established a single claim received an average of $12,873 (+10.2% year-over-year) in EI fishing benefits. This has increased steadily over the past 5 years. Those who had established 2 fishing claims received an average of $10,021 (+0.9%) for the first claim and an average of $9,816 (‑8.0%) for the second claim, for a total average of $19,838 (-3.7%) received in EI fishing benefits in FY2021. In comparison, the average EI regular benefits paid to claimants was $12,668 for regular claims established in the second half of FY2021.
2.4.3 Duration of Employment Insurance fishing benefits
Regardless of the local labour market conditions in a claimant’s region of residence, the maximum entitlement of a claim established for EI fishing benefits is 26 weeks. In FY2021, the average duration of a fishing claim was 20.3 weeks, down from 20.8 weeks (-0.5 week or -2.5%) from the previous fiscal year.
Among the provinces with a significant fishing industry, claims established in British Columbia have historically had the highest average duration of fishing benefits and this reporting year was of no exception—the average duration in FY2021 was 23.3 weeks, same as the previous year. The average duration of EI fishing benefits in Atlantic Canada (20.0 weeks in the reporting year) has historically been lower than the national average (20.3 weeks in the reporting year), ranging between 19.7 weeks in Prince Edward Island and 20.4 weeks in Nova Scotia. Claims established in Quebec had the lowest average duration at 18.6 weeks in FY2021 (consult annex 2.9.2).
The lower average duration of claims in the Atlantic Provinces and Quebec may be attributable to the fact that a greater share of fishers in these regions establish 2 claims per year compared to those in other regions who mostly establish a single claim per year. For example, within the past 5 years, on average 48.6% fishers in the Atlantic Provinces and 66.3% fishers in Quebec established 2 claims per year, whereas the share of fishers with 2 claims during this period was 2.0% in British Columbia and 8.9% in all other provinces and territories combined.
Table 33 outlines the average duration of fishing benefits. During the reporting period, fishers who established a single fishing claim received an average of 23.4 weeks, unchanged from the previous fiscal year. Fishers who established 2 claims received an average of 18.9 weeks for their first claim and 17.4 weeks for their second claim, for a total average of 36.3 weeks for the whole year in FY2021, a decrease of 5.4% or 2.0 weeks compared to FY1920.
| Season | FY1920 Average duration (weeks) | FY2021 Average duration (weeks) | Change (%) FY1920 to FY2021 |
|---|---|---|---|
| 1 season / 1 claim | 23.4 | 23.4 | +0.3% |
| 2 seasons / 2 claims | 38.3 | 36.3 | -5.4% |
| First claim | 18.6 | 18.9 | +1.8% |
| Second claim | 19.8 | 17.4 | -12.1% |
- Note: Percentage change is based on unrounded numbers.
- Source: Employment and Social Development Canada, Employment Insurance (EI) administrative data. Data are based on a 100% sample of EI administrative data.
2.5 Employment Insurance Work-Sharing benefits
In this section
- 2.5.1 Overview
- 2.5.2 Work-Sharing temporary special measures: part of Canada’s COVID-19 economic response
- 2.5.3 Employers - increases in agreements across Canada
- 2.5.4 Workers - Employment Insurance Work-Sharing claims and amount paid
- 2.5.5 Level and duration of Employment Insurance Work-Sharing benefits
- 2.5.6 Employment Insurance Work-Sharing agreements subject to early termination and layoffs averted
- 2.5.7 What is the Work-Sharing program
2.5.1 Overview
The COVID-19 pandemic created a context with economic challenges of pandemic-related supply chain disruptions, regional lockdowns, closures of essential services such as schools and childcare and of non-essential businesses with restricted occupancy levels for workplaces that remained open over the last year. The Work-Sharing program played a key role in helping businesses and workers address these challenges and keep businesses open and employees on the job, ensuring a skilled and job-ready workforce as the economy recovers.
The Work-Sharing program is a key instrument in supporting employers and their workers in avoiding layoffs when there is a temporary reduction in business activity that is beyond the control of the employer. Layoffs are avoided by offering income support to EI-eligible workers who work a reduced workweek while their employer recovers. In this way, Work-Sharing agreements not only help employers retain skilled workers and avoid the costs of recruiting and training new employees once business activities return to normal but also help workers maintain their employment and skills while their employer recovers. They supplement reduced wages with EI benefits for the reduction in work hours. The goal of the program is for all participating employees to return to normal working hours by the end of the Work-Sharing agreement (consult subsection 2.5.7 for a comprehensive Program description).
Employment Insurance Work-Sharing benefits (illustrative example)
Fatima is a full-time employee providing valuable services to clients at a Regina, Saskatchewan not-for-profit organization that supports women from visible minorities. Since the start of the pandemic, public health restrictions limiting store occupancy have resulted in a steep decline in the organization’s normal revenue from the sale of raffle tickets in grocery stores across the city. To avoid layoffs and ensure the business remains viable, the organization, with the agreement of employees, established a Work-Sharing agreement with Service Canada.
Under the Work-Sharing agreement, participating, eligible employees reduced their weekly work hours by 35% and received EI Work-Sharing benefits for the hours they were not working. Prior to the Work-Sharing agreement, Fatima earned $35,000 per year, or $673 weekly. Under the Work-Sharing program, Fatima received a total of $567 per week ($437 in wages from her employer plus $130 from EI Work-Sharing benefits). If laid off, EI regular benefits could have provided her with a weekly income of $370. The Work-Sharing agreement not only helped Fatima and her colleagues maintain earnings closer to their regular levels, but also to keep their jobs, retain their skills and their employee benefits: health, dental and disability insurance, pension and paid vacation.
2.5.2 Work-Sharing temporary special measures: part of Canada’s COVID-19 economic response
In March 2020, measures to limit the spread of the COVID-19 virus caused sudden interruptions in business operations across Canada. Public health restrictions disrupted transit, education and childcare systems, closed non-essential businesses and restricted client access to many that remained open. As a result, over 3 million Canadians were impacted by either job loss or reduced work hours.Footnote 90
As part of Canada’s COVID-19 Economic Response Plan, temporary special measures were put in place in March 2020, at the onset of the pandemic, to assist workers and employers in all industries and sectors across Canada facing unexpected downturns due to COVID-19 to access the program. To support these temporary special measures, a total of $4.4M was provided via the Fall Economic Statement 2021, and $1.2B in additional funding via Budget 2021. COVID-19 temporary special measures are set to remain in effect until September 24, 2022. By helping to keep employers in business and employees employed, Work-Sharing contributed to maintaining a skilled and job-ready workforce as the economy recovers.
Key changes included:
- extending the maximum duration for agreements to 76 weeks (from 38 weeks). In FY2021, 40% of agreements exceeded 39 weeks, of which 3 quarters used up to 52 weeks recognizing that some employers require longer duration of supports than the standard 38 weeks during periods of economic downturn
- expanding employer and worker eligibility to include employers from the not-for-profit sector who were experiencing a reduction in revenue. This temporary measure to the not-for-profit sector allowed them to retain workers in a sector where it is difficult to recruit while providing much needed support to communities and vulnerable populations as highlighted by the pandemic
- streamlining the application process. This resulted in shorter Work-Sharing application processing timeframes, from 30 calendar days to 10 business days and made it easier for employees to access EI Work-Sharing benefits in a timely manner
- eliminating the cooling-off period. This meant that businesses were no longer required to wait the length of time of their previous Work-Sharing agreement before being eligible for a new agreement. Under standard program parameters, the cooling-off period ensures that employers and their employees cannot participate in back-to-back agreements thus helping to avoid over reliance on Work-Sharing benefits while ensuring appropriate access for businesses weathering temporary downturns
- expanding eligibility to employees essential to the recovery and viability of the business. These workers were previously excluded from the program to ensure that they could focus on business recovery. Given the extremely unusual circumstances of the pandemic (closures/restrictions etc.), even those individuals deemed necessary to the success of the business were no longer required to work full time to do this essential work. For example, if business activity was basically eliminated, at some point essential workers such as managers, marketing staff and IT staff did not have any full-time work to do
2.5.3 Employers - increases in agreements across Canada
As part of Canada’s COVID-19 Economic Response to the pandemic, other federal emergency support measures, such as the Canada Emergency Response Benefit, Canada Emergency Wage Subsidy, Canada Emergency Commercial Rent Assistance and Business Credit Availability Program were put in place. The temporary special measures to the parameters of the Work-sharing program were part of a toolkit to assist employers and their workers during the pandemic.
As the employment rate for Canadians aged 15 to 64 fell from record highs to record lows due to the pandemic, demand for the Work-Sharing program increased with more than 4,200 agreements put in place compared to 370 in the previous fiscal year (consult chart 17). As a result, employers reported averting more than 60,000 layoffs and over 130,000 employees participated in Work-Sharing agreements during this unprecedented time.
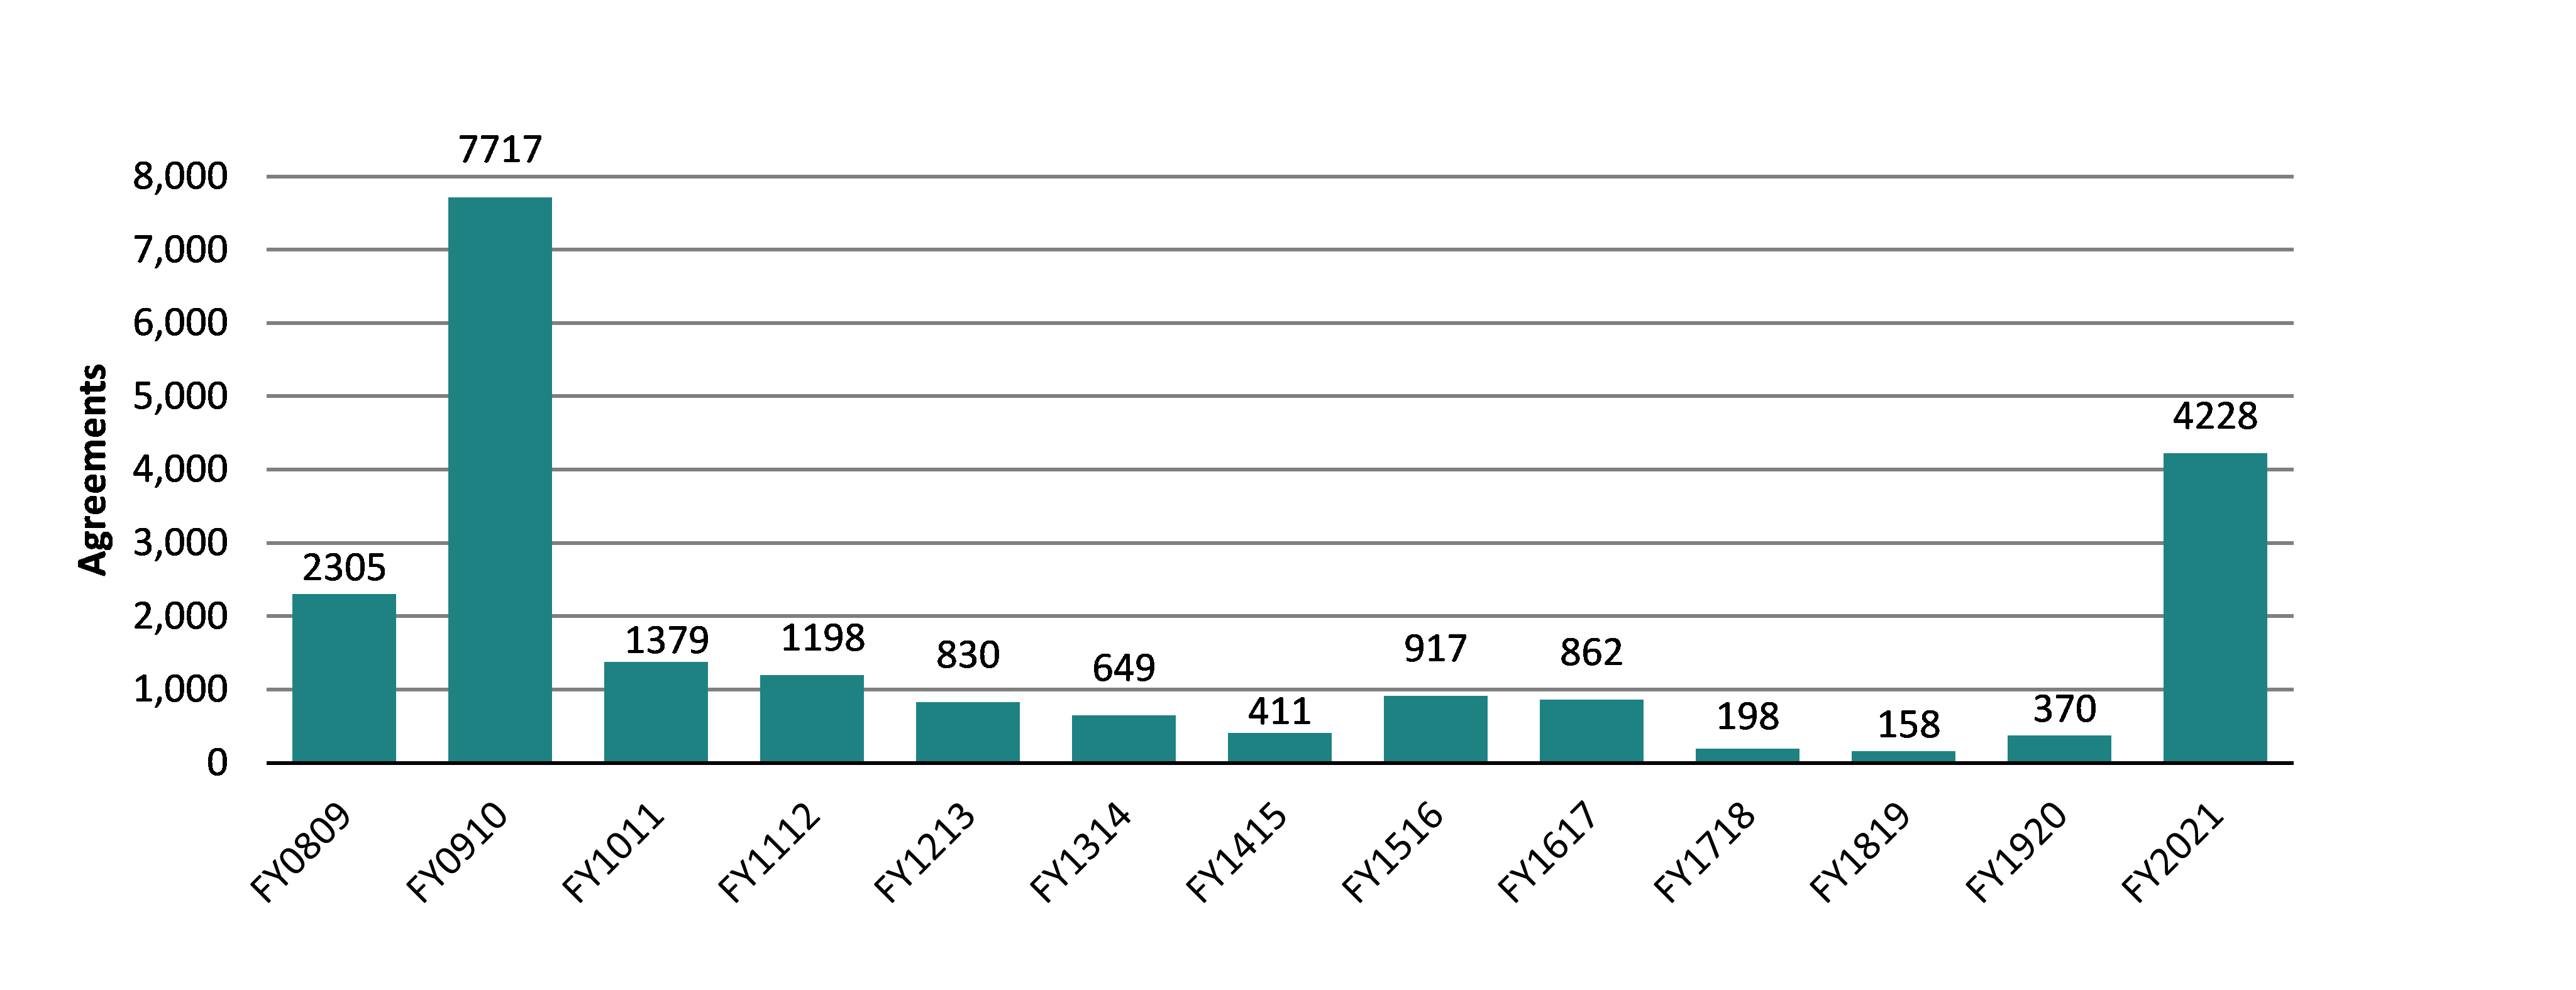
Text description of Chart 17
| Year | Agreements |
|---|---|
| FY0809 | 2,305 |
| FY0910 | 7,717 |
| FY1011 | 1,379 |
| FY1112 | 1,198 |
| FY1213 | 830 |
| FY1314 | 649 |
| FY1415 | 411 |
| FY1516 | 917 |
| FY1617 | 862 |
| FY1718 | 198 |
| FY1819 | 158 |
| FY1920 | 370 |
| FY2021 | 4,228 |
- Source: Employment and Social Development Canada, Common System of Grants and Contributions.
Nearly 98% of agreements were with small and medium sized businesses, which were the hardest hit employers by layoffs and suffered declining revenues during the pandemic. The demand for Work-Sharing agreements was immediate at the onset of the pandemic with nearly half (2,100) of the agreements coming into effect between April and May of 2020, during this first wave of the COVID-19 pandemic.
Across the country, in absolute terms, Ontario, Alberta and Quebec had the largest increases in agreements year-over-year. As expected, the number of agreements largely increased proportionally with respect to the size of the affected population in each jurisdiction. Alberta is a bit of an outlier in this context as oil prices in FY2021 may have added to their COVID-19 challenges. Table 34 provides details on regional distribution of agreements.
| Province or territory | FY1920 | FY2021 |
|---|---|---|
| Newfoundland and Labrador | 6 | 35 |
| Prince Edward Island | 5c | 8 |
| Nova Scotia | 5c | 78 |
| New Brunswick | 5c | 58 |
| Quebec | 64 | 818 |
| Ontario | 161 | 1,388 |
| Manitoba | 19 | 234 |
| Saskatchewan | 24 | 124 |
| Alberta | 65 | 873 |
| British Columbia | 26 | 603 |
| Territories | 0 | 7 |
| Canada | 370 | 4,228 |
- Source: Employment and Social Development Canada, Common System of Grants and Contributions.
- c Data for some regions have been combined for confidentiality purposes.
There were small increases in agreements that coincided with the subsequent waves of infections that occurred throughout the year (consult chart 18).
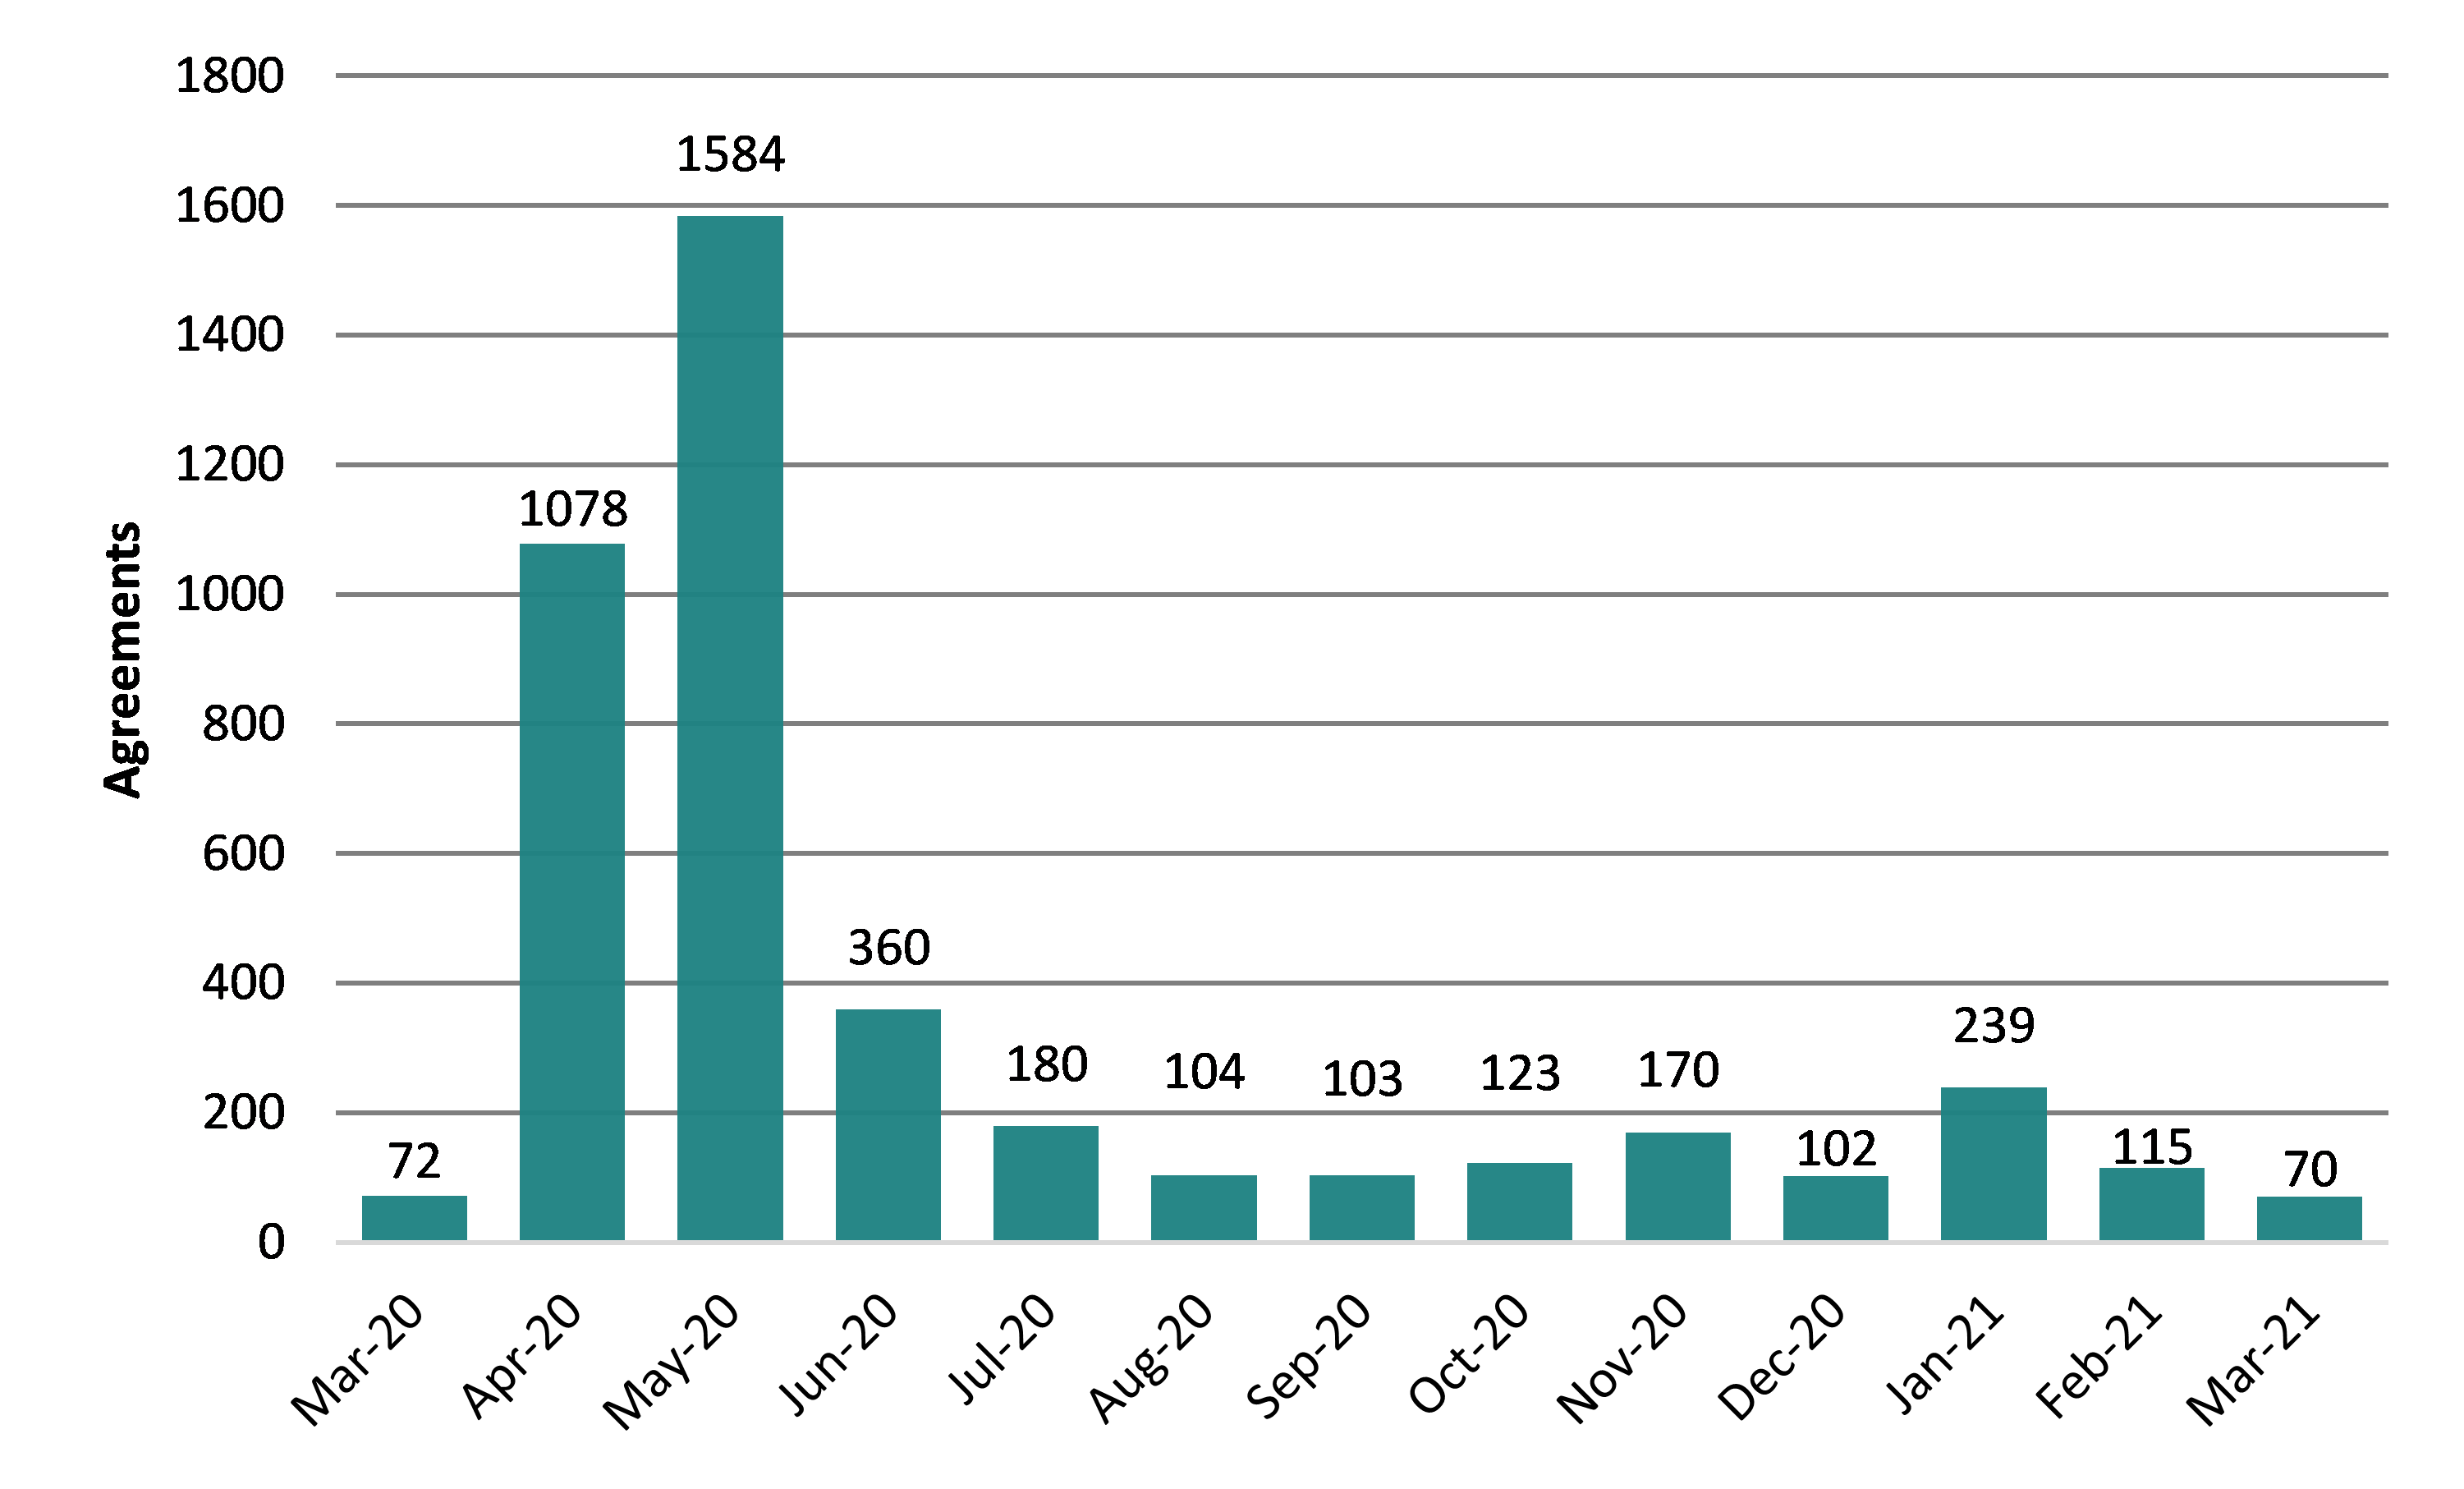
Text description of Chart 18
| Month | Agreements |
|---|---|
| Mar-20 | 72 |
| Apr-20 | 1,078 |
| May-20 | 1,584 |
| Jun-20 | 360 |
| Jul-20 | 180 |
| Aug-20 | 104 |
| Sep-20 | 103 |
| Oct-20 | 123 |
| Nov-20 | 170 |
| Dec-20 | 102 |
| Jan-21 | 239 |
| Feb-21 | 115 |
| Mar-21 | 70 |
- Source: Employment and Social Development Canada, Common System of Grants and Contributions.
Historically, two-thirds or more of Work-Sharing agreements were in goods-producing industries. The situation changed significantly in FY2021, as pandemic-related restrictions also impacted services- producing industries. Of the 2.7 million employment losses in April 2020, 76% (over 2 million) were in the services sector, with the arts, entertainment and recreation, accommodation and food services particularly impactedFootnote 91. The number of Work-Sharing agreements within the service sector increased by 2,400% in FY2021 compared to the previous year, accounting for the majority of all agreements (57%) (consult table 35, below, for details on the share of Work-sharing agreements by industry).
| Industry | FY1617 | FY1718 | FY1819 | FY1920 | FY2021 |
|---|---|---|---|---|---|
| Goods-producing industries | 606 (70.3%) | 130 (65.7%) | 126 (79.7%) | 266 (71.9%) | 1,752 (41.4%) |
| Mining, quarrying, and oil and gas extract | 90 (10.4%) | 3 (1.5%) | 4 (2.5%) | 5 (1.4%) | 56 (1.3%) |
| Construction | 86 (10.0%) | 14 (7.1%) | 11 (7.0%) | 25 (6.8%) | 262 (6.2%) |
| Manufacturing | 426 (49.4%) | 109 (55.1%) | 106 (67.1%) | 223 (60.3%) | 1,365 (32.3%) |
| Rest of goods-producing industries | 4 (0.5%) | 4 (2.0%) | 5 (3.2%) | 13 (3.5%) | 69 (1.6%) |
| Services-producing industries | 256 (29.7%) | 68 (34.3%) | 32 (20.3%) | 104 (28.1%) | 2,476 (58.6%) |
| Wholesale trade | 65 (7.5%) | 14 (7.1%) | 4 (2.5%) | 10 (2.7%) | 257 (6.1%) |
| Retail trade | 26 (3.0%) | 12 (6.1%) | 4 (2.5%) | 16 (4.3%) | 307 (7.3%) |
| Professional, scientific and technical services | 66 (7.7%) | 25 (12.6%) | 11 (7.0%) | 24 (6.5%) | 621 (14.7%) |
| Rest of services-producing industries | 99 (11.5%) | 17 (8.6%) | 13 (8.2%) | 54 (14.6%) | 1,291 (30.5%) |
| Canada | 862 (100.0%) | 198 (100.0%) | 158 (100.0%) | 370 (100.0%) | 4,228 (100.0%) |
- Source: Employment and Social Development Canada, Common System of Grants and Contributions.
The distribution of Work-Sharing agreements by employer size has remained consistent since the FY0809 recession. Since then, over 95% of agreements assisted small and medium sized businesses (fewer than 500 employees) to recover from disruptions to their normal levels of business activities.
2.5.4 Workers - Employment Insurance Work-Sharing claims and amount paid
Claims from workers participating in a Work-sharing agreement increased over 650% and the amount of EI benefits paid increased by 1,000% compared to the previous year. The increases in Work-Sharing program agreements and benefits paid are directly linked to the decline in economic activity and the slow recovery across sectors and regions (consult chart 19).
Claims: While the number of new claims from workers and the amounts paid increased in all provinces and territories, Ontario and Quebec, the 2 most populous provinces, continued to account for over half of both new claims and amounts paid. In addition, there were 40 claims from workers in the territories (Nunavut, Northwest and the Yukon), for the first time in the last 6 fiscal years prior to which there were no claims.
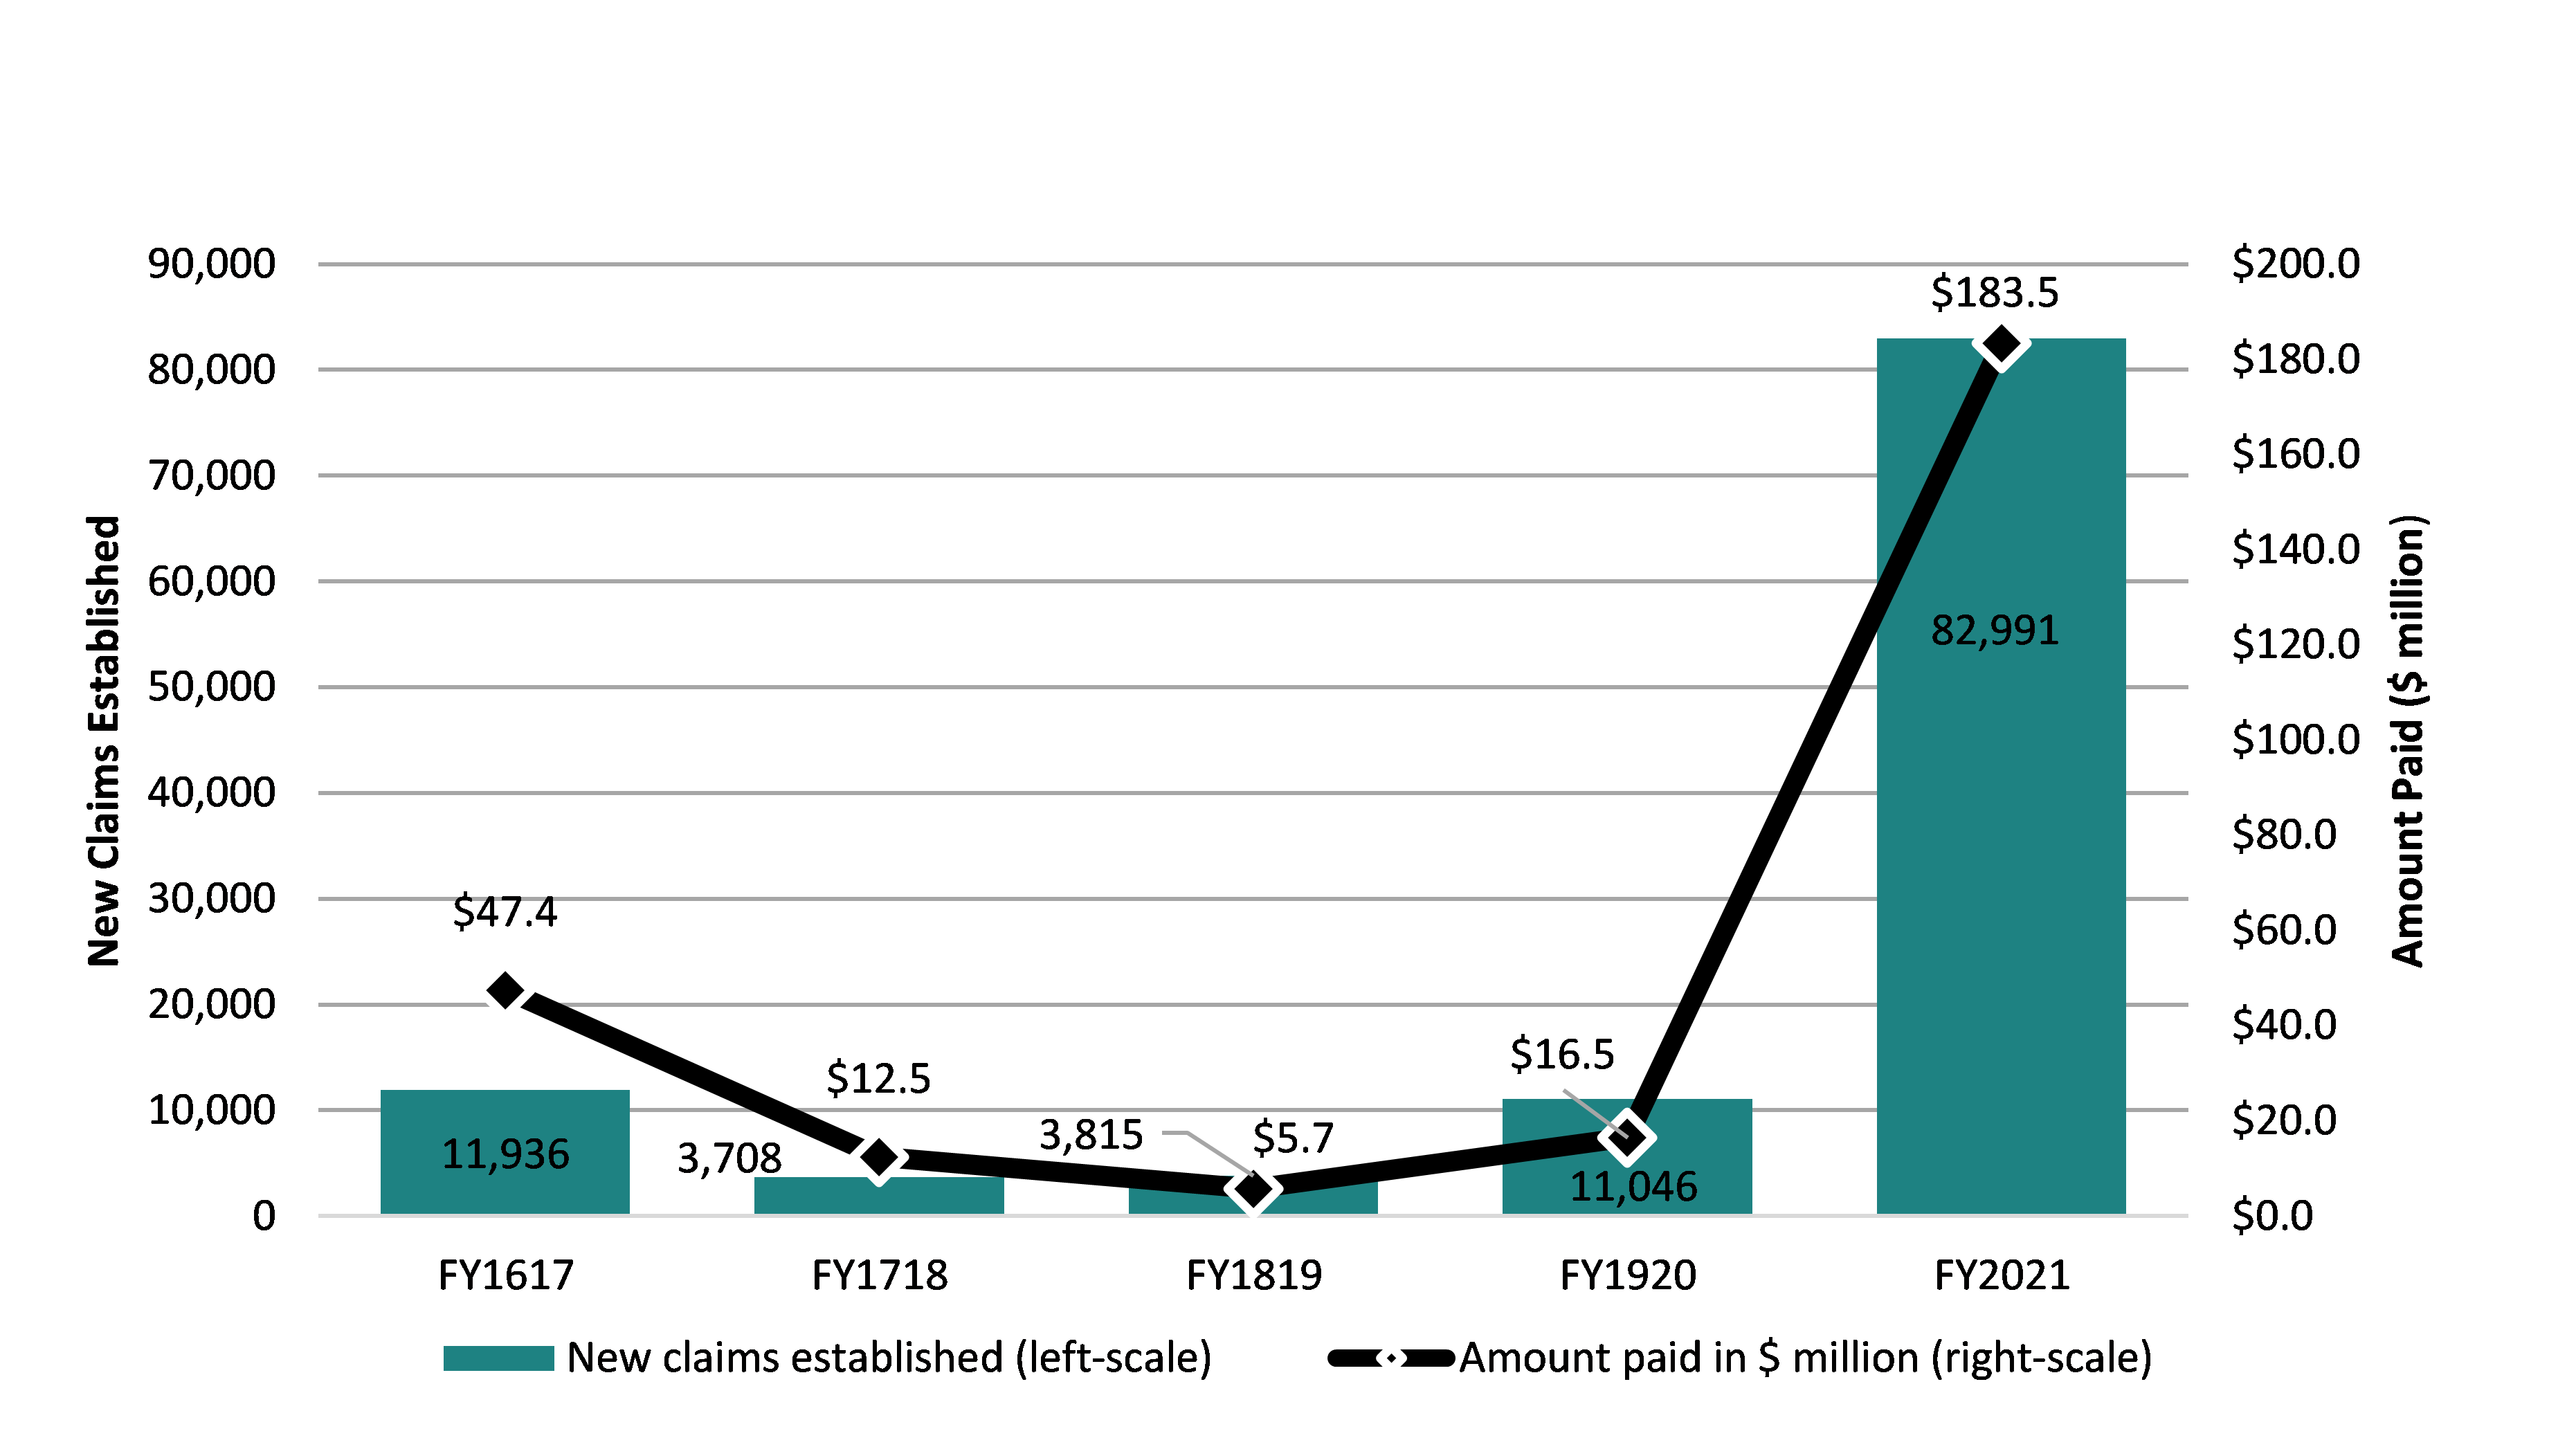
Text description of Chart 19
| Year | New claims established | Amount paid ($ million) |
|---|---|---|
| FY1617 | 11,936 | 47.4 |
| FY1718 | 3,708 | 12.5 |
| FY1819 | 3,815 | 5.7 |
| FY1920 | 11,046 | 16.5 |
| FY2021 | 82,991 | 183.5 |
- Source: Employment and Social Development Canada, Employment Insurance (EI) administrative data. Data is based on a 100% sample of EI administrative data.
Demographics: There were notable changes in the demographics of program participants from the previous year. Notably, women accounted for over one-third of claims in FY2021 and received a commensurate proportion of benefits paid, up from approximately one-fifth compared to the previous year. This increase could be linked to the tripling of the proportion of claims established and quadrupling of benefits paid to workers in the service industries.
Age distribution: The age distribution of claimants remained relatively unchanged. Individuals aged 25 to 54 continued to account for two-thirds of claims established and benefits paid. Youth remained under-represented among new Work-Sharing claims established, relative to their share of national employment figures (12% in FY2021).Footnote 92 Fewer youth are likely to qualify for EI; only about half of employed youth were occupying full-time positions compared to 89% of workers aged 25 to 54.
Sectors: Some key highlights for sectors of claimants include:
- in previous years, employees in the goods-producing industries accounted for over four-fifths of claims and benefits paid. Despite the number of claims established in the goods-producing industries increasing by almost 350% compared to the previous year, the service sector increase was over 2,200%
- the increased take-up of claims and benefits in the service industry was led by the wholesale trade sector and professional, scientific and technical services sector accounting for nearly half of all participating employees from the group
- the utilities, finance and insurance sectors remained steady, less affected by restrictions for onsite workplaces or with a greater ability to work remotelyFootnote 93
- although the amounts increased in FY2021, the proportionate share of benefits paid to the sectors remained stable
- the employees from the manufacturing sector account for nearly half of the claimants participating to the program and continue to receive close to half of the total EI Work-Sharing benefits paid, which is disproportionate to their approximately 9%Footnote 94 share of total national employment figures
Additional details on regional, gender, age and industry breakdowns on claims and the amount of EI benefits paid are presented in table 36, below.
| Category | New claims established FY1920 | New claims established FY2021 | Amount paid ($ millions) FY1920 | Amount paid ($ millions) FY2021 |
|---|---|---|---|---|
| Newfoundland and Labrador | 47c (0.4%) | 498 (0.6%) | $0.08 (0.5%) | $1.0 (0.5%) |
| Prince Edward Island | 47c (0.4%) | 121 (0.1%) | $0.00 (0.0%) | $0.3 (0.2%) |
| Nova Scotia | 70 (0.6%) | 2,029 (2.4%) | $0.07 (0.4%) | $3.8 (2.1%) |
| New Brunswick | 70 (0.6%) | 1,253 (1.5%) | $0.01 (0.0%) | $2.0 (1.1%) |
| Quebec | 2,385 (21.6%) | 19,666 (23.7%) | $4.2 (25.2%) | $36.1 (19.7%) |
| Ontario | 3,969 (35.9%) | 29,381 (35.4%) | $5.4 (32.8%) | $68.3 (37.2%) |
| Manitoba | 1,729 (15.7%) | 6,733 (8.1%) | $2.7 (16.3%) | $11.2 (6.1%) |
| Saskatchewan | 642 (5.8%) | 1,742 (2.1%) | $1.7 (10.0%) | $5.6 (3.1%) |
| Alberta | 1,089 (9.9%) | 11,770 (14.2%) | $1.4 (8.6%) | $32.9 (17.9%) |
| British Columbia | 1,045 (9.5%) | 9,758 (11.8%) | $1.0 (6.1%) | $21.8 (11.9%) |
| Territories | 0 (0.0%) | 40 (0.05%) | $0.00 (0.0%) | $0.4 (0.2%) |
| Men | 8,528 (77.2%) | 52,895 (63.7%) | $12.8 (77.7%) | $117.8 (64.2%) |
| Women | 2,518 (22.8%) | 30,096 (36.3%) | $3.7 (22.3%) | $65.6 (35.8%) |
| 24 years old and under | 748 (6.8%) | 4,272 (5.1%) | $1.0 (6.1%) | $7.6 (4.1%) |
| 25 to 44 years old | 4,644 (42.0%) | 36,683 (44.2%) | $6.3 (38.2%) | $76.7 (41.8%) |
| 45 to 54 years old | 2,809 (25.4%) | 21,295 (25.7%) | $4.5 (27.0%) | $48.7 (26.6%) |
| 55 years old and over | 2,845 (25.8%) | 20,741 (25.0%) | $4.7 (28.6%) | $50.5 (27.5%) |
| Goods-producing industries | 9,347 (84.6%) | 43,142 (52.0%) | $14.9 (90.4%) | $97.3 (53.0%) |
| Manufacturing | 9,025 (81.7%) | 40,246 (48.5%) | $14.3 (86.6%) | $88.2 (48.1%) |
| Rest of goods-industries | 322 (2.9%) | 2,896 (3.5%) | $0.6 (3.8%) | $9.0 (4.9%) |
| Service-producing industries | 1,642 (14.9%) | 37,959 (45.7%) | $1.6 (9.4%) | $81.7 (44.5%) |
| Wholesale trade | 581 (5.3%) | 10,321 (12.4%) | $0.5 (3.0%) | $18.9 (10.3%) |
| Professional, scientific and technical services | 311 (2.8%) | 8,474 (10.2%) | $0.4 (2.6%) | $17.9 (9.7%) |
| Rest of service-producing industries | 807 (7.3%) | 21,054 (25.4%) | $0.7 (4.0%) | $49.4 (26.9%) |
| Canada | 11,046 (100.0%) | 82,991 (100.0%) | $16.5 (100.0%) | $183.5 (100.0%) |
- Note: Data may not add up to the total due to rounding. Percentage share is based on unrounded numbers. Includes claims for which at least $1 of Employment Insurance (EI) Work-Sharing benefits was paid.
- c Data for some regions have been combined for confidentiality purposes.
- Source: Employment and Social Development Canada, EI administrative data. Data for claims and amount paid are based on a 100% sample of EI administrative data.
2.5.5 Level and duration of Employment Insurance Work-Sharing benefits
In FY2021, the national average weekly Work-Sharing benefit paid amount of $133 remained almost unchanged over the previous year.Footnote 95 It increased in Prince Edward Island, Ontario and Saskatchewan. The territories had the highest weekly rates while Manitoba and the Atlantic provinces had the lowest average weekly benefit rates in Canada.
Gender: From a gender perspective, a modest increase in women’s average benefit rate in FY2021 brought them closer to parity with men. Younger workers’ average weekly Work-Sharing benefit rate continued to decline compared to those in older age groups.
Sector: While the overall average weekly Work-Sharing benefit rate decreased by only 4% since the previous year, there was significant variability across industries, with a 15% drop in the benefit rates in Wholesale Trade. There was a 28% increase for the Accommodation and Food Services which may be due to higher earners participating in Work-Sharing Agreements although program data to substantiate this is not available.
Consult table 37, below, for breakdowns of EI Work-Sharing average weekly benefit rate by region, gender, and industry.
| Category | FY1920 | FY2021 | Change (%) |
|---|---|---|---|
| Atlantic provincesc | $151 | $122 | -18.8% |
| Quebec | $136 | $127 | -6.4% |
| Ontario | $127 | $139 | +9.4% |
| Manitoba | $149 | $119 | -20.0% |
| Saskatchewan | $152 | $154 | +1.5% |
| Alberta | $159 | $139 | -12.8% |
| British Columbia | $142 | $130 | -8.5% |
| Yukon | 0 | $143 | n/a |
| Northwest Territories | 0 | $180 | n/a |
| Nunavut | 0 | $197 | n/a |
| Men | $143 | $134 | -6.3% |
| Women | $124 | $131 | +5.5% |
| 24 years old and under | $134 | $122 | -8.7% |
| 25 to 44 years old | $139 | $132 | -5.3% |
| 45 to 54 years old | $140 | $134 | -4.4% |
| 55 years old and over | $138 | $137 | -1.2% |
| Good-producing industries | $138 | $136 | -1.3% |
| Construction | $173 | $151 | -13.1% |
| Manufacturing | $136 | $134 | -1.3% |
| Service-producing industries | $143 | $129 | -9.7% |
| Wholesale trade | $138 | $117 | -15.1% |
| Finance and insurance | $122 | $130 | +6.7% |
| Accommodations and food services | $111 | $142 | +27.4% |
| Canada | $139 | $133 | -4.1% |
- Note: Percentage change is based on unrounded numbers. Includes claims for which at least $1 of Work-Sharing benefits was paid.
- c Data for some provinces have been combined for confidentiality purposes.
- Source: Employment and Social Development Canada, Employment Insurance (EI) administrative data. Data are based on a 100% sample of EI administrative data.
As shown in Chart 20, the average duration of Work-Sharing claims completed in FY2021 was 12 weeks, a decrease of close to 2 and a half weeks from the previous year. The reduced average duration of agreements is likely a result of an increased number of agreements terminating early (consult subsection 2.5.6 for additional insights).
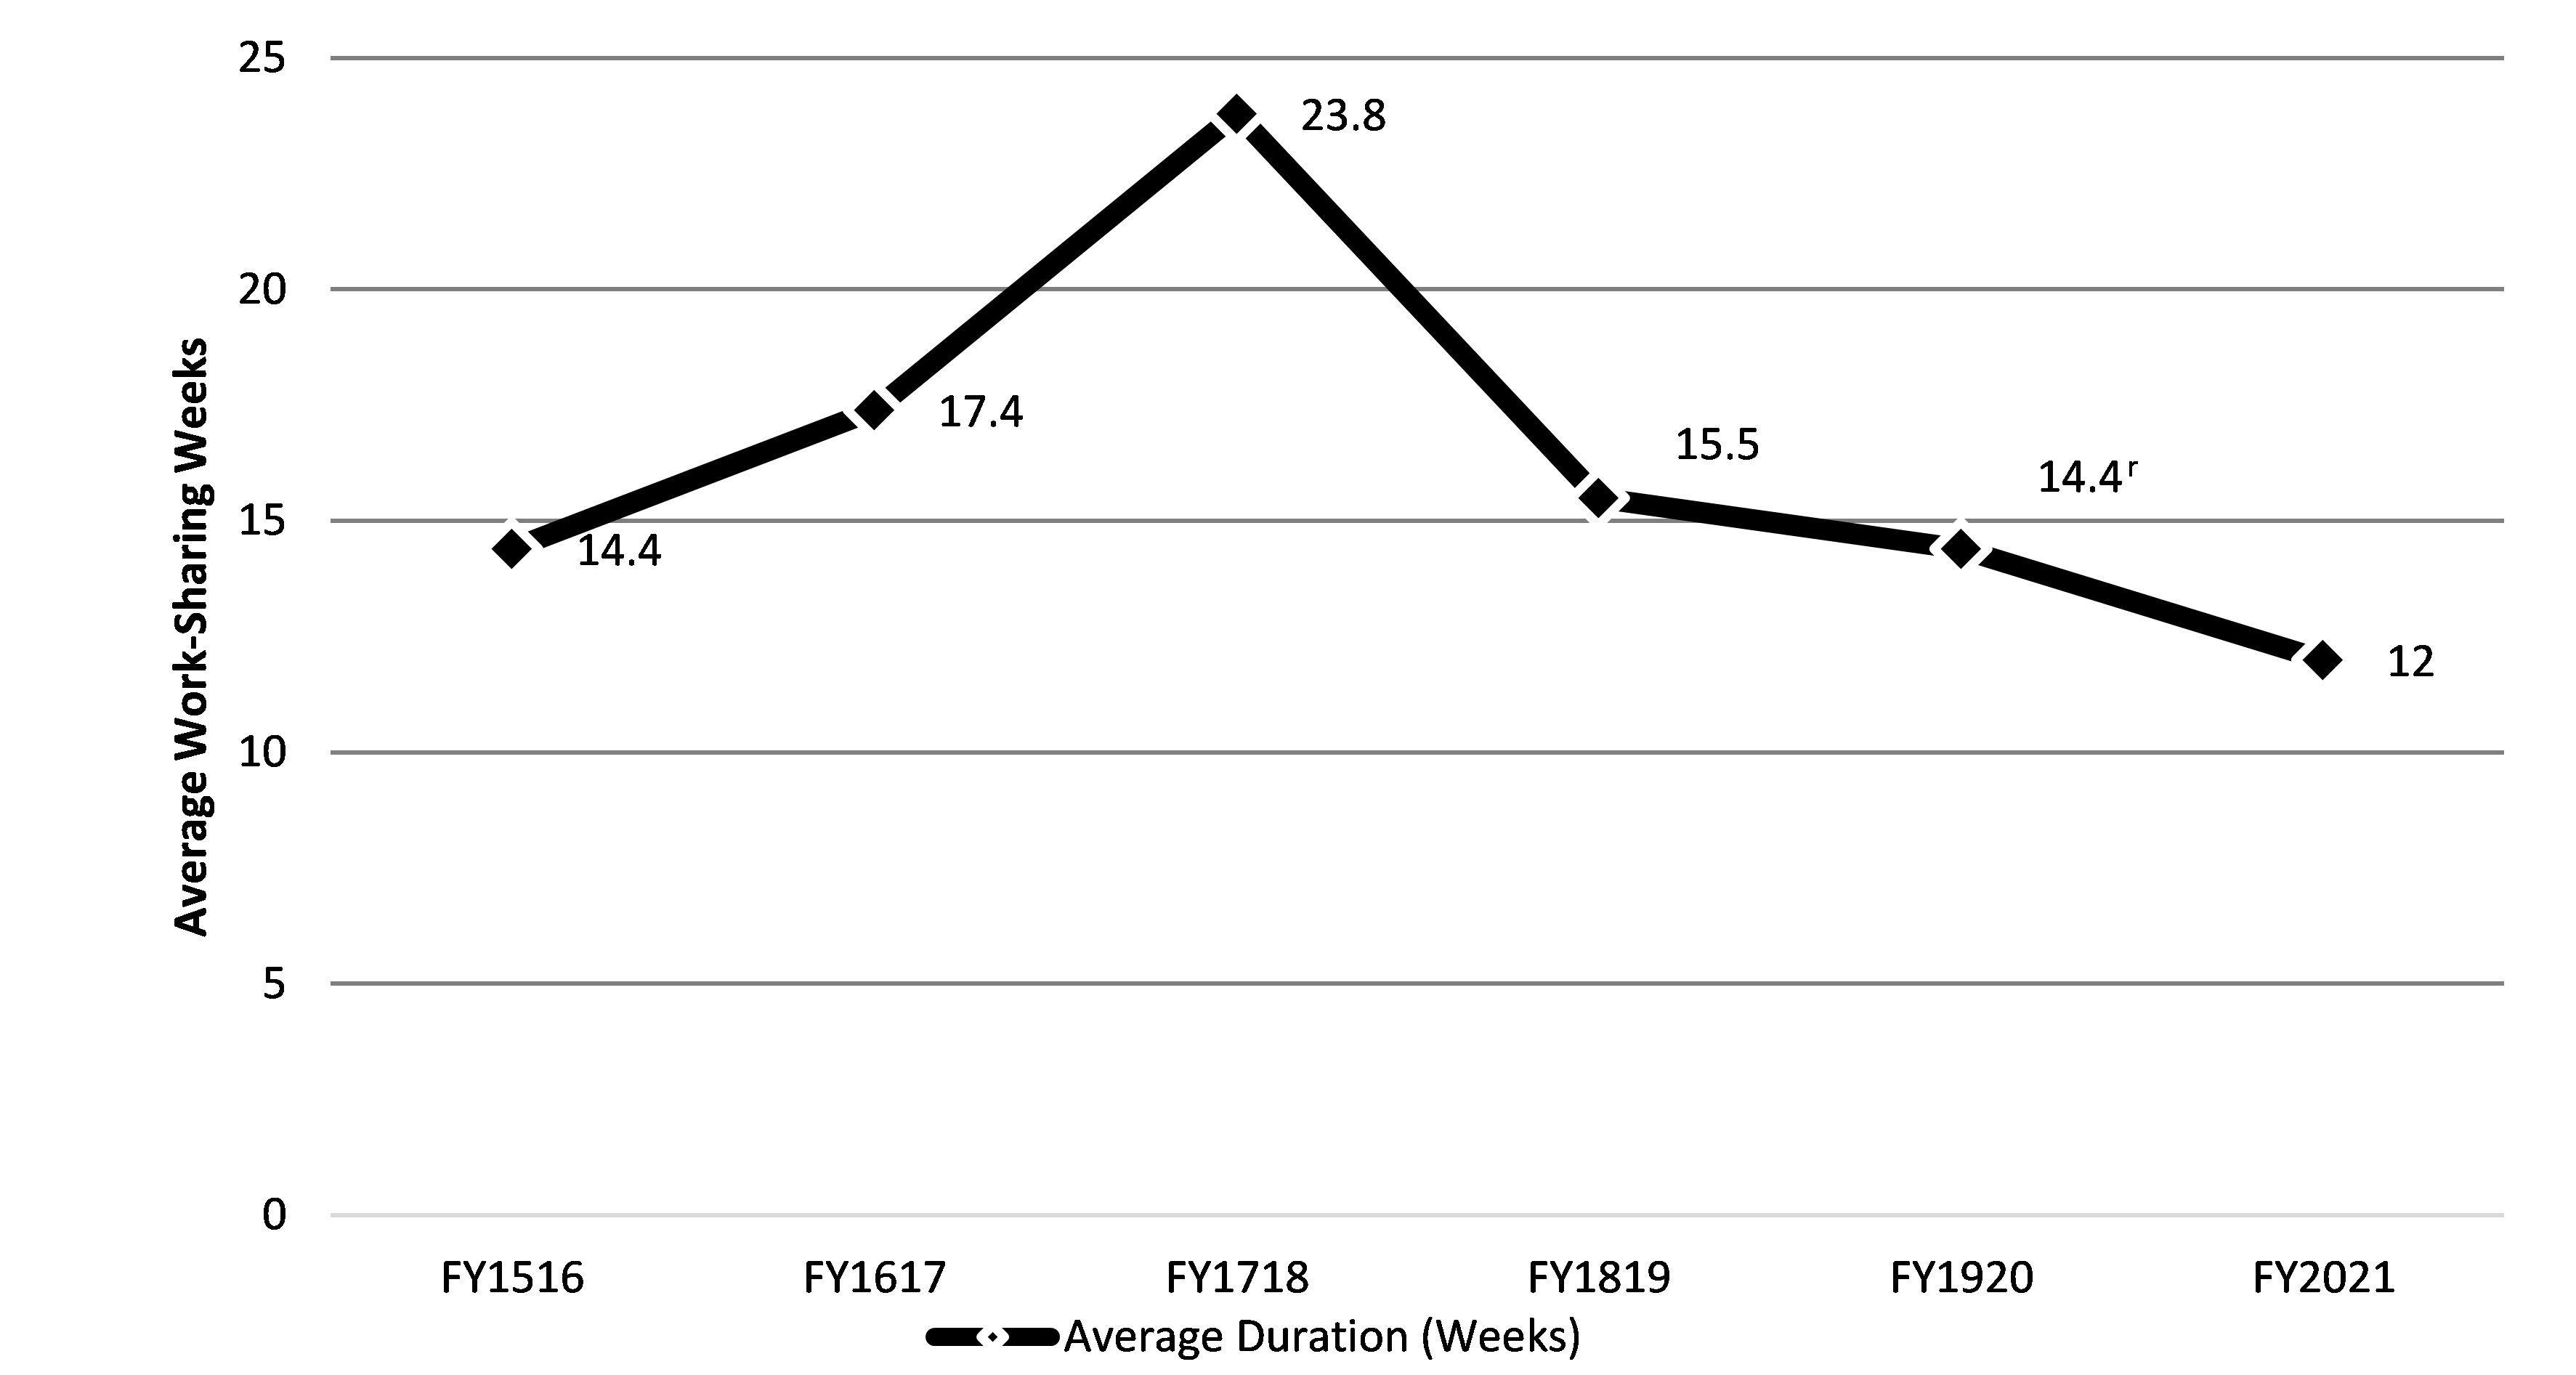
Text description of Chart 20
| Year | Average Work-Sharing weeks |
|---|---|
| FY1516 | 14.4 |
| FY1617 | 17.4 |
| FY1718 | 23.8 |
| FY1819 | 15.5 |
| FY1920 | 14.4 |
| FY2021 | 12 |
- Note: Includes all claims for which at least $1 of Work-Sharing benefits was paid.
- r Revised data.
- Source: Employment and Social Development Canada, Employment Insurance (EI) administrative data. Data are based on a 100% sample of EI administrative data.
2.5.6 Employment Insurance Work-Sharing agreements subject to early termination and layoffs averted
When a Work-Sharing agreement ends before the anticipated end date, this is termed an early termination. Early termination may be due to a number of reasons, for example, a return to normal levels of business activity, a decision to proceed with layoffs, or a shutdown.Footnote 96 Early terminations in FY2021 increased to almost three-quarters of all agreements, up from half the previous year. The significant increase in early terminations could be an indication of a high proportion of employers using the program intermittently between periods of mandatory lockdowns and public health restrictions. Additional emergency CRA COVID-19 benefits, following the introduction of ESDC’s Work-Sharing COVID-19 Temporary Special Measures, may have also led some employers to switch benefits to meet their specific needs.
2.5.7 What is the Work-Sharing program?
Work-Sharing is a labour market adjustment program operating under the authority of section 24 of the EI Act, and sections 42-49 of the EI regulations. Work-Sharing agreements must include a reduction in work activity ranging between 10% and 60% of the employees’ regular weekly work schedule. In any given week, the work reduction can vary depending on available work, as long as the work reduction on average over the life of the agreement is between 10% and 60%. The proposed reduction in work hours should correspond with the number of anticipated temporary layoffs.
During participation in a Work-Sharing agreement, employer initiated training activities may take place. Training costs maybe funded by the employer or through other available supports, such as provincial or territorial programming. The salary costs of employees taking part in training activities during normal scheduled working hours/days cannot be compensated through the Work-Sharing agreement. Training can take place during the non-working days/hours for which the participating employees are in receipt of EI Work-Sharing benefits.
Under the standard program eligibility parameters, employers must meet the following criteria:
- have been in business in Canada year-round for at least 2 years
- be a publicly-held company, private business or a not-for-profit organization
- experience temporary shortages of work and reductions in business activity that are beyond their control, and the shortage of work is not a cyclical or recurring slowdown
- employ at least 2 EI-eligible employees in the work unit
- demonstrate a recent decrease of approximately 10% to 60% of their business activity
- submit and implement a recovery plan, indicating activities and measures that will return employees to normal levels of employment upon the completion of the Work-Sharing agreement
- commit to maintain employee benefits throughout the Work-Sharing agreement period
Employees participating in a Work-Sharing agreement must:
- be year-round permanent full-time or part-time employees who are required to carry out the everyday functions of normal business activity
- be eligible to receive EI regular benefits, and
- agree to a reduction of their normal working hours and to share equally the available work among all members of their Work-Sharing unit over a specified period of time
Under the standard program, an initial Work-Sharing agreement can last between a minimum of 6 and a maximum of 26 consecutive weeks. This duration can be extended for up to 12 additional weeks (allowing a Work-Sharing agreement to last up to 38 weeks), if needed. In the case of an extension, employers must continue to experience a reduction in business activity, attest that Work-Sharing will result in averting the layoff of 1 or more employees and that the period of the extension is needed to complete the return to normal working hours. After completing an agreement, employers requesting another agreement are required to serve a mandatory cooling-off period between agreements equal to the previous agreement’s duration (up to a maximum period of 38 weeks).
2.6 Employment Insurance special benefits
In this section
- 2.6.1 Employment Insurance special benefit claims overview
- 2.6.2 Employment Insurance maternity and parental benefits
- 2.6.3 Employment Insurance sickness benefits
- 2.6.4 Employment Insurance compassionate care benefits
- 2.6.5 Employment Insurance family caregiver benefits for adults
- 2.6.6 Employment Insurance family caregiver benefits for children
- 2.6.7 Employment Insurance special benefits for self-employed persons
EI special benefits provide temporary income support to employees, self-employed persons participating in the program and fishers, who are eligible and unable to work due to specific life circumstances. These include sickness or injury; pregnancy or giving birth; providing care to a newborn or newly adopted child, and providing care or support to a critically ill or injured person or someone needing end-of-life care.
To qualify for EI special benefits, insured employees must have accumulated a minimum number of hours of insurable employment during their qualifying period.Footnote 97 The minimum was 600 hours for claims established during the first half of FY2021, and 120 hours (due to the EI temporary measure relating to the one-time credit of 480 hours) for claims established during the second half of FY2021 (consult section 2.0).Footnote 98 Insured employees must also meet the eligibility criteria for the special benefits claimed, and have their normal weekly earnings reduced by more than 40%. Self-employed persons may qualify if they opted into the EI program and paid EI premiums at least 1 full year prior to claiming benefits, had self-employment income that met the minimum self-employment eligibility thresholdFootnote 99 in the calendar year preceding the claim, and met other eligibility criteria specific to the special benefits being claimed.
As explained in section 2.0, no new claims for sickness benefits were established during the first half of FY2021, and some of the key indicators in the following subsections are presented separately for the first and second half of FY2021.
Subsection 2.6.1 provides a summary overview of special benefits in terms of the number of new claims established, amount paid and level of benefits. The following subsections examine the EI special benefits by type. Subsection 2.6.2 discusses maternity and parental benefits. Sickness benefits are introduced in subsection 2.6.3. Subsections 2.6.4, 2.6.5 and 2.6.6 examine compassionate care benefits, the family caregiver benefit for adults and the family caregiver benefit for children, respectively. Finally, subsection 2.6.7 looks at the use of special benefits by self-employed persons who have opted into the EI program. For the purpose of the following section, EI special benefit claims refer to EI claims for which at least 1 dollar of special benefits was paid.Footnote 100
2.6.1 Employment Insurance special benefit claims overview
During FY2021, almost 671,300 new EI special benefit claims were established (consult table 38). More than 8 special benefit claims out of 10 were established during the second half of FY2021. This may be due to the fact that sickness benefits were not available in the first half of FY2021 and to the EI temporary measure that allowed to be eligible for benefits with only 120 hours of insurable employment for claims established in the second half of FY2021 (consult section 2.0).
| Benefit type | Number of claims (FY1920) | Number of claims (first half of FY2021) | Number of claims (second half of FY2021) | Number of claims (total FY2021) | Amount paid ($ million) FY1920 | Amount paid ($ million) FY2021 |
|---|---|---|---|---|---|---|
| Maternity | 167,690 | 74,330 | 92,580 | 166,910 | $1,208.1 | $1,324.7 |
| Parental | 212,750 | 97,960 | 115,140 | 213,100 | $2,921.7 | $3,177.8 |
| Sickness | 421,140 | n/a | 450,350 | 450,350 | $1,888.8 | $1,999.3 |
| Compassionate care | 7,581 | 2,518 | 4,284 | 6,802 | $39.6 | $43.4 |
| Family caregiver for adults | 11,592 | 4,190 | 8,018 | 12,208 | $55.7 | $69.3 |
| Family caregiver for children | 5,403 | 2,272 | 3,250 | 5,522 | $36.3 | $41.2 |
| Canada | 619,270 | 112,860 | 558,400 | 671,260 | $6,150.1 | $6,655.7 |
- Note: Data may not add up to total due to rounding. Includes all claims for which at least $1 in EI special benefit was paid. New claims established by benefit type may not sum as claimants can receive multiple benefit types on a single claim.
- * Starting in FY2021, data on family caregiver benefits for adults and children are included in the total number of special benefit claims, which could affect comparisons with previous years. They were previously excluded due to the incompatibility of administrative data sources.
- Source: Employment and Social Development Canada, Employment Insurance (EI) administrative data. Data on maternity, parental and sickness benefits are based on a 10% sample of EI administrative data, whereas data on compassionate care benefits, family caregiver benefits for adults and family caregiver benefits for children are based on a 100% sample.
Similar to FY1920, sickness benefits continued to represent more than two-thirds (67.1%) of special benefit claims established in FY2021 as a whole. During the same period, 31.7% and 24.9% of special benefit claims included parental and maternity benefits, respectively. Approximately 1.8% of all special benefit claims included family caregiver benefits for adults, 1.0% had compassionate care benefits, and 0.8% included family caregiver benefits for children.Footnote 101
The total amount paid out in special benefits reached $6.7 billion for FY2021. Amounts paid have increased for all benefit types compared to FY1920.
In FY2021, women established a larger share (62.1%) of special benefit claims than men (37.9%). This breakdown of claims by gender remained virtually unchanged from the previous fiscal year. Women also continued to receive a greater share of the amounts paid in special benefits than men during FY2021 (80.5% and 19.5%, respectively). This is mainly because only women can receive maternity benefits, a higher share of women than men receive parental benefits, and on average, men who receive parental benefits receive fewer weeks of benefits than women.
By age, claimants under 45 years continued to account for almost two-thirds (65.8%) of new special benefit claims and receive the largest share of the total amount paid in special benefits (82.0%) in FY2021. However, the share of claims established by claimants aged 24 years and under increased by 2.4 percentage points, from 6.6% in FY1920 to 9.0% in FY2021. This increase may be due to the EI temporary measure that reduced the number of hours of insurable employment required to qualify for EI special benefits for claims established in the second half of FY2021. Individuals aged 24 years and under are generally less likely to have enough hours of insurable employment to qualify for EI benefits.
Excluding extended parental benefits, which are paid at a lower benefit rate than other types of special benefits (consult subsection 2.6.2), the average weekly benefit rate was $518 for special benefit claims established during the first half of FY2021. It was $539 for claims established during the second half of the fiscal year when the EI temporary measure relating to the minimum benefit rate was in effect (consult section 2.0).
For all types of special benefits combined, the proportion of claims receiving the maximum weekly benefit rate that applied in the first and second half of the fiscal year was 64.0% and 42.5%, respectively. The share of claimants receiving the minimum weekly benefit rate of $500 (or $300 for extended parental benefits) in the second half of FY2021 was 47.0%.
Employment Insurance special benefits and firms
According to 2019 tax data, which is the most recent microdata available when writing this report, there were approximately 209,830 firms (16.7% of all firms in 2019) which were associated with the establishment of an EI special benefit claim as a claimant’s current or most recent employer (consult table 39). This is an increase of 1.7% from 2018.
| Firm size | Number of firms | Number of firms with at least 1 employee receiving EI special benefits | Employment distribution** (% share) | Distribution of EI special benefit claimants*** (% share) | Distribution of EI sickness benefit claimants*** (% share) |
|---|---|---|---|---|---|
| Small | 1,138,620 | 121,690 | 21.2% | 18.3% | 20.6% |
| Small-medium | 96,890 | 68,780 | 19.5% | 21.7% | 26.1% |
| Medium-large | 16,740 | 16,040 | 16.2% | 18.9% | 21.3% |
| Large | 3,350 | 3,330 | 43.0% | 41.1% | 32.0% |
| Canada | 1,255,600 | 209,830 | 100.0% | 100.0% | 100.0% |
- * The categories of firm size reflect those found in Business Dynamics in Canada, a Statistics Canada publication. Small-sized firms are defined as those that employ 1 to 19 employees. Small-to-medium sized firms employ 20 to 99 employees. Medium-to-large sized firms employ 100 to 499 employees. Large-sized firms employ 500 employees or more.
- ** The number of workers in a firm is the number of individuals with employment income in that firm, as indicated on a T4 form. The number of workers is adjusted so that each individual in the labour force is only counted once and individuals who work for more than 1 firm are taken into account. For example, if an employee earned $25,000 in firm 1 and $25,000 in firm 2, then he or she would be recorded as 0.5 employees at the first firm and 0.5 employees at the second firm.
- *** These figures are based on the number of people receiving EI special benefits or EI sickness benefits in 2019.
- Sources: Employment and Social Development Canada, Employment Insurance (EI) administrative data. Data are based on a 100% sample of EI data. Canada Revenue Agency (CRA) administrative data. CRA data are based on a 100% sample.
The distribution of the workforce and of EI special benefit claimants is roughly similar by firm size, which is unlike EI regular benefits in that larger firms are typically under-represented (consult section 2.2). For special benefits, the biggest difference between employee and claimant distributions was observed in small-sized firms, with a difference of 2.9 percentage points. While workforce adjustment issues during a difficult business or economic context may offer some explanation of the higher relative use of EI regular benefits among small firms, the use of EI special benefits is more likely related to the demographic profile of the workforce, individual circumstances, and the nature of the work in the industry.
However, when the distribution of the workforce is compared solely to the one of EI sickness benefit claimants, larger firms are under-represented (-11.0 percentage points). This difference can be explained notably by the fact that large-sized firms are generally more likely to offer short-term disability plans to their employees. As a result, employees who are unable to work because of illness or injury and are covered by their employers’ plans may not have to collect EI benefits, as benefits from the registered plans have to be paid before EI benefits are paid.
2.6.2 Employment Insurance maternity and parental benefits
EI maternity benefits are available to eligible persons who cannot work because they are pregnant or have recently given birth. EI maternity claimants need to provide Service Canada with a signed statement attesting to their pregnancy and their expected or actual date of delivery. Qualified claimants may receive up to 15 weeks of maternity benefits. Benefits can begin to be paid as early as 12 weeks prior to the expected date of birth and can end as late as 17 weeks after the child’s actual birth date.
EI parental benefits are available to eligible parents who take a leave from work to care for a newborn or recently adopted child or children. Claimants must provide a signed certificate certifying the child’s date of birth or the date of the child’s placement in their home for an adoption. Parents must choose between standard parental benefits or extended parental benefits.
- Standard parental benefits provide up to 40 weeks of benefits paid over a maximum of 12 months (this includes the additional 5 weeks of benefits available to parents who share parental benefits).Footnote 102 A parent cannot receive more than 35 weeks of standard benefits. The benefit rate is 55% of weekly insurable earnings up to a maximum of $573 in 2020 and $595 in 2021. However, for claims established during the second half of FY2021, the EI temporary measure relating to the minimum $500 benefit rate was in effect (consult section 2.0)
- Extended parental benefits provide up to 69 weeks of benefits paid over a maximum of 18 months (this includes the additional 8 weeks of benefits available to parents who share parental benefits).Footnote 103 A parent cannot receive more than 61 weeks of extended benefits. The benefit rate is 33% of weekly insurable earnings up to a maximum of $344 in 2020 and $357 in 2021. However, for claims established during the second half of FY2021, the EI temporary measure relating to the minimum $300 benefit rate for extended parental benefits was in effect (consult section 2.0)
Parents can share and use parental benefits at the same time or different times within 12 months (standard parental benefits) or 18 months (extended parental benefits) of birth or adoption. When parental benefits are shared by parents, only 1 parent will need to serve a waiting period. Parents must choose the same parental benefits option (standard or extended) when they apply for benefits. The choice of the first parent who completes the application is binding on other parents. Once parental benefits have been paid out to any eligible parent, they cannot change their duration option but may change how they share the weeks of benefits.
It should be noted that the maternity and parental benefits offered under the EI program are available across Canada with the exception of Quebec. For parents who reside in Quebec, the Quebec Parental Insurance Plan (QPIP) has provided eligible salaried workers and self-employed persons with maternity, paternity, parental, or adoption benefits since January 1, 2006.
Employment Insurance maternity and parental benefits: coverage and accessibility
According to the 2020 Employment Insurance Coverage Survey (EICS),Footnote 104 77.8% of parents with a child aged 18 months or younger living outside Quebec had insurable employment in 2020. Among these new parents with insurable employment, 91.0% reported having received maternity or parental benefits, which is similar to previous years.
According to EICS data, the proportion of spouses living outside Quebec who received or intended to claim EI parental benefits remained relatively stable at 19.5% in 2020. In 2019 and 2020, 2 in 10 spouses claimed or intended to claim parental benefits compared to 1 in 10 spouses in 2017. This increase can be explained by the additional weeks of EI benefits that have been available since March 2019 to new parents sharing parental benefits.
The main reasons spouses did not claim parental benefits, as reported in the 2020 EICS, were that it was the family's preference (25.1%), that the spouse was not eligible for benefits (21.8%), or for financial reasons (17.9%).Footnote 105
As in previous years, 2020 EICS data continue to show that the share of new parents with insurable employment in Quebec who received maternity or parental benefits under QPIP (99.1%) is greater than that of parents having received EI maternity or parental benefits in the rest of Canada (91.0%). This situation can be explained by several factors, most notably the lower eligibility requirement based on earnings under QPIP ($2,000) and the mandatory participation of self-employed persons under QPIP in comparison to the voluntary participation in the EI program. In addition, in Quebec, a larger share of spouses received parental benefits or intended to receive them (78.1%), which may be largely due to the paternity benefits paid specifically to fathers as part of QPIP.
Employers may choose to offer their employees a supplement to EI maternity and parental benefits (consult subsection 2.1.1 for more details). According to the 2020 EICS data, 43.3% of parents with a child aged 18 months or younger living outside Quebec received top-ups to their EI benefits from their employer.
Employment Insurance maternity claims, amount paid and level of benefits
In FY2021, nearly 166,900 new maternity claims were established, which is similar to FY1920 (consult table 40). The breakdown of the number of claims by province and territory remained stable between the first and second half of FY2021. Ontario continued to account for almost half of all maternity claims.
| Category | Number of claims (FY1920) | Number of claims (first half of FY2021) | Number of claims (second half of FY2021) | Number of claims (total FY2021) | Amount paid ($ million) FY1920 | Amount paid ($ million) FY2021 |
|---|---|---|---|---|---|---|
| Newfoundland and Labrador | 2,210 | 1,030 | 1,490 | 2,520 | $16.6 | $17.2 |
| Prince Edward Island | 830 | 460 | 640 | 1,100 | $5.8 | $8.2 |
| Nova Scotia | 4,640 | 2,060 | 2,980 | 5,040 | $34.1 | $36.8 |
| New Brunswick | 3,830 | 1,650 | 2,430 | 4,080 | $26.2 | $30.3 |
| Quebec | n/a | n/a | n/a | n/a | n/a | n/a |
| Ontario | 84,930 | 37,560 | 44,700 | 82,260 | $607.0 | $657.4 |
| Manitoba | 8,280 | 3,930 | 4,670 | 8,600 | $55.5 | $66.6 |
| Saskatchewan | 7,970 | 3,350 | 4,330 | 7,680 | $55.9 | $59.7 |
| Alberta | 29,580 | 12,090 | 16,100 | 28,190 | $218.4 | $227.9 |
| British Columbia | 24,790 | 11,700 | 14,700 | 26,400 | $183.5 | $212.6 |
| Yukon | 210 | 160 | 180 | 340 | $1.7 | $2.9 |
| Northwest Territories | 250 | 200 | 230 | 430 | $2.1 | $3.0 |
| Nunavut | 170 | 140 | 130 | 270 | $1.3 | $2.0 |
| 24 years old and under | 12,370 | 4,410 | 8,320 | 12,730 | $68.5 | $83.3 |
| 25 to 39 years old | 148,280 | 66,650 | 80,550 | 147,200 | $1,088.2 | $1,184.6 |
| 40 years old and over | 7,040 | 3,270 | 3,710 | 6,980 | $51.3 | $56.7 |
| Canada | 167,690 | 74,330 | 92,580 | 166,910 | $1,208.1 | $1,324.7 |
- Note: Data may not add up to the total due to rounding. Includes claims for which at least $1 of EI maternity benefits was paid.
- Source: Employment and Social Development Canada, Employment Insurance (EI) administrative data. Data are based on a 10% sample of EI administrative data.
Women between 25 and 39 years old established 88.2% of new maternity claims during the entire reporting period, while women aged 24 years and under and those aged 40 years and over represented 7.6% and 4.2%, respectively. However, the proportion of claims established by women aged 24 years and under was slightly higher (9.0%) in the second half of FY2021, which may be attributable to the EI temporary measure that allowed to be eligible for benefits with as few as 120 hours of insurable employment during this period (consult section 2.0). Individuals aged 24 years and under are generally less likely to have enough hours of insurable employment to qualify for EI benefits.
The total amount paid in maternity benefits reached $1.3 billion in FY2021, compared to $1.2 billion in the previous fiscal year (consult table 40). The total amount paid increased in each province and territory compared to FY1920. At the same time, mothers aged 25 to 39 years received 89.4% of maternity benefit payments in FY2021, while mothers aged 24 years and under and those aged 40 years and over received 6.3% and 4.3%, respectively.
Maternity benefits are frequently combined in the same claim with other benefit types, particularly parental and sickness benefits; 98.7% of all EI maternity claims completed during FY2021 included another type of EI benefit (consult subsection 2.1.2).
The average weekly maternity benefit rate was $510 for the first half of FY2021 and $551 for the second half of FY2021 when the EI temporary measure relating to the minimum benefit rate was in effect (consult section 2.0). On average, the highest weekly maternity benefit rate was for claims established in the Northwest Territories and by mothers aged 40 years and over (consult annex 2.13.3).
There were 59.8% of claimants who received the maximum weekly maternity benefit rate during the first half of the fiscal year. This proportion was slightly lower (54.1%) during the second half of the fiscal year, due in part to a higher share of claims established by young mothers who generally have lower benefit rates. The share of claimants receiving the minimum weekly benefit rate of $500 in the second half of FY2021 was 36.9%.
Employment Insurance parental claims, amount paid and level of benefits
The total number of new parental claims established was 213,100 in FY2021, almost unchanged from the previous fiscal year (consult table 41). Extended parental benefits accounted for 18.2% of all claims established during the reporting period, similar to the 17.8% observed in FY1920. Claims from adoptive parents continued to account for less than 1.0% (about 1,200) of all parental claims in FY2021.
| Category | Number of claims (FY1920) | Number of claims (first half of FY2021) | Number of claims (second half of FY2021) | Number of claims (total FY2021) | Amount paid ($ million) FY1920 | Amount paid ($ million) FY2021 |
|---|---|---|---|---|---|---|
| Standard | 174,980 | 80,290 | 94,040 | 174,330 | $2,416.0 | $2,612.5 |
| Extended | 37,770 | 17,670 | 21,100 | 38,770 | $505.7 | $565.3 |
| Newfoundland and Labrador | 2,360 | 1,140 | 1,590 | 2,730 | $37.8 | $39.3 |
| Prince Edward Island | 1,000 | 530 | 800 | 1,330 | $13.2 | $16.0 |
| Nova Scotia | 5,990 | 3,060 | 3,670 | 6,730 | $80.5 | $89.0 |
| New Brunswick | 5,010 | 2,110 | 3,100 | 5,210 | $66.1 | $69.2 |
| Quebec | n/a | n/a | n/a | n/a | n/a | n/a |
| Ontario | 109,200 | 50,060 | 56,450 | 106,510 | $1,468.8 | $1,603.6 |
| Manitoba | 10,600 | 5,260 | 5,790 | 11,050 | $139.9 | $150.3 |
| Saskatchewan | 9,720 | 4,230 | 5,220 | 9,450 | $133.7 | $145.2 |
| Alberta | 35,290 | 14,980 | 19,120 | 34,100 | $517.5 | $551.8 |
| British Columbia | 32,710 | 15,910 | 18,710 | 34,620 | $449.5 | $496.2 |
| Yukon | 320 | 220 | 220 | 440 | $4.9 | $5.9 |
| Northwest Territories | 300 | 250 | 250 | 500 | $5.7 | $6.0 |
| Nunavut | 250 | 210 | 220 | 430 | $4.1 | $5.3 |
| Men | 47,390 | 23,370 | 26,730 | 50,100 | $315.5 | $359.2 |
| Women | 165,360 | 74,590 | 88,410 | 163,000 | $2,606.2 | $2,818.6 |
| 24 years old and under | 13,200 | 4,830 | 8,440 | 13,270 | $170.2 | $171.8 |
| 25 to 39 years old | 184,640 | 86,280 | 99,220 | 185,500 | $2,581.0 | $2,816.2 |
| 40 years old and over | 14,910 | 6,850 | 7,480 | 14,330 | $170.4 | $189.8 |
| Canada | 212,750 | 97,960 | 115,140 | 213,100 | $2,921.7 | $3,177.8 |
- Note: Data may not add up to the total due to rounding. Includes claims for which at least $1 of EI parental benefits was paid.
- Source: Employment and Social Development Canada, Employment Insurance (EI) administrative data. Data are based on a 10% sample of EI administrative data.
As with maternity benefits, the breakdown of parental claims by province and territory remained relatively stable in FY2021. The majority of new parental claims in FY2021 were established by women (76.5%). However, the share of claims established by men reached 23.5%, which is relatively unchanged compared to the previous fiscal year, but higher than the share in FY1819 (16.8%). This higher proportion can be attributed to the additional weeks of benefits available to parents of a child born or adopted on or after March 17, 2019, who share parental benefits.
Claims established by claimants aged 24 years and under accounted for 6.2% of new parental claims in FY2021, while those established by claimants aged 25 to 39 years and 40 years and over accounted for 87.0% and 6.7%, respectively. The breakdown of parental claims by age of claimant remained similar to that in FY1920.
The benefits paid in parental benefits totalled $3.2 billion in FY2021, compared to $2.9 billion in the previous fiscal year. Extended parental benefits paid represented 17.8% of total parental benefits paid in FY2021, which was equivalent to the proportion (18.2%) of these claims among all parental claims.
All provinces and territories recorded increases in parental benefits paid compared to FY1920. The amount paid to men accounted for 11.3% of the total amount paid in parental benefits in FY2021, while claims established by men accounted for 23.5% of new parental claims established in the same period. This may be explained, in part, by the smaller number of weeks of parental benefits typically received by men compared to women. The breakdown of the amount paid in parental benefits by age group for FY2021 is roughly the same as for new claims established during the period.
As stated above, the benefit rate (55% or 33% of average weekly earnings) and the maximum weekly benefit are calculated differently depending on whether the claimant is receiving standard or extended benefits.
The average weekly standard parental benefit rate was $521 for the first half of FY2021, and $556 for the second half of FY2021 when the EI temporary measure relating to the minimum benefit rate was in effect (consult section 2.0). On average, the weekly benefit rate was higher for standard parental claims established in the Northwest Territories, by men and by claimants aged 40 years and over (consult table 42 and annex 2.14.5). Almost two-thirds (66.2%) of claimants received the maximum weekly standard parental benefit rate during the first half of the fiscal year, compared to 60.9% during the second half. The share of claimants receiving the minimum weekly benefit rate of $500 in the second half of FY2021 was 30.7%.
| Category | Standard parental benefits First half of FY2021 | Standard parental benefits Second half of FY2021 | Extended parental benefits First half of FY2021 | Extended parental benefits Second half of FY2021 |
|---|---|---|---|---|
| Men | $557 | $570 | $336 | $346 |
| Women | $510 | $552 | $307 | $333 |
| 24 years old and under | $417 | $525 | $247 | $321 |
| 25 to 39 years old | $526 | $558 | $315 | $337 |
| 40 years old and over | $538 | $563 | $332 | $339 |
| Canada | $521 | $556 | $313 | $336 |
- Note: Includes claims for which at least $1 of EI parental benefits was paid.
- Source: Employment and Social Development Canada, Employment Insurance (EI) administrative data. Data are based on a 10% sample of EI administrative data.
The average weekly extended parental benefit rate was $313 for the first half of FY2021, and $336 for the second half of FY2021 when the EI temporary measure relating to the minimum benefit rate was in effect (consult section 2.0). On average, the weekly benefit rate was higher for extended parental claims established in the territories, by men and by claimants aged 40 and over (consult table 42 and annex 2.14.9). In FY2021, 65.2% of claimants received the maximum weekly extended parental benefit rate during the first half of the fiscal year, compared to 60.9% during the second half. The share of claimants receiving the minimum weekly extended parental benefit rate of $300 in the second half of FY2021 was 29.9%.
Duration and sharing of Employment Insurance maternity and parental benefits
As observed during previous fiscal years, mothers typically use almost all of the EI maternity weeks to which they were entitled. In FY2021, 93.4% of mothers received maternity benefits during the 15 weeks available to them. The average duration of completed maternity claims was 14.7 weeks during the reporting period (consult table 43).
| Benefit type | Menp | Womenp | Familyp |
|---|---|---|---|
| Maternity | n/a | 14.7 | n/a |
| Not shared - standard parental | 17.3 | 33.3 | n/a |
| Not shared - extended parental | 26.4 | 57.1 | n/a |
| Shared** - standard parental | 8.8 | 30.4 | 37.8 |
| Shared** - extended parental | 16.7 | 47.0 | 62.9 |
- Note: Includes completed claims for which at least $1 of EI maternity benefits or parental benefits was paid.
- P Preliminary estimates.
- * Information on the actual sharing and duration of parental benefits is only available for a small number of claims established before September 2019. As a result, figures in this table may not include some claims established before September 2019.
- ** Includes only claims established on or after March 17, 2019. Starting on that date, parents who shared parental benefits were entitled to additional weeks of benefits.
- Source: Employment and Social Development Canada, Employment Insurance (EI) administrative data. Data on duration of maternity and parental benefits are based on a 100% sample of EI administrative data.
Effective March 17, 2019, parents who establish new claims for parental benefits and share those benefits are eligible for additional weeks of benefits. Among claims established after that date and completed in FY2021, 21.2% of those receiving standard parental benefits had shared weeks of benefits, compared with 25.4% of those receiving extended parental benefits.Footnote 106
When weeks of benefits were shared, women and men received, on average, 30.4 and 8.8 weeks of benefits, respectively, in the case of standard parental benefits; and 47.0 and 16.7 weeks of benefits, respectively, in the case of extended parental benefits (consult table 43). The combined number of weeks of parental benefits used by families was, on average, 37.8 weeks for standard parental claims, and 62.9 weeks for extended parental claims.
Of all families sharing standard parental benefits, 86.9% used at least 1 of the extra weeks available to them, and just over half (54.5%) used all 40 weeks of parental benefits they were entitled to. On the shared extended parental benefits side, 74.1% of families used at least 1 of the additional weeks available, while 39.4% used all 69 weeks of available parental benefits.
In nearly 9 out of 10 families, parents used weeks of maternity or parental benefits at the same time. There was, on average, 5.6 weeks of overlap for families receiving standard parental benefits, and 12.0 weeks for those receiving extended parental benefits.
For parental claims completed in FY2021 for which benefit weeks were not shared, the average duration of standard parental benefits was 33.3 weeks for women and 17.3 weeks for men. For extended parental claims, the average duration was 57.1 weeks for women and 26.4 weeks for men. Three-quarters (74.4%) of non-shared standard parental claims used the 35 weeks of benefits available to them. Two-thirds (66.4%) of non-shared extended parental claims received all 61 weeks of benefits to which they were entitled.
Methodological note: New methodology related to the sharing and duration of parental claims
In previous Monitoring and Assessment Reports, statistics were presented on the average number of weeks of parental benefits used by claimants who shared or did not share these benefits. Information on sharing parental benefits was based on the EI application form completed by the claimants and reflected the intention to share benefits at the time of the application, rather than how benefits are actually shared when they are received.
In this report, information on sharing of parental benefits is based on new data that makes it possible to match parental claims of the parents of the same child, and therefore know the total number of weeks received by families. This new data is available since September 2019*. Therefore, the statistics on the duration of shared and non-shared parental claims in previous Monitoring and Assessment Reports are not comparable with those in FY2021.
- * New data on sharing of parental benefits are only available for a small number of claims established before September 2019. As a result, some claims established before September 2019 and completed in FY2021 may not be included in the calculation of the sharing rate.
2.6.3 Employment Insurance sickness benefits
EI sickness benefits are paid for up to 15 weeks to eligible people who are unable to work because of illness, injury or quarantine, but would otherwise be available to work. The maximum duration of benefits to which a sickness claimant is entitled depends on the recommendations from their physician or an approved medical practitioner. With job protection through the Canada Labour Code and the provincial and territorial statutes under labour law, EI sickness benefits allow claimants to recover while maintaining their attachment to the labour market. Claimants must usually provide Service Canada with a medical certificate signed by a doctor or approved medical practitioner. However, this requirement was waived for claims established between September 27, 2020 and September 25, 2021.
As explained in section 2.0, no new claims for sickness benefits were established during the first half of FY2021. Therefore, the results on new claims established in this subsection only cover the second half of FY2021. Furthermore, the results on amount of benefits paid out cover the full period of FY2021.
Premium Reduction Program
Employers who offer short-term disability plans to their employees that meet requirements stipulated in the Employment Insurance Act and Employment Insurance Regulations can register their plans with the Employment Insurance Commission to obtain a lower EI premium rate than the regular employer rate through the Premium Reduction Program (PRP).
More information on the effect on premiums and the number of firms affected can be found in section 2.7.
Employment Insurance sickness claims, amount paid and level of benefits
During the second half of FY2021, almost 450,400 new sickness claims were established. This number is higher than that recorded for the entire FY1920 period (consult table 44). The high number of claims established during the reporting period may be, in part, due to the epidemiological situation associated with the second wave of COVID-19 in the second half of FY2021, and to the EI temporary measure that allowed to be eligible for benefits with only 120 hours of insurable employment (consult section 2.0).
| Category | Number of claims FY1920 | Number of claims Second half of FY2021 | Amount paid ($ millions) FY1920 | Amount paid ($ millions) FY2021 |
|---|---|---|---|---|
| Newfoundland and Labrador | 11,340 | 10,880 | $50.9 | $52.8 |
| Prince Edward Island | 6,120 | 4,770 | $21.1 | $20.8 |
| Nova Scotia | 21,910 | 18,300 | $85.7 | $85.9 |
| New Brunswick | 30,080 | 25,230 | $114.0 | $115.0 |
| Quebec | 134,070 | 135,660 | $553.4 | $567.6 |
| Ontario | 111,200 | 132,800 | $545.8 | $603.6 |
| Manitoba | 11,380 | 12,990 | $49.3 | $56.5 |
| Saskatchewan | 7,890 | 8,750 | $39.3 | $36.4 |
| Alberta | 32,930 | 42,370 | $162.9 | $173.8 |
| British Columbia | 53,390 | 57,700 | $261.4 | $281.8 |
| Yukon | 440 | 460 | $2.1 | $2.6 |
| Northwest Territories | 250 | 220 | $1.8 | $1.4 |
| Nunavut | 140 | 220 | $1.2 | $0.9 |
| Male | 189,250 | 199,620 | $880.6 | $890.4 |
| Female | 231,890 | 250,730 | $1,008.2 | $1,109.0 |
| 24 years old and under | 30,010 | 47,750 | $104.8 | $163.2 |
| 25 to 34 years old | 91,570 | 98,030 | $379.2 | $409.9 |
| 35 to 44 years old | 86,210 | 87,500 | $396.3 | $390.6 |
| 45 to 54 years old | 90,670 | 90,810 | $436.2 | $418.2 |
| 55 to 64 years old | 99,220 | 98,840 | $463.1 | $476.6 |
| 65 years old and over | 23,460 | 27,420 | $109.2 | $140.8 |
| Canada | 421,140 | 450,350 | $1,888.8 | $1,999.3 |
- Note: Data may not add up to the total due to rounding. Includes claims for which at least $1 of EI sickness benefits was paid.
- Source: Employment and Social Development Canada, Employment Insurance (EI) administrative data. Data are based on a 10% sample of EI administrative data.
Except for the Atlantic provinces and the Northwest Territories, all regions had more sickness claims established during the second half of FY2021 than during the entire previous fiscal year. There was also a greater share of sickness claims established by claimants living in Ontario and Alberta (+3.1 and +1.6 percentage points, respectively) in the reporting period compared to FY1920. Conversely, the proportion of claimants from the Atlantic provinces and Quebec decreased.
As in the past, a larger share of new EI sickness claims were established by women (55.7%) than men (44.3%). Claimants aged 55 to 64 years and those aged 25 to 34 years established the largest shares of new sickness claims during the second half of FY2021 (21.9% and 21.8%, respectively). However, compared to the previous fiscal year, the share of claims established by claimants aged 24 years and under increased by 3.5 percentage points, from 7.1% in FY1920 to 10.6% during the second half of FY2021.
Relative to their representation in the labour force, claimants aged 24 years and under and those aged 35 to 44 years were the most underrepresented in terms of sickness claims and amount paid, while those aged 55 to 64 years were the most overrepresented during the reporting period (consult chart 21).Footnote 107

Text description of Chart 21
| Age category | Share of sickness claims established (second half of FY2021 only) | Share of amount paid in sickness benefits | Share in the labour force (second half of FY2021 only) |
|---|---|---|---|
| 24 years old and under | 10.6% | 8.2% | 13.3% |
| 25 to 34 years old | 21.8% | 20.5% | 22.2% |
| 35 to 44 years old | 19.4% | 19.5% | 22.0% |
| 45 to 54 years old | 20.2% | 20.9% | 20.5% |
| 55 to 64 years old | 22.0% | 23.8% | 17.4% |
| 65 years old and over | 6.1% | 7.0% | 4.6% |
- Note: Includes claims for which at least $1 of EI sickness benefits was paid.
- * Second half of FY2021 only.
- Sources: Employment and Social Development Canada, Employment Insurance (EI) administrative data. Data are based on a 10% sample of EI administrative data. Statistics Canada, Labour Force Survey, Table 14-10-0017-01.
The total amount paid in sickness benefits was close to $2.0 billion in FY2021, compared to $1.9 billion in FY1920 (consult table 44). The breakdown of total sickness benefits by province and territory remained fairly similar to FY1920, except for Ontario which experienced a 1.3 percentage points increase in its relative share.
As with new claims, women received a slightly larger share of the amount paid in sickness benefits than men, with 55.5% and 44.5%, respectively. Compared to FY1920, women experienced a 2.1 percentage points increase in their share of payments in FY2021.
Claimants over the age of 55 received a larger share of the total amount of payments for sickness benefits than their share in the labour force, while claimants under the age of 44 received a smaller share (consult chart 21).
By industry, the goods-producing industries continued to be overrepresented, in general, among EI sickness claims and total benefits paid. They accounted for 25.7% of new EI sickness claims during the second half of FY2021, while they represented only 20.8% of workers during the same period (consult table 45).
| Industry | Number of claims (thousands) (% share) Second half of FY2021 | Amount paid ($ millions) (% share) FY2021 | Employment (thousands) (% share) Second half of FY2021 |
|---|---|---|---|
| Goods-producing industries | 115.7 (25.7%) |
$504.4 (25.2%) |
3,814.1 (20.8%) |
| Agriculture, forestry, fishing, hunting, mining and oil and gas extraction | 13.4 (3.0%) |
$70.9 (3.5%) |
573.7 (3.1%) |
| Utilities | 0.4 (0.1%) |
$2.7 (0.1%) |
139.8 (0.8%) |
| Construction | 41.3 (9.2%) |
$188.6 (9.4%) |
1,378.1 (7.5%) |
| Manufacturing | 60.6 (13.5%) |
$242.3 (12.1%) |
1,722.5 (9.4%) |
| Service-producing industries | 314.9 (69.9%) |
$1,416.7 (70.9%) |
14,556.5 (79.2%) |
| Wholesale and retail trade | 80.8 (17.9%) |
$362.3 (18.1%) |
2,754.6 (15.0%) |
| Transportation and warehousing | 23.4 (5.2%) |
$113.0 (5.7%) |
963.0 (5.2%) |
| Finance, insurance, real estate, rental and leasing | 12.4 (2.8%) |
$60.9 (3.0%) |
1,267.0 (6.9%) |
| Professional, scientific, and technical services | 11.5 (2.6%) |
$50.8 (2.5%) |
1,594.1 (8.7%) |
| Business, building, and other support services* | 30.2 (6.7%) |
$139.3 (7.0%) |
682.0 (3.7%) |
| Educational services | 12.9 (2.9%) |
$51.7 (2.6%) |
1,487.7 (8.1%) |
| Healthcare and social assistance | 60.4 (13.4%) |
$290.5 (14.5%) |
2,490.9 (13.6%) |
| Information, culture, and recreation** | 7.7 (1.7%) |
$30.1 (1.5%) |
656.9 (3.6%) |
| Accommodation and food services | 32.5 (7.2%) |
$122.1 (6.1%) |
907.3 (4.9%) |
| Other services (excluding public administration) | 18.7 (4.2%) |
$77.2 (3.9%) |
747.1 (4.1%) |
| Public administration | 24.4 (5.4%) |
$118.7 (5.9%) |
1,006.0 (5.5%) |
| Unclassified*** | 19.7 (4.4%) |
$78.1 (3.9%) |
n/a |
| Canada | 450.4 (100.0%) |
$1,999.3 (100.0%) |
18,370.6 (100.0%) |
- Note: Data may not add up to the total due to rounding. Percentage shares are based on unrounded numbers. Includes claims for which at least $1 of EI sickness benefits was paid.
- * Includes management of companies and enterprises and administrative support, waste management and remediation services.
- ** Includes information and cultural industries and arts, entertainment and recreation services.
- *** For some claims, this information was not available in the data
- Sources: Employment and Social Development Canada, Employment Insurance (EI) administrative data. Data are based on a 10% sample of EI administrative data. Statistics Canada, Labour Force Survey, Table 14-10-0022-01 (for employment data).
However, the proportion of sickness claims established by the goods-producing industries fell by 2.2 percentage points from FY1920. In contrast, the proportion of claims from the Wholesale and retail trade and Healthcare and social assistance industries increased by 2.0 and 0.9 percentage points, respectively. The relative increase in sickness claims in these 2 industries during the reporting period may be due, in part, to the second wave of COVID-19 infections given that some activities in these industries require contact with the public and they have a lower capacity for teleworking. Footnote 108
The average weekly sickness benefit rate was $535 for the second half of FY2021 when the EI temporary measure relating to the minimum benefit rate was in effect (consult section 2.0). On average, the highest weekly sickness benefit rate was paid for claims established in Nunavut, by men, and by claimants aged 35 to 44 years (consult annex 2.15.3). As in FY1920, a little more than a third (37.3%) of all sickness claimants received the maximum weekly benefit rate during the second half of FY2021. The share of claimants receiving the minimum weekly benefit rate of $500 was 51.6% during the same period.
Duration of Employment Insurance sickness benefits
A maximum of 15 weeks of EI sickness benefits may be paid, though the number of weeks could be less depending on the claimant’s physician’s assessment.
The average duration of sickness benefits completed during FY2021 was 9.1 weeks, compared to 10.0 weeks in FY1920. On average, men and women received 8.5 and 9.5 weeks of sickness benefits, respectively.
As in the past, the average number of weeks of sickness benefits paid increased with the age of claimants. Claimants aged 24 years and under experienced, on average, the shortest duration (7.9 weeks), while those aged 55 years and over registered the longest duration (10.0 weeks).
One-third (33.3%) of all completed sickness claims in FY2021 used the maximum number of 15 weeks of sickness benefits, which is slightly lower compared to the previous fiscal year (37.0%) (consult table 46). This decrease is due to claims completed in FY2021 that were established before the second half of the fiscal year. Only 30.4% of these claims had used the 15 weeks of sickness benefits, compared to 38.1% of claims established and completed in the second half of FY2021.
Women (36.2%) were generally more likely than men (30.0%) to use the maximum number of sickness weeks for claims completed in FY2021. The use of all 15 weeks of benefits appears to be correlated with the age of claimants. There were 24.9% of claimants 24 years old and under using the maximum number of sickness weeks, compared to 40.9% of claimants 55 years old and over (consult table 46).
The Evaluation of Employment Insurance Sickness Benefits concluded that “the duration of the benefits is adequate for most claimants, but those with severe and/or long-term illnesses are more likely to use the full 15 weeks of sickness benefits and remain sick thereafter”.Footnote 109
| Age category | FY1617 | FY1718 | FY1819 | FY1920r | FY2021p |
|---|---|---|---|---|---|
| 24 years old and under | 28.2% | 26.6% | 25.8% | 29.6% | 24.9% |
| 25 to 44 years old | 32.2% | 31.7% | 31.6% | 33.0% | 28.9% |
| 45 to 54 years old | 38.9% | 38.2% | 37.0% | 39.9% | 35.2% |
| 55 years old and over | 42.7% | 40.5% | 39.7% | 42.5% | 40.9% |
| Canada | 36.3% | 35.3% | 34.7% | 37.0% | 33.3% |
- Note: Includes all completed claims for which at least $1 in EI sickness benefits was paid.
- p Preliminary data
- r Revised data
- Source: Employment and Social Development Canada, Employment Insurance (EI) administrative data. Data are based on a 10% sample of EI administrative data.
Employment Insurance sickness benefits and short-term disability plans (STDP) offered by employers
A departmental study* showed that the number of employers who offered qualifying STDPs (recognized by the Premium Reduction Program) decreased between 2000 and 2015, but this was offset by an increase in large employers (500 or more employees) offering STDPs. Despite the overall decrease in number of employers offering STDPs, the number of employees covered by those plans increased over the same period.
The study also compared the characteristics of EI sickness claims established by claimants who benefitted from a STDP offered by their employer before turning to EI sickness benefits with people who turned directly to EI sickness benefits. Claimants for whom the EI program was the second payer were proportionally more likely to use the maximum 15-week period provided for EI sickness benefits than those who received only EI sickness benefits (an average of 39.7% compared to 32.0%, respectively, for the period between 2000 and 2015). In 2015, 21.9% of all EI sickness claimants used EI as a second payer, while the remaining 78.1% of EI sickness claimants used EI as a first payer.
The majority of employers offered weekly indemnity plans, which provide benefits for a minimum of 15 weeks. Given that claimants who were covered by a plan offered by their employer had to use all of their short-term disability insurance benefits before establishing an EI sickness claim, it appears that those who used all 15 weeks of EI sickness benefits were more likely to have severe medical issues that require longer recovery time.
- * ESDC, Enhance Understanding of the Use of the Premium Reduction Program. (Ottawa: ESDC, Evaluation Directorate, 2019).
2.6.4 Employment Insurance compassionate care benefits
EI compassionate care benefits offer temporary income support for up to 26 weeks to eligible claimants who need to take time away from work to provide end-of-life care to family members who have a serious medical condition with a significant risk of death within 26 weeks.Footnote 110 The benefits may be paid to 1 caregiver or shared among caregivers, and only 1 of them needs to serve the waiting period. Claimants must submit a medical certificate issued by the family member’s medical doctor or nurse practitioner to Service Canada.
Employment Insurance compassionate care claims, amount paid and level of benefits
Over FY2021, there were almost 6,800 new claims established for compassionate care benefits, which is lower than the number of claims recorded in the previous fiscal year (consult table 47). It is the third consecutive year that compassionate care benefit claims decrease. Less than 1 in 10 claims completed in FY2021 had weeks of benefits that were shared among 2 or more caregivers (5.9%).Footnote 111 This proportion was slightly lower than the one observed in FY1920 (7.0%).
All regions, except Prince Edward Island and New Brunswick, experienced a decrease in the number of claims for compassionate care benefits over the reporting period (consult table 47). However, the breakdown of the number of claims by region remained fairly stable in FY2021. Women continued to establish the largest share of compassionate care benefit claims compared to men. Claims established by women accounted for 72.5% of new claims in FY2021, an increase of 2.0 percentage points from FY1920.
| Category | Number of claims (FY1920) | Number of claims (first half of FY2021) | Number of claims (second half of FY2021) | Number of claims (total FY2021) | Amount paid ($ million) FY1920 | Amount paid ($ million) FY2021 |
|---|---|---|---|---|---|---|
| Newfoundland and Labrador | 95 | 45c | 73c | 87 | $472.6 | $620.4 |
| Prince Edward Island | 29 | 45c | 73c | 31 | $163.3 | $247.2 |
| Nova Scotia | 273 | 85 | 128 | 213 | $1,302.2 | $1,572.8 |
| New Brunswick | 173 | 73 | 121 | 194 | $959.4 | $1,173.2 |
| Quebec | 1,305 | 402 | 765 | 1,167 | $5,547.0 | $5,905.6 |
| Ontario | 3,223 | 1,018 | 1,808 | 2,826 | $17,170.7 | $18,496.2 |
| Manitoba | 301 | 100 | 164 | 264 | $1,494.5 | $1,689.4 |
| Saskatchewan | 175 | 65 | 107 | 172 | $1,024.6 | $1,161.2 |
| Alberta | 776 | 298 | 435 | 733 | $4,806.3 | $5,038.9 |
| British Columbia | 1,205 | 418 | 672 | 1,090 | $6,486.3 | $7,300.9 |
| Territories | 26 | 14 | 11 | 25 | $128.4 | $182.0 |
| Men | 2,239 | 660 | 1,211 | 1,871 | $13,009.4 | $13,620.4 |
| Women | 5,342 | 1,858 | 3,073 | 4,931 | $26,563.8 | $29,767.5 |
| 24 years old and under | 136 | 52 | 93 | 145 | $578.9 | $848.7 |
| 25 to 44 years old | 2,446 | 832 | 1,365 | 2,197 | $12,339.1 | $13,757 |
| 45 to 54 years old | 2,409 | 746 | 1,311 | 2,057 | $12,560.7 | $12,796.9 |
| 55 years old and over | 2,590 | 888 | 1,515 | 2,403 | $14,094.5 | $15,984.8 |
| Canada | 7,581 | 2,518 | 4,284 | 6,802 | $39,573.2 | $43,387.9 |
- Note: Data may not add up to the total due to rounding. Includes claims for which at least $1 of EI compassionate care benefits was paid.
- C For confidentiality purposes, data for Newfoundland and Labrador and Prince Edward Island have been combined.
- Source: Employment and Social Development Canada, Employment Insurance (EI) administrative data. Data are based on a 100% sample of EI administrative.
As in the past, people aged 44 years and under established a significantly smaller share of claims for compassionate care benefits (34.4%) compared to their relative representation in the Canadian labour force (57.8%) in FY2021.Footnote 112 Conversely, people aged 45 years and over established a larger share of claims (65.6%) than their presence in the Canadian labour force (42.2%). The breakdown of compassionate care claims by age group remained essentially the same as that observed in FY1920.
The total amount paid in compassionate care benefits was $43.4 million in FY2021, compared to $39.6 million in FY1920. The amount paid in compassionate care benefits increased in all regions, age groups and for men and women over the reporting period (consult table 47).
As for claims, the share of compassionate care benefits received by women increased by 1.5 percentage points compared to the previous fiscal year. Women received 68.6% of the total amount of compassionate care benefits paid in FY2021, compared to 31.4% for men.
Claimants aged 44 years and under continued to receive a smaller share of the amount paid in compassionate care benefits (33.7%) than their demographic weight in the Canadian labour force (57.8%). Conversely, claimants aged 45 years and over received a higher share of the total amount of compassionate care benefits paid (66.3%) than their relative representation in the labour force (42.2%).
The average weekly benefit rate for compassionate care benefits was $509 for the first half of FY2021, and $549 for the second half of FY2021 when the EI temporary measure relating to the minimum benefit rate was in effect (consult section 2.0). On average, the highest weekly benefit rate for compassionate care benefits was paid for claims established in the Territories, by men, and by claimants aged between 25 and 44 years (consult annex 2.17.3).
A little more than half (55.5%) of claimants received the maximum weekly benefit rate for compassionate care benefits during the first half of FY2021. This proportion was slightly lower during the second half on FY2021 (52.4%). The share of claimants receiving the minimum weekly benefit rate of $500 in the second half of FY2021 was 35.4%.
Duration of Employment Insurance compassionate care benefits
The average duration of EI compassionate care claims completed in FY2021 was 11.8 weeks, a small increase compared to FY1920 (11.1 weeks) (consult table 48).
| FY1617 | FY1718 | FY1819 | FY1920r | FY2021P | |
|---|---|---|---|---|---|
| Average duration (weeks) | 9.8 | 12.0 | 11.4 | 11.1 | 11.8 |
| Share (%) of compassionate care claims using: 6 weeks of benefits or more* | 64.5% | 64.9% | 62.0% | 61.3% | 62.3% |
| Share (%) of compassionate care claims using: 26 weeks of benefits | 13.8% | 20.3% | 17.2% | 16.7% | 21.5% |
- Note: Includes completed claims for which at least $1 of EI compassionate care benefits was paid.
- P Preliminary data.
- r Revised data.
- * Statistics on the share of claims that received 6 weeks of benefits or more are presented because prior to January 3, 2016 a maximum of 6 weeks of benefits were available.
- Source: Employment and Social Development Canada, Employment Insurance (EI) administrative data. Data are based on a 100% sample of EI administrative data.
Men and women received, on average, 12.3 and 11.6 weeks of compassionate care benefits, respectively, for claims completed during FY2021. Over the same period, claimants aged 25 years and under received, on average, 10.1 weeks of compassionate care benefits, while claimants aged 55 years and over received an average of 12.5 weeks (consult annex 2.17.2).
Among compassionate care claims completed in FY2021, 62.3% used 6 weeks of benefits or more. This proportion is similar to those recorded over the previous fiscal years (consult table 48). This appears to show that despite an increase in the maximum number of weeks of compassionate care benefits available, that increased from 6 to 26 weeks on January 3, 2016, a large share of claims did not receive any extra available weeks. This may be due, in part, to the death of a care recipient. In total, 21.5% of completed compassionate care claims received the maximum number of 26 weeks of benefits during FY2021. This is the highest proportion recorded since the available number of weeks increased to 26.
A departmental studyFootnote 113 on the use and duration of compassionate care benefits confirmed that claimants who took care of their spouse or lived with the care recipient are most likely to use the entire benefit entitlement. However, 1 of the main reasons for not receiving or claiming the maximum number of weeks of benefits is related to the death of a care recipient, which would cause benefits to end in the week of the death.
Among the completed claims in FY2021, a higher proportion of men than women used 6 weeks or more of compassionate care benefits (64.1% and 61.5%, respectively), as well as all 26 weeks of benefits (24.0% and 20.4%, respectively).
In addition, the use of weeks of compassionate care benefits tends to increase with the age of the claimant. Claimants aged 24 years and under (54.4%) were less likely to receive 6 weeks or more of compassionate care benefits in FY2021, than claimants aged 55 years and over (65.1%). Similarly, claimants aged 24 years and under were less likely to use the total 26 weeks of compassionate care benefits than claimants aged 55 years and over (13.9% compared to 24.5%).
2.6.5 Employment Insurance family caregiver benefits for adults
The EI family caregiver benefits for adults came into effect on December 3, 2017. They are offered to any EI eligible person who need to take temporary leave from work to provide care or support to a person aged 18 or older who is critically ill or injured. Family caregivers can obtain up to 15 weeks of benefits, which may be shared among eligible family members or other eligible people who are considered members of the family. Claimants must provide Service Canada with a medical certificate issued by the medical doctor or nurse practitioner of the family member who is critically ill or injured.
Employment Insurance claims for family caregiver benefits for adults, amount paid and level of benefits
In FY2021, about 12,200 claims were established for family caregiver benefits for adults, a slight increase compared to the previous fiscal year (consult table 49). Compared to FY1920, the breakdown of claims by region remained relatively stable, and women continued to establish over two-thirds of claims (68.1%).
| Category | Number of claims (FY1920) | Number of claims (first half of FY2021) | Number of claims (second half of FY2021) | Number of claims (total FY2021) | Amount paid ($ thousand) FY1920 | Amount paid ($ thousand) FY2021 |
|---|---|---|---|---|---|---|
| Newfoundland and Labrador | 184 | 54 | 112 | 166 | $783.7 | $1,088.0 |
| Prince Edward Island | 87 | 24 | 62 | 86 | $421.7 | $446.2 |
| Nova Scotia | 322 | 125 | 257 | 382 | $1,588.1 | $2,058.9 |
| New Brunswick | 282 | 80 | 147 | 227 | $1,310.7 | $1,295.4 |
| Quebec | 1,934 | 699 | 1,532 | 2,231 | $8,801.9 | $12,096.3 |
| Ontario* | 5,419 | 1,979 | 3,700 | 5,679 | $25,654.8 | $31,877.4 |
| Manitoba | 407 | 132 | 256 | 388 | $1,979.0 | $2,251.0 |
| Saskatchewan | 304 | 119 | 181 | 300 | $1,586.7 | $1,788.6 |
| Alberta | 1,031 | 378 | 668 | 1,046 | $5,599.0 | $6,330.8 |
| British Columbia | 1,575 | 588 | 1,080 | 1,668 | $7,647.9 | $9,832.6 |
| Territories | 47 | 12 | 23 | 35 | $295.8 | $224.3 |
| Men | 3,725 | 1,405 | 2,485 | 3,890 | $19,098.4 | $23,445.0 |
| Women | 7,867 | 2,785 | 5,533 | 8,318 | $36,570.9 | $45,844.5 |
| 24 years old and under | 229 | 122 | 245 | 367 | $740.2 | $1,724.4 |
| 25 to 34 years old | 1,292 | 536 | 973 | 1,509 | $5,831.3 | $8,196.6 |
| 35 to 44 years old | 2,128 | 794 | 1,444 | 2,238 | $10,236.5 | $12,218.4 |
| 45 to 54 years old | 3,521 | 1,172 | 2,168 | 3,340 | $17,264.8 | $19,364.6 |
| 55 to 64 years old | 3,682 | 1,317 | 2,599 | 3,916 | $18,022.9 | $22,901.0 |
| 65 years old and over | 740 | 249 | 589 | 838 | $3,573.7 | $4,884.4 |
| Canada | 11,592 | 4,190 | 8,018 | 12,208 | $55,669.3 | $69,289.4 |
- Note: Data may not add up to total due to rounding. Includes claims for which at least $1 of EI family caregiver benefit for adults was paid.
- * Claims for which the region was unknown have been combined with Ontario for confidentiality purposes.
- Source: Employment and Social Development Canada, Employment Insurance (EI) administrative data. Data are based on a 100% sample of EI administrative data.
By age, the proportion of claims established by individuals aged 34 years and under increased by 2.2 percentage points (from 13.1% in FY1920 to 15.4% in FY2021), while the proportion of claims established by individuals aged 45 to 54 years decreased by 3.0 percentage points (from 30.4% in FY1920 to 27.4% in FY2021). The larger share of claims established by individuals aged 34 years and under may be due to the EI temporary measure that allowed to be eligible for benefits with only 120 hours of insurable employment (consult section 2.0).
During FY2021, the amount paid out in family caregiver benefits for adults reached $69.3 million compared to $55.7 million in FY1920 (consult table 49). Similar to the number of claims established, the proportion of benefit payments by region remained virtually unchanged from the previous year, as did the proportion of payments to women. Claimants aged 34 years and under received a larger share of benefits paid out compared to FY1920, whereas claimants aged 45 to 54 years received a smaller share of benefits paid out during the same period.
The average weekly benefit rate for family caregiver benefits for adults was $488 for the first half of FY2021, and $539 for the second half of FY2021 when the EI temporary measure relating to the minimum benefit rate was in effect (consult section 2.0). On average, the highest weekly benefit rate was paid for claims established in the Territories, by men and by claimants aged 35 to 44 years (consult annex 2.18.3).
Duration of Employment Insurance family caregiver benefits for adults
Under the family caregiver benefits for adults, claimants are provided with up to 15 weeks of benefits that can be shared among eligible caregivers and split into segments over the 52-week benefit period.
The average duration of completed claims for EI family caregiver benefits for adults in FY2021 was 11.1 weeks. This was slightly higher compared to FY1920 (10.6 weeks). Men and women received 10.9 and 11.2 weeks of family caregiver benefits for adults on average in FY2021, respectively. The average number of weeks was higher for claimants 65 years old and over (12.3 weeks) than for other age groups (ranging from 10.3 to 11.5 weeks).
2.6.6 Employment Insurance family caregiver benefits for children
The EI family caregiver benefits for childrenFootnote 114 offers temporary income support for a maximum period of 35 weeks to eligible persons who take leave from work to provide care for or support to a critically ill or injured child under 18. Caregivers can include, in addition to the child’s parents, any qualifying members of the immediate and extended family. Benefits can be shared among caregivers, who may receive them simultaneously or separately, up to the maximum number of weeks of eligibility.
Claimants need to provide Service Canada with a medical certificate signed by the medical doctor or nurse practitioner of the critically ill or injured child. To be considered critically ill, a child’s life must be at risk as a result of illness or injury, there must have been a significant change in the child’s baseline state of health and the child must require the care or support of his/her parent(s) or other qualifying family members.
Employment Insurance claims for family caregiver benefits for children, amount paid and level of benefits
The number of claims established for family caregiver benefits for children was 5,500 in FY2021, which is similar to the 5,400 claims recorded in FY1920 (consult table 50). In general, the breakdown of claims by region, gender, and age group remained similar to that observed in the previous year. Therefore, in FY2021, more claims for family caregiver benefits for children were established by women (76.8%) rather than men (23.2%). In addition, claimants aged 25 to 44 years established the largest share of claims (84.0%) during the entire reporting period.
| Category | Number of claims (FY1920) | Number of claims (first half of FY2021) | Number of claims (second half of FY2021) | Number of claims (total FY2021) | Amount paid ($ thousand) FY1920 | Amount paid ($ thousand) FY2021 |
|---|---|---|---|---|---|---|
| Newfoundland and Labrador | 72 | 22 | 49 | 71 | $554.1 | $515.9 |
| Prince Edward Island | 25 | 11 | 33 | 44 | $115.0 | $192.2 |
| Nova Scotia | 140 | 40 | 83 | 123 | $990.4 | $980.7 |
| New Brunswick | 104 | 47 | 54 | 101 | $708.3 | $751.2 |
| Quebec | 1,054 | 467 | 688 | 1,155 | $6,724.9 | $7,161.2 |
| Ontario* | 2,056 | 830 | 1,198 | 2,028 | $14,104.3 | $16,636.2 |
| Manitoba | 195 | 101 | 108 | 209 | $1,393.5 | $1,802.8 |
| Saskatchewan | 180 | 88 | 121 | 209 | $1,031.4 | $1,504.9 |
| Alberta | 798 | 347 | 444 | 791 | $5,715.7 | $6,153.3 |
| British Columbia | 759 | 319c | 472c | 791c | $4,820.7 | $5,341.2 |
| Territories | 20 | 319c | 472c | 791c | $120.8 | $180.4 |
| Men | 1,201 | 476 | 805 | 1,281 | $8,036.3 | $9,302.0 |
| Women | 4,202 | 1,796 | 2,445 | 4,241 | $28,242.7 | $31,918.0 |
| 24 years old and under | 226 | 95 | 147 | 242 | $1,168.8 | $1,426.1 |
| 25 to 44 years old | 4,546 | 1,960 | 2,679 | 4,639 | $30,061.8 | $33,250.0 |
| 45 to 54 years old | 551 | 188 | 358 | 546 | $4,395.3 | $5,644.8 |
| 55 years old and over | 80 | 29 | 66 | 95 | $653.2 | $899.2 |
| Canada | 5,403 | 2,272 | 3,250 | 5,522 | $36,279.1 | $41,220.0 |
- Note: Data may not add up to the total due to rounding. Includes claims for which at least $1 of EI family caregiver benefit for children was paid.
- * Claims for which the region was unknown have been combined with Ontario for confidentiality purposes.
- C For confidentiality purposes, data for British Columbia and the territories have been combined.
- Source: Employment and Social Development Canada, Employment Insurance (EI) administrative data. Data are based on a 100% sample of EI administrative data.
The amount paid in family caregiver benefits for children reached $41.2 million during FY2021, compared to $36.3 million in the previous fiscal year. As with claims established, the proportion of benefits paid by region and gender remained relatively stable compared to FY1920. Conversely, the proportion of benefits paid decreased by 2.2 percentage points for claimants aged 25 to 44 years, while it increased by 1.6 percentage points for claimants aged 45 to 54 years. However, claimants aged 25 to 44 years continued to receive the majority of benefits paid for this benefit type (80.7%) in FY2021.
The average weekly benefit rate for family caregivers for children was $506 for the first half of FY2021, and $551 for the second half of FY2021 when the EI temporary measure relating to the minimum benefit rate was in effect (consult section 2.0). On average, the highest weekly benefit rate was paid for claims established by men and by claimants aged 45 to 54 years (consult annex 2.19.3).
Duration of Employment Insurance family caregiver benefits for children
Under the family caregiver benefits for children, claimants are provided with up to 35 weeks of benefits that can be shared among eligible caregivers and can be taken in separate periods over the 52-week benefit period.
Individuals receiving family caregiver benefits for children used, on average, 14.8 weeks of benefits in FY2021, compared to 15.4 weeks in FY1920. On average, women received more weeks of benefits than men, with 15.4 weeks and 13.1 weeks respectively. The average number of weeks used was higher for claimants aged 45 to 54 years (19.3 weeks) and for those aged 55 years and over (19.1 weeks).
2.6.7 Employment Insurance special benefits for self-employed persons
Self-employed persons may make a claim for EI special benefits after signing up for the EI program. The special benefits available to self-employed persons are the same as those offered to salaried employees.
To be eligible for EI special benefits for self-employed persons, an individual must:
- register with Service Canada
- pay EI premiums at the same rate as salaried employees for at least 1 year before they may claim benefits
- wait for 12 months from the date of their confirmed registration before claiming EI special benefits
- have earned the minimum amount of self-employed earnings during the calendar year preceding the year they apply for benefitsFootnote 115
- have reduced the amount of time devoted to their business by more than 40%, and
- meet the eligibility criteria specific to the special benefits being claimedFootnote 116
As soon as a self-employed person receives EI benefits, they would have to pay premiums on their self-employment earnings for the rest of their self-employment career. Those who also have paid employment earnings have the choice to apply for EI special benefits as self-employed persons or as insured claimants (if they have paid EI premiums through their paid employment). If they claim benefits under the former, their benefits would be calculated on the basis of both self-employment and paid employment income, whereas for the latter, only earnings from paid employment would be taken into account.
During FY2021, close to 12,800 additional self-employed persons entered into a voluntary agreement with Service Canada, bringing the total number of participating self-employed persons just under 42,700. This represents a growth of 42.8% from FY1920 (consult table 51). This increase in enrolment may be due, in part, to the COVID-19 pandemic, which prompted some self-employed persons to join the program.
| Number of workers | FY1617 | FY1718 | FY1819 | FY1920 | FY2021 |
|---|---|---|---|---|---|
| Net enrolments | 1,820 | 1,874 | 2,046 | 6,572 | 12,778 |
| New participants to the program (opted in) | 2,547 | 2,475 | 2,627 | 7,775 | 17,932 |
| Registrants who cancelled or terminated participation (opted out) | -727 | -601 | -581 | -1,203 | -5,154 |
| Cumulative total, at the end of the fiscal year | 19,366 | 21,240 | 23,286 | 29,858 | 42,636 |
- Source: Employment and Social Development Canada, Service Canada administrative data, 100% sample.
Employment Insurance special benefits for self-employed persons, claims, amount paid and level of benefits
A total of 820 special benefit claims were established by self-employed persons in FY2021, which is similar to the previous fiscal year (consult table 52). The benefit types most frequently received by self-employed EI claimants were maternity benefits and parental benefits.
| Category | Number of claims FY1920 | Number of claims FY2021 | Amount paid ($ thousands) FY1920 | Amount paid ($ thousands) FY2021 |
|---|---|---|---|---|
| Maternity | 619 | 604 | $3,240.6 | $3,697.7 |
| Parental | 667 | 667 | $7,048.4 | $7,924.4 |
| Other special benefits* | 198 | 177 | $551.5 | $805.5 |
| Atlantic | 44 | 53 | $519.9 | $704.7 |
| Quebec | 32 | 24 | $84.9 | $106.4 |
| Ontario | 341 | 339 | $4,794.7 | $5,286.8 |
| Prairies | 208 | 177 | $2,626.3 | $2,744.4 |
| British Columbia and the Territories | 209 | 227 | $2,814.6 | $3,585.3 |
| Men | 38 | 38 | $169.8 | $266.2 |
| Women | 796 | 782 | $10,670.7 | $12,161.4 |
| 29 years old and under | 136 | 122 | $1,912.5 | $1,894.5 |
| 30 to 39 years old | 589 | 585 | $8,329.1 | $9,517.2 |
| 40 to 54 years old | 77 | 80 | $501.5 | $828.7 |
| 55 years old and over | 32 | 33 | $97.4 | $187.3 |
| Canada | 834 | 820 | $10,840.5 | $12,427.6 |
- Note: Data may not add up to the total due to rounding. Includes all claims to self-employed persons for which at least $1 in EI special benefits was paid. New claims established by benefit type may not sum as claimants can receive multiple benefit types on a single claim.
- * Sickness benefits were not available during the first half of FY2021 (consult section 2.0).
- Source: Employment and Social Development Canada, Employment Insurance (EI) administrative data. Data are based on a 100% sample of EI administrative data.
Ontario is the region that established the largest number of claims in FY2021, and its relative share of total claims has remained relatively stable compared to the previous year. Conversely, the proportion of claims established in the Prairies decreased from 24.9% in FY1920 to 21.6% in FY2021, while the proportion for British Columbia and the territories increased from 25.1% to 27.7% over the same period. Quebec continued to be under-represented in terms of new claims established (2.9% of all self-employed benefits in FY2021) due to the fact that the province offers maternity, parental, adoption and paternity benefits under the Quebec Parental Insurance Plan with mandatory participation of self-employed persons (consult subsection 2.6.2).
As in the past, women made up the vast majority (95.4%) of new claims established for self-employed persons. By age, claimants between 30 and 39 years old accounted for the largest share of new claims (71.3%). Conversely, claimants aged 55 years and over represented the smallest share of new claims, notably because sickness benefits were not available during the first half of FY2021.
The total amount paid in EI special benefits to self-employed persons was $12.4 million for the reporting period. Similar to the breakdown of claims by region, the proportion of special benefits paid to the Prairies was slightly lower than in FY1920, while the proportion of special benefits paid to British Columbia and the territories was higher.
As observed with claims, women received the largest share of the total special benefits paid to self-employed persons in FY2021. Claimants aged 39 years and under also continued to receive the largest share of special benefits paid to self-employed persons.
The average weekly benefit rateFootnote 117 for self-employed persons who established a special benefit claim during the first half of FY2021 was $387. It was $510 for claims established during the second half of FY2021 when the EI temporary measure relating to the minimum benefit rate was in effect (consult section 2.0). On average, the highest weekly benefit rate was for claims established in British Columbia and the Territories and by men.
2.7 Employment Insurance financial information
In this section
- 2.7.1 Employment Insurance premium rate
- 2.7.2 Premium refund provision
- 2.7.3 Premium reduction program
- 2.7.4 Recent trends in revenues and expenditures
The EI program is financed through mandatory premium contributions made by both employers and employees across Canada. These contributions are based on the employees’ insurable earnings up to the annual Maximum Insurable Earnings (MIE).Footnote 118 Since January 2010, self-employed individuals who have opted into the EI program are also required to pay EI premiums in order to be eligible for EI special benefits.
EI premiums and all other types of revenues (such as interest and penalties) related to the EI program under the authority of the Employment Insurance Act are first deposited into the Consolidated Revenue Fund (CRF)Footnote 119 and then credited to the EI Operating Account (Account). All EI benefits paid and administrative costs provided for under the Employment Insurance Act are paid out of the CRF and debited from the Account.
The following section provides information on EI premium rates and recent trends in revenues and expenditures recorded for the Account.
2.7.1 Employment Insurance premium rate
As defined in the Employment Insurance Act, one of the key duties of the Canada Employment Insurance Commission (the Commission) is to set the annual EI premium rate. Since April 1, 2016, the Commission has been responsible for setting the EI premium rate. The rate is set according to a 7-year break-even mechanism (under which the projected balance for the Account is expected to be $0 in 7 years) as forecasted by the EI Senior Actuary. Premium rates are therefore expected to generate sufficient premium revenue to cover expected EI expenditures over the following 7 years and eliminate any existing cumulative surplus or deficit in the Account. In addition, annual changes to the EI premium rate are legislatively limited to increases or decreases of no more than 5 cents every year.Footnote 120 The 7-year break-even mechanism ensures predictable premium rates for employees and employers. Employers pay EI premiums that are 1.4 times the employee rate.
The Senior Actuary’s forecasted EI premium rates are calculated based on the forecasted insurable earnings on which premiums are paid. EI premiums are paid by employers, employees and self-employed persons who have opted into the EI program, for every $100 of insurable earnings up to the annual MIE threshold. In 2021, the MIE was $56,300, increasing by $2,100 (+3.9%) from the previous year’s MIE of $54,200.
The EI program grants a reduction in the EI premium rate paid on insurable earnings to employees who are covered by a provincial parental insurance plan. Since January 1, 2006, Quebec is the only province in Canada that has been administering its own parental insurance plan, known as the Quebec Parental Insurance Plan (QPIP). QPIP provides paid parental, adoption, maternity and paternity benefits to eligible claimants and is financed by contributions made by workers and employers in Quebec. These benefits replace maternity and parental benefits provided by the EI program and, as such, EI premiums in Quebec are lowered to reflect the savings that are generated for the EI program as a result of the existence of QPIP.
In 2021, the EI premium rate for employees (who were not covered by a provincial parental insurance plan) was $1.58 per $100 of insurable earnings, unchanged from the previous year.Footnote 121 As a result, the maximum annual EI premiums paid by employees was $889.54 in 2021. As mentioned previously, employers pay EI premiums that are 1.4 times the employee rate such that employers contribute approximately 58% of the total EI premium revenues versus approximately 42% contributed by the employees. This means that employers paid $2.21 ($2.212 unrounded) for every $100 of insurable earnings of their employees in 2021, up to a maximum of $1,245.36. Self-employed persons who opted into the program pay the same EI premium rate as employees, and also pay premiums up to the annual MIE.Footnote 122 In 2021, the EI premium rate for employees in Quebec was set at $1.18 per $100 of insurable earnings, while for employers it was $1.65 ($1.652 unrounded) per $100 of insurable earnings of their employees. Table 53 summarizes this information for the past 5 years.
| Category | 2017 | 2018 | 2019 | 2020 | 2021 |
|---|---|---|---|---|---|
| Employee premium rates for residents of a province without a provincial parental insurance plan | $1.63 | $1.66 | $1.62 | $1.58 | $1.58 |
| Employer premium rates for residents of a province without a provincial parental insurance plan | $2.282 | $2.324 | $2.268 | $2.212 | $2.212 |
| Employee premium rates for residents of a province with a provincial parental insurance plan (Quebec) | $1.27 | $1.30 | $1.25 | $1.20 | $1.18 |
| Employer premium rates for residents of a province with a provincial parental insurance plan (Quebec) | $1.778 | $1.820 | $1.750 | $1.680 | $1.652 |
| Maximum insurable earnings | $51,300 | $51,700 | $53,100 | $54,200 | $56,300 |
| Employee annual maximum contribution | $836.19 | $858.22 | $860.22 | $856.36 | $889.54 |
| Employer annual maximum contribution | $1,170,67 | $1,201.51 | $1,204.31 | $1,198.90 | $1,245.36 |
- * Per $100 of insurable earnings.
- Source: Summary of the Actuarial Report on the 2021 Employment Insurance Premium Rate
Example: Employment Insurance premium contributions
Olivia is an employee working at a call centre in Halifax, Nova Scotia, and earns $45,000 per year.
Based on Olivia’s income level and assuming she remained employed throughout the year; her annual contribution to the EI program in 2021 would be $711 at the premium rate of $1.58 for every $100 of insurable earnings. Her employer would contribute $995.40 in EI premiums on her insurable earnings, for a combined total of $1,706.40 in contributions made to the Account in 2021.
However, if Olivia was working and living in Quebec, her annual EI contribution in 2021 would be reduced to $531, and her employer would have contributed $743.40 in EI premiums on her earnings, for a combined total of $1,274.40 in contributions made to the Account. At the premium rate of $0.494 for every $100 of insurable earnings in 2021, Olivia’s contribution to the Quebec Parental Insurance Plan (QPIP) would be $222.30, while her employer’s contribution would be $311.40 (at the employers’ premium rate of $0.692 for every $100 of insurable earnings of employees). Note that QPIP premiums are set by the Quebec Parental Insurance Plan’s Conseil de gestion and not by the Commission.
Chart 22 illustrates the EI premium rates for employees and employersFootnote 123 over the past 10 years in Quebec and the rest of Canada. The Government froze the 2014 premium rate for employees at the 2013 level of $1.88 per $100 of insurable earnings, and legislated the 2015 and 2016 rates at that amount. The 2021 rate, as well as the 2022 rate, has been frozen at the 2020 premium rate level of $1.58 per $100 of insurable earnings, as part of the Government’s economic response to COVID-19.
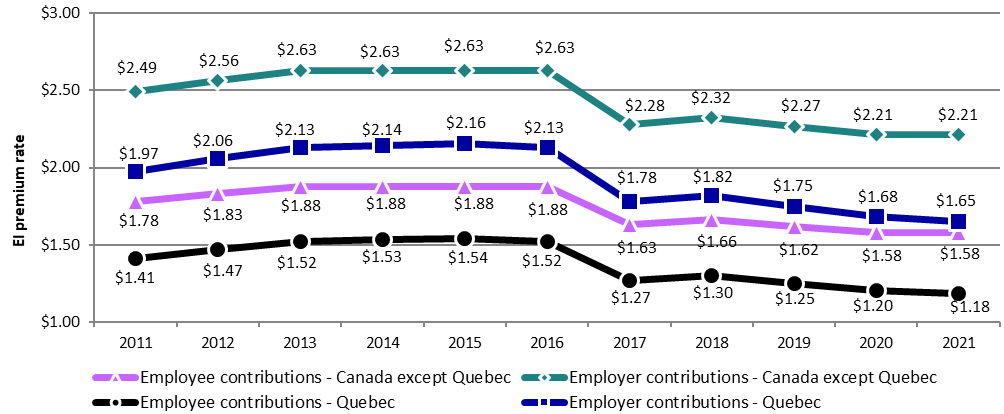
Text description of Chart 22
| Category | 2011 | 2012 | 2013 | 2014 | 2015 | 2016 | 2017 | 2018 | 2019 | 2020 | 2021 |
|---|---|---|---|---|---|---|---|---|---|---|---|
| Employee contributions - Canada except Quebec | $1.78 | $1.83 | $1.88 | $1.88 | $1.88 | $1.88 | $1.63 | $1.66 | $1.62 | $1.58 | $1.58 |
| Employer contributions - Canada except Quebec | $2.49 | $2.56 | $2.63 | $2.63 | $2.63 | $2.63 | $2.28 | $2.32 | $2.27 | $2.21 | $2.21 |
| Employee contributions - Quebec | $1.41 | $1.47 | $1.52 | $1.53 | $1.54 | $1.52 | $1.27 | $1.30 | $1.25 | $1.20 | $1.18 |
| Employer contributions - Quebec | $1.97 | $2.06 | $2.13 | $2.14 | $2.16 | $2.13 | $1.78 | $1.82 | $1.75 | $1.68 | $1.65 |
- Source: Government of Canada, Public Accounts of Canada 2021, Volume I: Summary Report and Consolidated Financial Statements (Ottawa: Receiver General for Canada, 2021) and past year versions of the Public Accounts Report.
2.7.2 Premium refund provision
Under certain circumstances, a share or all of EI premiums paid can be refunded to contributors if certain conditions are met.
The EI program includes a provision that grants EI premium refunds to employees with insurable earnings equal to or less than $2,000 in a given calendar year, as they are unlikely to qualify for EI benefits. In addition to this, some employees, such as those with multiple jobs or those who change jobs during the year, may pay EI premiums on earnings that exceed the MIE and the maximum annual contribution in a given tax year. Under these circumstances, affected employees are entitled to receive a refund of all or a portion of their EI premiums paid in the year when filing their income tax returns. It is important to note that employers do not receive a corresponding refund.
According to Canada Revenue Agency (CRA) data on T4 slipsFootnote 124 from employers, there were 863,100 individuals in 2019 (the most recent taxation year for which data is available) that were eligible to receive full EI premium refund under the Premium Refund Provision, representing 4.7% of those with insurable earnings. Of these individuals who were eligible to receive full refund paid on EI premiums, 75.4% (651,200 individuals) had filed income taxes and 66.3% (572,500 individuals) received a full premium refund based on CRA T1 tax filer data. A total of $8.5 million in premiums were refunded to the eligible individuals in 2019. On average, each eligible individuals received $14.90 in EI premium refund.
2.7.3 Premium reduction program
The Premium Reduction Program (PRP) was introduced in 1971 to encourage employers to provide short-term income protection coverage plans to their employees. The PRP recognized employer-based plans that already existed and encouraged employers to continue to offer them as the EI sickness benefits became available.
Under the Employment Insurance Act, employers who provide qualified wage-loss plans, also known as short-term disability plans, to their employees that are at least equivalent to the protection provided by EI sickness benefits may be eligible to receive a reduction in the EI premiums payable through the PRP. The PRP puts less strain on the EI program as employees who are covered by such short-term disability plans may not have to collect EI benefits, or may collect them for a shorter period of time, as benefits from the registered plans provided by employers have to be paid before EI benefits are paid.
There are 2 types of wage-loss replacement plans for which EI premium reductions may be granted: cumulative paid sick leave plans and weekly indemnity programs. These plans must also meet certain requirements established by the Commission.Footnote 125 The premium reduction reflects the average savings generated to the EI Account due to the existence of these plans, and is provided directly to employers. As EI premiums are paid by both employers and employees in a proportion of 7/12 and 5/12, respectively, employers are required to ensure that their employees benefit from the reduction of the employers’ premium in an amount at least equal to 5/12 of the reduction.
In each calendar year, the rates of premium reduction are established based on 4 categories of qualified plans, with a distinct rate for each category, as explained below:
- category 1: cumulative paid sick leave plans that allow for a minimum monthly accumulation of 1 day and for a total accumulation of at least 75 days
- category 2: cumulative paid sick leave plans that allow for a minimum monthly accumulation of 1 and two-third days and for a total accumulation of at least 125 days
- category 3: weekly indemnity plans with a benefit period of at least 15 weeks
- category 4: weekly indemnity plans with a benefit period of at least 52 weeks (this reduction is available only to public and para-public employers of a province)
Rates of premium reduction are expressed as a percentage of the insurable earnings of employees. In 2021, the rates of reduction were 0.23%, 0.37%, 0.37% and 0.40% of insurable earnings for categories 1 through 4, respectively.Footnote 126 An estimated $993.7 million in premium reductions were generated by the wage-loss plans in 2019 (the most recent taxation year for which data is available), compared to $953.1 million in 2018 and $922.2 million in 2017.Footnote 127
A departmental studyFootnote 128 on the PRP estimated that there were approximately 27,220 employers receiving EI premium reductions through the PRP in 2015. About 7.8 million of workers were employed in those firms receiving a premium reduction in 2015. The departmental study also shows that, during the period of 2000 to 2015, approximately 89.0% of all employers in the program offered a category 3 plan with weekly indemnity to their employees. Another 7.0% of employers offered category 1 with cumulative paid sick leave plans, followed by 1.5% offering the combination of 2 or more types of short-term disability plan. The last 2.5% is shared between employers offering category 2 or category 4 plans. These breakdowns have remained stable during the 15 years examined.
2.7.4 Recent trends in revenues and expenditures
As required by Section 64 of the Financial Administration Act, the Receiver General prepares the Public Accounts of Canada annually to report on the financial transactions of the Government for the fiscal year. According to the Public Accounts of Canada, EI revenue was $22.9 billion in FY2021, up from $22.7 billion (+0.8%) from the previous year. Over the same period, EI expenditures jumped from $23.7 billion in FY1920 to $61.8 billion in FY2021 (+$38.1 billion or 160.6%) (consult table 54).
The significant increase in EI expenditures in FY2021 are mostly due to the rise in the amount paid in EI Emergency Response Benefit (+$22.9 billion) and the temporary measuresFootnote 129 that facilitated access to benefits under EI Part-I (+$13.8 billion). Following the announcement made on September 14, 2020, the Government of Canada credited the Account $27.3 billion for costs associated with EI Emergency Response Benefit. The Account had an annual deficit of $11.6 billion by the end of FY2021 (consult table 54).
| Operating Account | FY1617 | FY1718 | FY1819 | FY1920 | FY2021 |
|---|---|---|---|---|---|
| Revenues* | $22,603.3 | $21,614.0 | $22,781.6 | $22,713.7 | $22,896.5 |
| Premiums | 99.7% | 99.6% | 99.6% | 99.7% | 99.9% |
| Interest and penalties | 0.3% | 0.4% | 0.4% | 0.3% | 0.1% |
| Expenditures** | $22,518.9 | $21,662.0 | $20,817.4 | $23,724.8 | $61,838.3 |
| Employment Insurance benefits (Part I) | 83.5% | 82.4% | 81.0% | 74.8% | 51.0% |
| Employment benefits and support measures (Part II) | 9.7% | 10.0% | 11.1% | 10.4% | 4.0% |
| Benefit repayments | -1.2% | -1.4% | -1.4% | -1.0% | -0.4% |
| Employment Insurance Emergency Response Benefit*** | n/a | n/a | n/a | 7.4% | 39.9% |
| Administration costs | 7.9% | 8.7% | 8.8% | 8.0% | 4.1% |
| Bad debts | 0.1% | 0.3% | 0.5% | 0.3% | 1.5% |
| Funding from the Government of Canada – Employment Insurance Emergency Response Benefit**** | n/a | n/a | n/a | n/a | 27,331.4 |
| Annual surplus (deficit) | $84.4 | ($48.0) | $1,964.3 | ($1,011.1) | ($11,610.3) |
- Note: Data may not add up to the total due to rounding.
- * Includes all revenues and funding from EI premiums, interest owed on accounts receivable, penalties applied to claimants for violations of terms and conditions of the EI program and additional funding measures introduced for Employment Insurance under the federal budget.
- ** Includes all expenses related to funding and operations of the EI program, including benefit payments under Part I of the EI program, Employment Benefit and Support Measure (EBSM) expenditures under Part II of the EI program, EI benefit repayments, administrative costs and outstanding debts counted as liabilities against the EI Operating Account.
- *** The Employment Insurance Emergency Response Benefit is the portion of the Canada Emergency Response Benefit that was administered by Employment and Social Development Canada. Expenses related to the EI Emergency Response Benefit were paid from the EI Operating Account and are included in this financial statement.
- **** Pursuant to section 153.111 of the Employment Insurance Act, the Account was credited the reported amount determined by the Minister of Finance that corresponds to the total cost of the EI Emergency Response Benefit (EI-ERB), including all costs related to the benefit and its administration. The funding from the Government of Canada is recognized in the period in which the transfer was authorized. Funding for FY2021 is comprised of the current year and previous year’s EI-ERB expenses, incremental costs related to the administration of the EI-ERB and bad debt related expenses.
- Source: Government of Canada, Public Accounts of Canada 2021, Volume I: Summary Report and Consolidated Financial Statements (Ottawa: Receiver General for Canada, 2021) and past year versions of the Public Accounts Report.
Chart 23 shows the financial position of the Account at the end of the fiscal year for the past 10 years. On March 31, 2021, the accumulated deficit in the Account was $7.71 billion, down from the $3.90 billion in accumulated surplus at the end of the previous fiscal year. As previously mentioned, this decline is mainly attributable to the costs associated with the EI temporary measures related to EI Part I.
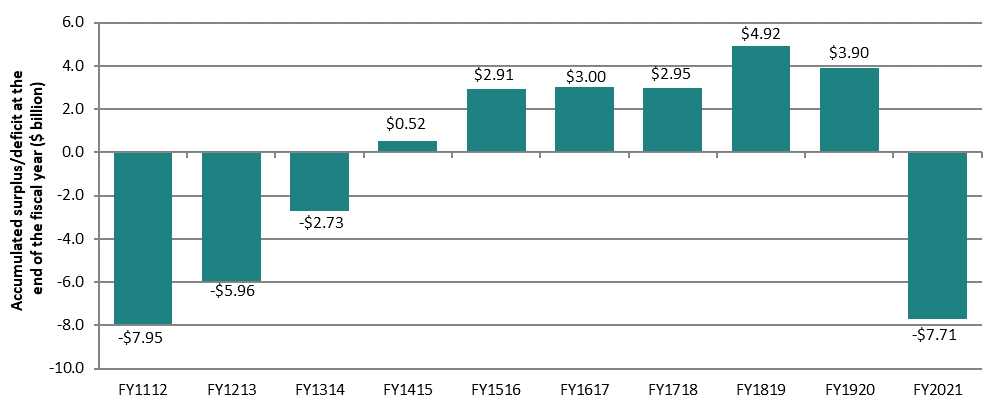
Text description of Chart 23
| Fiscal year | FY1112 | FY1213 | FY1314 | FY1415 | FY1516 | FY1617 | FY1718 | FY1819 | FY1920 | FY2021 |
|---|---|---|---|---|---|---|---|---|---|---|
| Accumulated surplus/deficit at the end of the fiscal year ($ billion) | -$7.95 | -$5.96 | -$2.73 | $0.52 | $2.91 | $3.00 | $2.95 | $4.92 | $3.90 | -$7.71 |
- Source: Government of Canada, Public Accounts of Canada 2021, Volume I: Summary Report and Consolidated Financial Statements (Ottawa: Receiver General for Canada, 2021) and past year versions of the Public Accounts Report.