
2023 annual report – Taking action against harassment and violence in workplaces under Canadian federal jurisdiction
On this page
- List of abbreviations
- List of charts
- Executive summary
- Introduction
- Section 1: About the data
- Section 2: Harassment and violence occurrences in federal jurisdiction industries
- Section 3: Harassment and violence occurrence resolution methods
- Section 4: Harassment and violence occurrence relationships
- Section 5: Discrimination in harassment and violence occurrences
- Section 6: Workplace Harassment and Violence Prevention Fund Initiatives
- Section 7: Moving forward
- Annex: List of terms
Alternate formats

2023 annual report – Taking action against harassment and violence in workplaces under Canadian federal jurisdiction [PDF - 882 KB]
Large print, braille, MP3 (audio), e-text and DAISY formats are available on demand by ordering online or calling 1 800 O-Canada (1-800-622-6232). If you use a teletypewriter (TTY), call 1-800-926-9105.
List of abbreviations
- AIRT
- Air Transportation
- BANK
- Banking and Banks
- BRID
- Interprovincial Infrastructure (Bridges, Tunnels, Canals, and Causeways)
- BROAD
- Broadcasting (Television, Radio, and Internet)
- COMM
- Communications
- EAHOR
- Employer's Annual Hazardous Occurrence Report
- EAHVOR
- Employer's Annual Harassment and Violence Occurrence Report
- ENER
- Energy, Mining and Mineral Processing
- FEED
- Feed, Flour and Seed
- FTE
- Full-time Equivalent
- GRAIN
- Grain Handling and Grain Elevators
- HV
- Harassment and violence
- HVP
- Harassment and violence prevention
- INDG
- First Nations, Band Councils, and Indigenous Self-Governments (certain activities)
- LONG
- Longshoring, Stevedoring, Port, Harbour Operations and Pilotage
- PIPE
- Pipeline Transportation
- POST
- Postal Services and Postal Contractors
- PUBS
- Federal Public Services, Public Service Departments and Crown Corporations
- RAIL
- Rail Transportation
- ROAD
- Road Transportation
- WATER
- Water Transportation (Shipping and Ferries)
- WHVPF
- Workplace Harassment and Violence Prevention Fund
List of charts
- Chart 2.1: Shares (%) of total harassment and violence (HV) occurrences vs total FTEs by federally regulated industry in 2023
- Chart 2.2: Sexual harassment and violence (HV) occurrences by federally regulated industry in 2023
- Chart 2.3: Sexual and non-sexual harassment and violence (HV) occurrences, 2021 to 2023
- Chart 2.4: Share (%) of total harassment and violence (HV) occurrences in the public sector vs private sector, 2021 to 2023
- Chart 2.5: Share (%) of sexual harassment and violence (HV) occurrences in the public sector vs private sector, out of total HV occurrences, 2021 to 2023
- Chart 3.1: Share (%) of harassment and violence (HV) occurrence resolution methods, 2021 to 2023
- Chart 3.2: Share (%) of harassment and violence (HV) occurrence resolution methods in the public sector vs private sector in 2023
- Chart 4.1: Share (%) of harassment and violence (HV) occurrence relationships, 2021 to 2023
- Chart 4.2: Harassment and violence (HV) occurrences involving a third-party relationship by federally regulated industry in 2023
- Chart 4.3: Share (%) of harassment and violence (HV) occurrence relationships in the public sector vs private sector in 2023
- Chart 5.1: Share (%) of the top 4 grounds of discrimination in harassment and violence (HV) occurrences, 2021 to 2023
- Chart 5.2: Discrimination in harassment and violence (HV) occurrences by federally regulated industry, 2021 to 2023
- Chart 5.3: Share (%) of the top 4 grounds of discrimination in harassment and violence (HV) occurrences in the public sector vs private sector in 2023
Executive summary
The Labour Program of Employment and Social Development Canada (ESDC) publishes an annual report to provide aggregated statistics on harassment and violence in the workplaces of industries under federal jurisdiction. The data source for this report is the Employer's Annual Harassment and Violence Occurrence Report (EAHVOR), which federally regulated employers must submit to the Labour Program for each reporting year.
Based on analysis of the 2023 EAHVOR data and initiatives to enhance harassment and violence prevention, this report demonstrates the need for ongoing efforts to ensure safe and respectful workplaces across the federal jurisdiction.
Key findings from the 2023 annual report
- 2023 is the third reporting year for which the Labour Program has provided an annual report since the Work Place Harassment and Violence Prevention Regulations came into force. This year's report is based on 5,393 EAHVOR submissions, an increase from the 4,777 EAHVOR submissions received during the 2022 reporting year.
- The number of harassment and violence (HV) occurrences reported by federally regulated employers increased from 6,226 in 2022 to 7,114 in 2023. The increase in occurrences by 14.3% is partially due to the larger number of submissions received for 2023, which increased by 12.9% compared to 2022.
- A single fatality related to harassment and violence was reported to the Labour Program in 2023. Previously, 3 fatalities related to harassment and violence were reported in 2022, and 0 in 2021.
- The number of reported sexual HV occurrences rose from 722 in 2022 to 1,029 in 2023.
- Five industries reported a combined 5,811 HV occurrences, representing approximately 81% of all occurrences reported in 2023. These industries also reported most of the occurrences in 2021 and 2022:
- Federal Public Services, Public Service Departments and Crown Corporations (reported 2,129 occurrences)
- Road Transportation (reported 1,242 occurrences)
- Air Transportation (reported 1,094 occurrences)
- Postal Services and Postal Contractors (reported 776 occurrences)
- Banking and Banks (reported 570 occurrences)
- Employers in the federally regulated public sector and private sector reported more HV occurrences than in 2022. The public sector, which reported 1,885 occurrences in 2022, reported 2,129 occurrences in 2023 (a 12.9% increase). The private sector, which reported 4,341 occurrences in 2022, reported 4,985 occurrences in 2023 (a 14.8% increase).
- The share of medium employers (those with 100 to 499 FTEs) that reported at least 1 HV occurrence rose from nearly 34% in 2022 to roughly 41% in 2023.
- The most frequently used method for resolving HV occurrences in 2023 was investigation, which was used to resolve 2,287 occurrences in 2022 and 2,520 occurrences in 2023 (a 10.2% increase). This was followed by negotiated resolution, which was used to resolve 1,475 occurrences in 2022 and 2,355 occurrences in 2023 (a 59.7% increase).
- The most common relationship type between a principal party (who reports being the victim of an HV occurrence) and a responding party (who is alleged to have been responsible for the occurrence) in 2023 was employee to employee. This relationship type was reported in 2,650 occurrences in 2022 and in 3,053 occurrences in 2023 (a 15.2% increase). The second-most common relationship type was employee to supervisor, manager, or business owner. This relationship type was reported in 2,178 occurrences in 2022 and in 2,704 occurrences in 2023 (a 24.2% increase).
- 1,416 instances of discrimination linked to the grounds of discrimination defined in the Canadian Human Rights Act were identified among the HV occurrences reported by employers in 2023. This is an increase of 11.2% from the 1,273 instances reported in 2022.
- Discrimination based on sex was the most frequent type of discrimination reported in 2023 and was identified in 325 occurrences (23% of all instances of discrimination reported). This was followed by discrimination based on race, which employers reported as a factor in 307 occurrences (21.7% of all instances of discrimination reported). These forms of discrimination were also the most commonly reported in 2021 and 2022.
Introduction
The Labour Program of Employment and Social Development Canada (ESDC) publishes an annual report on harassment and violence occurrences in the federal jurisdiction. The report examines the nature of HV occurrences reported by federally regulated employers and how they are resolved. It analyses the data collected in the Employer's Annual Harassment and Violence Occurrence Report (EAHVOR), which is submitted by federally regulated employers to the Labour Program for each reporting year.
The 2023 edition comprises 7 sections:
- Section 1 - About the data - outlines the data source and the employers and employees represented in this report.
- Section 2 - Harassment and violence occurrences in federal jurisdiction industries - analyses the distribution of harassment and violence occurrences among federally regulated industries.
- Section 3 - Harassment and violence occurrence resolution methods - explores the methods that employers used to resolve HV occurrences.
- Section 4 - Harassment and violence occurrence relationships - examines the relationships between principal and responding parties in HV occurrences.
- Section 5 - Discrimination in harassment and violence occurrences - analyses the presence of discrimination in HV occurrences.
- Section 6 - Workplace Harassment and Violence Prevention Fund Initiatives - provides an update on ongoing efforts to identify and address harassment and violence in federally regulated workplaces.
- Section 7 - Moving forward - concludes the report and offers recommendations for potential steps to address harassment and violence in the federal jurisdiction.
The report also includes a list of abbreviations and a glossary of terms explaining the definitions of EAHVOR terminology and other relevant terms.
Section 1: About the data
The data presented in this publication originates from the Employer's Annual Harassment and Violence Occurrence Report (EAHVOR), submitted by federally regulated employers to the Labour Program for the 2023 reporting year. Data from previous years were used when analysing trends or making year-to-year comparisons.
Industries under federal jurisdiction
According to the Canada Labour Code (the Code), federal jurisdiction encompasses any work and/or undertaking or business that is within the legislative authority of the Parliament of Canada. This includes all work deemed to be for the common good of at least 2 provinces and outside the exclusive authority of provincial legislatures. Part II of the Code also applies to employers and employees covered under the Parliamentary Employment and Staff Relations Act.
EAHVOR submissions
Since 2021, federally regulated employers have been required to submit an EAHVOR to the Labour Program by March 1 each year. An EAHVOR must include the following information:
- the total number of HV occurrences reported to the employer, including:
- non-sexual HV occurrences
- sexual HV occurrences
- HV occurrences that resulted in the death of an employee
- the final resolution method used by an employer to resolve each HV occurrence
- the relationships between all parties involved in each HV occurrence
- the number of HV occurrences that fell under each prohibited ground of discrimination set out in subsection 3(1) of the Canadian Human Rights Act
- the location where each HV occurrence took place
- the average number of months taken to complete the resolution process for all HV occurrences
As shown in Table 1.1, the Labour Program received 5,393 EAHVOR submissions that meet the reporting requirements for the 2023 reporting year. The number of submissions received increased by approximately 600 compared to 4,777 in 2022. There were 639 employers who reported at least 1 HV occurrence, which represents 11.8% of all federally regulated employers who submitted an EAHVOR. This is an increase from 2022, when 541 employers reported at least 1 HV occurrence. Notably, 81.6% of all HV occurrences were reported by 102 employers (1.9% of the employers who submitted an EAHVOR).
| Industry | EAHVOR submissions in 2022 | EAHVOR submissions in 2023 |
|---|---|---|
| AIRT | 688 | 764 |
| BANK | 58 | 66 |
| BRID | 6 | 7 |
| BROAD | 170 | 191 |
| COMM | 183 | 196 |
| ENER | 15 | 18 |
| FEED | 301 | 336 |
| GRAIN | 56 | 62 |
| INDG | 301 | 324 |
| LONG | 58 | 62 |
| PIPE | 22 | 24 |
| POST | 12 | 17 |
| PUBS | 233 | 480 |
| RAIL | 23 | 26 |
| ROAD | 2,518 | 2,673 |
| WATER | 133 | 147 |
| Canada | 4,777 | 5,393 |
The number of EAHVOR submissions from every industry rose from 2022 to 2023. The Federal Public Service had the largest increase in its number of submissions, more than doubling from 233 in 2022 to 480 in 2023. This was followed by the Road Transportation industry, which submitted 2,518 reports in 2022 and 2,673 reports in 2023. Since an organisation’s industry is determined by the nature of its activities in terms of products and services delivered, some Crown corporations are not classified under Federal Public Services, Public Service Departments and Crown Corporations. As an example, Canada Post is classified as a Crown corporation under the Postal Services industry due to the nature of its work.
A factor that contributed to the increased number of submissions in 2023 is that employers in the federal jurisdiction have become more aware of their annual requirement to complete the EAHVOR. The higher number of submissions received in 2023 suggests that employer awareness has grown since the reporting requirement was introduced in 2021. This was achieved through promotion and awareness notifications on social media and improved online resources for the public, which highlighted the reporting requirements.
It is important to note that the data presented in this report covers only the HV occurrences for which a notice of occurrence was provided to the employer (designated recipient) under subsection 15(1) of the Work Place Harassment and Violence Prevention Regulations (the Regulations), which the employer then reported to the Labour Program on the EAHVOR. Because of this data collection process, the number of HV occurrences analysed in this publication may differ from the number of occurrences reported in anonymous employee surveys.
Information on full-time equivalent (FTE) employees is used to estimate the size of employers who submitted an EAHVOR. FTE data contained in this report comes from Employer's Annual Hazardous Occurrence Report (EAHOR) submissions from federally regulated employers.
Out of the 5,393 employers who submitted an EAHVOR in 2023 that were included in this report, 5,187 (approximately 96%) have reported their organisation's number of FTEs on an EAHOR. The EAHVOR data in the business size analysis sections is slightly different compared to the rest of the report because 206 submissions could not be matched with FTE data from an EAHOR and were excluded from the business size analysis. This included 3 submissions where a total of 4 HV occurrences were reported.
Section 2: Harassment and violence occurrences in federal jurisdiction industries
Federally regulated employers reported 7,114 HV occurrences in 2023, a notable increase from 2022 when 6,226 occurrences were reported. Despite the increase in total HV occurrences reported in the federal jurisdiction, 8 out of 16 federally regulated industries reported fewer occurrences in 2023 than in 2022. Furthermore, 1 fatality related to harassment and violence was reported in 2023, down from 3 fatalities reported in 2022.
The total increase of 888 HV occurrences in 2023 is largely due to a small number of employers who reported significantly more occurrences than in 2022. The 10 employers who had the largest increases in HV occurrences reported a combined increase of 959 occurrences. Across these 10 employers, HV occurrences increased on average by 202% which far surpassed the federal jurisdiction's approximately 14% increase. This means that a small subset of employers drove the overall increase in HV occurrences in 2023 which was offset by employers who reported a decrease in HV occurrences that year.
There were 724 employers who submitted an EAHVOR in both years and reported at least 1 HV occurrence in either 2022 or 2023. Of these employers, 49.4% (358 employers) reported an increase in occurrences, 42.4% (307 employers) reported a decrease in occurrences, and 8.1% (59 employers) reported the same number for both years. The data shows that there is a considerable number of employers who observed a reduction in HV occurrences in the workplace from 2022 to 2023. This was overshadowed by a small subset of employers who reported significantly more occurrences in 2023.
Industry analysis
As Table 2.1 illustrates, the majority of HV occurrences reported in 2023 came from 5 industries:
- Federal Public Services, Public Service Departments and Crown Corporations (2,129, 29.9%)
- Road Transportation (1,242, 17.5%)
- Air Transportation (1,094, 15.4%)
- Postal Services and Postal Contractors (776, 10.9%)
- Banking and Banks (570, 8.0%)
| Industry | Total number of HV occurrences* | Total sexual HV occurrences | Total non-sexual HV occurrences | Fatalities related to harassment and violence |
|---|---|---|---|---|
| AIRT | 1,094 | 183 | 910 | 1 |
| BANK | 570 | 136 | 434 | 0 |
| BRID | 3 | 0 | 3 | 0 |
| BROAD | 84 | 21 | 63 | 0 |
| COMM | 198 | 26 | 172 | 0 |
| ENER | 81 | 14 | 67 | 0 |
| FEED | 39 | 9 | 30 | 0 |
| GRAIN | 34 | 8 | 26 | 0 |
| INDG | 435 | 31 | 394 | 0 |
| LONG | 65 | 13 | 52 | 0 |
| PIPE | 40 | 2 | 38 | 0 |
| POST | 776 | 18 | 758 | 0 |
| PUBS | 2,129 | 191 | 1,932 | 0 |
| RAIL | 223 | 23 | 200 | 0 |
| ROAD | 1,242 | 334 | 900 | 0 |
| WATER | 101 | 20 | 81 | 0 |
| Canada | 7,114 | 1,029 | 6,060 | 1 |
*The sum of sexual HV occurrences, non-sexual HV occurrences, and fatalities related to harassment and violence does not equal the Total Number of HV occurrences since the type of some occurrences was not reported in employer EAHVOR submissions.
These 5 industries (AIRT, BANK, POST, PUBS and ROAD in Table 2.1) reported a total of 5,811 HV occurrences, 81.7% of all occurrences reported in 2023. This is similar to 2021 and 2022, during which these industries also reported the majority of HV occurrences. The number of occurrences reported by these industries increased from 2022 to 2023, with the exception of the Road Transportation industry, where it decreased by 11.5%, from 1,403 in 2022 to 1,242 in 2023.
It should be noted that these 5 industries account for approximately 1 million FTEs in the federal jurisdiction. As Chart 2.1 illustrates, this corresponds to roughly 82% of all FTEs covered by employers who submitted an EAHVOR in 2023.
Please note that percentage values in some charts and tables may not add up to 100% due to rounding.
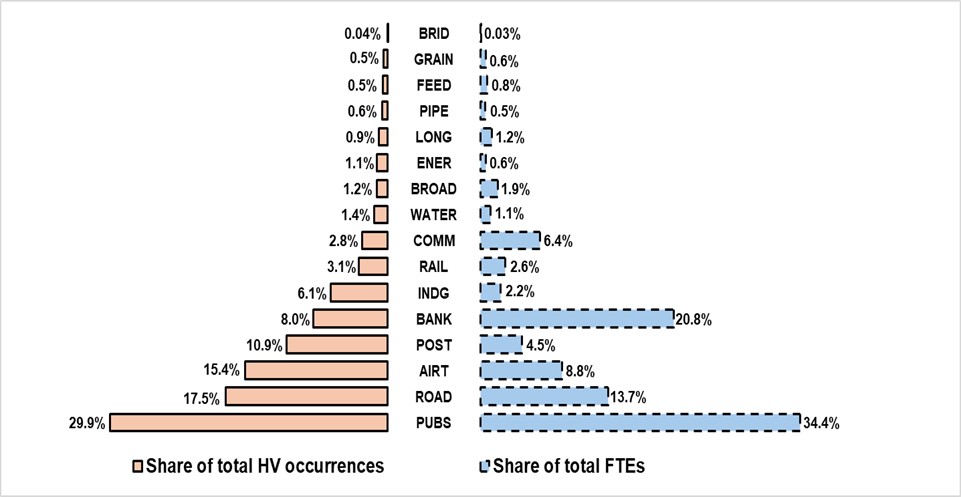
Chart 2.1 - Text description
| Industry | Share of total HV occurrences | Share of total FTEs |
|---|---|---|
| BRID | 0.04% | 0.03% |
| GRAIN | 0.5% | 0.6% |
| FEED | 0.5% | 0.8% |
| PIPE | 0.6% | 0.5% |
| LONG | 0.9% | 1.2% |
| ENER | 1.1% | 0.6% |
| BROAD | 1.2% | 1.9% |
| WATER | 1.4% | 1.1% |
| COMM | 2.8% | 6.4% |
| RAIL | 3.1% | 2.6% |
| INDG | 6.1% | 2.2% |
| BANK | 8.0% | 20.8% |
| POST | 10.9% | 4.5% |
| AIRT | 15.4% | 8.8% |
| ROAD | 17.5% | 13.7% |
| PUBS | 29.9% | 34.4% |
Sexual harassment and violence occurrences analysis
The number of reported sexual HV occurrences has risen for the second year in a row, from 722 in 2022 to 1,029 in 2023. As Chart 2.2 demonstrates, the majority of sexual HV occurrences in 2023 (82%) were reported by the following 4 industries:
- Road Transportation (334, 32.5%)
- Federal Public Services, Public Service Departments and Crown Corporations (191, 18.6%)
- Air Transportation (183, 17.8%)
- Banking and Banks (136, 13.2%)
As explained above, these industries are the largest in the federal jurisdiction in terms of FTEs. The size of these industries is a possible reason why they reported the most sexual HV occurrences in 2023. However, another possible contributing factor is that organisations in these industries may have adopted a culture where employees are more open to reporting sexual HV occurrences.
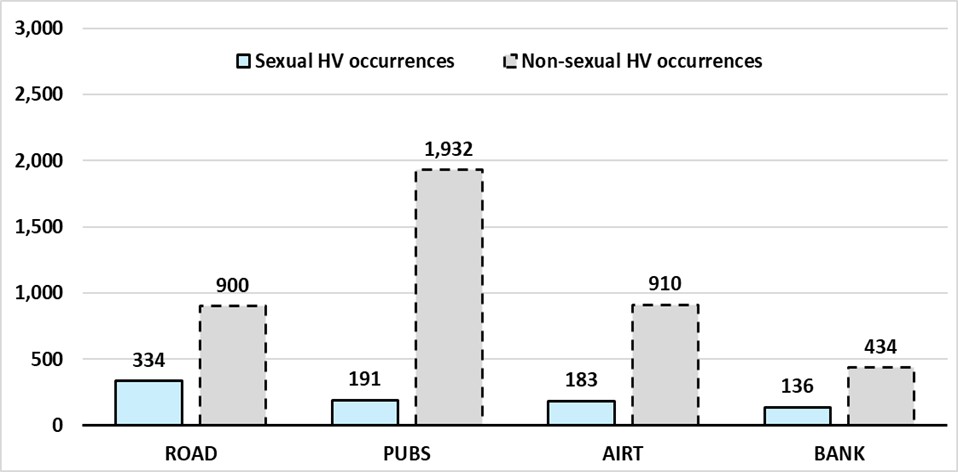
Chart 2.2 - Text description
| Industry | Sexual HV occurrences | Non-sexual HV occurrences |
|---|---|---|
| ROAD | 334 | 900 |
| PUBS | 191 | 1,932 |
| AIRT | 183 | 910 |
| BANK | 136 | 434 |
Although the number of reported sexual HV occurrences increased in all 4 industries from 2022 to 2023, Road Transportation saw the largest increase from 225 in 2022 to 334 in 2023. Furthermore, nearly 27% of all HV occurrences reported in the Road Transportation industry were sexual in nature, the largest share among the 4 industries. The Banking industry reported the second-largest share of 23.9%.
Chart 2.3 shows how the number of non-sexual HV occurrences reported has also increased from 4,915 in 2022 to 6,060 in 2023. It should be noted that while cases of sexual and non-sexual harassment and violence have risen for 2 years, this does not mean that occurrences are happening more often. One possible explanation is that employers might be better at identifying and resolving these issues in the workplace. Another is that employees might feel more comfortable reporting them than they did before due to greater awareness of their rights and obligations.
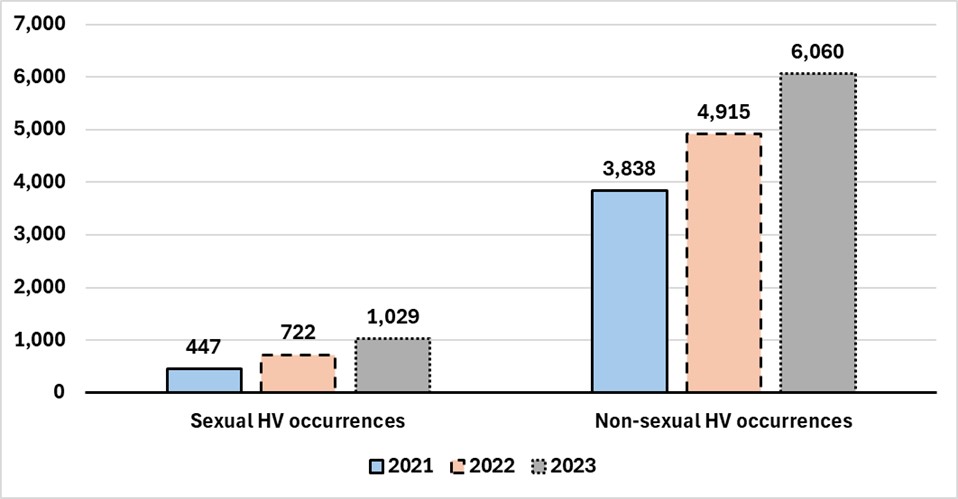
Chart 2.3 - Text description
| Year | Sexual HV occurrences | Non-sexual HV occurrences |
|---|---|---|
| 2021 | 447 | 3,838 |
| 2022 | 722 | 4,915 |
| 2023 | 1,029 | 6,060 |
As previously discussed, a small number of employers are driving the growth in total reported HV occurrences. A similar pattern exists specifically for sexual HV occurrences. The 10 employers that reported the largest increases in sexual HV occurrences accounted for 220 more occurrences in 2023. The average percentage change in sexual HV occurrences from 2022 to 2023 of these 10 employers was nearly 593%.
There were 301 employers who submitted an EAHVOR in both years and reported at least 1 sexual HV occurrence in either 2022 or 2023. Of these employers, 49.2% (148 employers) reported an increase in occurrences, while 40.9% (123 employers) reported a decrease in occurrences, and approximately 10% (30 employers) reported the same number for both years.
Public vs private sector analysis
The public sector, represented by the Federal Public Service, reported 2,129 HV occurrences in 2023, after reporting 1,885 occurrences in 2022. The remaining federally regulated industries (the private sector) reported 4,985 occurrences in 2023, an increase from the 4,341 occurrences they reported in 2022. Please note that for analysis comparing the public sector and the private sector, not all Crown corporations are consolidated into the Federal Public Service. A few Crown corporations are classified under different industries. For example, Canada Post is treated as part of the Postal Services industry (the private sector) and the Bank of Canada is included in the Banking industry.
The number of reported HV occurrences increased by a larger number in the private sector compared to the public sector in 2023. This caused the private sector's proportion of total occurrences to increase to slightly over 70%, while the public sector's proportion of total occurrences decreased to just under 30%.
As Chart 2.4 demonstrates, this marks the second consecutive year that the private sector's share of HV occurrences has increased.
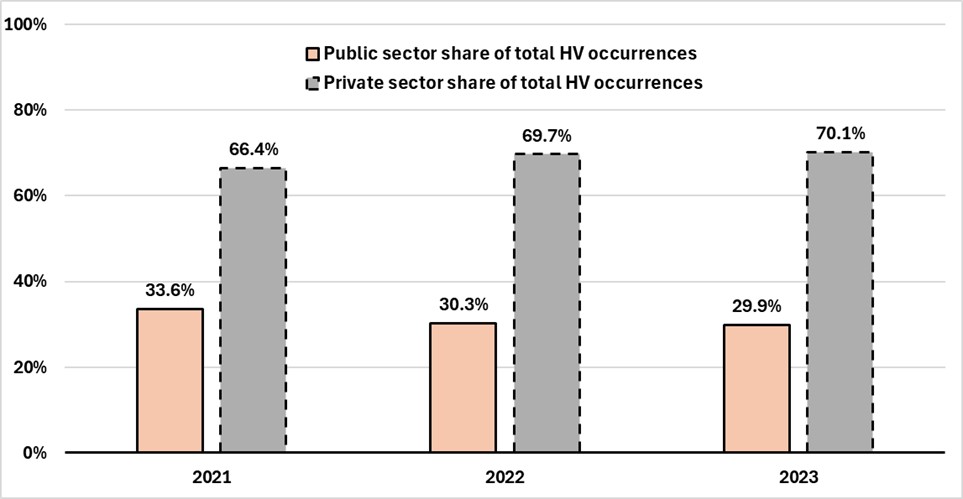
Chart 2.4 - Text description
| Year | Public sector share of total HV occurrences | Private sector share of total HV occurrences |
|---|---|---|
| 2021 | 33.6% | 66.4% |
| 2022 | 30.3% | 69.7% |
| 2023 | 29.9% | 70.1% |
As Table 2.2 demonstrates, sexual HV occurrences increased in the public sector from 103 in 2022 to 191 in 2023. Meanwhile in the private sector, reported sexual HV occurrences increased from 619 in 2022 to 838 in 2023.
| Year | Public sector sexual HV occurrences | Private sector sexual HV occurrences |
|---|---|---|
| 2021 | 90 | 357 |
| 2022 | 103 | 619 |
| 2023 | 191 | 838 |
In addition to the number of sexual HV occurrences reported by the public and private sectors, the percentage share of sexual HV occurrences out of the total reported HV occurrences also increased in both sectors in 2023. As shown in Chart 2.5, this share increased in both sectors during 2022 as well, meaning that the share of sexual HV occurrences increased while the share of non-sexual HV occurrences decreased in both the public and private sectors. It should be noted that the size of the share of sexual HV occurrences out of the total HV occurrences increased more in the public sector than in the private sector, 3.5% and 2.5% respectively.
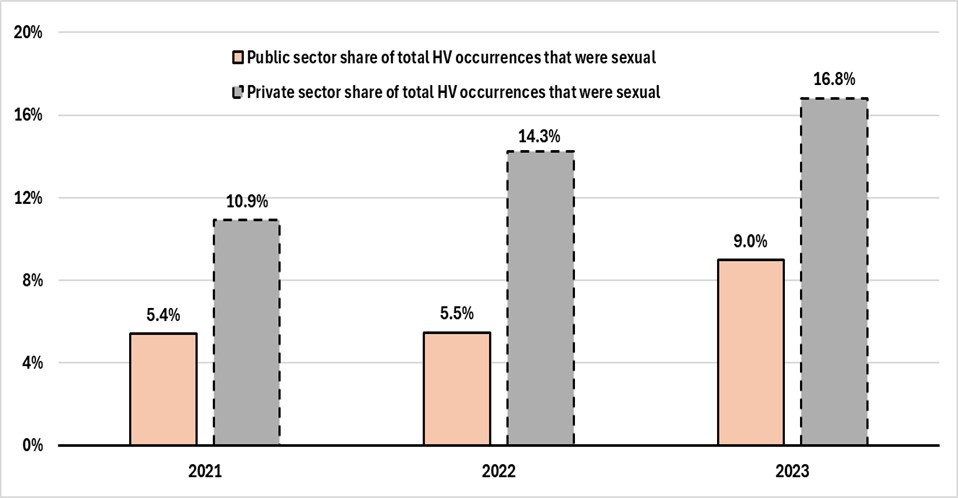
Chart 2.5 - Text description
| Sectoral data | 2021 | 2022 | 2023 |
|---|---|---|---|
| Public sector share of total HV occurrences that were sexual | 5.4% | 5.5% | 9.0% |
| Private sector share of total HV occurrences that were sexual | 10.9% | 14.3% | 16.8% |
Business size analysis
As Table 2.3 shows, large employers (those with 500 or more FTEs) were the most likely to report at least 1 HV occurrence on their EAHVOR submission. Considering that 84.8% of large employers reported at least 1 occurrence, this could suggest that organisations with more FTEs are more likely to report incidences of harassment and violence. One explanation is that having a large number of employees makes it statistically more likely that harassment and violence will occur. Notably, the share of medium employers that reported at least 1 HV occurrence rose from nearly 34% in 2022 to roughly 41% in 2023.
| Business size | Number of FTEs | Number of submissions | Number of submissions with at least 1 HV occurrence | Share of businesses that reported at least 1 HV occurrence |
|---|---|---|---|---|
| Small (fewer than 100 FTEs) | 95,232 | 4,375 | 205 | 4.7% |
| Medium (100 to 499 FTEs) | 123,122 | 589 | 242 | 41.1% |
| Large (500 or more FTEs) | 1,029,898 | 223 | 189 | 84.8% |
| Total | 1,248,252 | 5,187 | 636 | 12.3% |
In terms of which business size reported the most HV occurrences overall, Table 2.4 demonstrates that large employers reported more sexual and non-sexual HV occurrences than small and medium employers combined. This is not unexpected, considering that large employers reported approximately 1 million FTEs in 2023, a much larger amount than small and medium employers did.
| Business size | Total number of HV occurrences* | Number of sexual HV occurrences | Number of non-sexual HV occurrences |
|---|---|---|---|
| Small | 419 | 64 | 349 |
| Medium | 938 | 117 | 809 |
| Large | 5,753 | 847 | 4,900 |
| Total | 7,110 | 1,028 | 6,058 |
*The sum of sexual HV occurrences and non-sexual HV occurrences does not equal the total number of HV occurrences since the type of some occurrences was not reported in employer EAHVOR submissions.
Section 3: Harassment and violence occurrence resolution methods
In accordance with the Regulations, federally regulated employers are required to begin the resolution process for all HV occurrences within 45 days of an occurrence being reported. An employer is permitted to use 1 or more resolution methods in their efforts, with the goal of resolving the occurrence between the parties involved.
Incidents of harassment and violence can be resolved through 4 methods:
-
Negotiated resolution: Any form of communication between the principal party (who reports being the victim of an HV occurrence), the employer or designated recipient (employer-appointed representative for addressing occurrences) and, if contacted, the responding party (who is alleged to have been responsible for the occurrence) to discuss the occurrence and attempt to reach an agreement on possible actions to resolve it. Employers begin by working with the principal party to review whether the occurrence constitutes harassment or violence as defined in the Code.
For occurrences where the employer and principal party make a joint determination that the occurrence does not meet the definition, the occurrence is considered resolved. If an occurrence is also being investigated and the investigator has provided their report, a negotiated resolution is no longer an available option.
-
Conciliation: The principal party and the responding party may attempt to resolve an occurrence through conciliation, provided they both agree to participate and mutually agree on a person to facilitate the process.
A conciliator is a neutral third party who can be a professional mediator, a supervisor, an Elder, a religious figure, a colleague, etc. If an occurrence is also being investigated and the investigator has provided their report, then conciliation is no longer an available option.
-
Investigation: If the occurrence is not resolved through negotiated resolution or conciliation, then a principal party may request an investigation. An investigation must be carried out if the principal party requests it. A qualified investigator is selected as outlined in the provisions within the Regulations. Once selected, the investigator must provide a report that contains a general description of the occurrence, their conclusions including circumstances that contributed to the occurrence, and recommendations to mitigate the risk of a subsequent occurrence in the workplace.
The employer and the workplace committee or health and safety representative then jointly determine the recommendations that must be implemented. If the occurrence is resolved through a negotiated resolution or conciliation before the investigator has provided their report, then the investigation must be discontinued.
-
Workplace assessment: Employers are required to develop a workplace assessment. This involves joint collaboration between employers and the applicable partners (for example: policy committee or, if there is no policy committee, the workplace committee or the health and safety representative) to identify risks of harassment and violence, as well as to develop and implement preventative measures for each risk.
This assessment must be reviewed, and updated if required, by employers and their respective workplace committee or health and safety representative when an HV occurrence happens if the occurrence is not resolved through negotiated resolution, and the principal party informs the employer that they choose not to continue. Workplace assessments are also required to be reviewed if the responding party is not an employee or an employer (i.e., third party). Following the initial review, the HV occurrence is deemed to be resolved if the notice of occurrence does not contain the name of the principal party or otherwise allow their identity to be determined.
In their annual reports, employers are required to report the final method used to resolve an HV occurrence. When the total number of resolution methods reported does not equal the total number of resolved HV occurrences, it is possibly because an employer reported every method that they used to achieve a resolution instead of only the final method. Another possibility is that an employer could have reported the resolution method being used before an occurrence is fully resolved.
5,982 resolution methods were reported in 2023, approximately 1,400 more than were reported in 2022:
- Negotiated resolution: 2,355 of all resolutions reported by employers, up from 1,475 in 2022.
- Conciliation: 471 of all resolutions reported by employers, up from 255 in 2022.
- Investigation: 2,520 of all resolutions reported by employers, up from 2,287 in 2022.
- Workplace assessment: 636 of all resolutions reported by employers, up from 537 in 2022.
An increase in every resolution method was reported from the previous year, which aligns with the larger number of EAHVOR submissions and reported HV occurrences.
As Chart 3.1 illustrates, negotiated resolutions and investigations have consistently been the most common resolution methods since EAHVOR data was first reported in 2021. A noteworthy development in 2023 is that the share of reported resolution methods for negotiated resolutions increased by 7%, while the share of investigations decreased by roughly 8%.
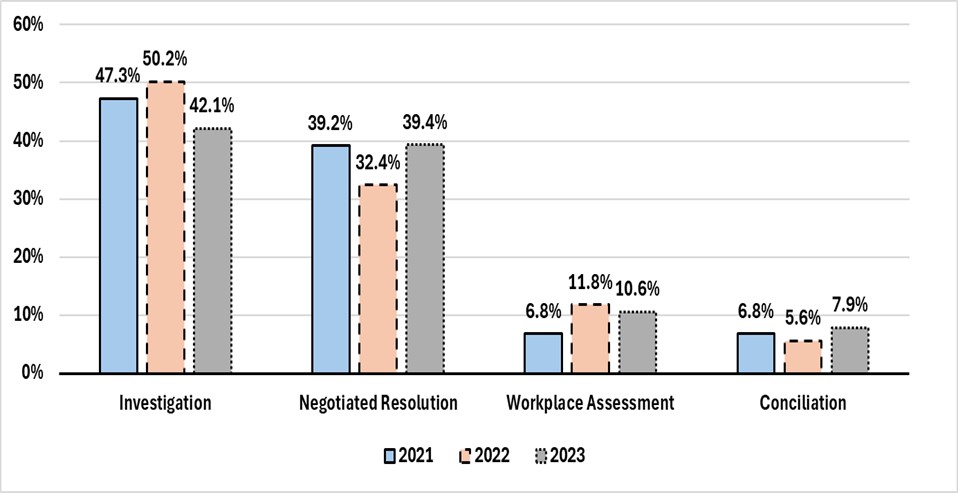
Chart 3.1 - Text description
| Year | Investigation | Negotiated Resolution | Workplace Assessment | Conciliation |
|---|---|---|---|---|
| 2021 | 47.3% | 39.2% | 6.8% | 6.8% |
| 2022 | 50.2% | 32.4% | 11.8% | 5.6% |
| 2023 | 42.1% | 39.4% | 10.6% | 7.9% |
Industry analysis
The most common HV occurrence resolution method varied among the industries that reported the most occurrences in 2023 (Air Transportation, Road Transportation, Banking, Postal Services and the Federal Public Service). As shown in Table 3.1, negotiated resolutions were the most common method in the Postal Services industry and the Federal Public Service. For the Air Transportation, Road Transportation and Banking industries, investigations were the method most often used to resolve an HV occurrence.
| Industry | Total number of resolutions | Investigation | Negotiated resolution | Workplace assessment | Conciliation |
|---|---|---|---|---|---|
| AIRT | 1,089 | 553 | 408 | 72 | 56 |
| BANK | 596 | 281 | 207 | 93 | 15 |
| BRID | 2 | 1 | 1 | 0 | 0 |
| BROAD | 86 | 54 | 26 | 2 | 4 |
| COMM | 182 | 81 | 92 | 7 | 2 |
| ENER | 65 | 39 | 18 | 2 | 6 |
| FEED | 41 | 22 | 4 | 4 | 11 |
| GRAIN | 34 | 26 | 5 | 2 | 1 |
| INDG | 431 | 169 | 86 | 95 | 81 |
| LONG | 65 | 52 | 10 | 0 | 3 |
| PIPE | 32 | 10 | 14 | 3 | 5 |
| POST | 617 | 28 | 469 | 0 | 120 |
| PUBS | 1,527 | 488 | 663 | 301 | 75 |
| RAIL | 151 | 98 | 34 | 8 | 11 |
| ROAD | 982 | 583 | 285 | 41 | 73 |
| WATER | 82 | 35 | 33 | 6 | 8 |
| Canada | 5,982 | 2,520 | 2,355 | 636 | 471 |
*Occurrences where the principal party could not be identified are not included.
Public vs private sector analysis
The most common resolution method varied between the public and private sectors in 2023. Chart 3.2 illustrates that negotiated resolutions were the most used method in the public sector. Although investigations were the most frequent approach in the private sector, the share of investigation resolutions in the private sector decreased by approximately 11% since 2022. Furthermore, workplace assessments were more than twice as common in the public sector compared to the private sector (used in 19.7% of resolutions in the public sector compared to 7.5% of resolutions in the private sector).
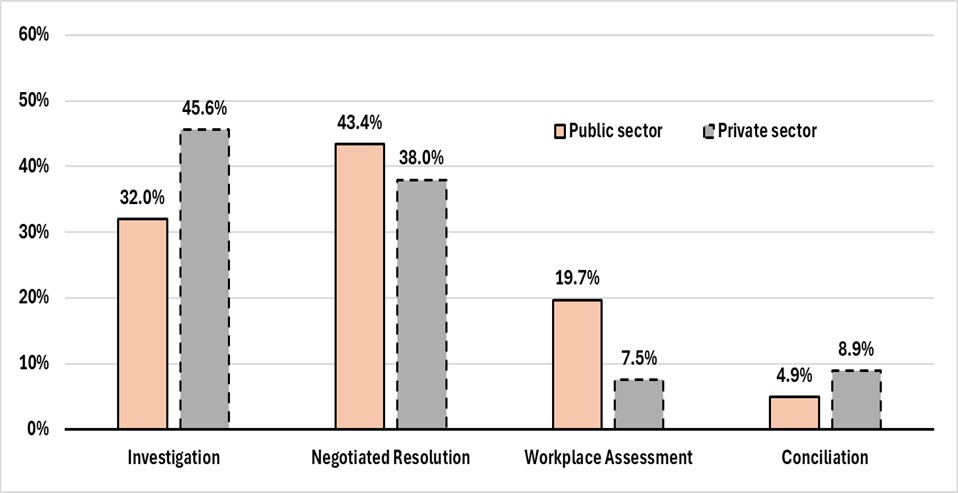
Chart 3.2 - Text description
| Sector | Investigation | Negotiated Resolution | Workplace Assessment | Conciliation |
|---|---|---|---|---|
| Public | 32.0% | 43.4% | 19.7% | 4.9% |
| Private | 45.6% | 38.0% | 7.5% | 8.9% |
Business size analysis
By examining the resolution method data by business size, the 4 methods vary in how often they are used. As Table 3.2 demonstrates, while investigation was the most common method for resolving HV occurrences in small and medium businesses, negotiated resolution was used the most by large businesses. This is a change from 2022, when all business sizes reported investigation as their most frequently used method. Conciliation is notably more common for small businesses, with an 18.8% share of all completed resolutions, than for medium and large businesses.
| Business size | Total number of resolutions | Investigation (%) | Negotiated resolution (%) | Workplace assessment (%) | Conciliation (%) |
|---|---|---|---|---|---|
| Small | 416 | 44.5% | 27.4% | 9.4% | 18.8% |
| Medium | 890 | 49.3% | 26.6% | 13.8% | 10.2% |
| Large | 4,673 | 40.6% | 42.9% | 10.1% | 6.5% |
| Total | 5,979 | 42.1% | 39.4% | 10.6% | 7.9% |
Section 4: Harassment and violence occurrence relationships
In addition to reporting resolution methods when submitting an EAHVOR, employers also identify the primary relationships between parties involved in an HV occurrence. Each relationship type involves a principal party (who reports being the victim of an HV occurrence) and a responding party (who is alleged to have been responsible for the occurrence).
There are 6 relationship types to describe the connection between the parties involved in an HV occurrence. A single occurrence can involve multiple relationships, as more than 1 individual may be responsible for the occurrence. The 6 relationship types on the EAHVOR include:
- Employee to Employee: The principal party and responding party are both employees.
- Employee to Supervisor, Manager, or Business Owner: The principal party is an employee, while the responding party is a supervisor, manager, business owner, or other individual in a supervisory role.
- Employee to Third Party, Client, Contractor, or Member of the Public: The principal party is an employee, while the responding party is someone outside of the organisation.
- Supervisor, Manager, or Business Owner to Employee: The principal party is a supervisor, manager, business owner, or other individual in a supervisory role, while the responding party is an employee.
- Employee to Other: The principal party is an employee, while the responding party identified does not fall into 1 of the other identified categories.
- Employee to a Domestic Partner: The principal party is an employee, while the responding party is a domestic partner.
Federally regulated employers reported these relationship types at varying levels in 2023:
- Employee to Employee: reported in 3,053 occurrences in 2023, up from 2,650 occurrences in 2022.
- Employee to Supervisor, Manager, or Business Owner: reported in 2,704 occurrences in 2023, up from 2,178 occurrences in 2022.
- Employee to Third Party, Client, Contractor, or Member of the Public: reported in 958 occurrences in 2023, up from 843 occurrences in 2022.
- Supervisor, Manager, or Business Owner to Employee: reported in 371 occurrences in 2023, down from 395 occurrences in 2022.
- Employee to Other: reported in 163 occurrences in 2023, up from 128 occurrences in 2022.
- Employee to a Domestic Partner: reported in 41 occurrences in 2023, up from 32 occurrences in 2022.
As Chart 4.1 illustrates, employee to employee and employee to supervisor, manager or business owner accounted for the majority of reported relationships in 2023. This has been the case since 2021.
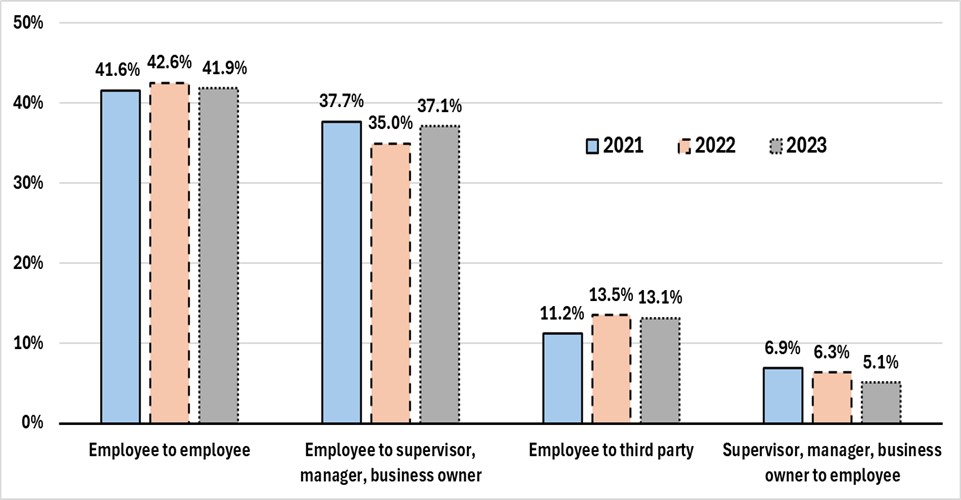
Chart 4.1 - Text description
| Year | Employee to employee | Employee to supervisor, manager, business owner | Employee to third party | Supervisor, manager, business owner to employee |
|---|---|---|---|---|
| 2021 | 41.6% | 37.7% | 11.2% | 6.9% |
| 2022 | 42.6% | 35.0% | 13.5% | 6.3% |
| 2023 | 41.9% | 37.1% | 13.1% | 5.1% |
*From 2021 to 2023, nearly 3% of reported HV occurrences involved the employee to other and employee to a domestic partner relationships. These types are not included in this chart. Resolved HV occurrences where a principal party could not be identified, and no relationship type was reported, were not included when calculating the share of each relationship type.
Industry analysis
Employee to employee, and employee to supervisor, manager, or business owner were the most frequent HV occurrence relationship types in the industries that reported the most occurrences in 2023. Table 4.1 establishes that employee to employee was the most common relationship type in the Air Transportation and Road Transportation industries. In contrast, employee to supervisor, manager, or business owner was the most common relationship type in the Federal Public Service and the Postal Services and Banking industries. It should be noted that the Banking industry reported nearly the same amount of both relationship types (238 occurrences with an employee as the responding party vs 240 occurrences with a supervisor, manager or business owner as the responding party).
| Industry | Total HV occurrence relationships | Employee to employee | Employee to supervisor, manager, or business owner | Employee to third party, client, contractor, or member of the public | Supervisor, manager, or business owner to employee | Employee to other | Employee to a domestic partner |
|---|---|---|---|---|---|---|---|
| AIRT | 1,097 | 699 | 304 | 57 | 24 | 11 | 2 |
| BANK | 577 | 238 | 240 | 62 | 28 | 6 | 3 |
| BRID | 5 | 2 | 3 | 0 | 0 | 0 | 0 |
| BROAD | 84 | 54 | 22 | 3 | 3 | 2 | 0 |
| COMM | 208 | 80 | 95 | 24 | 3 | 2 | 4 |
| ENER | 81 | 41 | 11 | 6 | 19 | 2 | 2 |
| FEED | 39 | 22 | 5 | 7 | 3 | 2 | 0 |
| GRAIN | 34 | 13 | 11 | 7 | 3 | 0 | 0 |
| INDG | 459 | 229 | 91 | 63 | 27 | 43 | 6 |
| LONG | 61 | 13 | 26 | 2 | 10 | 10 | 0 |
| PIPE | 36 | 11 | 17 | 1 | 4 | 3 | 0 |
| POST | 776 | 248 | 268 | 221 | 39 | 0 | 0 |
| PUBS | 2,274 | 667 | 1,161 | 275 | 109 | 43 | 19 |
| RAIL | 222 | 96 | 114 | 1 | 10 | 1 | 0 |
| ROAD | 1,237 | 606 | 290 | 216 | 83 | 38 | 4 |
| WATER | 100 | 34 | 46 | 13 | 6 | 0 | 1 |
| Canada | 7,290 | 3,053 | 2,704 | 958 | 371 | 163 | 41 |
*Occurrences where the principal party could not be identified are not included.
Employers in several industries require their employees to maintain relationships with individuals outside of their organisation, such as members of the public, outside clients, contractors and others. These individuals are identified on the EAVHOR as "third party, client, contractor, or member of the public". Among the 6 relationship types, a third-party relationship can be the most challenging to control since the responding party is external. It is therefore important to analyse this commonly reported relationship type separately.
In 2023, there were 958 occurrences reported that involved a third party as the responding party, an increase from 843 occurrences involving a third party in 2022. Although this relationship type has been reported more often since the EAHVOR was first submitted in 2021, this could be due to the greater number of submissions each year.
Chart 4.2 illustrates how many HV occurrences involving a third-party relationship were reported by each industry. Based on the 2023 EAHVOR submissions, nearly 3 quarters of all these occurrences happened in the Federal Public Service and the Postal Services and Road Transportation industries.
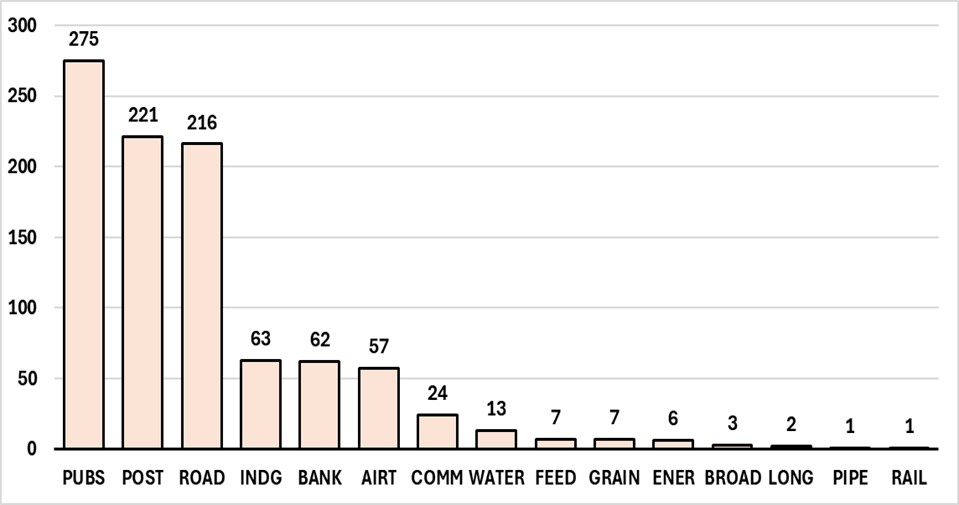
Chart 4.2 - Text description
| Industry | HV occurrences involving a third-party relationship |
|---|---|
| PUBS | 275 |
| POST | 221 |
| ROAD | 216 |
| INDG | 63 |
| BANK | 62 |
| AIRT | 57 |
| COMM | 24 |
| WATER | 13 |
| FEED | 7 |
| GRAIN | 7 |
| ENER | 6 |
| BROAD | 3 |
| LONG | 2 |
| PIPE | 1 |
| RAIL | 1 |
Out of all HV occurrence relationship types reported in the federal jurisdiction in 2023, 13.1% involved a third party, client, contractor, or member of the public as the responding party. As Table 4.2 shows, 5 industries reported a share of this relationship type in their HV occurrences that was larger than the federal jurisdiction's share. These industries include:
- Postal Services and Postal Contractors
- Grain Handling and Grain Elevators
- Feed, Flour and Seed
- Road Transportation
- First Nations, Band Councils, and Indigenous Self-Governments (certain activities)
| Industry | HV occurrences involving a third-party relationship | Total HV occurrence relationships | Share (%) of HV occurrence relationships that involved a third party |
|---|---|---|---|
| POST | 221 | 776 | 28.5% |
| GRAIN | 7 | 34 | 20.6% |
| FEED | 7 | 39 | 17.9% |
| ROAD | 216 | 1,237 | 17.5% |
| INDG | 63 | 459 | 13.7% |
| WATER | 13 | 100 | 13.0% |
| PUBS | 275 | 2,274 | 12.1% |
| COMM | 24 | 208 | 11.5% |
| BANK | 62 | 577 | 10.7% |
| ENER | 6 | 81 | 7.4% |
| AIRT | 57 | 1,097 | 5.2% |
| BROAD | 3 | 84 | 3.6% |
| LONG | 2 | 61 | 3.3% |
| PIPE | 1 | 36 | 2.8% |
| RAIL | 1 | 222 | 0.5% |
| BRID | 0 | 5 | 0.0% |
| Canada | 958 | 7,290 | 13.1% |
Public vs private sector analysis
When comparing the public sector and private sector, employee to employee and employee to supervisor, manager, or business owner are the most reported relationship types, but the size of their shares varies between the sectors. As shown in Chart 4.3, HV occurrences involving an employee as the responding party were more common in the private sector, while occurrences where the responding party was a supervisor, manager or business owner were more common in the public sector. Furthermore, occurrences with a third party as the responding party were slightly more common in the private sector. The share of occurrences where a supervisor, manager or business owner was the principal party and an employee was the responding party was nearly equal for both sectors.
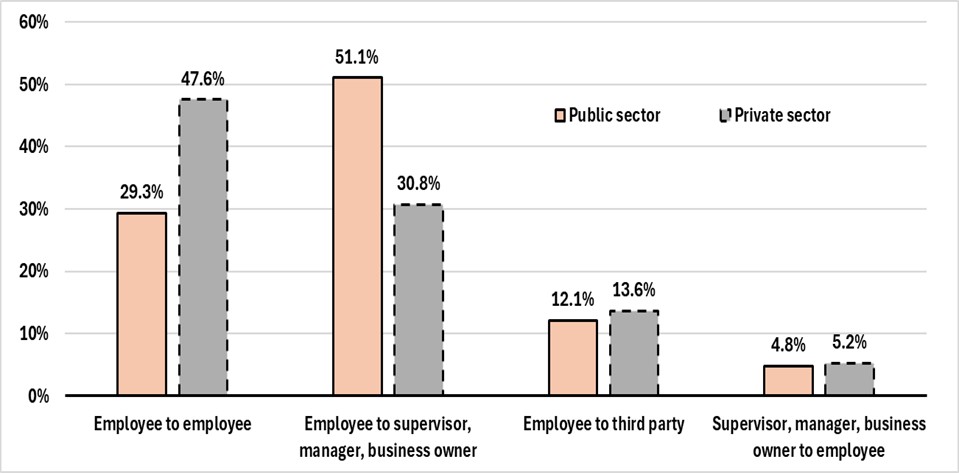
Chart 4.3 - Text description
| Sector | Employee to employee | Employee to supervisor, manager, business owner | Employee to third party | Supervisor, manager, business owner to employee |
|---|---|---|---|---|
| Public | 29.3% | 51.1% | 12.1% | 4.8% |
| Private | 47.6% | 30.8% | 13.6% | 5.2% |
*Nearly 3% of reported HV occurrences in the public sector and private sector involved the employee to other and employee to a domestic partner relationships. These types are not included in this chart.
Business size analysis
As Table 4.3 demonstrates, employees who were responsible for harassment or violence against another employee were the most common responding party for small and medium businesses and the second-most common for large businesses. Supervisors, managers, or business owners were the top responding party for large businesses, representing nearly 40% of all relationships reported. This relationship type was notably less common for small businesses, where its share was roughly 23%, and for medium businesses, where its share was slightly more than 26%.
| Business size | Total HV occurrence relationships | Employee (%) | Supervisor, manager, or business owner (%) | Third party, client, contractor, or member of the public (%) | Employee (to a supervisor, manager, or business owner) (%) | Other types* (%) |
|---|---|---|---|---|---|---|
| Small | 462 | 47.0% | 23.4% | 16.9% | 5.2% | 7.6% |
| Medium | 940 | 54.6% | 26.4% | 8.7% | 5.0% | 5.3% |
| Large | 5,885 | 39.4% | 39.9% | 13.5% | 5.1% | 2.0% |
| Total | 7,287 | 41.9% | 37.1% | 13.1% | 5.1% | 2.8% |
*Other types include identified relationships where the responding party was a domestic partner or someone who did not fall into 1 of the other identified categories and was labelled "other".
Section 5: Discrimination in harassment and violence occurrences
When employers report an HV occurrence, they are required to indicate if the occurrence is allegedly related to any of the 13 prohibited grounds of discrimination in the Canadian Human Rights Act. The grounds are used to identify discriminatory practices based on:
- Race
- National or ethnic origin
- Colour
- Religion
- Age
- Sex
- Conviction for an offence for which a pardon has been granted or a record suspension has been ordered
- Sexual orientation
- Gender identity or expression
- Marital status
- Family status
- Disability
- Genetic characteristics
Federally regulated employers identified 1,416 instances of discrimination in the HV occurrences that they reported in 2023, an increase from 1,273 instances reported in 2022. Each instance was related to 1 of the prohibited grounds of discrimination under the Canadian Human Rights Act. It is important to note that 1 occurrence can involve multiple grounds of discrimination. Furthermore, it is possible for grounds of discrimination in an HV occurrence to not be reported or misidentified by the employer.
The most reported grounds of discrimination in 2023 were:
- Sex: reported in 325 occurrences, up from 307 in 2022.
- Race: reported in 307 occurrences, up from 287 in 2022.
- Disability: reported in 198 occurrences, up from 174 in 2022.
- National or ethnic origin: reported in 159 occurrences, up from 148 in 2022.
These 4 grounds of discrimination made up nearly 70% of all the instances of discrimination reported in HV occurrences in 2023. They were also the top 4 reported grounds in 2021 and 2022.
As Chart 5.1 illustrates, the shares of 3 of the top 4 grounds of discrimination have remained mostly unchanged from 2021 to 2023. The size of the shares of race, disability and national or ethnic origin have varied by less than 2% over the course of all 3 reporting years. In contrast, the share of discrimination based on sex fell by 6.5% from 2021 to 2022 and decreased an additional 1.1% from 2022 to 2023. One potential explanation is that although the number of HV occurrences involving this ground of discrimination has consistently increased, other forms of discrimination have been reported more frequently in 2022 and 2023 compared to 2021. This could have reduced the share of discrimination based on sex as a result.
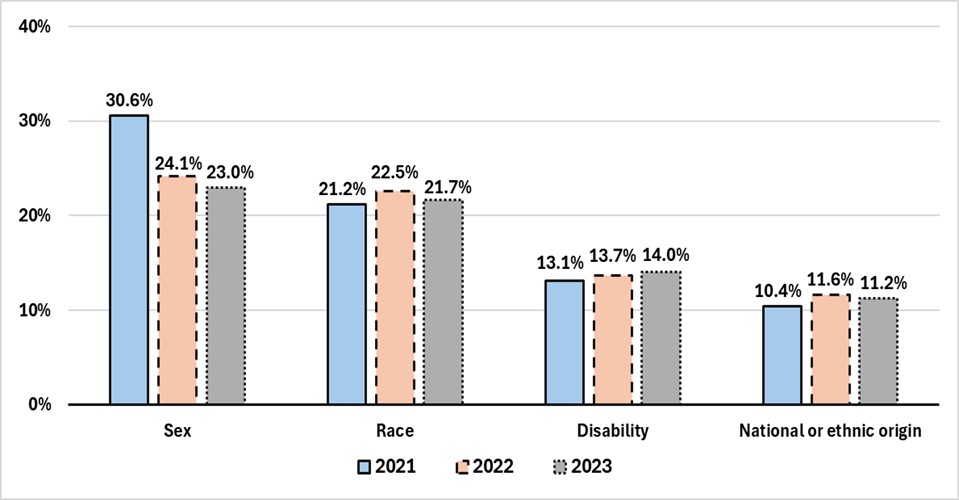
Chart 5.1 - Text description
| Year | Sex | Race | Disability | National or ethnic origin |
|---|---|---|---|---|
| 2021 | 30.6% | 21.2% | 13.1% | 10.4% |
| 2022 | 24.1% | 22.5% | 13.7% | 11.6% |
| 2023 | 23.0% | 21.7% | 14.0% | 11.2% |
Industry analysis
The 5 industries with the most HV occurrences in 2023 reported varying numbers of the top 4 grounds of discrimination. Sex was the most common ground in Banking and the Federal Public Service, while Race was the most common ground in Air Transportation, Postal Services and Road Transportation. The second-most frequent ground of discrimination also varied across the 5 industries. Disability was the second-most frequent ground of discrimination in Postal Services and the Federal Public Service, while national or ethnic origin was the second-most frequent ground in Air Transportation and Banking. Road Transportation reported a nearly equal number of occurrences where discrimination because of sex and race occurred (62 vs 65).
| Industry | Total grounds of discrimination | Sex | Race | Disability | National or ethnic origin | All other grounds* |
|---|---|---|---|---|---|---|
| AIRT | 214 | 27 | 62 | 16 | 36 | 73 |
| BANK | 105 | 44 | 16 | 7 | 21 | 17 |
| BRID | 0 | 0 | 0 | 0 | 0 | 0 |
| BROAD | 26 | 4 | 3 | 6 | 3 | 10 |
| COMM | 31 | 8 | 4 | 3 | 8 | 8 |
| ENER | 17 | 7 | 4 | 2 | 0 | 4 |
| FEED | 6 | 1 | 2 | 0 | 1 | 2 |
| GRAIN | 7 | 1 | 5 | 0 | 1 | 0 |
| INDG | 43 | 5 | 17 | 7 | 2 | 12 |
| LONG | 8 | 2 | 1 | 2 | 1 | 2 |
| PIPE | 8 | 4 | 1 | 0 | 1 | 2 |
| POST | 135 | 18 | 31 | 23 | 15 | 48 |
| PUBS | 523 | 131 | 85 | 106 | 48 | 153 |
| RAIL | 35 | 7 | 9 | 6 | 3 | 10 |
| ROAD | 247 | 62 | 65 | 20 | 19 | 81 |
| WATER | 11 | 4 | 2 | 0 | 0 | 5 |
| Canada | 1,416 | 325 | 307 | 198 | 159 | 427 |
*All other grounds include the remaining prohibited grounds of discrimination outside of the top 4, as identified by the Canadian Human Rights Act: 1) Age, 2) Colour, 3) Religion, 4) Sexual Orientation, 5) Family Status, 6) Gender Identity or Expression, 7) Genetic Characteristics, 8) Marital Status, 9) Conviction, Pardon Granted, or Record Suspended
As Chart 5.2 shows, the number of reported grounds of discrimination has grown in 2023 compared to 2021 in the Federal Public Service and the Road Transportation, Air Transportation and Postal Services industries. This increase is likely due to the growing number of submissions that have been received since the requirement to report HV occurrences became mandatory in 2021. In contrast, the Banking industry reported 112 instances of discrimination in 2021 but 105 instances in 2023. It should also be noted that although the Federal Public Service reported more discrimination in 2023 than in 2021, its reported instances of discrimination decreased from 551 in 2022 to 523 in 2023.
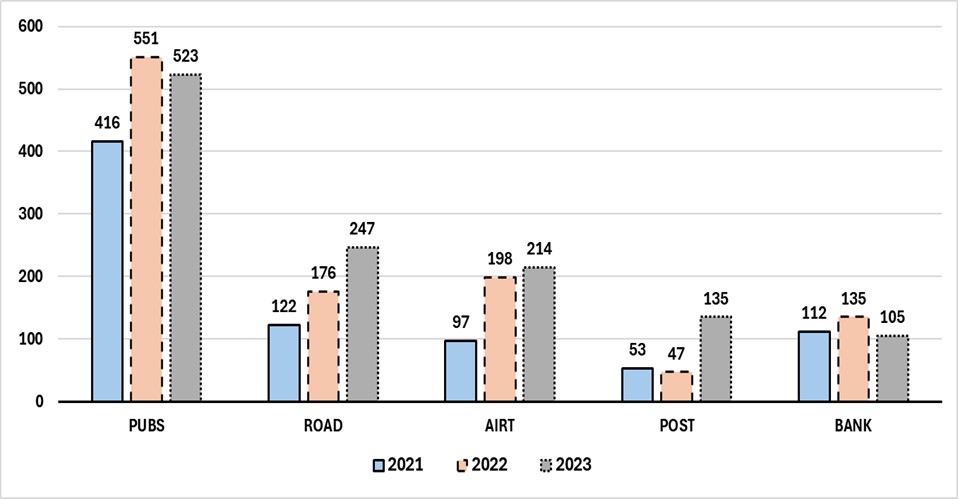
Chart 5.2 - Text description
| Industry | 2021 | 2022 | 2023 |
|---|---|---|---|
| PUBS | 416 | 551 | 523 |
| ROAD | 122 | 176 | 247 |
| AIRT | 97 | 198 | 214 |
| POST | 53 | 47 | 135 |
| BANK | 112 | 135 | 105 |
Public vs private sector analysis
The 4 most common grounds of discrimination in HV occurrences were reported in varying amounts by the public sector and private sector. As Chart 5.3 demonstrates, while sex had the largest share in the public sector, race had the largest share in the private sector. Another notable fact is that the public sector's share of instances of discrimination because of disability was nearly double compared to the private sector's share. There is also a prominent difference in the share of racial discrimination between the sectors. The private sector's share of this form of discrimination was nearly 9% higher than the public sector's share.
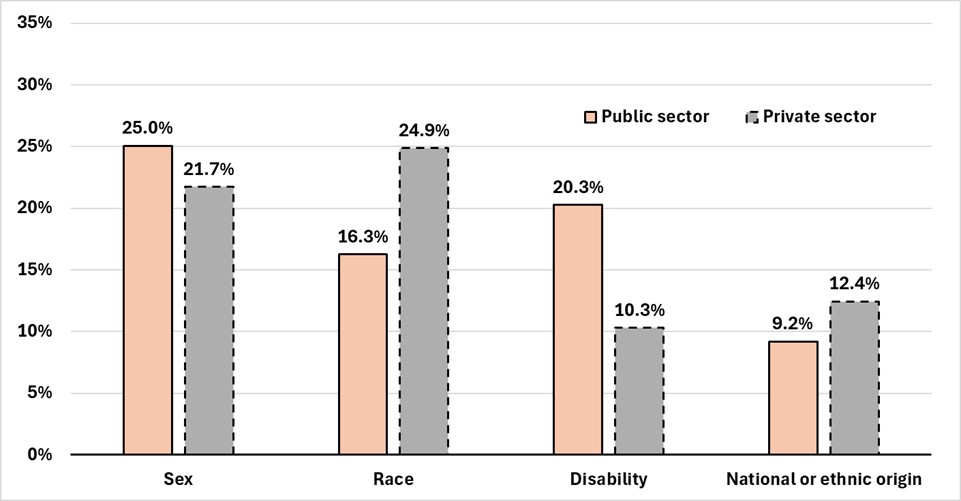
Chart 5.3 - Text description
| Sector | Sex | Race | Disability | National or Ethnic Origin |
|---|---|---|---|---|
| Public | 25.0% | 16.3% | 20.3% | 9.2% |
| Private | 21.7% | 24.9% | 10.3% | 12.4% |
Business size analysis
Large businesses reported significantly more grounds of discrimination in HV occurrences compared to small and medium businesses. This is likely due to large organisations reporting more HV occurrences compared to smaller businesses. Of the top 4 grounds of discrimination reported in 2023, race had the largest share for small and medium employers, while sex had the largest share for large employers. Another observation is that although small businesses reported the smallest share of discrimination based on national or ethnic origin (roughly 5%) out of the 3 business sizes, they reported the largest share of discrimination based on race (31%).
| Business size | Total grounds of discrimination | Sex (%) | Race (%) | Disability (%) | National or ethnic origin (%) |
|---|---|---|---|---|---|
| Small | 87 | 25.3% | 31.0% | 10.3% | 5.7% |
| Medium | 128 | 21.9% | 24.2% | 13.3% | 13.3% |
| Large | 1,201 | 22.9% | 20.7% | 14.3% | 11.4% |
| Total | 1,416 | 23.0% | 21.7% | 14.0% | 11.2% |
Section 6: Workplace Harassment and Violence Prevention Fund Initiatives
The Workplace Harassment and Violence Prevention Fund (WHVPF) aims to ensure physical and psychological health and safety in federally regulated workplaces by co-developing industry-specific labour management tools with employer and employee groups. These tools are used to help guide cultural change and provide guidance to workplaces regarding the harassment and violence prevention regime. The funded initiatives use approaches that include behavioural changes, education and guidance, and mandatory training. They must also meet a list of eligibility criteria.
The call-out for the first round of funding occurred in November 2018 and supported 7 projects whose objectives included developing tools, resources, and training materials in workplaces within several key industries. These included the First Nations band councils and Indigenous self-governments, Water Transportation, Road Transportation, and Banking industries. The organisations that received first-round funding include:
- British Columbia Maritime Employers Association
- Nokiiwin Tribal Council
- Trucking HR Canada
- UNI Financial Cooperation
- Centre for Research & Education on Violence Against Women & Children at Western University – this organisation is receiving funding for 2 projects
- Canadian Women's Foundation
For further information on the first-round projects, please see: Backgrounder: Workplace Harassment and Violence Prevention Fund.
The call-out for the second round of funding occurred in April 2022 and supported an additional 7 projects. These projects allowed the fund to be used to invest in more regions and organisations across Canada. The organisations that received second-round funding include:
- Saint Mary's University
- University of Prince Edward Island
- CommeHome Social Services
- Centre for Research & Education on Violence Against Women & Children at Western University
- Trucking HR Canada
- Tk'emlups te Secwepemc
- Berens River First Nation
For further information on the second-round projects, please see: Projects funded through the Workplace Harassment and Violence Prevention Fund.
Section 7: Moving forward
The 2023 annual report's findings provide insight into the challenging nature of harassment and violence in the Canadian federal jurisdiction. Although the 2023 EAHVOR data shows that nearly 900 more HV occurrences were reported than in 2022, this could be due to a combination of more than 600 additional reports being submitted in 2023, and employees being more aware of their ability to report HV occurrences. Given the personal nature of HV occurrences, there is likely a non-response bias in the data which is a common statistical challenge when collecting information on topics with a sensitive nature. While there is an upward trend in HV occurrences, it cannot be confirmed with confidence that occurrences are becoming more frequent.
The significant increase in the number of reports submitted in 2023 compared to 2022 highlights the importance of continued outreach efforts to further increase the number of submissions and decrease the number of HV occurrences for the 2024 reporting year.
The fact that the Road Transportation industry reported the largest number of sexual HV occurrences while only reporting the third-largest number of non-sexual HV occurrences is also noteworthy. Harassment and violence prevention (HVP) measures that are tailored toward this industry may help address this issue.
Regarding the relationships involved in HV occurrences, it should be noted that employee to employee and employee to supervisor, manager, or business owner have been the most common HV occurrence relationship types since annual reporting on HV occurrences became mandatory in 2021. Because these relationship types have been the most frequently reported for 3 consecutive years, it may be beneficial for federally regulated employers to prioritise vigilance of harassment or violence in these forms. At the same time, they should also remain vigilant of harassment or violence belonging to the other relationship types.
The harassment and violence provisions are reviewed every 5 years in accordance with Part II (Occupational Health and Safety) of the Code. The first legislative review is planned to begin by January 1, 2026. Following the review, a report that communicates the results will be accessible to the public.
This review will be a significant milestone for the Canadian federal jurisdiction's HVP regime. The EAHVOR data reported by federally regulated employers will be a useful tool to help guide the analysis and potential adjustments.
Annex: List of terms
The following definitions are used in this publication.
- Applicable partner
- A policy committee, or if no policy committee exists, a workplace committee or the health and safety representative.
- Employee
- Any person employed by an employer.
- Employer
- Any person who employs 1 or more employees and includes an employers' organisation and any person who acts on behalf of an employer.
- Employment
- "Employment" is defined as:
- all work or activities performed in carrying out assignments or requests made by the employer. It includes related activities not specifically covered by an assignment or request
- any voluntary work or activities undertaken while on duty for the benefit of the employer, or
- any activities undertaken while on duty with the consent or approval of the employer
- Federal Jurisdiction
- Federal jurisdiction covers:
- any work, undertaking or business that is within the legislative authority of Parliament, and
- any work deemed to be for the common good of 2 or more provinces and outside the exclusive authority of provincial legislatures
- Full-time Equivalent (FTE)
- Refers to the employment of 1 person full time. It may also refer to more than 1 person part time whose total working time is the equivalent of 1 person working full time. For example:
- 100 people employed full time equals 100 FTEs
- 10 people employed half time equals 5 FTEs
- all 110 people combined represent 105 FTEs
- FTE data contained in this report comes from Employer's Annual Hazardous Occurrence Report (EAHOR) submissions from federally regulated employers.
- Harassment and violence
- Under Part II of the Canada Labour Code (the Code), harassment and violence means "any action, conduct or comment, including of a sexual nature, that can reasonably be expected to cause offence, humiliation or other physical or psychological injury or illness to an employee, including any prescribed action, conduct or comment."
- This includes all types of harassment and violence, including sexual harassment, sexual violence and domestic violence.
- Occurrence
- An occurrence of harassment and violence in the workplace.
- Principal party
- An employee or employer who is the object of an occurrence.
- Resolution process
- The methods that an employer can use to resolve an occurrence. This includes:
- negotiated resolution
- conciliation
- investigation
- workplace assessment
- Responding party
- The person who is alleged to have been responsible for an occurrence.
- Workplace
- Any place where an employee is engaged in work for the employee's employer as per 122(1) of the Code.