
Nutrients in the St. Lawrence River
Access PDF (1.21 MB)
The St. Lawrence River links the Great Lakes with the Atlantic Ocean and is among the world's most important commercial waterways. It is a complex ecosystem that includes freshwater lakes and river reaches, a long estuary, and a salt-water gulf. Its many different habitats are home to a diverse range of plants, fish and other animals.
Phosphorus and nitrogen are essential plant nutrients. However, when their levels are too high or too low, they can have harmful effects on the food web of a river. Human activity, such as the use of chemical fertilizers, can increase the concentration of these nutrients to unhealthy levels. This indicator presents the status of each station as the percentage of samples above the nutrient guideline. It also provides the concentration of phosphorus and nitrogen, as well as any significant trends present in the concentrations over time where data were available.
Status of phosphorus and nitrogen
Key results
- For the 2021 to 2023 periodFootnote 1
- Phosphorus and nitrogen concentrations were above the guidelines at most monitoring stations
- Nitrogen status was rated Poor at 6 stations, Fair at 4 stations, and Good at 3 stations
- Phosphorus status was rated Poor at 5 stations, Fair at 3 stations, and Good at 5 stations
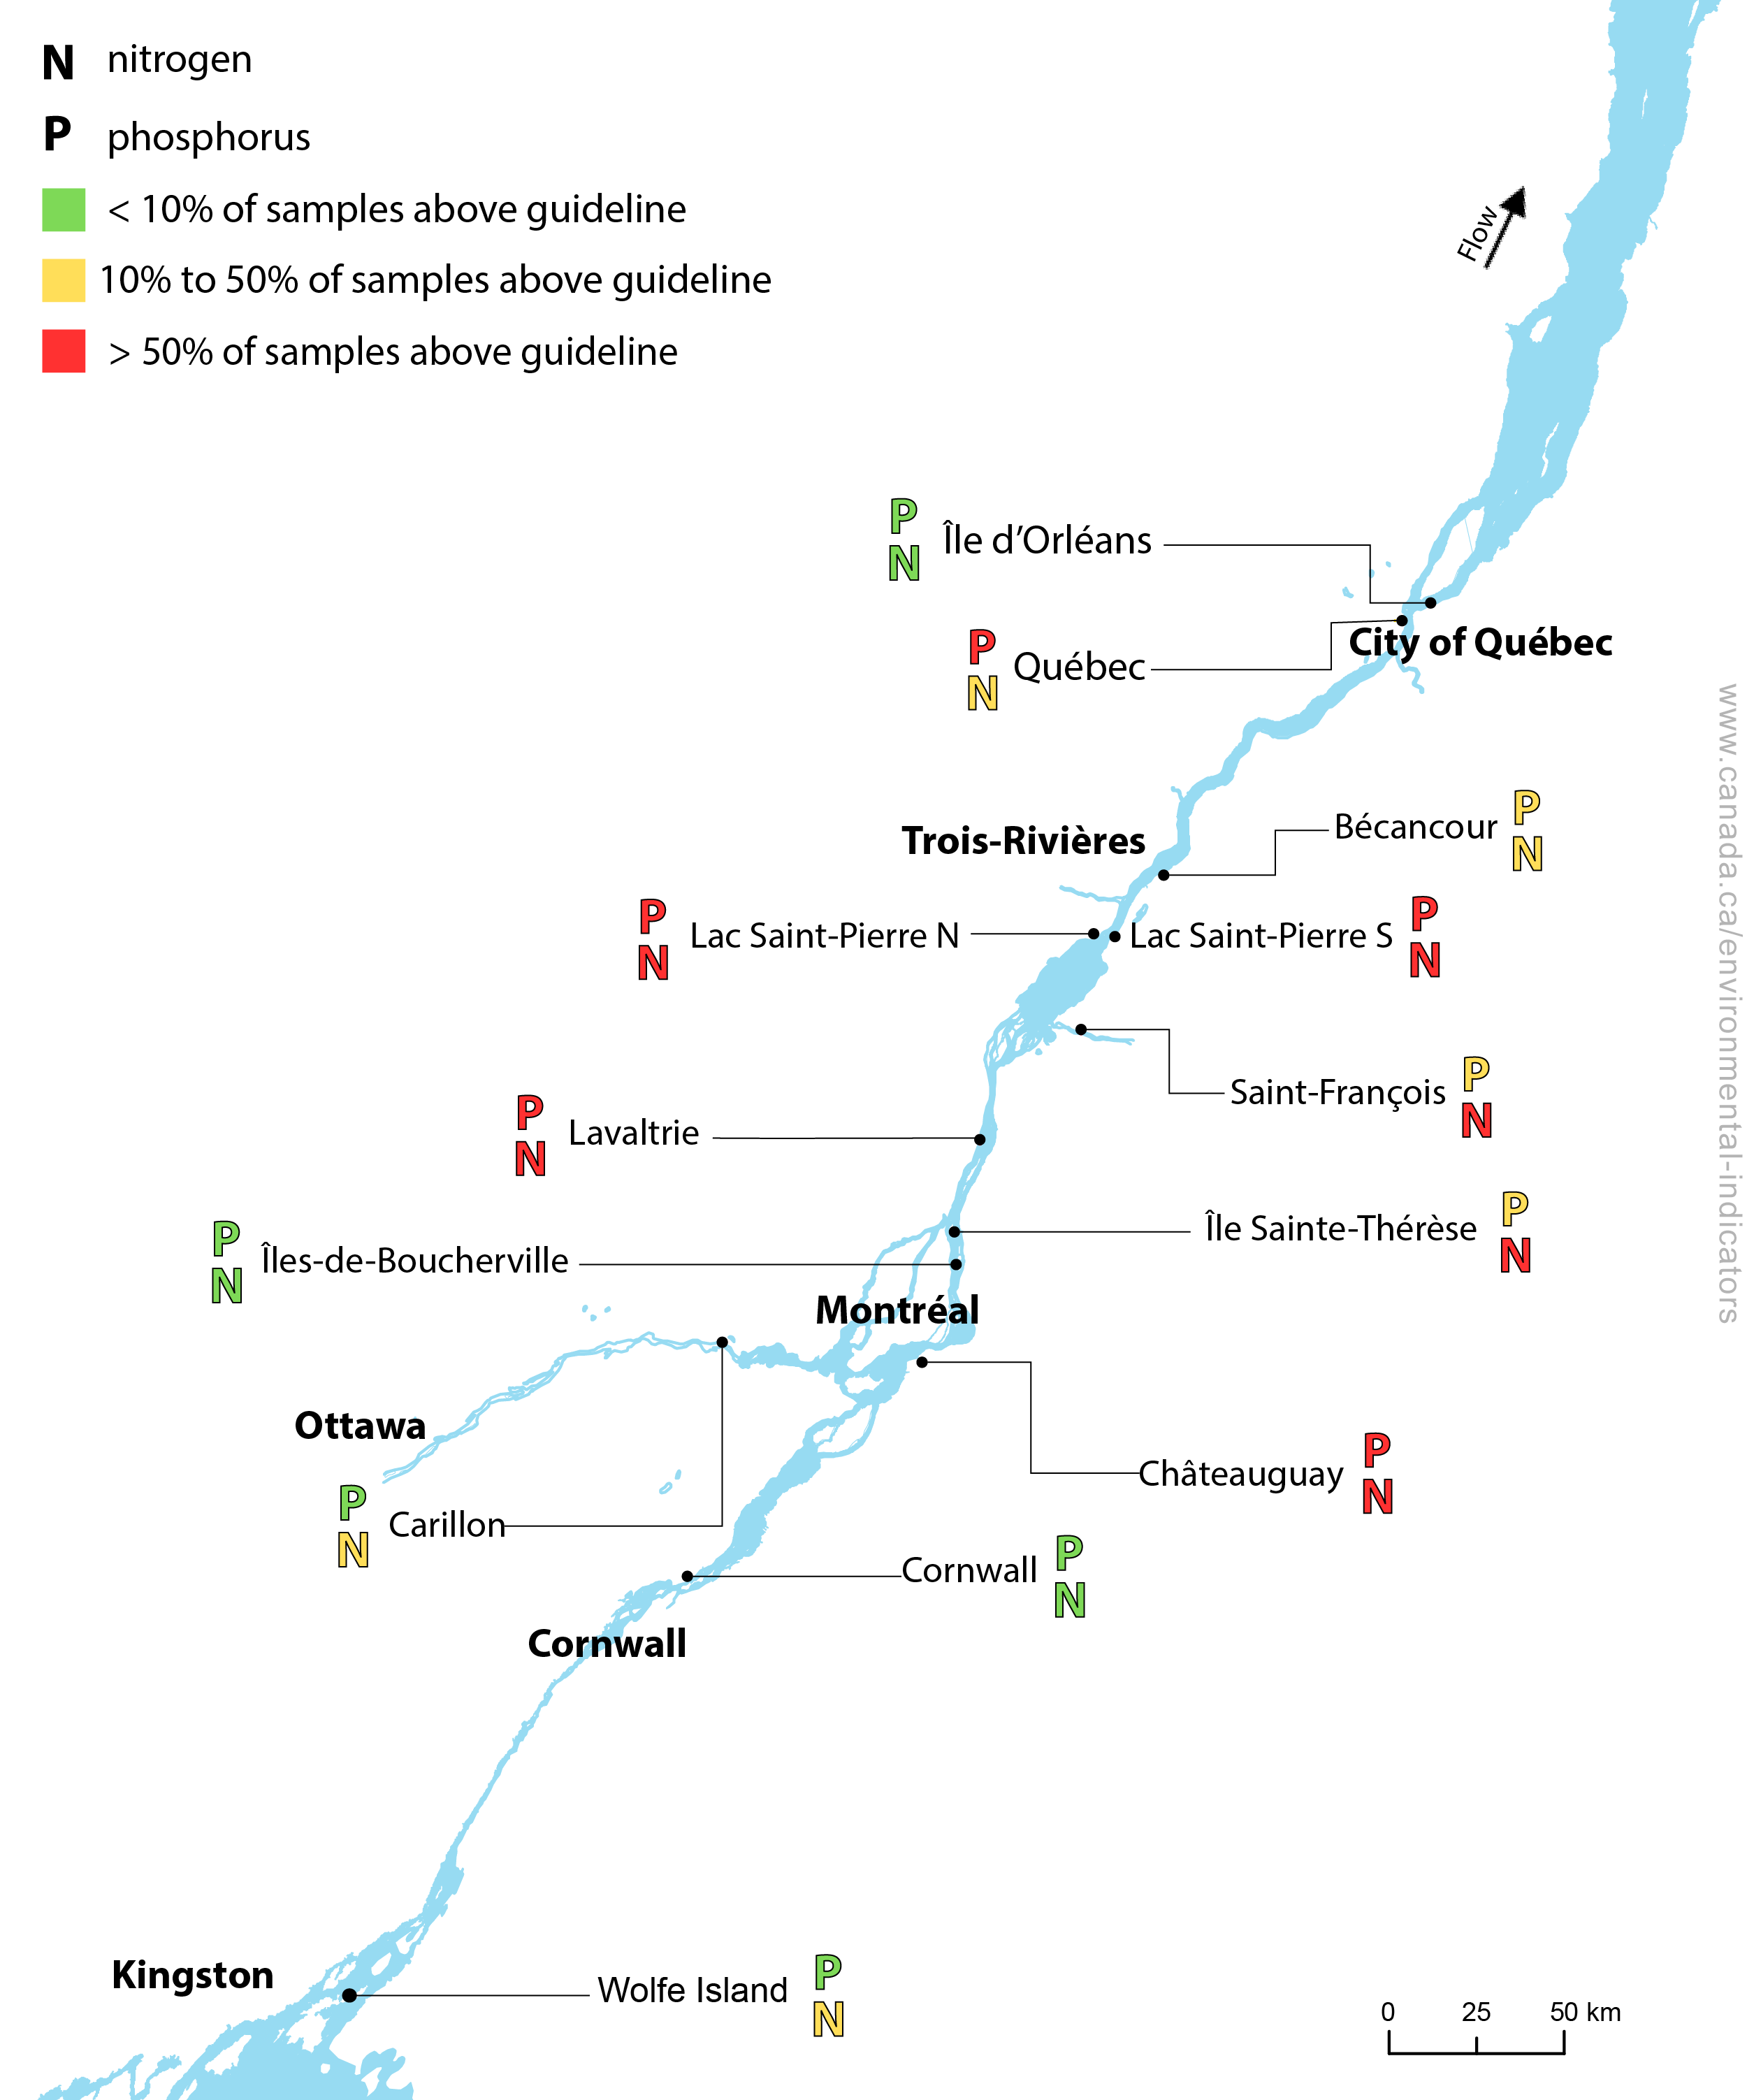
Status of total phosphorus and total nitrogen concentration exceedances for the 2021 to 2023 period in the St. Lawrence River, Canada
Data table for the long description
| Monitoring station | 2021 to 2023 total phosphorus guideline exceedance (percentage) |
Total phosphorus status | 2021 to 2023 total nitrogen guideline exceedance (percentage) |
Total nitrogen status |
|---|---|---|---|---|
| Wolfe Island | 0 | Good | 17 | Fair |
| Cornwall | 0 | Good | 9 | Good |
| Châteaugay | 92 | Poor | 100 | Poor |
| Carillon | 8 | Good | 33 | Fair |
| Îles-de-Boucherville | 0 | Good | 0 | Good |
| Île Sainte-Thérèse | 50 | Fair | 100 | Poor |
| Lavaltrie | 69 | Poor | 69 | Poor |
| Saint-François | 27 | Fair | 100 | Poor |
| Lac Saint-Pierre North | 100 | Poor | 83 | Poor |
| Lac Saint-Pierre South | 88 | Poor | 88 | Poor |
| BécancourSouth | 33 | Fair | 50 | Fair |
| Québec | 54 | Poor | 20 | Fair |
| Île d'Orléans | 0 | Good | 0 | Good |
Download data file (Excel/CSV; 2.75 kB)
How this indicator was calculated
Note: For the purposes of this indicator, the phosphorus guideline is 0.03 mg P/L and the nitrogen guideline is 0.65 mg N/L. For more details about the water quality guidelines and categories, please refer to the Data sources and methods section.
Source: Environment and Climate Change Canada (2023)
Phosphorus and nitrogen concentration levels in the St. Lawrence River are affected by the river’s flow and a variety of human activities along the river. Just downstream of Montreal, at Lavaltrie, phosphorus and nitrogen concentration levels exceeded the water quality guidelines over the 2021 to 2023 period because of the release of municipal wastewater into the river. Farther downstream, tributary rivers draining agricultural regions transport higher concentrations of phosphorus and nitrogen because of the chemical fertilizers and manure used to grow crops. These high nutrient levels along the St. Lawrence River can contribute to the increase in the incidence of harmful algal blooms.Footnote 2 Upstream of the City of Québec, water from tributary rivers that drain the north shore, such as the Carillon station, have lower phosphorus and nitrogen levels because they run through an area with more forest cover than that found on the south shore of the river.
For this indicator, nutrient status at a monitoring station is considered Good when fewer than 10% of samples exceed the water quality guidelines for total phosphorus or total nitrogen. The 10% cut-off limit allows for 1 sample per year to exceed the guideline. In rivers, total phosphorus and total nitrogen concentrations will often exceed the guidelines when water levels are high, a situation that is mainly observed when the snow melts in the spring. When 10% to 50% of the samples exceed the guidelines, the nutrient status is considered Fair. In contrast, nutrient status is Poor if more than 50% of the samples exceed the water quality guidelines.
Annual status of phosphorus and nitrogen
Five (5) stations have been collecting water quality data since 2010: Wolfe Island, Carillon, Lavaltrie, Saint-François and Québec.
Key results
- Over the 2010 to 2023 period, the annual phosphorus status most often observed was:
- Good at Wolfe Island station
- Fair at Saint-François and Carillon stations
- Poor at Lavaltrie and Québec stations
- Over the same period, the annual nitrogen status most often observed was:
- Fair at Carillon and Wolfe Island
- Fair or Poor at Québec station
- Poor for all years at Lavaltrie and Saint-François stations
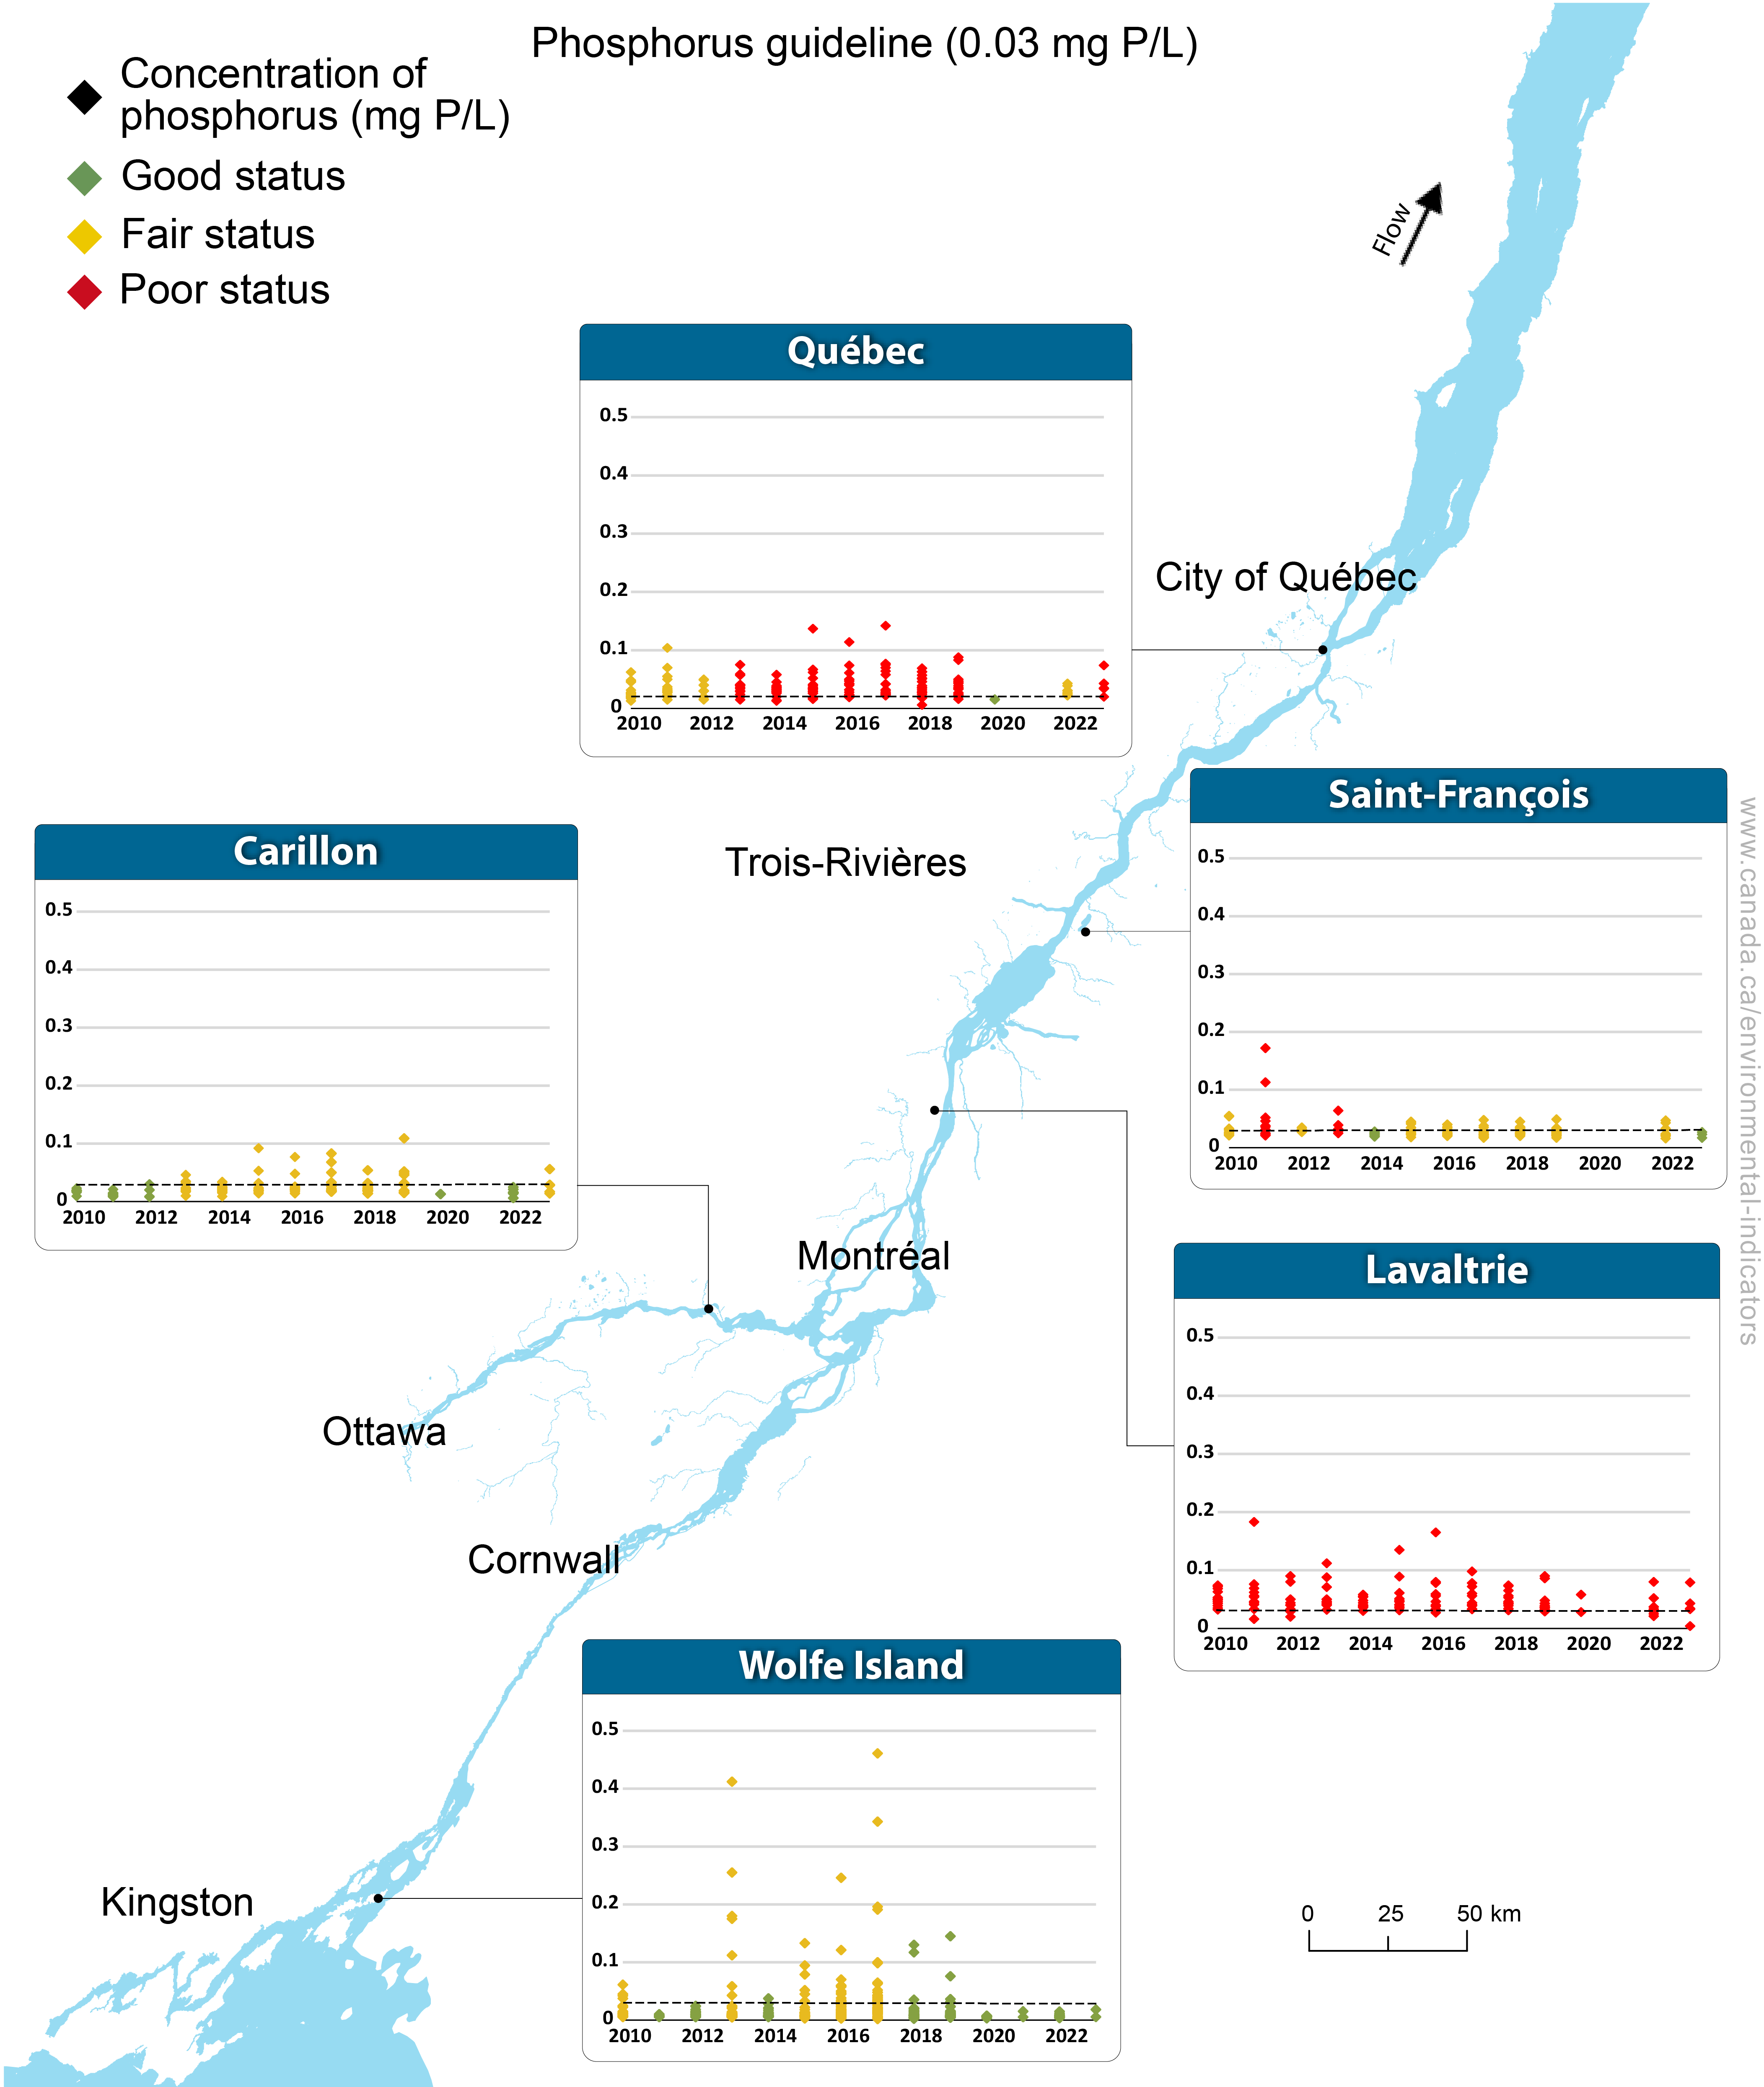
Annual phosphorus concentrations of samples for 5 water quality monitoring stations along the St. Lawrence River, 2010 to 2023
Data table for the long description
| Monitoring station | Year | Percent of samples above phosphorus guideline |
Number of samples |
|---|---|---|---|
| Wolfe Island | 2010 | 15 | 26 |
| Wolfe Island | 2011 | 0 | 13 |
| Wolfe Island | 2012 | 0 | 30 |
| Wolfe Island | 2013 | 11 | 65 |
| Wolfe Island | 2014 | 7 | 28 |
| Wolfe Island | 2015 | 18 | 33 |
| Wolfe Island | 2016 | 24 | 63 |
| Wolfe Island | 2017 | 42 | 55 |
| Wolfe Island | 2018 | 6 | 48 |
| Wolfe Island | 2019 | 8 | 52 |
| Wolfe Island | 2020 | 0 | 11 |
| Wolfe Island | 2021 | 0 | 2 |
| Wolfe Island | 2022 | 0 | 39 |
| Wolfe Island | 2023 | 0 | 2 |
| Carillon | 2010 | 0 | 11 |
| Carillon | 2011 | 0 | 14 |
| Carillon | 2012 | 0 | 14 |
| Carillon | 2013 | 29 | 14 |
| Carillon | 2014 | 14 | 14 |
| Carillon | 2015 | 21 | 14 |
| Carillon | 2016 | 14 | 14 |
| Carillon | 2017 | 36 | 14 |
| Carillon | 2018 | 14 | 14 |
| Carillon | 2019 | 36 | 14 |
| Carillon | 2020 | 0 | 2 |
| Carillon | 2021 | n/a | 0 |
| Carillon | 2022 | 0 | 8 |
| Carillon | 2023 | 20 | 5 |
| Lavaltrie | 2010 | 100 | 12 |
| Lavaltrie | 2011 | 92 | 12 |
| Lavaltrie | 2012 | 75 | 12 |
| Lavaltrie | 2013 | 100 | 13 |
| Lavaltrie | 2014 | 92 | 12 |
| Lavaltrie | 2015 | 100 | 12 |
| Lavaltrie | 2016 | 91 | 12 |
| Lavaltrie | 2017 | 100 | 12 |
| Lavaltrie | 2018 | 100 | 12 |
| Lavaltrie | 2019 | 92 | 12 |
| Lavaltrie | 2020 | 50 | 2 |
| Lavaltrie | 2021 | n/a | 0 |
| Lavaltrie | 2022 | 63 | 8 |
| Lavaltrie | 2023 | 80 | 5 |
| Saint-François | 2010 | 33 | 15 |
| Saint-François | 2011 | 57 | 14 |
| Saint-François | 2012 | 43 | 7 |
| Saint-François | 2013 | 56 | 9 |
| Saint-François | 2014 | 0 | 9 |
| Saint-François | 2015 | 42 | 12 |
| Saint-François | 2016 | 38 | 16 |
| Saint-François | 2017 | 18 | 17 |
| Saint-François | 2018 | 41 | 17 |
| Saint-François | 2019 | 24 | 17 |
| Saint-François | 2020 | n/a | 0 |
| Saint-François | 2021 | n/a | 0 |
| Saint-François | 2022 | 38 | 8 |
| Saint-François | 2023 | 0 | 3 |
| Québec | 2010 | 29 | 17 |
| Québec | 2011 | 47 | 17 |
| Québec | 2012 | 29 | 17 |
| Québec | 2013 | 60 | 15 |
| Québec | 2014 | 59 | 17 |
| Québec | 2015 | 65 | 17 |
| Québec | 2016 | 71 | 17 |
| Québec | 2017 | 59 | 17 |
| Québec | 2018 | 65 | 17 |
| Québec | 2019 | 59 | 17 |
| Québec | 2020 | 0 | 2 |
| Québec | 2021 | n/a | 0 |
| Québec | 2022 | 38 | 8 |
| Québec | 2023 | 80 | 5 |
Download data file (Excel/CSV; 4.56 kB)
Note: n/a = not applicable. For the purposes of this indicator, the phosphorus guideline is 0.03 mg P/L.
How this indicator was calculated
Note: This figure summarizes annual phosphorus concentrations recorded at a monitoring station per year from 2010 to 2023. Each point is a sample phosphorous concentration (mg P/L) recorded for a given year. For more details about the water quality guidelines and categories, please refer to the Data sources and methods section. Samples from the mouth of the Saint-François River from 2010-2020 were collected from May to September only.
Source: Environment and Climate Change Canada (2023)
Of the 5 long-term monitoring stations, only Wolfe Island has had a consistently Good phosphorus status since 2018, meaning that fewer than 10% of samples had phosphorus concentrations exceeding the water quality guideline annually. The Carillon and Saint-François stations had phosphorus status considered Fair (10% to 50% of samples exceeded the guideline each year) in most years, and the Lavaltrie and Québec stations had phosphorus status considered Poor (more than 50% of samples exceeded the guideline each year) in most years.
A trend analysis based on the annual average phosphorus concentrations between 2010 and 2023 showed a slightly decreasing trend (-0.001 mg P/L per year) at the Lavaltrie station and a stable trend (neither increasing nor decreasing) at the Saint-François station. There were no statistically significant trends for any other station.
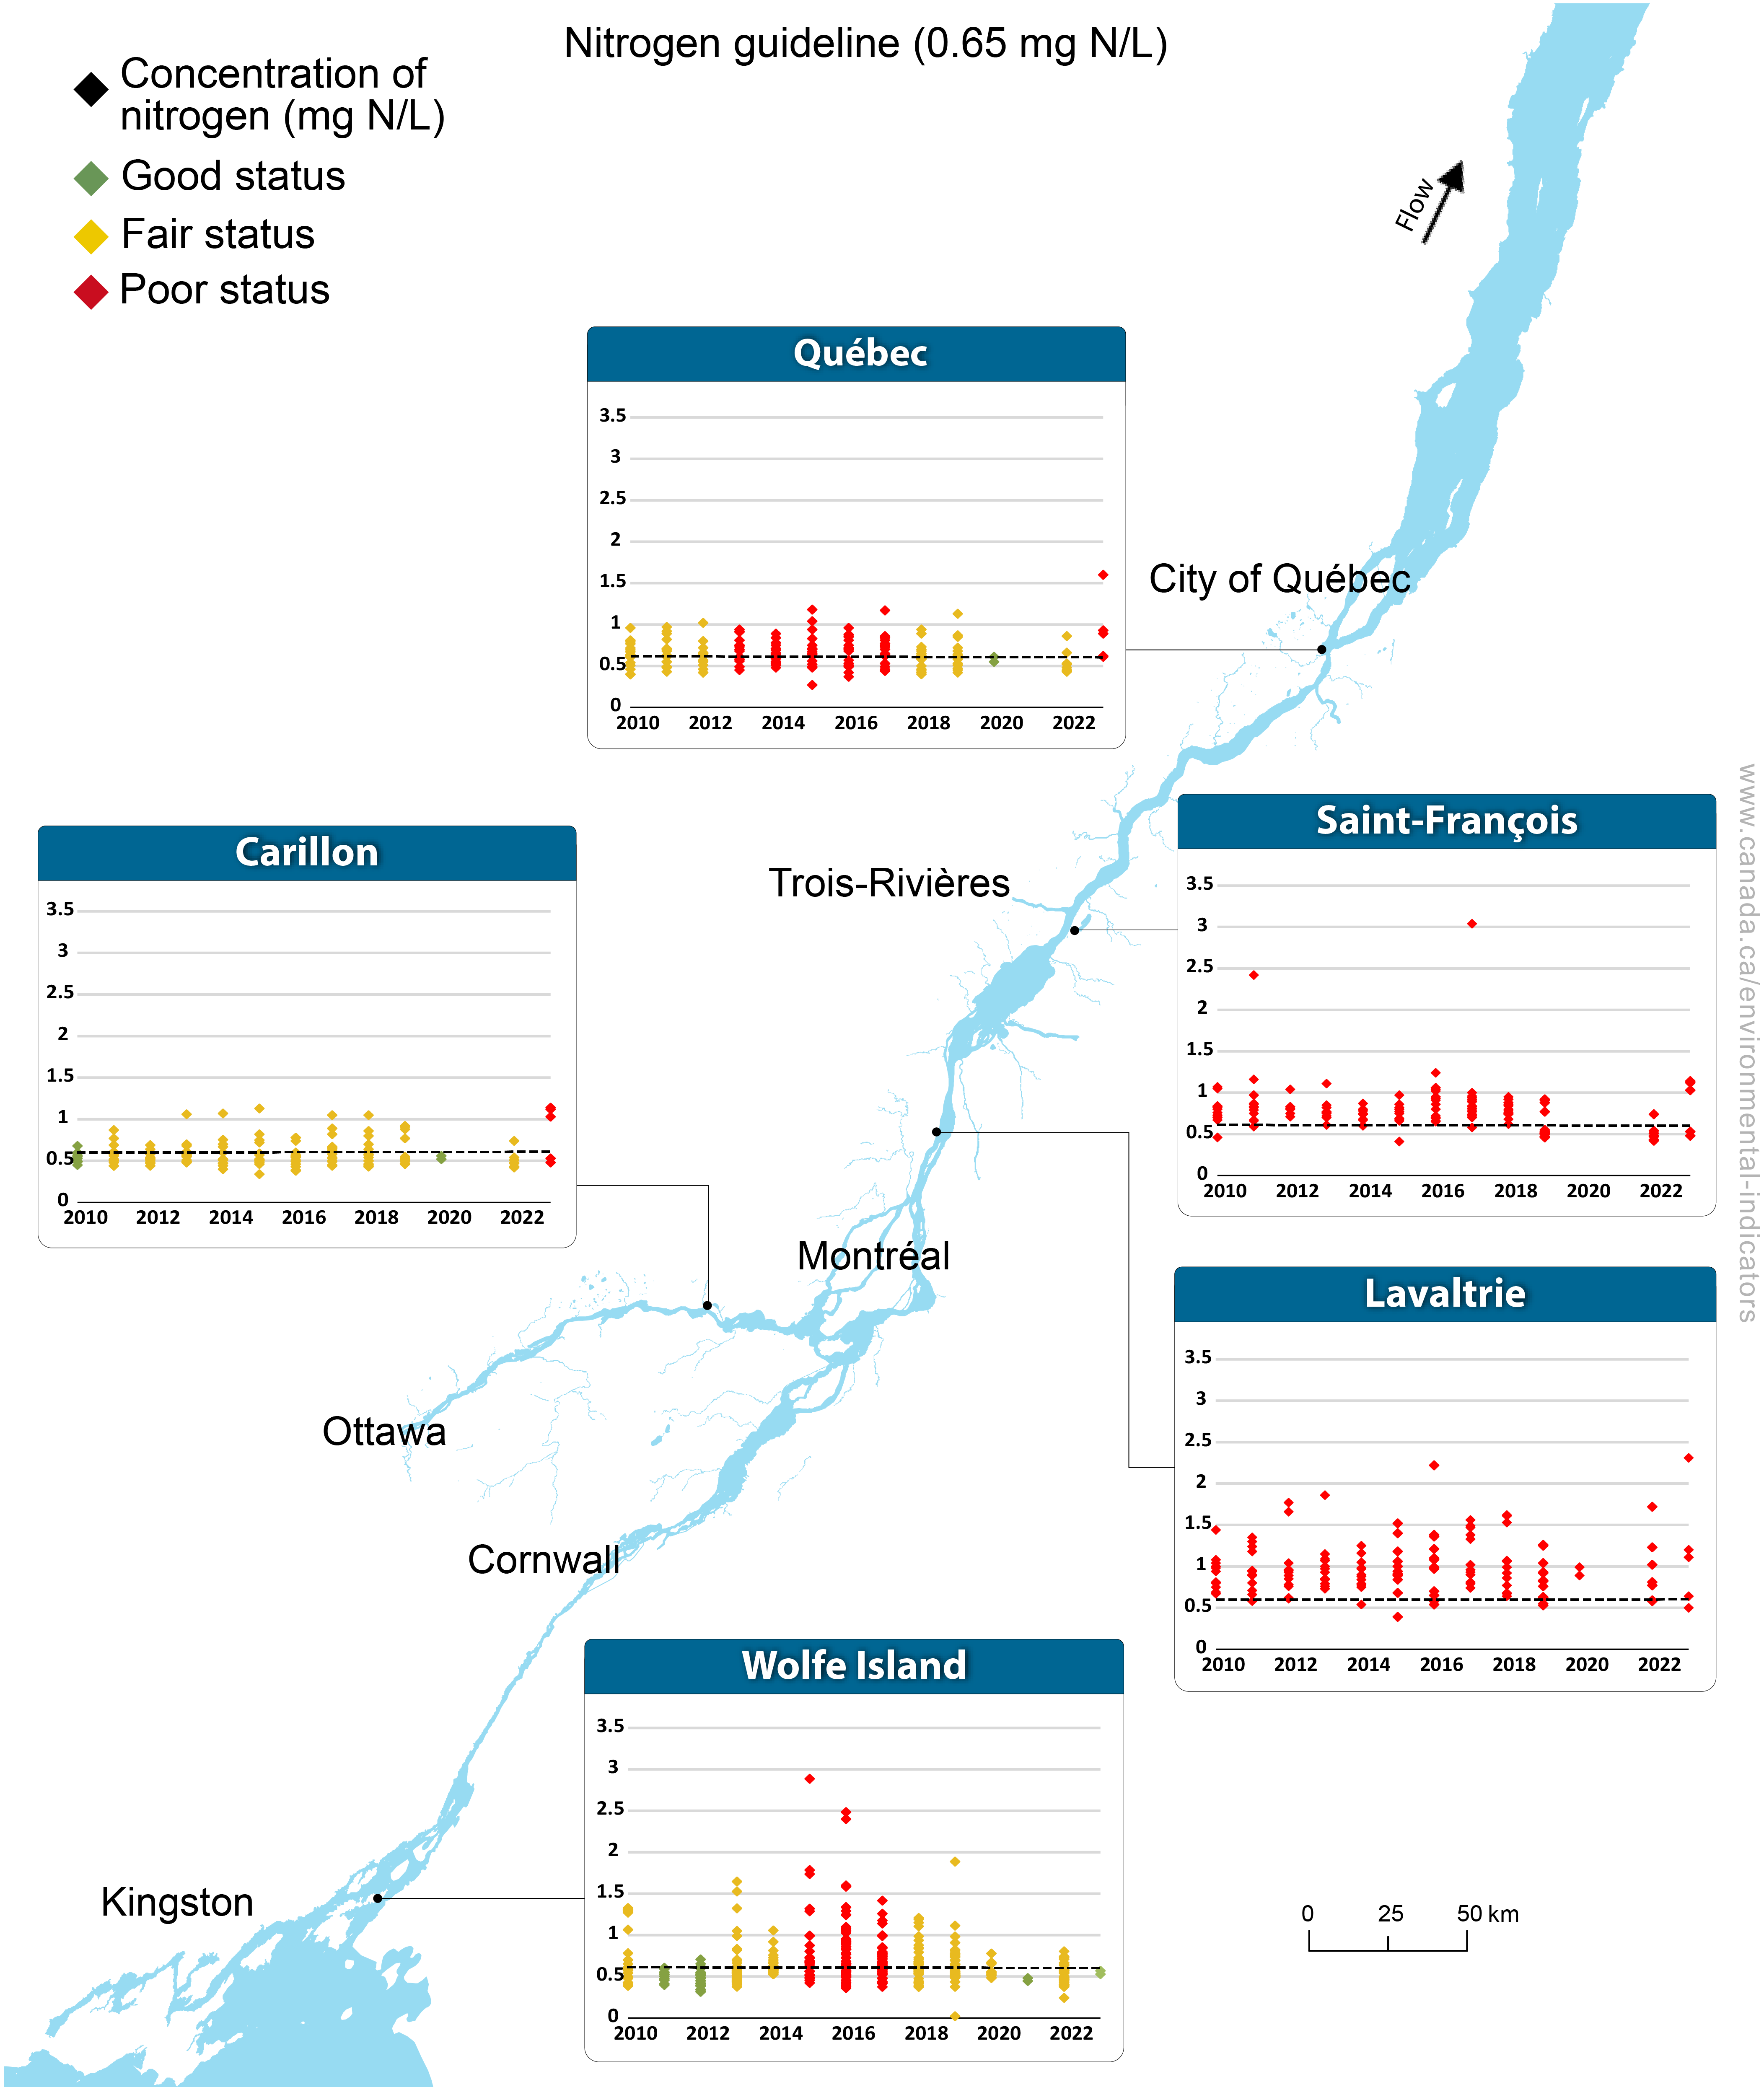
Annual nitrogen concentrations of samples for 5 water quality monitoring stations along the St. Lawrence River, 2010 to 2023
Data table for the long description
| Monitoring station | Year | Percent of samples above nitrogen guideline |
Number of samples |
|---|---|---|---|
| Wolfe Island | 2010 | 42 | 24 |
| Wolfe Island | 2011 | 0 | 13 |
| Wolfe Island | 2012 | 7 | 30 |
| Wolfe Island | 2013 | 15 | 65 |
| Wolfe Island | 2014 | 29 | 28 |
| Wolfe Island | 2015 | 61 | 31 |
| Wolfe Island | 2016 | 68 | 63 |
| Wolfe Island | 2017 | 60 | 55 |
| Wolfe Island | 2018 | 44 | 48 |
| Wolfe Island | 2019 | 28 | 52 |
| Wolfe Island | 2020 | 27 | 11 |
| Wolfe Island | 2021 | 0 | 2 |
| Wolfe Island | 2022 | 28 | 39 |
| Wolfe Island | 2023 | 42 | 24 |
| Carillon | 2010 | 9 | 11 |
| Carillon | 2011 | 21 | 14 |
| Carillon | 2012 | 14 | 14 |
| Carillon | 2013 | 21 | 14 |
| Carillon | 2014 | 29 | 14 |
| Carillon | 2015 | 29 | 14 |
| Carillon | 2016 | 21 | 14 |
| Carillon | 2017 | 43 | 14 |
| Carillon | 2018 | 36 | 14 |
| Carillon | 2019 | 29 | 14 |
| Carillon | 2020 | 0 | 2 |
| Carillon | 2021 | n/a | 0 |
| Carillon | 2022 | 13 | 8 |
| Carillon | 2023 | 60 | 5 |
| Lavaltrie | 2010 | 100 | 12 |
| Lavaltrie | 2011 | 92 | 12 |
| Lavaltrie | 2012 | 83 | 12 |
| Lavaltrie | 2013 | 100 | 12 |
| Lavaltrie | 2014 | 92 | 12 |
| Lavaltrie | 2015 | 92 | 11 |
| Lavaltrie | 2016 | 83 | 12 |
| Lavaltrie | 2017 | 100 | 12 |
| Lavaltrie | 2018 | 100 | 12 |
| Lavaltrie | 2019 | 67 | 12 |
| Lavaltrie | 2020 | 100 | 2 |
| Lavaltrie | 2021 | n/a | 0 |
| Lavaltrie | 2022 | 63 | 8 |
| Lavaltrie | 2023 | 80 | 5 |
| Saint-François | 2010 | 93 | 15 |
| Saint-François | 2011 | 93 | 14 |
| Saint-François | 2012 | 100 | 7 |
| Saint-François | 2013 | 89 | 9 |
| Saint-François | 2014 | 89 | 9 |
| Saint-François | 2015 | 92 | 12 |
| Saint-François | 2016 | 100 | 16 |
| Saint-François | 2017 | 94 | 17 |
| Saint-François | 2018 | 94 | 17 |
| Saint-François | 2019 | 94 | 17 |
| Saint-François | 2020 | n/a | 0 |
| Saint-François | 2021 | n/a | 0 |
| Saint-François | 2022 | 100 | 8 |
| Saint-François | 2023 | 100 | 3 |
| Québec | 2010 | 47 | 17 |
| Québec | 2011 | 41 | 17 |
| Québec | 2012 | 44 | 16 |
| Québec | 2013 | 60 | 15 |
| Québec | 2014 | 53 | 17 |
| Québec | 2015 | 65 | 17 |
| Québec | 2016 | 59 | 17 |
| Québec | 2017 | 59 | 17 |
| Québec | 2018 | 41 | 17 |
| Québec | 2019 | 35 | 17 |
| Québec | 2020 | 0 | 2 |
| Québec | 2021 | n/a | 0 |
| Québec | 2022 | 25 | 8 |
| Québec | 2023 | 47 | 17 |
Download data file (Excel/CSV; 4.32 kB)
Note: n/a = not applicable. For the purposes of this indicator, the nitrogen guideline is 0.63 mg N/L.
How this indicator was calculated
Note: This figure summarizes annual nitrogen concentrations recorded at a monitoring station per year from 2010 to 2023. Each point is a sample nitrogen concentration (mg N/L) recorded for a given year. For more details about the water quality guidelines and categories, please refer to the Data sources and methods section. Samples from the mouth of the Saint-François River from 2010-2020 were collected from May to September only.
Source: Environment and Climate Change Canada (2023)
No station had a majority of years with Good nitrogen status. The Carillon and Wolfe Island stations had most years with Fair nitrogen status, while the Québec station had an equal number of years with Fair and Poor statuses. The nitrogen status at the Lavaltrie and Saint-François stations was Poor for all years.
There were no significant trends in nitrogen concentrations at any station.
About the indicator
About the indicators
What the indicator measures
This indicator reports on the status of total phosphorus and total nitrogen concentrations along the St. Lawrence River. It ranks the status based on how often total phosphorus and total nitrogen concentrations exceed their respective water quality guidelines.
This indicator assumes that water in the St. Lawrence River would rarely exceed water quality guidelines for phosphorus and nitrogen in the absence of human development. It provides information about how human activity contributes to phosphorus and nitrogen concentrations in the river. The more often the water quality guidelines are exceeded, the greater the risk to the health of the St. Lawrence River. The phosphorus and nitrogen trend analysis provides information about how concentrations change over time.
Why this indicator is important
Clean freshwater is an essential resource. It protects aquatic plant and animal biodiversity. We use it for manufacturing, energy production, irrigation, swimming, boating, fishing and domestic use (for example, drinking, washing). Degraded water quality damages the health of all freshwater ecosystems, such as rivers, lakes, reservoirs and wetlands. It can also disrupt fisheries, tourism and agriculture and make it more expensive to treat to drinking water standards. When phosphorus and nitrogen concentrations in water become too high, aquatic plant growth can become excessive and harmful. The decay of excess plant material can reduce the amount of oxygen available for fish and other aquatic animals. High nutrient concentrations can also lead to harmful algal blooms, which can kill animals that use the water and affect human health. Conversely, too little phosphorus or nitrogen can result in not enough plant growth to support a river's food web, which could reduce fish populations and harm local fisheries.
Phosphorus and nitrogen used in chemical fertilizers reach the river through erosion, leaching from urban areas, farmland runoff, municipal and industrial wastewater discharges, and air pollution. Over time, excess phosphorus and nitrogen concentrations in the river can alter its food web.
This indicator is used to provide information about the state of the St. Lawrence River. Ongoing tracking of phosphorus and nitrogen concentrations allow governments and citizens to be aware of an important aspect of the river’s environmental condition.
Related initiatives
This indicator contributes to the Sustainable Development Goals of the 2030 Agenda for Sustainable Development. They are linked to Goal 6, Clean water and sanitation and Target 6.3, "By 2030, improve water quality by reducing pollution, eliminating dumping and minimizing release of hazardous chemicals and materials, halving the proportion of untreated wastewater and substantially increasing recycling and safe reuse globally."
In addition, the indicator is being proposed to contribute towards reporting on Target 7 of the draft Canada’s 2030 National Biodiversity Strategy: “Pollution and Biodiversity”. This target is related to Target 7 of the Kunming-Montreal Global Biodiversity Framework: "Reduce pollution risks and the negative impact of pollution from all sources, by 2030, to levels that are not harmful to biodiversity and ecosystem functions and services, considering cumulative effects, including: reducing excess nutrients lost to the environment by at least half including through more efficient nutrient cycling and use; reducing the overall risk from pesticides and highly hazardous chemicals by at least half including through integrated pest management, based on science, taking into account food security and livelihoods; and also preventing, reducing, and working towards eliminating plastic pollution."
Related indicators
The Water quality in Canadian rivers indicators provide a measure of the ability of river water across Canada to support plants and animals.
The Phosphorus levels in the offshore waters of the Canadian Great Lakes and the Nutrients in Lake Winnipeg indicators report on the status of total phosphorus and total nitrogen levels in these 2 ecosystems.
The Phosphorus loading to Lake Erie indicators report on the total phosphorus loadings flowing directly into Lake Erie or from its tributary rivers.
The Municipal wastewater treatment indicators measure the level of wastewater treatment provided to the Canadian population.
Data sources and methods
Data sources and methods
Data sources
Total phosphorus and total nitrogen data were provided by Environment and Climate Change Canada's Fresh Water Quality Monitoring and Surveillance program. The data can be found on the Saint Lawrence River basin long-term water quality monitoring data and the Great Lakes connecting channels monitoring and surveillance data Open Data web pages.
More information
Sampling
The statuses of total phosphorus and total nitrogen concentrations are based on available measurements recorded between April 2021 and March 2023. The trend analysis uses data from 2010 to 2023.
The sampling frequencies at the water quality monitoring stations included in these indicators are not uniform. Sampling at the Chateâuguay, Carillon, Lavaltrie, Cornwall and Québec stations is conducted monthly. Meanwhile, sampling at the Île Saint-Thérèse, Îles-de-Boucherville, Île d'Orléans, Bécancour South, and Lac Saint-Pierre South and North stations takes place between April and October due to site accessibility. Sampling at the Wolfe Island station is typically conducted on a weekly basis, year-round. The Saint-François monitoring station QU02OF3004 typically collected samples on a weekly basis from May to September. This monitoring was transitioned to the Saint François monitoring station QU02OF3005 in May 2022, which collects samples monthly. For this indicator, the 2 monitoring stations are considered as a single location and are not analyzed separately. Gaps exist in the data due to COVID-19, program changes, field laboratory updates, financial limitations, weather and mechanical issues with the equipment used to collect the data.
Water quality monitoring station locations
Data were obtained from 14 monitoring stations along the St. Lawrence River: from the outlet of Lake Ontario at Wolfe Island near Kingston in the west, to the City of Québec in the east (Table 1). The stations are used to monitor the principal water sources entering the St. Lawrence River and are sometimes installed at the mouths of tributary rivers.
| Monitoring station | Station code | Station name | Latitude | Longitude |
|---|---|---|---|---|
| Wolfe Island | ON02MA0030 | St. Lawrence River (South Channel) | 44.2078 | -76.2368 |
| Cornwall | ON02MC0032 | St. Lawrence River, water intake of Cornwall’s water filtration plant | 45.0138 | -74.7908 |
| Châteaugay | QU02OA0125 | Châteaugay River's mouth | 45.3769 | -73.7511 |
| Carillon | QU02LB9001 | Ottawa River at Carillon | 45.5676 | -74.3799 |
| Îles-de-Boucherville | QU02OA0206 | Îles-de-Boucherville | 45.5966 | -73.4997 |
| Île Sainte-Thérèse | QU02OA0207 | Île Sainte-Thérèse | 45.6745 | -73.4592 |
| Lavaltrie | QU02OB9004 | St. Lawrence River, water intake at Lavaltrie water treatment plant | 45.8744 | -73.2806 |
| Saint-François | QU02OF3005 | Saint-François River's mouth | 46.0660 | -72.8093 |
| Saint-François | QU02OF3004 | Saint-François River in Pierreville | 46.0664 | -72.8122 |
| Lac Saint-Pierre North | QU02OC3000 | Lac Saint-Pierre Outlet, north shore | 46.2802 | -72.6581 |
| Lac Saint-Pierre South | QU02OD9039 | Lac Saint-Pierre Outlet, south shore | 46.2717 | -72.6193 |
| Bécancour South | QU02PK9000 | Bécancour, south shore | 46.3835 | -72.4092 |
| Québec | QU02PH9024 | St. Lawrence River at Lévis | 46.8071 | -71.1900 |
| Île d'Orléans | QU02PH9065 | Île d'Orléans | 46.8403 | -71.1326 |
Water quality monitoring station location changes
In 2019 and 2020, 6 monitoring stations that were previously used for this indicator were retired (Table 2). In May 2020, 9 monitoring stations were implemented (Table 3).
| Monitoring station | Station code | Station name | Latitude | Longitude |
|---|---|---|---|---|
| Nicolet | QU02OD3004 | Nicolet River at Nicolet | 46.2454 | -72.6512 |
| Bécancour | QU02OD9009 | St. Lawrence River, water intake of Bécancour's filtration plant | 46.3116 | -72.5460 |
| Saint-Maurice | QU02NG3013 | Saint-Maurice River, water intake at Trois-Rivières water treatment plant | 46.3820 | -72.6105 |
| Saint-François | QU02OF3004 | Saint-François Riverat Pierreville | 46.0664 | -72.8122 |
| Yamaska | QU02OG3007 | Yamaska River, Route 132 bridge | 46.0051 | -72.9101 |
| Richelieu | QU02OJ0052 | Richelieu River, water intake of Sorel's filtration plant | 46.0340 | -73.1176 |
| Monitoring station | Station code | Station name | Latitude | Longitude |
|---|---|---|---|---|
| Cornwall | ON02MC0032 | St. Lawrence River, water intake of Cornwall’s water filtration plant | 45.0138 | -74.7908 |
| Châteaugay | QU02OA0125 | Châteaugay River's mouth | 45.3769 | -73.7511 |
| Îles-de-Boucherville | QU02OA0206 | Îles-de-Boucherville | 45.5966 | -73.4997 |
| Île Sainte-Thérèse | QU02OA0207 | Île Sainte-Thérèse | 45.6745 | -73.4592 |
| Saint-François | QU02OF3005 | Saint-François River's mouth | 46.0660 | -72.8093 |
| Lac Saint-Pierre North | QU02OC3000 | Lac Saint-Pierre Outlet, north shore | 46.2802 | -72.6581 |
| Lac Saint-Pierre South | QU02OD9039 | Lac Saint-Pierre Outlet, south shore | 46.2717 | -72.6193 |
| Bécancour South | QU02PK9000 | Bécancour, south shore | 46.3835 | -72.4092 |
| Île d'Orléans | QU02PH9065 | Île d'Orléans | 46.8403 | -71.1326 |
Methods
The status of phosphorus and nitrogen concentrations at each monitoring station was calculated based on how often levels were above their water quality guidelines. The status at a monitoring station is considered Good when nitrogen concentrations exceed the 0.65 mg N/L guideline in less than 10% of samples. A Fair status is applied when the guideline is exceeded in 10% to 50% of samples. A Poor status is applied when exceedances occur in over 50% of samples.
A Mann-Kendall test with Sen’s slope was used on stations with more than 10 years of data (Wolfe Island, Carillon, Lavaltrie, St. Francois and Québec) to test for the presence of a statistically significant rising or falling trend in total phosphorus and total nitrogen over the last 13 years.Footnote 3
More information
Water quality guidelines
Total phosphorus
This indicator uses Ontario and Quebec's total phosphorus water quality guideline for the protection of aquatic life, 0.03 mg P/L.Footnote 4
Total nitrogen
Neither Ontario, Quebec nor the Canadian Council of Ministers of the Environment (CCME) has a water quality guideline for total nitrogen. Accordingly, a total nitrogen guideline for the St. Lawrence River was derived in keeping with the CCME's lines-of-evidence approach (PDF; 1.95 MB). A total nitrogen guideline of 0.65 mg N/L was selected for calculation of the indicator. This guideline coincides with the ideal performance standardFootnote 5 of 0.65 mg N/L for large rivers in the Mixedwood Plains Ecozone as recommended during Environment and Climate Change Canada's National Agri‑Environmental Standards Initiative.
See Annex A for more details about how the total nitrogen guideline was derived.
Calculation of phosphorus and nitrogen status for the St. Lawrence River
The phosphorus status at each of the 13 water quality monitoring stations was computed by comparing total phosphorus concentrations at each station with the total phosphorus water quality guideline for the protection of aquatic life of 0.03 mg P/L.Footnote 7 Similarly, the nitrogen status at each water quality monitoring station was determined by comparing the total nitrogen concentrations at each station with the St. Lawrence-specific total nitrogen water quality guideline for the protection of aquatic life of 0.65 mg N/L (see Annex A).
The number of times total phosphorus and total nitrogen concentrations exceeded the guidelines were summed from 2021 to 2023, and the results were divided by the total number of samples collected over the same time period. The status of each station was determined by calculating the percentage of samples exceeding the guidelines.
- Good nutrient status = fewer than 10% of samples exceed the guidelines
- Fair nutrient status = 10% to 50% of samples exceed the guidelines
- Poor nutrient status = more than 50% of samples exceed the guidelines
COVID-19 impact on the calculation of the indicator
Due to health measures related to the COVID-19 pandemic, some sampling activities and laboratory analysis were cancelled in 2020 and 2021. This disruption led to gaps in all sampling station data. Because of this, the comparison of results, between years and stations, should be interpreted as indicative.
Carillon, Lavaltrie, Saint-François and Québec stations: Data were missing for April to December 2020, all of 2021, and January to April 2022.
Wolfe Island station: Data were missing for April to December 2020, January to October 2021, January to February 2022, and February to April 2023.
Trend Analysis
Data requirements
With environmental trend analysis, the more data available, the more statistical power the test has. For a station to be included in trend analysis reporting, at least 10 years of data were required. These data requirements were met by all stations for total phosphorus and total nitrogen.
Stations sampled throughout the year
Except for Wolfe Island, which was sampled weekly, stations were typically sampled monthly throughout the entire year. Within the dataset for each station, data were sorted by sampling date from oldest to most current. Duplicate (replicate) values were removed and each sample was assigned to a month based on the sampling date. To correct sampling frequency variation in the data, and to minimize analytical issues associated with serial correlation in the data, one sample per month (approximate 30-day interval) was selected for the analysis. An Excel function was run to count the number of days between sampling dates. If there were more than one sample in the same month, the extra samples were removed from the dataset based on the desired 30-day interval between samples. The mean (average) of each years’ samples was then calculated for analysis, resulting in one value per year. The analysis was run using the Kendall package within the R software environment.
Stations sampled seasonally
From 2010 to 2020, samples from the mouth of the Saint-François River was typically collected on a weekly basis from May to September. Within the dataset for this station, each sample was assigned to 1 of 22 weeks from May 1 to October 1. To correct sampling frequency variation in the data, and to minimize analytical issues associated with serial correlation in the data, a single sample taken approximately every 7 days was selected for the analysis. Only weeks 9 through 17 (June 26 to August 27) had enough samples over the 10-year period to be used for the trend analysis. The mean (average) of each years’ samples was then calculated for analysis, resulting in one value per year. The analysis was run using the Kendall package within the R software environment.
| Monitoring station | Parameter | Tau | 2-sided p-value | Seasonal Kendall slope |
|---|---|---|---|---|
| Wolfe Island | Total phosphorus | -0.209 | 0.324 | n/a |
| Carillon | Total phosphorus | 0.308 | 0.161 | n/a |
| Lavaltrie | Total phosphorus | -0.606 | 0.007 | -0.001 |
| Saint-François | Total phosphorus | -0.485 | 0.034 | 0.000 |
| Québec | Total phosphorus | 0.121 | 0.631 | n/a |
Note: n/a = not applicable.
| Monitoring station | Parameter | Tau | 2-sided p-value | Seasonal Kendall slope |
|---|---|---|---|---|
| Wolfe Island | Total nitrogen | -0.187 | 0.381 | n/a |
| Carillon | Total nitrogen | 0.256 | 0.246 | n/a |
| Lavaltrie | Total nitrogen | 0.154 | 0.502 | n/a |
| Saint-François | Total nitrogen | 0.303 | 0.193 | n/a |
| Québec | Total nitrogen | -0.154 | 0.502 | n/a |
Note: n/a = not applicable.
Interpretation of the trends
The analysis was run using the Kendall package (version 2.2.1, 2011) of the statistical software R (version 4.2.2, 2022) to detect the presence of statistically significant trends in total phosphorus and total nitrogen concentrations from 2010 to 2023. The Mann-Kendall analysis statistical outputs from R are shown in Table 4 for total phosphorus and Table 5 for total nitrogen.
Kendall's tau was used to measure the strength of the relationship between phosphorus or nitrogen concentrations and the sampling date.
- A value of 0 indicates that there is no relationship between phosphorus or nitrogen concentrations and time (i.e., phosphorus or nitrogen does not consistently go up or down over time)
- A value of 1 indicates that there is a strong positive relationship between phosphorus or nitrogen concentrations and time (i.e., phosphorus or nitrogen consistently goes up over time)
- A value of -1 indicates that there is a strong negative relationship between phosphorus or nitrogen concentrations and time (i.e., phosphorus or nitrogen consistently goes down over time)
The observed significance level or 2-sided p-value statistic was used to determine whether a statistically significant trend through time was present in the data. A p-value statistic of 0.05 or less indicates there is sufficient evidence in the data to signal the presence of a trend. Further, a p-value statistic of less than 0.01 indicates strong evidence of a trend in the data. A p-value statistic greater than 0.05 indicates that there is not strong enough evidence to indicate a trend in the data.
Where the p-value indicated a trend, the Sen’s slope was used to determine how quickly phosphorus or nitrogen concentrations change over time. A slope value of 0 indicates a stable trend with no upward or downward slope.
Recent changes
6 stations were retired in 2019 and 2020: Saint-Maurice, Saint-François, Nicolet, Bécancour, Yamaska and Richelieu. 9 stations were added in May 2022: Cornwall, Châteaugay, Îles-de-Boucherville, Île Sainte-Thérèse, Lac Saint-Pierre North, Lac Saint-Pierre South, Saint-François, Île d’Orléans and Bécancour South. Note that the Saint-François station QU02OF3004 was retired and moved to a new station (QU02OF3005) but is considered one station for the purposes of this indicator.
In the previous version of the indicator, all monitoring stations (10) met the minimum data requirements for phosphorus and nitrogen trend analysis. In the current version, only the stations that were not retired in 2019 and 2020 (Carillon, Lavaltrie, Québec and Wolfe Island) and the Saint-François station met these data requirements. Refer to the Methods for more information on the trend analysis.
The previous version of this indicator used 0.63 mg N/L as a calculated guideline for nitrogen. The current version of the indicator updated this guideline to 0.65 mg N/L. For more details on the methodology used for the 2021-2023 nitrogen guideline calculations, please refer to Annex A.
In the previous version of this indicator, a boxplot figure presented trends over time. The current version uses a figure that presents the concentration of each sample collected over time.
The previous version of this indicator analyzed 12 samples per year with a Seasonal Kendal test to determine trends. The current version of this indicator calculated the mean value of each year and used a Sen’s slope to determine trends to account for outliers in the data.
Caveats and limitations
The indicators reflect the state of water quality in the St. Lawrence River based on total phosphorus and total nitrogen concentrations. These concentrations do not reflect the effect of spills or other transient events unless they are frequent or long-lasting.
Caution must be used when comparing these indicators with similar indicators for lakes. In rivers, total phosphorus concentrations are influenced by suspended particles in the water that increase during high-flow events. Elevated total nitrogen concentrations result from high runoff associated with precipitation, which washes nitrogen out of soils. This situation differs in lake ecosystems, as suspended particles generally settle out. However, it is still reasonable to compare lake and river systems, as long as the methods used to determine the water quality classifications are clear.
Resources
Resources
References
Canadian Council of Ministers of the Environment (2016) Guidance Manual For Developing Nutrient Guidelines for Rivers and Streams (PDF; 1.95 MB). Retrieved on November 19, 2023
Chambers PA, Guy M, Dixit SS, Benoy GA, Brua RB, Culp JM, McGoldrick D, Upsdell BL and Vis C (2009) Nitrogen and Phosphorus Standards to Protect the Ecological Condition of Canadian Streams, Rivers and Coastal Waters. National Agri-Environmental Standards Initiative Synthesis Report No. 11. Environment Canada. Gatineau, Quebec. 79 p.
Government of Canada (2008) Technical guidance document for Water Quality Index practitioners reporting under the Canadian Environmental Sustainability Indicators (CESI) initiative 2008. Environment and Climate Change Canada and Statistics Canada. Retrieved on November 19, 2023.
Goyette GO, Bennet EM, Howarth RW and Maranger R. (2016) Changes in anthropogenic nitrogen and phosphorus inputs to the St. Lawrence sub-basin over 110 years and impacts on riverine export. Global Biogeochemical Cycles 30(7): 1000-1014. Retrieved on March 26, 2024.
Hudon C, Gagnon P, Rondeau M, Hébert S, Gilbert D, Hill B, Patoine M and Starr M (2017) Hydrological and biological processes modulate carbon, nitrogen and phosphorus flux from the St. Lawrence River to its estuary (Quebec, Canada). Biogeochemistry 135:251 to 276. Retrieved on November 19, 2023.
Ministère du Développement durable, Environnement et Lutte contre les changements climatiques (2009) Critères de qualité de l'eau de surface : phosphore total (en P) (in French only). Retrieved on November 19, 2023.
Ontario Ministry of the Environment and Energy (1994) Water management policies, guidelines, provincial water quality objectives. Retrieved on November 19, 2023.
United States Environmental Protection Agency (2000a) Nutrient Criteria Development Document: Rivers and Streams. Report No. EPA-822-B-00-002. Retrieved on November 19, 2023.
United States Environmental Protection Agency (2000b) Ecoregional Nutrient Criteria Documents for Rivers and Streams in Nutrient Ecoregion VII: Mostly Glaciated Dairy Region (PDF; 331 kB). Report No. EPA-822-B-00-018. Retrieved on November 19, 2023.
United States Environmental Protection Agency (2001) Ecoregional Nutrient Criteria Documents for Rivers and Streams in Nutrient Ecoregion VIII: Nutrient-Poor, Largely Glaciated Upper Midwest and Northeast (PDF; 2.53 MB). Report No. EPA-822-B-01-015. Retrieved on November 19, 2023.
Related information
Environment and Climate Change Canada (2015) Phosphorus in aquatic ecosystems. Retrieved on November 19, 2023.
Governments of Canada and Quebec (2015) St. Lawrence Action Plan 2011-2026. Retrieved on November 19, 2023.
Environment and Climate Change Canada (2017) St. Lawrence River: phosphorus at the mouths of Lake Saint-Pierre tributaries. Retrieved on November 19, 2023.
Annex
Annex A. A total nitrogen guideline to protect the ecological condition of the St. Lawrence
Neither the governments of Ontario and Quebec nor the Canadian Council of Ministers of the Environment (CCME) has a water quality guideline for total nitrogen. In order to develop a guideline for the indicator, research and analysis was performed following the lines-of-evidence approach outlined in the CCME's Guidance Manual for Developing Nutrient Guidelines for Rivers and Streams (PDF; 1.95 MB). This approach recommends a number of consecutive steps to formulate a final guideline. A summary of the key steps followed to develop the guideline of 0.65 mg nitrogen per litre (N/L) for calculating the Nutrients in the St. Lawrence River indicators are presented below.
It is important to note that this guideline has been designed for use with this indicator and may not include all possible data. Should an official total nitrogen guideline be developed for the St. Lawrence River, it will replace the guideline derived here.
Step 1. Definition of the area of interest
For the purpose of the indicators and the analysis performed, the St. Lawrence River is defined as extending from the outflow of Lake Ontario at Wolfe Island in the west to the City of Québec in the east.
Site description
The St. Lawrence River is a very large river with a catchment area of 1 610 000 km2. It is situated in the St. Lawrence Lowlands Ecoregion of the Mixedwood Plains Ecozone. About 60% of the region is intensively cultivated farmland, with dairy and mixed farming systems prevailing. Urban development is extensive. Intensive land use is increasing, with a trend toward rising nutrient loads to streams and rivers. The St. Lawrence Lowlands Ecoregion has a humid, continental climate with very cold winters and very hot summers. Rivers in humid regions tend to have more water throughout the year.
The river was formed around the end of the last ice age, when faulting led to the sinking of the area around the river (a rift valley), which was then flooded with water from the Atlantic Ocean. It forms much of the southwestern outline of the Canadian Shield in Quebec.
Step 2. Establishment of the desired outcomes and selection of the guideline variables
The desired outcome of this nitrogen guideline is to prevent eutrophication in the St. Lawrence River and the Gulf of St. Lawrence caused by total nitrogen.
Step 3. Classification of streams
The St. Lawrence River is a very large river ecosystem. In such systems, the relationships between aquatic communities and nutrients may be confounded by physical factors that exert their influence temporally and spatially at the local scale, as well as along a continuum of river size from small streams to large rivers. Water quality in streams is more subject to sudden changes in hydrology than is the case for rivers, and plant and animal community abundance and composition varies with river size. For these reasons, separate standards to protect the ecological condition of different rivers are necessary.
The river was not subdivided into separate subregions for this guideline derivation because of the need for a single value that would apply along the whole river to allow comparability among stations.
Step 4. Collection and analysis of data
Total phosphorus and total nitrogen data were provided by Environment and Climate Change Canada's Freshwater Quality Monitoring and Surveillance program.
Observed spatial patterns in the data (Figure A.1; Table A.3):
- Total nitrogen concentrations in the river tend to be lowest in summer and highest in winter
- Total nitrogen concentrations increase from Wolfe Island to Lavaltrie and then decrease at the Québec station
- Total nitrogen concentrations at Lavaltrie are influenced by the region of Montreal's sewage outfall
Figure A.1. Total nitrogen data for 4 water quality monitoring stations on the St. Lawrence River, 2010 to 2023
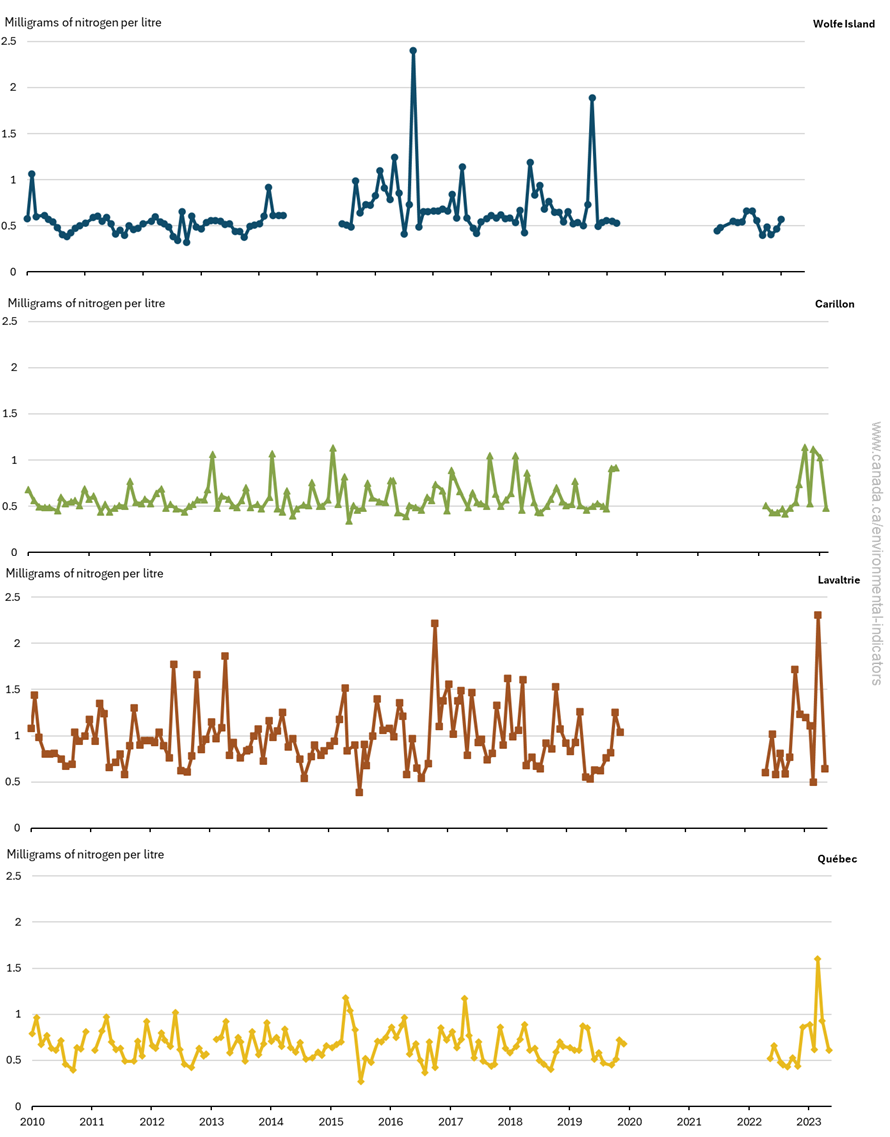
Note: This figure summarizes available nitrogen concentrations recorded at Wolfe Island, Carillon, Lavaltrie and Québec monitoring stations from 2010 to 2023. Stations are presented in order from Wolfe Island in the west to Québec in the east.
Source: Environment and Climate Change Canada (2023)
Step 5. Literature review
Existing suggested guidelines for the St. Lawrence River were found in the primary and grey literature. The examples below were the most applicable.
Chambers et al. 2009
Ideal performance standards for medium and large rivers draining agricultural regions in Canada were developed following 2 lines of data analysis. The first method involved approximating background nutrient concentrations by calculating 25th percentiles for total phosphorus and total nitrogen following the United States Environmental Protection Agency's (U.S. EPA) nutrient criteria methodology (U.S. EPA 2000a). The second method involved exploring relationships between total nitrogen and total phosphorus and either benthic or sestonic algal biomass expressed as chlorophyll a using stepwise multiple linear regression on log10-transformed data.
The results of the analysis produced a suggested total nitrogen guideline of 0.63 mg N/L for large rivers in the Mixedwood Plains. Chambers et al. also recommended an ideal performance standard of 0.100 mg N/L for total nitrogen for Prince Edward Island coastal waters. This value is close to 7 times lower than the concentrations currently seen at the Québec station.
Caveats
Rivers with drainage basins larger than 10 000 km2 were considered too large to be included in the analysis.
The methods deviated from the U.S. EPA approach by only using 25th percentiles for 2 reasons. First, given the amount of data in the freshwater database and the number of disparate sources of data, it was not possible to determine whether a site could be considered reference or low-impact. Second, the data came from rivers draining agricultural areas, signifying that they are impacted. The methods also deviated from the U.S. EPA method by analyzing data for large rivers collected for a 20‑year period between 1985 and 2005 rather than the recommended 10‑year period.
United States Environmental Protection Agency 2000b
The U.S. EPA's ecoregional nutrient criteria are intended to address cultural eutrophication. The criteria, or guidelines, are empirically derived to represent surface water conditions that are minimally impacted by human activities and protective of aquatic life and recreational uses.
This document sets out the U.S. EPA's recommended criteria for total nitrogen for rivers and streams in Nutrient Ecoregion VII (Mostly Glaciated Dairy Region) derived following procedures described in U.S. EPA 2000a. Reference condition criteria are based on the 25th percentiles of all nutrient data including a comparison of reference conditions for the aggregate ecoregion and the sub-ecoregions.
The analysis resulted in suggested total nitrogen guidelines for the whole ecoregion, as well as the sub-ecoregions closest to the St. Lawrence River (Table A.1).
| Name | Suggested total nitrogen guideline (milligrams of nitrogen per litre) |
|---|---|
| Aggregate Ecoregion VII | 0.54 (reported) |
| Aggregate Ecoregion VII | 0.54 (calculated) |
| Sub-ecoregion 83 - Eastern Great Lakes and Hudson Lowlands | 0.48 (reported) |
| Sub-ecoregion 83 - Eastern Great Lakes and Hudson Lowlands | 0.50 (calculated) |
Caveats
Nutrient criteria are derived for wadeable streams in the U.S. only, which generally have basins much smaller than 10 000 km2.
United States Environmental Protection Agency 2001
The analysis in U.S. EPA 2001 is the same as that in U.S. EPA 2000b, except that it encompasses Nutrient Ecoregion VIII (Nutrient-Poor Largely Glaciated Upper Midwest and Northeast) (Table A.2).
| Name | Suggested total nitrogen guideline (milligrams of nitrogen per litre) |
|---|---|
| Aggregate Ecoregion VIII | 0.38 (reported) |
| Sub-ecoregion 58 - Northeastern Highlands | 0.42 (reported) |
| Sub-ecoregion 58 - Northeastern Highlands | 0.26 (calculated) |
Step 6. Collection and analysis of data
The following guideline calculation techniques were applied to the data for the 4 St. Lawrence River water quality monitoring stations. The U.S. EPA recommends the use of 10 years of data for its analysis; however, there were only 6 years of data available for the St. Lawrence River at the time of calculation.
United States Environmental Protection Agency 2000a
To derive nutrient criteria, the U.S. EPA recommends using the 75th percentile of 10 years of monitoring data from reference or low-impact sites. In the absence of adequate reference data, the 25th percentile of all monitoring sites can be used (Table A.3).
For the 25th percentile analysis for the St. Lawrence River, all total nitrogen data for each station were combined into a single median value for each season. The 25th percentile of all station medians was then calculated for each season (Table A.3). The median value from the 4 seasonal 25th percentile values is considered the standard. This analysis generated a guideline of 0.65 mg N/L (Table A.4).
| Monitoring station | Season | Number of records for total nitrogen | Minimum (milligrams of nitrogen per litre) |
25th percentile (milligrams of nitrogen per litre) |
Median (milligrams of nitrogen per litre) |
75th percentile (milligrams of nitrogen per litre) |
Maximum (milligrams of nitrogen per litre) |
|---|---|---|---|---|---|---|---|
| Wolfe Island | Whole year | 88 | 0.386 | 0.510 | 0.574 | 0.664 | 2.399 |
| Wolfe Island | Spring | 21 | 0.516 | 0.547 | 0.587 | 0.663 | 1.246 |
| Wolfe Island | Summer | 21 | 0.386 | 0.438 | 0.510 | 0.665 | 2.399 |
| Wolfe Island | Fall | 26 | 0.401 | 0.486 | 0.561 | 0.676 | 1.887 |
| Wolfe Island | Winter | 23 | 0.453 | 0.554 | 0.612 | 0.674 | 1.099 |
| Carillon | Whole year | 99 | 0.340 | 0.490 | 0.530 | 0.670 | 1.140 |
| Carillon | Spring | 25 | 0.390 | 0.473 | 0.520 | 0.820 | 1.130 |
| Carillon | Summer | 24 | 0.340 | 0.455 | 0.495 | 0.530 | 0.670 |
| Carillon | Fall | 24 | 0.470 | 0.505 | 0.585 | 0.740 | 1.050 |
| Carillon | Winter | 26 | 0.450 | 0.520 | 0.555 | 0.630 | 1.140 |
| Lavaltrie | Whole year | 97 | 0.390 | 0.770 | 0.930 | 1.150 | 2.310 |
| Lavaltrie | Spring | 25 | 0.530 | 0.770 | 0.930 | 1.260 | 2.310 |
| Lavaltrie | Summer | 24 | 0.390 | 0.628 | 0.720 | 0.818 | 0.960 |
| Lavaltrie | Fall | 24 | 0.730 | 0.855 | 1.050 | 1.270 | 2.220 |
| Lavaltrie | Winter | 24 | 0.500 | 0.963 | 1.070 | 1.165 | 1.620 |
| Québec | Whole year | 99 | 0.270 | 0.530 | 0.650 | 0.750 | 1.600 |
| Québec | Spring | 26 | 0.510 | 0.610 | 0.760 | 0.913 | 1.180 |
| Québec | Summer | 24 | 0.270 | 0.450 | 0.490 | 0.543 | 0.810 |
| Québec | Fall | 24 | 0.420 | 0.558 | 0.670 | 0.720 | 0.910 |
| Québec | Winter | 25 | 0.550 | 0.640 | 0.700 | 0.750 | 1.600 |
| Whole river | Whole year | 383 | 0.270 | 0.521 | 0.650 | 0.860 | 2.399 |
| Whole river | Spring | 97 | 0.390 | 0.550 | 0.680 | 0.930 | 2.310 |
| Whole river | Summer | 93 | 0.270 | 0.460 | 0.521 | 0.670 | 2.399 |
| Whole river | Fall | 95 | 0.401 | 0.534 | 0.700 | 0.860 | 2.220 |
| Whole river | Winter | 98 | 0.450 | 0.569 | 0.667 | 0.920 | 1.620 |
| Monitoring station | 25th percentile of seasonal medians (milligrams of nitrogen per litre) |
|---|---|
| Wolfe Island | 0.548 |
| Carillon | 0.514 |
| Lavaltrie | 0.878 |
| Quebéc | 0.625 |
| Whole river | 0.630 |
The U.S. EPA also suggests using reference reaches to establish criteria. For this approach, it recommends using the 75th percentile of the nutrient frequency distribution for reference sites. As Carillon is the most upstream station,Footnote 8 it can be considered the reference site for the dataset, even though technically its water quality is not degraded, as it is situated at the mouth of the Ottawa River. Total nitrogen is at its lowest here until the water reaches the City of Québec. The 75th percentile of Carillon's total nitrogen concentrations is 0.67 mg N/L (Table A.3).
Step 7. Establishment of guidelines
In the absence of more detailed analyses to assess the relationship between nitrogen and aquatic plant growth in the St. Lawrence River, the analysis presented here helps point toward a total nitrogen guideline. Based on the recommended total nitrogen guideline values summarized in the table below, the values calculated using Canadian data for the area result in a total nitrogen guideline in the range of 0.63 to 0.67 mg N/L (Table A.5). The mid-point of the range, 0.65 mg N/L, is the value used to calculate of the Nutrients in the St. Lawrence River indicator.
| Value type | Guideline analysis reference | Recommended total nitrogen guideline (milligrams of nitrogen per litre) |
Notes or comments |
|---|---|---|---|
| Calculated value | U.S. EPA 2000a | 0.63 | 25th percentile of seasonal medians for all sites in an ecoregion |
| Calculated value | U.S. EPA 2000a | 0.67 | 75th percentile of reference site (Carillon) |
| Literature value | Chambers et al. 2009 | 0.63 | For large rivers in the Mixedwood Plains Ecozone |
| Literature value | U.S. EPA 2000b | 0.54 | Streams in Aggregate Ecoregion VII – Mostly Glaciated Dairy Region |
| Literature value | U.S. EPA 2001 | 0.38 | Streams in Aggregate Ecoregion VIII – Nutrient Poor Largely Glaciated Upper Midwest and Northeast |