
Monitoring Household Food Insecurity Over Time
Learn about patterns of household food insecurity in Canada over time and how they’re gathered.
On this page
Measures of household food insecurity
Measures of household food insecurity have been included on national health surveys since the mid-1990s. They help us develop and assess the impact of policies and programs related to food security. However, the use of different indicators and measurement inconsistencies have hindered the ability to track changes over time.
To help address this, Health Canada commissioned a Discussion Paper on Household and Individual Food Insecurity in 2001. It helped to explore issues related to the inclusion of indicators of food insecurity in a monitoring system. The Household Food Security Survey Module (HFSSM) built on this discussion paper.
The HFSSM was included for the first time in a national survey called the Canadian Community Health Survey Cycle 2.2., Nutrition (2004). However, HFSSM estimates are not directly comparable to those from the Canadian Community Health Survey (CCHS) cycles. This is because of differences in survey methodology, such as:
- subject matter of the survey
- proportion of in-person versus telephone interviews
Therefore, the prevalence of estimates of food insecurity from the CCHS 2004 should not be included in trend analysis.
Household Food Security Survey Module
The HFSSM was included as core content in CCHS 2007 to 2008 and 2011 to 2012. The module is optional on alternate cycles of the CCHS, which include:
- 2005
- 2009 to 2010
- 2013 to 2014
In the listed cycles for optional modules, the questions related to household food insecurity were asked only of respondents in provinces and territories which opted to include the HFSSM.
Trends in household food insecurity are difficult to detect with data from only 2 or 3 points in time. However, on a national level, rates of food insecurity from 2011 to 2012 are not significantly different from 2007 to 2008.
The HFSSM will be core content again in 2017 to 2018. However, as a result of the changes from the 2015 CCHS redesign , combining cycles of CCHS data from before and after the redesign is not recommended, and caution should be taken when comparing estimates across those years.
Household food insecurity in Canada, CCHS, 2005, 2007 to 2008, 2009 to 2010, 2011 to 2012, 2013 to 2014.
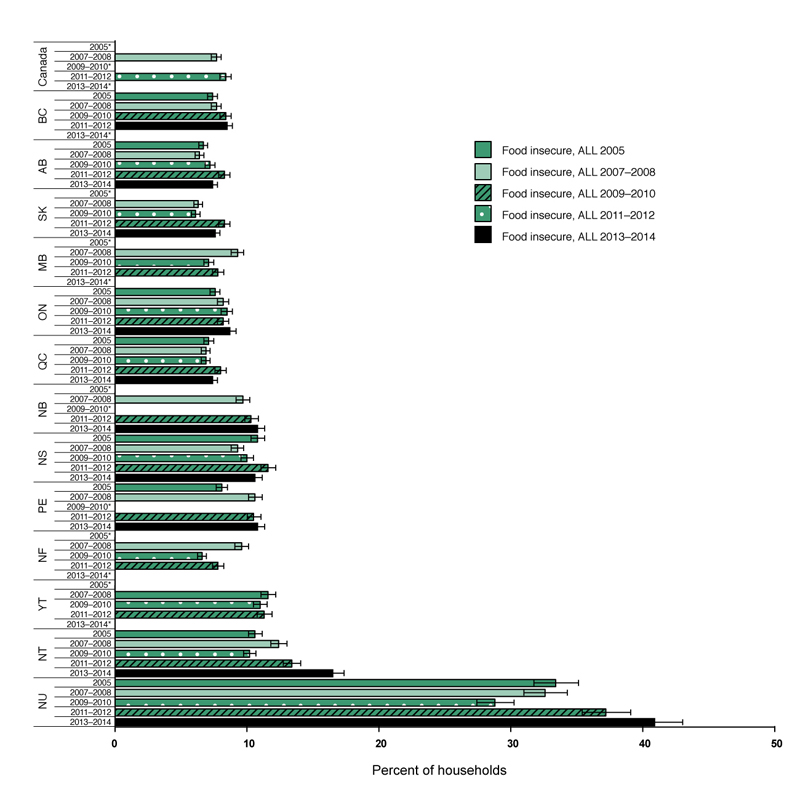
*National estimate not available. The HFSSM was optional content and wasn’t collected in all provinces and territories.
‘All’ food insecure is the sum of moderately and severely food insecure.
Household food insecurity in Canada: Text Equivalent
This bar graph shows the prevalence of household food insecurity for all provinces and territories in Canada during:
- 2005
- 2007 to 2008
- 2009 to 2010
- 2011 to 2012
- 2013 to 2014
In Canada, for:
- 2005, a national estimate isn’t available
- the HFSSM was optional content and wasn’t collected in all provinces and territories
- 2007 to 2008, 7.7% of all households were food insecure
- the 95% confidence interval ranges from 7.5% to 8%
- 2009 to 2010, a national estimate isn’t available
- the HFSSM was optional content and wasn’t collected in all provinces and territories
- 2011 to 2012, 8.4% of all households were food insecure
- the 95% confidence interval ranges from 8% to 8.7%
- 2013 to 2014, a national estimate isn’t available
- the HFSSM was optional content and wasn’t collected in all provinces and territories
In British Columbia, for:
- 2005, 7.4% of all households were food insecure
- the 95% confidence interval ranges from 6.8% to 7.9%
- 2007 to 2008, 7.7% of all households were food insecure
- the 95% confidence interval ranges from 7% to 8.4%
- 2009 to 2010, 8.4% of all households were food insecure
- the 95% confidence interval ranges from 7.7% to 9.1%
- 2011 to 2012, 8.5% of all households were food insecure
- the 95% confidence interval ranges from 7.6% to 9.4%
- 2013 to 2014, a national estimate isn’t available
- the HFSSM was optional content and wasn’t collected in all provinces and territories
In Alberta, for:
- 2005, 6.7% of all households were food insecure
- the 95% confidence interval ranges from 6.1% to 7.3%
- 2007 to 2008, 6.4% of all households were food insecure
- the 95% confidence interval ranges from 5.7% to 7.2%
- 2009 to 2010, 7.2% of all households were food insecure
- the 95% confidence interval ranges from 6.5% to 8%
- 2011 to 2012, 8.3% of all households were food insecure
- the 95% confidence interval ranges from 7.3% to 9.2%
- 2013 to 2014, 7.4% of all households were food insecure
- the 95% confidence interval ranges from 6.5% to 8.2%
In Saskatchewan, for:
- 2005, a national estimate isn’t available
- the HFSSM was optional content and wasn’t collected in all provinces and territories
- 2007 to 2008, 6.3% of all households were food insecure
- the 95% confidence interval ranges from 5.5% 7%
- 2009 to 2010, 6.1% of all households were food insecure
- the 95% confidence interval ranges from 4.9% to 7.3%
- 2011 to 2012, 8.3% of all households were food insecure
- the 95% confidence interval ranges from 6.8% to 9.7%
- 2013 to 2014, 7.6% of all households were food insecure
- the 95% confidence interval ranges from 6.4% to 8.8%
In Manitoba, for:
- 2005, a national estimate isn’t available
- the HFSSM was optional content and wasn’t collected in all provinces and territories
- 2007 to 2008, 9.3% of all households were food insecure
- the 95% confidence interval ranges from 8.1% to 10.5%
- 2009 to 2010, 7.1% of all households were food insecure
- the 95% confidence interval ranges from 5.9% to 8.3%
- 2011 to 2012, 7.8% of all households were food insecure
- the 95% confidence interval ranges from 6.7% to 9%
- 2013 to 2014, a national estimate isn’t available
- the HFSSM was optional content and wasn’t collected in all provinces and territories
In Ontario, for:
- 2005, 7.6% of all households were food insecure
- the 95% confidence interval ranges from 7.3% to 8%
- 2007 to 2008, 8.2% of all households were food insecure
- the 95% confidence interval ranges from 7.8% to 8.7%
- 2009 to 2010, 8.5% of all households were food insecure
- the 95% confidence interval ranges from 8% to 9%
- 2011 to 2012, 8.2% of all households were food insecure
- the 95% confidence interval ranges from 7.6% to 8.7%
- 2013 to 2014, 8.7% of all households were food insecure
- the 95% confidence interval ranges from 8.2% to 9.3%
In Quebec, for:
- 2005, 7.1% of all households were food insecure
- the 95% confidence interval ranges from 6.7% to 7.4%
- 2007 to 2008, 6.9% of all households were food insecure
- the 95% confidence interval ranges from 6.3% to 7.4%
- 2009 to 2010, 6.9% of all households were food insecure
- the 95% confidence interval ranges from 6.2% to 7.5%
- 2011 to 2012, 8% of all households were food insecure
- the 95% confidence interval ranges from 7.4% to 8.6%
- 2013 to 2014, 7.4% of all households were food insecure
- the 95% confidence interval ranges from 6.7% to 8.1%
In New Brunswick, for:
- 2005, a national estimate isn’t available
- the HFSSM was optional content and wasn’t collected in all provinces and territories
- 2007 to 2008, 9.7% of all households were food insecure
- the 95% confidence interval ranges from 8.7% to 10.7%
- 2009 to 2010, a national estimate isn’t available
- the HFSSM was optional content and wasn’t collected in all provinces and territories
- 2011 to 2012, 10.3% of all households were food insecure
- the 95% confidence interval ranges from 9.1% to 11.5%
- 2013 to 2014, 10.8% of all households were food insecure
- the 95% confidence interval ranges from 9.5% to 12%
In Nova Scotia, for:
- 2005, 10.8% of all households were food insecure
- the 95% confidence interval ranges from 9.7% to 11.9%
- 2007 to 2008, 9.3% of all households were food insecure
- the 95% confidence interval ranges from 8.3% to 10.4%
- 2009 to 2010, 10% of all households were food insecure
- the 95% confidence interval ranges from 8.7% to 11.3%
- 2011 to 2012, 11.6% of all households were food insecure
- the 95% confidence interval ranges from 10.3% to 13%
- 2013 to 2014, 10.6% of all households were food insecure
- the 95% confidence interval ranges from 9.5% to 11.8%
In Prince Edward Island, for:
- 2005, 8.1% of all households were food insecure
- the 95% confidence interval ranges from 6.6% to 9.6%
- 2007 to 2008, 10.6% of all households were food insecure
- the 95% confidence interval ranges from 9% to 12.1%
- 2009 to 2010, a national estimate isn’t available
- the HFSSM was optional content and wasn’t collected in all provinces and territories
- 2011 to 2012, 10.5% of all households were food insecure
- the 95% confidence interval ranges from 8.5% to 12.6%
- 2013 to 2014, 10.8% of all households were food insecure
- the 95% confidence interval ranges from 9.3% to 12.3%
In Newfoundland and Labrador, for:
- 2005, a national estimate isn’t available
- the HFSSM was optional content and wasn’t collected in all provinces and territories
- 2007 to 2008, 9.6% of all households were food insecure
- the 95% confidence interval ranges from 8.5% to 10.8%
- 2009 to 2010, 6.6% of all households were food insecure
- the 95% confidence interval ranges from 5.5% to 7.7%
- 2011 to 2012, 7.8% of all households were food insecure
- the 95% confidence interval ranges from 6.5% to 9.1%
- 2013 to 2014, a national estimate isn’t available
- the HFSSM was optional content and wasn’t collected in all provinces and territories
In Yukon, for:
- 2005, a national estimate isn’t available
- the HFSSM was optional content and wasn’t collected in all provinces and territories
- 2007 to 2008, 11.6% of all households were food insecure
- the 95% confidence interval ranges from 8.2% to 15%
- 2009 to 2010, 11% of all households were food insecure
- the 95% confidence interval ranges from 8.1% to 14%
- 2011 to 2012, 11.3% of all households were food insecure
- the 95% confidence interval ranges from 9.4% to 13.3%
- 2013 to 2014, a national estimate isn’t available
- the HFSSM was optional content and wasn’t collected in all provinces and territories
In the Northwest Territories, for:
- 2005, 10.6% of all households were food insecure
- the 95% confidence interval ranges from 8.4% to 12.9%
- 2007 to 2008, 12.4% of all households were food insecure
- the 95% confidence interval ranges from 8.9% to 15.9%
- 2009 to 2010, 10.2% of all households were food insecure
- the 95% confidence interval ranges from 6.7% to 13.6%
- this is data with a coefficient of variation 16.6% to 33.3%, so interpret with caution
- 2011 to 2012, 13.4% of all households were food insecure
- the 95% confidence interval ranges from 10.4% to 16.3%
- 2013 to 2014, 16.5% of all households were food insecure
- the 95% confidence interval ranges from 12.6% to 20.5%
In Nunavut, for:
- 2005, 33.4% of all households were food insecure
- the 95% confidence interval ranges from 24.2% to 42.6%
- 2007 to 2008, 32.6% of all households were food insecure
- the 95% confidence interval ranges from 23.4% to 41.8%
- 2009 to 2010, 28.8% of all households were food insecure
- the 95% confidence interval ranges from 23.7% to 33.9%
- 2011 to 2012, 37.2% of all households were food insecure
- the 95% confidence interval ranges from 31.6% to 42.8%[SrWW1]
- 2013 to 2014, 40.9% of all households were food insecure
- the 95% confidence interval ranges from 36.5% to 45.3%
Copyright guidelines
Ensure that the Health Canada Copyright Guidelines are adhered to when using data and graphs from this web page.