
Alignment Among Public Formularies in Canada, Part 2: Oncology Medicines
Table of Contents
- Executive Summary
- Definitions
- Introduction
- Methodology
- Limitations
- 1. Overview of coverage of oncology medicines in Canadian public drug programs
- 2. Coverage of oncology medicines by market segment
- 3. Oncology medicine funding in Canada
- References
- Appendix A: Funding of oncology medicines in Canada, by province and delivery of care
- Appendix B: Oncology medicines included in the study
Acknowledgements
This report was prepared by the Patented Medicine Prices Review Board (PMPRB) as part of the National Prescription Drug Utilization Information System (NPDUIS).
The PMPRB wishes to acknowledge the members of the NPDUIS Advisory Committee for their expert oversight and guidance in the preparation of this report. Please note that the statements and findings for this report do not necessarily reflect those of the members or their organizations.
Appreciation goes to Nevzeta Bosnic for leading this project, and to Jeffrey Menzies, Elena Lungu, and Tanya Potashnik for their oversight in the development of the report. The PMPRB also wishes to acknowledge the contributions of the analytical staff Allison Carey, Blake Wladyka, and Brian O’Shea, and editorial staff Sarah Parker, Shirin Paynter, and Laura Fortune.
Disclaimer
NPDUIS operates independently of the regulatory activities of the Board of the PMPRB. The research priorities, data, statements, and opinions expressed or reflected in NPDUIS reports do not represent the position of the PMPRB with respect to any regulatory matter. NPDUIS reports do not contain information that is confidential or privileged under sections 87 and 88 of the Patent Act, and the mention of a medicine in an NPDUIS report is not and should not be understood as an admission or denial that the medicine is subject to filings under sections 80, 81, or 82 of the Patent Act or that its price is or is not excessive under section 85 of the Patent Act.
Although this information is based in part on data obtained from the NPDUIS Database of the Canadian Institute for Health Information (CIHI) and under license from IQVIA’s MIDAS®, Payer Insights, and Private Pay Direct Drug Plan databases, the statements, findings, conclusions, views, and opinions expressed in this report are exclusively those of the PMPRB and are not attributable to CIHI or IQVIA.
Executive Summary
Each publicly funded drug plan in Canada provides coverage to its eligible population based on a unique plan design, list of approved medicines (formulary), and reimbursed costs. Per the provisions of the Canada Health Act, oncology medicines administered in Canadian hospitals are fully covered by hospital budgetsFootnote i and provided at no cost to the patient1. However, take-home oncology medicines, an emerging standard treatment for many cancers, are not consistently covered by public drug programs in Canadian provinces, which may cause some variations in oncology coverage and payer split between jurisdictions.
This is the second in a series of three PMPRB reports that explore the current gaps and overlaps in Canadian public drug plan formularies. These reports aim to inform discussions on the development of a national formulary, which has been identified as a keystone in ensuring equitable access and achieving better drug prices for Canadians2. The first report in this series provided insight into the degree of alignment between the general public drug plan formularies in Canada, using data from 2015.
The current report, Part 2 in the Alignment of Public Formularies in Canada series, addresses the public coverage of oncology medicines reviewed by the Canadian Agency for Drugs and Technologies in Health’s (CADTH) interim Joint Oncology Drug Review (iJODR) or pan-Canadian Oncology Drug Review (pCODR), as of the end of March 2020. In addition to a comparison of the formulary listings, the report unpacks specific oncology market segments, including hospital and take-home, biologic and small molecule, and single- and multi-source medicines.
Part 3 of the series will analyze newer medicines assessed through CADTH’s Common Drug Review (CDR) process.
The analysis focuses on 87 medicines and their 166 respective indications reviewed by CADTH’s interim Joint Oncology Drug Review (iJODR)3 or pan-Canadian Oncology Drug Review (pCODR) from March 1, 2007, through March 31, 2019. These medicines accounted for 75% of all oncology sales in Canada by the end of 2019. Listing rates report the percentage of these medicines listed on provincial formularies for each of the pCODR-participating provinces, as well as the public drug programs in Quebec, as of March 31, 2020.
Key Findings
Coverage of oncology medicines is well aligned across provincial formularies in Canada.
- Individual formulary listing rates for oncology medicines were very high and comparable across provincial programs, with provinces listing an average of 84% of the selected medicines at the medicinal ingredient level.
- The average listing rate increased to 97% when the corresponding sales were factored in, which indicates that the medicines not covered by the plans accounted for only a small share of national sales.
- Of the 87 selected medicines, 88% were listed in six or more provinces, accounting for 98% of sales.
- Coverage rates were also comparable for all indications analyzed, with an average of 74% of the selected medicine/indication combinations listed.
- Listing agreement rates across provincial formularies were high at 84%, increasing to 96% when sales were considered. The rates were identical at the indication level.
Public formulary listing rates are consistently high across all oncology market segments analyzed.
- Public programs listed an average of 82% of hospital oncology medicines, while take-home medicines had an average rate of 86%.
- The average listing rate for biologic oncology medicines was just slightly under the average rate for small molecule medicines, with many provinces listing 91% or more of the selected biologics.
- The coverage rates for multi-source medicines, which include generics and biologics with available biosimilars, were higher than those for single-source medicines in all public programs, ranging from 80% to 100%.
There are some sizeable differences in overall provincial spending and payer split for the selected oncology medicines.
- Provinces with the highest per capita spending on hospital oncology medicines also ranked among the top spenders for take-home medicines.
- Oncology medicines accounted for a considerably smaller portion of private drug plan spending (3.8%) than in the combined public/private sector (9.9%).
- The payer split for take-home oncology medicines varied significantly by jurisdiction, driven by differences in financing.
- Privately insured patients paid more for their take-home oncology medicines than beneficiaries in the public drug plans overall, though the patient-paid share of costs differed significantly among the public drug plans.
Definitions
Agreement rate: the percentage of agreement between listing decisions for any two formularies. Two programs were considered to be in agreement if both plans had the same listing decision: either to list or not to list a medicine.
Formulary: a list of medicines covered as benefits for eligible beneficiaries, as determined by the individual drug plan. For the purposes of this report, provincial formularies include all public drug plans and programs within a province.
Hospital oncology medicines: medicines used for the active treatment of cancer that are usually administered in a clinical setting.
Listing rate: the percentage of selected medicines listed on a formulary compared to the total number of medicines selected for analysis. Weighted listing rates correspond to the total national sales for the given medicines.
Payer split: the distribution of drug costs by source of reimbursement, typically between coverage by public drug programs and private insurers.
Take-home oncology medicines: medicines used for the treatment of cancer that are dispensed for administration in the home.
For more relevant definitions, see the Glossary provided on the NPDUIS Analytical Studies page of the PMPRB website.
Introduction
The costs associated with oncology medicines present an increasingly significant challenge to the sustainability of Canadian public drug plans nationwide. Each province has its own programs to guide decision-making on new and often very costly therapies4.
Cancer is a leading cause of death around the world, responsible for 1 in 6 deaths globally and close to 1 in 3 deaths in Canada.
The Canadian oncology market tripled in annual sales between 2010 and 2019, rising from $1.3 billion to $3.9 billion. The share of oncology medicines as a proportion of the total prescription pharmaceutical market more than doubled over the same period, from 7.1% to 14.6%.9
Under the Canada Health Act, prescription medicines administered in Canadian hospitals are directly covered by hospital budgets and provided at no cost to the patient1. Per the provisions of this legislation, intravenous oncology medicines are fully covered in all provinces.
Take-home oncology medications, which now account for half of the oncology market as an emerging standard treatment option for many types of cancer5, are not covered using a consistent approach. In Manitoba, Saskatchewan, Alberta, and British Columbia, take-home cancer medicines are fully covered6 through publicly funded programs. In Quebec, the public plan provides coverage for eligible take-home cancer medicines, but individuals may be required to pay a deductible based on income. In Ontario and the Atlantic provinces, these medicines are publicly funded for the portion of the population eligible for public coverage, so patients sometimes bear responsibility for some or all of the costs and rely on private insurance or out-of-pocket payments7. In the provinces where oncology medicines are not fully covered, the amount paid by the individual also differs. Detailed information on the coverage of both hospital and take-home medicines is provided in Appendix A.
Since the implementation of the pan-Canadian Oncology Drug Review (pCODR), researchers have found a greater concordance among provinces in funding decisions for these medicines as well as reductions in the time needed for funding decisions8. However, the inconsistencies in the public coverage of take-home oncology medicines may lead to inequities in drug access and affordability for cancer patients.
This report is part of a three-part series developed by the PMPRB through the National Prescription Drug Utilization Information System (NPDUIS) research initiative to inform discussions related to a national pharmacare: Part 1 in the series compared the general public plan formularies by providing an overview of listing alignment between the provinces in 2015; the current report (Part 2) focuses on the coverage of oncology medicines; and Part 3 will analyze medicines assessed through CADTH’s Common Drug Review (CDR) process.
The report provides insight into the degree of alignment between the provincial formularies with a focus on the 87 oncology medicines reviewed by CADTH’s interim Joint Oncology Drug Review (iJODR) or pan-Canadian Oncology Drug Review (pCODR) from March 1, 2007, to March 31, 2019.
The first section provides a high-level perspective on the provincial formularies, including listing rates, which compare the percentage of the selected medicines listed in each province as well as their corresponding share of sales; the number of provincial formulary listings for selected medicines; and the rates of alignment between provincial drug programs. The second section more closely examines formulary coverage and alignment based on specific market segments: hospital and take-home medicines; biologic and small molecule medicines; and single- and multi-source medicines. Finally, the third section of the report explores the division of public and private funding of oncology medicines in the Canadian provinces, including the interprovincial variations in payer split and patient contributions.
Methodology
Based on the study criteria, 87 medicines with 166 different indications were selected for the oncology formulary analysis. These medicines accounted for more than $3.0 billion in sales in Canada in 2019, representing 75% of the oncology market and 10% of total pharmaceutical spending.
The analysis focuses on 87 medicines and their 166 respective indications reviewed from March 1, 2007, to March 31, 2019, by the interim Joint Oncology Drug Review (iJODR; 2007–2010) or the pan-Canadian Oncology Drug Review (pCODR; 2010–2019). It reports on the percentage of these medicines listed on province-specific programs for each of the pCODR-participating provinces, as well as the public drug programs in Quebec, as of March 31, 2020.
All public programs at the provincial level were considered, which may mean multiple programs in one province, including hospital formularies, cancer agencies, and/or public drug plans. These programs are collectively referred to as “provincial formularies”. Each province has its own unique set of programs, eligibility criteria, and cost-sharing structures. For an overview of the NPDUIS public drug plans, see the Public Drug Plan Designs reference document on the NPDUIS Analytical Studies page of the PMPRB website.
Selection of medicines
For the purposes of this analysis, a medicine includes all strengths and formulations of the given medicinal ingredient.
Medicines reviewed through the iJODR process and their listing statuses on provincial formularies were extracted from the CADTH website. Listing was confirmed through the review of available formularies or by program representatives.
Medicines reviewed by pCODR were extracted from the CADTH website if final recommendations had been issued and posted during the study period. Listing statuses were found in the Provincial Funding Summary and were confirmed with available public formularies or by program representatives. Submissions and re-submissions for the same medicines and/or indications were carefully reviewed to ensure that the most recent recommendations and indication(s) were considered. Medicines cancelled by Health Canada post market10 were excluded from the study.
Listing statuses were obtained for all selected indications. A medicine was considered listed if at least one indication assessed by iJODR and pCODR was accepted for reimbursement.
Quebec listing statuses were based on the available data published by the Régie de l'assurance maladie du Québec (RAMQ) on April 29, 2020.
The IQVIA Private Drug Plan database was used to obtain a list of medicines reimbursed by private drug plans in 2019.
Data sources
Provincial and national sales data was extracted from the 2019 IQVIA Canadian Drugstore and Hospital Purchases Audit (CDH), which captures all sales regardless of the payer (public, private, and out-of-pocket), as well as IQVIA’s MIDAS® and Private Drug Plan databases.
Oncology drug funding by payer was estimated as of the end of 2019 using IQVIA’s CDH, Private Drug Plan, and Payer Insights databases, as well as the NPDUIS database maintained by the Canadian Institute for Health Information (CIHI).
The CIHI NPDUIS and IQVIA Private Drug Plan databases were also used to estimate patient co-payments.
Analysis
The primary analyses were conducted at the medicinal ingredient level, though results are also provided at the indication level. If a medicine had generic or biosimilar versions available, any version (brand or generic/biosimilar) available on the formulary would designate the medicine as listed.
Market segments analyzed include hospital and take-home medicines, biologic and small molecule medicines, and single- and multi-source medicines.
- Hospital medicines include intravenous medicines administered in hospitals while take-home treatments are oral medicines and those administered by subcutaneous injections.
- Biologics were identified as those listed under Schedule D in Health Canada’s Drug Product Database (DPD). All others were considered small molecule medicines.
- Single-source medicines refer to brand-name medicines produced by one manufacturer without generic or biosimilar versions available on the market. Multi-source medicines are produced by two or more manufacturers and include the original brand-name medicines and/or its generic equivalent(s) and biosimilars.
Formulary listing rates are reported for each of the provinces analyzed both in terms of the number of medicines and their corresponding sales, where applicable.
- Listing rates by number of medicines were calculated by dividing the number of medicines listed on the respective formulary by the total number of medicines (87) or indications (166) selected for analysis.
- Weighting listing rates were calculated based on Canadian national retail and hospital sales in 2019, allocating greater weight to medicines with higher shares of the market.
Agreement rates measure alignment in listing decisions between pairs of provinces for the 87 selected medicines and 166 indications. In total, 45 jurisdictional combinations were compared in terms of the number of medicines and their corresponding sales. The programs were considered to be in agreement if both provinces had the same listing decision: either to list or not to list a medicine.
The oncology market payer split was calculated based on the available data and information on the drug plan designsFootnote ii. Available data sources with information on total provincial sales, retail payer insights, public reimbursement, and private drug plan spending were used for the final estimates.
Patient contributions were calculated by subtracting the plan-paid amounts from the total drug expenditures. These contributions may have been paid out of pocket or by a third-party private insurer.
Limitations
The purpose of this report is to assess the general overlap and gaps in formulary listings of oncology medicines across public drug programs in Canada; it is not intended to assess the appropriateness or relevance of these listings.
Oncology medicines that did not meet the selection criteria were excluded from the study. While those analyzed in this report account for a large portion of the oncology medicines used in Canada and their corresponding sales, they do not represent the entirety of the oncology market.
To provide an equitable point of comparison, this report only analyzes medicines reviewed by iJODR or pCODR and their listing status on public formularies as of March 31, 2020, or those available in the private drug plan data in 2019. This snapshot does not include any medicines that may have subsequently been listed in the formularies or reimbursed by the private drug plans.
Only indications assessed through iJODR or pCODR were considered for this study. As a result, the coverage rates presented in this report might be slightly lower than the coverage for all oncology indications.
A direct comparison of the number of medicines listed may provide an incomplete picture of coverage across jurisdictions, as this number can depend on the therapeutic needs of the eligible population as well as decisions related to the listing.
Weighted formulary listing rates are based on overall sales reported in the CDH database, which is national data that includes all payers. Some medicines, including several with significant sales, were not available in the data at the time of the analysis, which may impact the weighted results. It should also be noted that the data captured in the CDH database for drugstore and hospital pharmacies may vary by jurisdiction.
Patient co-payments do not reflect all patient contributions. These values were calculated based on public and private drug plan data, which may not capture other patient-paid amounts such as plan premiums.
1. Overview of coverage of oncology medicines in Canadian public drug programs
Coverage of oncology medicines is well aligned across provincial formularies in Canada. Individually, provinces list a large proportion of the selected oncology medicines. When national sales for these medicines are factored in, the formulary listing rates are even higher, suggesting that the medicines not covered by the programs account for only a small share of the Canadian oncology market. A direct comparison of listing decisions between pairs of provinces confirms high agreement rates, which indicates that there is an important consensus among the public formularies regarding listing decisions for oncology medicines.
An analysis at the medicinal ingredient level, irrespective of associated indications, found that most of the medicines selected for this study were listed on provincial formularies as of March 31, 2020. Listing rates were relatively high in many provinces, ranging from 62% in Prince Edward Island to 92% in Saskatchewan, with an average of 84% across all provinces analyzed. When the medicines were weighted by national sales, the listing rates were higher and more consistent across jurisdictions, for an average of 97% across all provinces.
The findings show a higher coverage rate in the western provinces, which may be influenced by their centralized model of cancer care11. Variations in the percentage of medicines listed may also be impacted by other factors, such as public drug plan designs and therapeutic needs of the eligible population.
Canadian private drug plans had a similar rate of coverage for the selected medicines, with 85% reimbursed by at least one private plan in 2019. It should be noted, however, that the private sector reimburses significantly fewer cancer patients than the public sector. Injectable medicines administered in hospitals are in most cases funded by the public sector, while take-home medicines are funded by mix of private insurers, public drug programs, and out-of-pocket payments, depending on the jurisdiction where the patient resides. Private drug plans may cover oncology medicines not listed on hospital or other public formularies, additional indications for listed medicines, patients not eligible for public coverage, or contributions to deductibles or co-payments.
Figure 1.1 reports formulary listing rates by province as of March 31, 2020, in terms of the number of medicines listed and their respective sales, along with the percentage of medicines available in private drug plans in 2019.
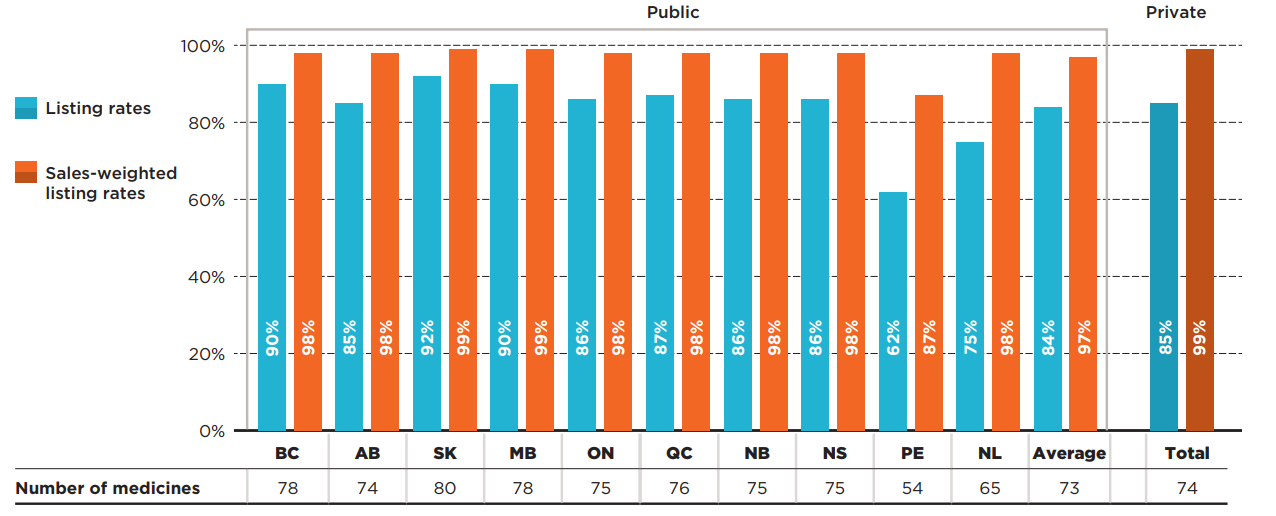
Figure description
This bar graph depicts the percentage of select oncology medicines listed in province-specific programs for each of the pCODR-participating provinces, and the public programs in Quebec as of March 31, 2020, as well as for Canadian private drug plans as of 2019. The analysis focuses on 87 medicines reviewed by the interim Joint Oncology Drug Review or the pan-Canadian Oncology Drug Review from March 1, 2007, through March 31, 2019. Weighted listing rates are based on data from the IQVIA Canadian Drugstore and Hospital Purchases Audit Database in 2019.
| Number of medicines | Listing rates | Sales-weighted listing rates | |
|---|---|---|---|
| British Columbia | 78 | 90% | 98% |
| Alberta | 74 | 85% | 98% |
| Saskatchewan | 80 | 92% | 99% |
| Manitoba | 78 | 90% | 99% |
| Ontario | 75 | 86% | 98% |
| Quebec | 76 | 87% | 98% |
| New Brunswick | 75 | 86% | 98% |
| Nova Scotia | 75 | 86% | 98% |
| Prince Edward Island | 54 | 62% | 87% |
| Newfoundland and Labrador | 65 | 75% | 98% |
| Average for all public programs | 73 | 84% | 97% |
| Private plans | 74 | 85% | 99% |
Note: Listing rates were calculated based on the total number of medicines, regardless of their respective indications.
* Based on 87 medicines assessed by iJODR or pCODR between March 1, 2007, and March 31, 2019.
Data source: Coverage status - Publicly available data including the pCODR and RAMQ websites, March/April 2020; National and provincial sales - IQVIA Canadian Drugstore and Hospital Purchases Audit (CDH) database, 2019; Private plans - IQVIA Private Drug Plan (PDP) database, 2019.
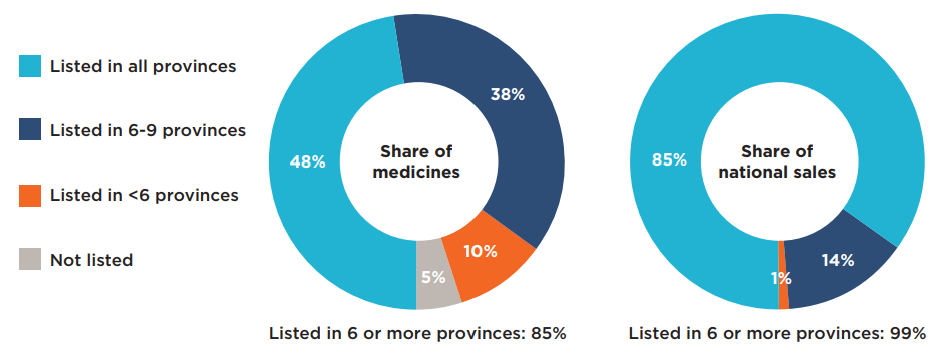
An analysis of the number of provincial formulary listings revealed that a vast majority (88%) of the 87 selected medicines were listed in six or more of the 10 provinces studied: 50% were listed in all public formularies, while 38% were listed in six to nine public formularies (Figure 1.2). Those listed in six or more provinces accounted for 98% of the national sales for all medicines analyzed. A small proportion of the medicines (10%) were listed in fewer than six provinces. These medicines, which include older iJODR-reviewed medications, accounted for an even lower proportion of total sales, at just 2%. Only two medicines were not listed on any of the public drug programs.
Figure description
This figure is composed of two donut graphs. The left-hand graph gives the percentage of select oncology medicines that were listed in all provinces; six to nine provinces; fewer than six provinces; and in none of the provinces as of March 31, 2020. The right-hand graph gives the corresponding share of national sales for these categories of medicines. A total of 88% of the select medicines were listed in six or more provinces and accounted for 98% of sales.
| Share of medicines | Share of national sales | |
|---|---|---|
| Listed in all provinces | 50% | 85% |
| Listed in 6 to 9 provinces | 38% | 13% |
| Listed in fewer than 6 provinces | 10% | 2% |
| Not listed | 2% | 0% |
Note: Public drug programs from the following provinces were included: British Columbia, Alberta, Saskatchewan, Manitoba, Ontario, Quebec, New Brunswick, Nova Scotia, Prince Edward Island, and Newfoundland and Labrador.
* Based on 87 medicines assessed by iJODR or pCODR between March 1, 2007, and March 31, 2019.
Data source: Coverage status - Publicly available data including the pCODR and RAMQ websites, March/April 2020; National and provincial sales - IQVIA Canadian Drugstore and Hospital Purchases Audit (CDH) database, 2019.
The listing rates reported in the preceding figures compared each of the provincial formularies to the total number of selected medicines. To gain insight into the extent to which the listing decisions align across jurisdictions, agreement rates were also measured by comparing the listing decisions for the 87 selected medicines between pairs of provinces. In total, 45 bilateral comparisons were made across the 10 provinces, with both yes-yes and no-no formulary listings considered as in agreement.
Table 1.1 provides the range of bilateral agreement rates across provinces, both in terms of the number of medicines (unweighted) and their corresponding national sales (weighted).
In terms of the number of medicines, the agreement rates ranged from 63% (Quebec and Prince Edward Island) to 98% (New Brunswick and Nova Scotia), with an average and median rate of agreement of 84% and 86%, respectively. These high levels of alignment are consistent with the harmonized approach to drug review envisioned under pCODR. When sales were taken into account, the average agreement rates increased, ranging from 86% (Manitoba and Prince Edward Island) to 100% (Saskatchewan and Manitoba; New Brunswick and Nova Scotia), with an average and median rate of agreement of 96% and 98%, respectively. These results further support the finding that the medicines not consistently listed account for only a small average share (4%) of total sales.
Table 1.1 Formulary agreement rates in public drug programs, oncology medicines*
| All selected medicines | Listing rates | Average | Median | Minimum | Maximum | Standard deviation |
| Unweighted | 84% | 86% | 63% | 98% | 9% | |
| Weighted | 96% | 98% | 86% | 100% | 4% |
Note: Public drug programs from the following provinces were included: British Columbia, Alberta, Saskatchewan, Manitoba, Ontario, Quebec, New Brunswick, Nova Scotia, Prince Edward Island, and Newfoundland and Labrador.
* Based on 87 medicines assessed by iJODR or pCODR between March 1, 2007, and March 31, 2019.
Data source: Coverage status - Publicly available data including the pCODR and RAMQ websites, March/April 2020; National sales - IQVIA Canadian Drugstore and Hospital Purchases Audit (CDH) database, 2019.
For a better understanding of these findings, the analysis was also performed at the indication level by comparing coverage for the specific indications associated with each of the 87 selected medicines, for a total of 166 different medicine/indication combinations. The results show that most indications for the selected medicines were listed by the individual provinces as of the end of March 2020. British Columbia covered the highest number of indications, at 81%, followed by Saskatchewan and Manitoba at 80% and 79%, respectively. The average coverage rate across all programs analyzed was 74%, which is 10 percentage points below the average at the medicine level.
Figure 1.3 reports the formulary listing rates for public drug programs as of March 31, 2020, in terms of the number of medicine/indication combinations covered in each province.
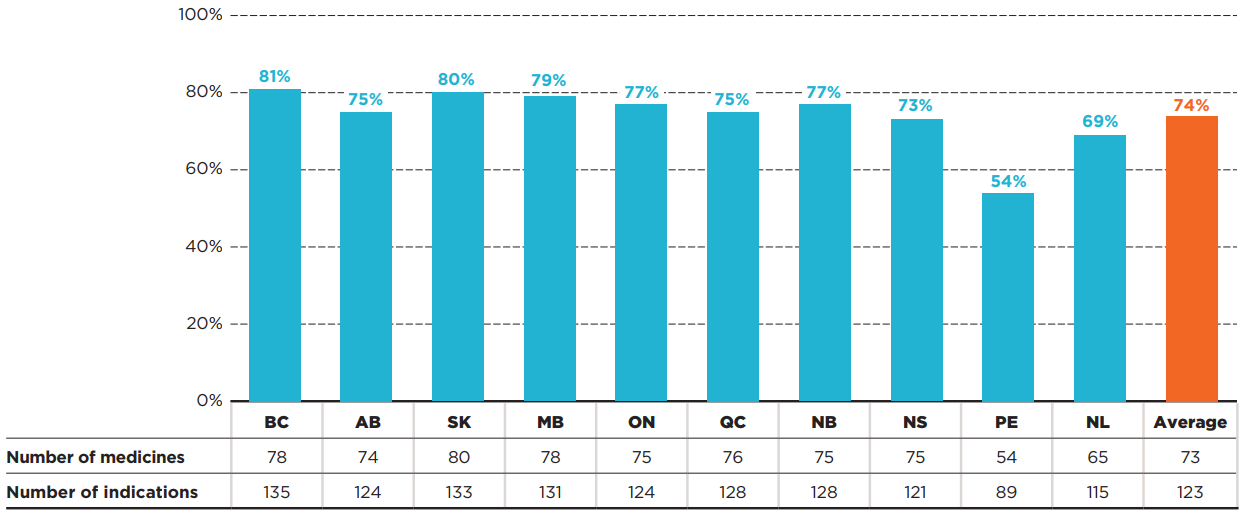
Figure description
This bar graph and accompanying table give the percentage of the 166 medicine and indication pairings covered in each of the public plans as of March 31, 2020, as well as an average listing rate across all plans analyzed. The table indicates the number of selected medicines and indications covered in each province.
| Number of medicines | Number of indications | Listing rates | |
|---|---|---|---|
| British Columbia | 78 | 135 | 81% |
| Alberta | 74 | 124 | 75% |
| Saskatchewan | 80 | 133 | 80% |
| Manitoba | 78 | 131 | 79% |
| Ontario | 75 | 124 | 77% |
| Quebec | 76 | 128 | 75% |
| New Brunswick | 75 | 128 | 77% |
| Nova Scotia | 75 | 121 | 73% |
| Prince Edward Island | 54 | 89 | 54% |
| Newfoundland and Labrador | 65 | 115 | 69% |
| Average for all public programs | 73 | 123 | 74% |
* Based on 87 medicines (166 indications) assessed by iJODR or pCODR between March 1, 2007, and March 31, 2019.
Data source: Coverage status - Publicly available data including the pCODR and RAMQ websites, March/April 2020; National and provincial sales - IQVIA Canadian Drugstore and Hospital Purchases Audit (CDH) database, 2019.
Table 1.2 provides the ranges of bilateral agreement rates by indication across the plans analyzed, in terms of the number of medicine/indication combinations.
Agreement rates ranged from 67% (Quebec and Prince Edward Island; British Columbia and Prince Edward Island) to 95% (Saskatchewan and Manitoba), with average and median rates of 84% and 86%, respectively. These rates are equivalent to the agreement rates at the medicinal ingredient level.
Table 1.2 Formulary agreement rates in public drug programs, oncology medicines* by indication
| All selected medicines by indications | Average | Median | Minimum | Maximum | Standard deviation |
| 84% | 86% | 67% | 95% | 7% |
Note: Public drug programs from the following provinces were included: British Columbia, Alberta, Saskatchewan, Manitoba, Ontario, Quebec, New Brunswick, Nova Scotia, Prince Edward Island, and Newfoundland and Labrador.
The data by indication was not available to calculate weighted alignment rates.
* Based on 87 medicines (166 indications) assessed by iJODR or pCODR between March 1, 2007, and March 31, 2019.
Data source: Coverage status - Publicly available data including the pCODR and RAMQ websites, March/April 2020.
2. Coverage of oncology medicines by market segment
Public formulary listing rates are consistently high across all oncology market segments analyzed. The coverage rates between hospital and take-home medicines are similar across many jurisdictions, irrespective of the provincial model of cancer care. Biologics are listed at a rate similar to their small molecule counterparts and have higher coverage in some individual jurisdictions. Rates for multi-source medicines surpassed those for single-source medicines in all public programs.
Hospital and take-home medicines
The coverage rates between medicines delivered in the hospital and those taken at home were similar across many jurisdictions. Unsurprisingly, provinces with universal programs for oncology medicines showed nearly the same trends for hospital and take-home medicines, but those with different funding mechanisms also demonstrated very similar results, with some interprovincial variability in coverage within both segments.
Of the 87 medicines selected for the analysis, 40 were hospital-based and 47 were take-home. The hospital market represented 55% of drug sales nationally, while take-home medicines accounted for 45% of the market. Figure 2.1 reports the formulary listing rates by public drug programs for (a) hospital and (b) take-home oncology medicines as of March 31, 2020, in terms of the number of medicines covered.
The average public program listing rate for hospital medicines was 82%, ranging from 60% in Prince Edward Island to 90% in British Columbia, Saskatchewan, and Manitoba. When sales were considered, the listing rates were consistently high in all provincial drug programs, at 98% on average. Sales were highly concentrated among a small group of medicines: the top 10 hospital medicines represented 90% of total national hospital sales in 2019, of which nine were listed in all provinces and one was listed in nine provinces. These findings suggest that the higher-sales hospital medicines were listed nearly uniformly in the Canadian provinces.
Take-home medicines had a slightly higher average listing rate, at 86%. The listing rates varied from 64% in Prince Edward Island to 94% in Saskatchewan. While Quebec had one of the lowest rates in the hospital market, it ranked among the top for take-home medicines. Similar to the trends observed in the hospital sector, the weighted average listing rates were consistently high in the majority of the provincial drug programs, at 96% on average.
Private drug plans recorded sales for all take-home medicines and 68% of the hospital medicines. As mentioned earlier, the private plans may reimburse additional indications for publicly listed medicines as well as medicines not listed on hospital formularies.
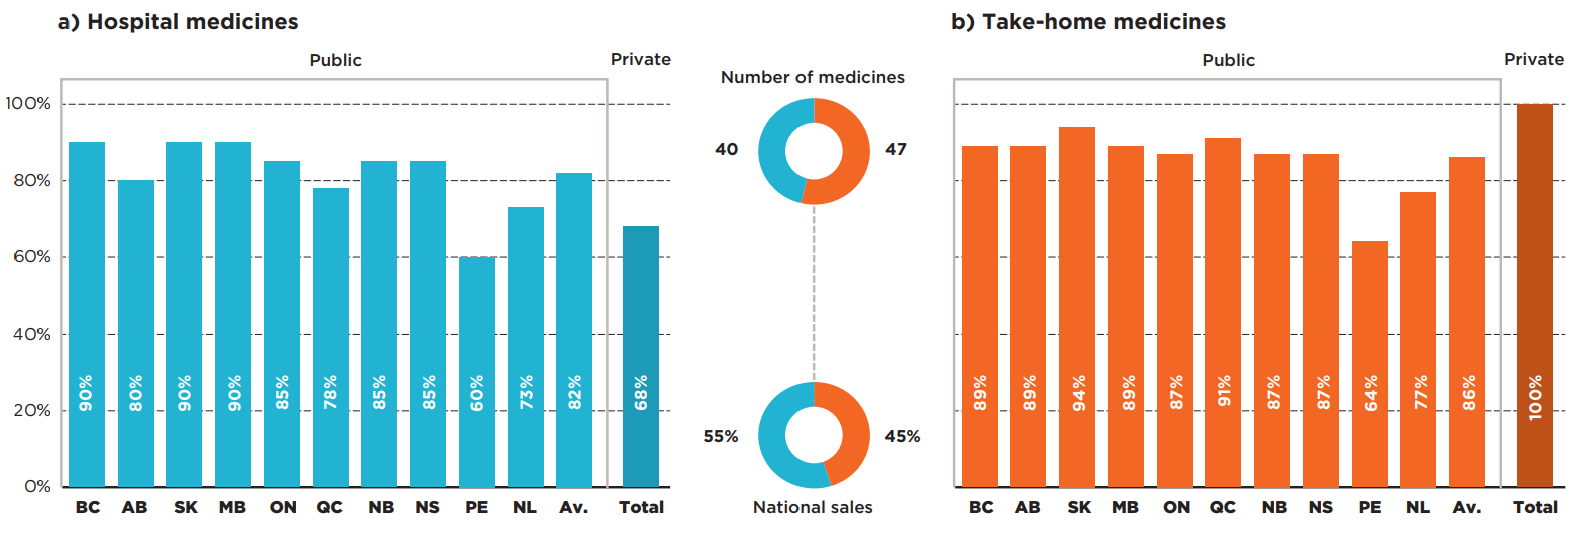
Figure description
Two bar graphs give the formulary listing rates by province for a) hospital oncology medicines and b) take-home oncology medicines as of March 31, 2020. In each case, an average across all provinces is shown, as well as the listing rates for private plans.
a) Hospital medicines
Number of medicines: 40
Share of national sales: 55%
| Listing rates | |
|---|---|
| British Columbia | 90% |
| Alberta | 80% |
| Saskatchewan | 90% |
| Manitoba | 90% |
| Ontario | 85% |
| Quebec | 78% |
| New Brunswick | 85% |
| Nova Scotia | 85% |
| Prince Edward Island | 60% |
| Newfoundland and Labrador | 73% |
| Average for all public programs | 82% |
| Private plans | 68% |
b) Take-home medicines
Number of medicines: 47
Share of national sales: 45%
| Listing rates | |
|---|---|
| British Columbia | 89% |
| Alberta | 89% |
| Saskatchewan | 94% |
| Manitoba | 89% |
| Ontario | 87% |
| Quebec | 91% |
| New Brunswick | 87% |
| Nova Scotia | 87% |
| Prince Edward Island | 64% |
| Newfoundland and Labrador | 77% |
| Average for all public programs | 86% |
| Private plans | 100% |
* Based on 87 medicines assessed by iJODR or pCODR between March 1, 2007, and March 31, 2019.
Data source: Coverage status - Publicly available data including the pCODR and RAMQ websites, March/April 2020; National and provincial sales - IQVIA Canadian Drugstore and Hospital Purchases Audit (CDH) database, 2019, Private plans - IQVIA Private Drug Plan (PDP) database, 2019.
Figure 2.2 shows the distribution of a) hospital and b) take-home oncology medicines by their number of provincial formulary listings. The results show only slight variations across the two market segments.
Of the 40 selected hospital medicines, 85% were listed in six or more of the 10 provinces: 48% were listed in all provinces, while 38% were listed in six to nine. These accounted for 99% of Canadian sales for the select hospital oncology medicines in 2019. A relatively small proportion of the medicines (10%) were approved for coverage by fewer than six provinces, representing less than 1% of sales in 2019. Only two hospital medicines were not listed on any of the public formularies for the selected indications reviewed by pCODR, one with a negative recommendation and another with a conditional recommendation. The sales in Canada for these two medicines were negligible. Most of the medicines available in a small number of provincial programs received positive pCODR recommendations, some of which became available in other programs after the study period.
A slightly higher percentage (89%) of the take-home medicines were listed in six or more of the 10 provincial formularies: 51% were listed in all provinces, while 38% were listed in six to nine. These medicines accounted for 97% of sales for the select take-home medicines in 2019. Those approved for coverage in fewer than six provinces accounted for only 11% of the medicines and 3% of national sales. There were no medicines in this segment without coverage in at least one province.
a) Hospital medicines
b) Take-home medicines

Figure description
This figure is composed of four donut graphs that examine the number of provincial formulary listings and share of national sales for a) hospital medicines and b) take-home medicines. In each case, the left-hand graph gives the percentage of select oncology medicines that were listed in all provinces; six to nine provinces; fewer than six provinces; and in none of the provinces as of March 31, 2020. The right-hand graph gives the corresponding share of national sales for these categories of medicines.
a) Hospital medicines
For this group of medicines, 85% were listed in six or more provinces and accounted for 99% of sales.
| Share of medicines | Share of national sales | |
|---|---|---|
| Listed in all provinces | 48% | 85% |
| Listed in 6 to 9 provinces | 38% | 14% |
| Listed in fewer than 6 provinces | 10% | 1% |
| Not listed | 5% | 0% |
b) Take-home medicines
For this group of medicines, 89% were listed in six or more provinces and accounted for 97% of sales.
| Share of medicines | Share of national sales | |
|---|---|---|
| Listed in all provinces | 51% | 84% |
| Listed in 6 to 9 provinces | 38% | 14% |
| Listed in fewer than 6 provinces | 11% | 3% |
| Not listed | 0% | 0% |
Note: Public drug programs from the following provinces were included in the analysis: British Columbia, Alberta, Saskatchewan, Manitoba, Ontario, Quebec, New Brunswick, Nova Scotia, Prince Edward Island, and Newfoundland and Labrador.
* Based on 87 medicines (40 hospital and 47 take-home) assessed by iJODR or pCODR between March 1, 2007, and March 31, 2019.
Data source: Coverage status - Publicly available data including the pCODR and RAMQ website, March/April 2020; National and provincial sales - IQVIA Canadian Drugstore and Hospital Purchases Audit (CDH) database, 2019.
In addition to the comparison of public formularies and the analysis of number of provincial listings, the alignment of listing decisions for hospital and take-home medicines between programs was also assessed. Table 2.1 provides bilateral agreement rates between the pairs of provinces analyzed, both in terms of the number of medicines covered (unweighted) and their corresponding national sales (weighted).
In terms of the number of medicines, the agreement rates for hospital medicines ranged from a low of 59% to a high of 97%, with average and median rates of 84% and 85%, respectively. The average and median agreement rates for the take-home medicines were relatively unchanged, with a range from 64% to 100%.
When sales were considered, the average and median agreement rates increased notably for both segments. Consistent with findings for the overall market, these results suggest that while some medicines were not consistently listed across the plans, they accounted for a small share of national sales.
Table 2.1 Formulary agreement rates in public drug programs, hospital and take-home oncology medicines*
| Listing rates | Average | Median | Minimum | Maximum | Standard deviation | |
|---|---|---|---|---|---|---|
| Hospital | Unweighted | 84% | 85% | 59% | 97% | 10% |
| Weighted | 97% | 99% | 86% | 100% | 5% | |
| Take-home | Unweighted | 84% | 85% | 64% | 100% | 8% |
| Weighted | 95% | 97% | 87% | 100% | 4% |
Note: Public drug programs from the following provinces were included: British Columbia, Alberta, Saskatchewan, Manitoba, Ontario, Quebec, New Brunswick, Nova Scotia, Prince Edward Island, and Newfoundland and Labrador.
* Based on 87 medicines (40 hospital and 47 take-home) assessed by iJODR or pCODR between March 1, 2007, and March 31, 2019.
Data source: Coverage status - Publicly available data including the pCODR and RAMQ websites, March/April 2020; National sales - IQVIA Canadian Drugstore and Hospital Purchases Audit (CDH) database, 2019.
Other market segments
The coverage and level of alignment between provincial formularies were further explored for biologic and small molecule medicines as well as single- and multi-source medicines.
Biologic and small molecule medicines
Biologic medicines used to treat cancer represented only 25% of the selected oncology medicines but accounted for 50% of their total sales in 2019. Despite their relatively high costs, some provinces had higher listing rates for biologics than for small molecule medicines, resulting in an average listing rate only slightly under the average for non-biologics.
On average, 82% of biologics were covered, with some provincial variations, while small molecule medicines were listed at an average rate of 85%. The biologics listing rates were high in most provinces, with lower rates observed in Prince Edward Island and Newfoundland and Labrador. A greater difference was noted for private payers, who reimbursed an average of 92% of non-biologics and 64% of biologics, as many of these medicines are administered in hospital and typically covered by hospital budgets.
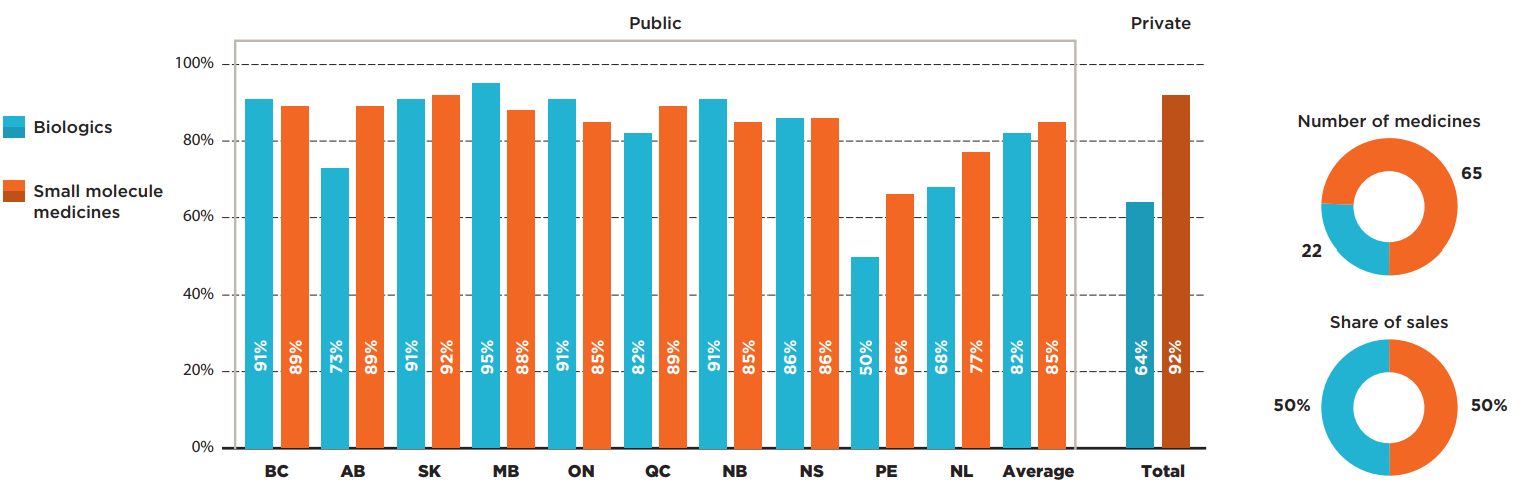
Figure description
This bar graph compares the listing rates in each province for biologic and small molecule oncology medicines. An average is given for all public programs as well as private plans. In total, biologics made up 22 of the 87 medicines and 50% of sales for these medicines while small molecule medicines made up the remaining 65 medicines and 50% of sales.
| Listing rates for biologics | Listing rates for small molecule medicines | |
|---|---|---|
| British Columbia | 91% | 89% |
| Alberta | 73% | 89% |
| Saskatchewan | 91% | 92% |
| Manitoba | 95% | 88% |
| Ontario | 91% | 85% |
| Quebec | 82% | 89% |
| New Brunswick | 91% | 85% |
| Nova Scotia | 86% | 86% |
| Prince Edward Island | 50% | 66% |
| Newfoundland and Labrador | 68% | 77% |
| Average for all public programs | 82% | 85% |
| Private plans | 64% | 92% |
* Based on 87 medicines assessed by iJODR or pCODR between March 1, 2007, and March 31, 2019.
Data source: Coverage status - Publicly available data including the pCODR and RAMQ websites, March/April 2020; National and provincial sales - IQVIA Canadian Drugstore and Hospital Purchases Audit (CDH) database, 2019; Private data - IQVIA Private Drug Plan (PDP) database, 2019.
Single-source and multi-source medicines
The majority of oncology medicines selected for the analysis were single-source, brand-only products accounting for almost three quarters of the selected market. These 67 medicines had lower coverage rates than multi-source medicines in all public programs.
The highest listing rates for single-source medicines were found in Manitoba and Saskatchewan, at 88%. Most other provinces had only slightly lower rates, resulting in average rate of 80%. An analysis of the multi-source market, which includes generics and biosimilars as well as their originator products, revealed that most multi-source oncology medicines were listed on nearly all public formularies, with listing rates in the range of 80% to 100%.
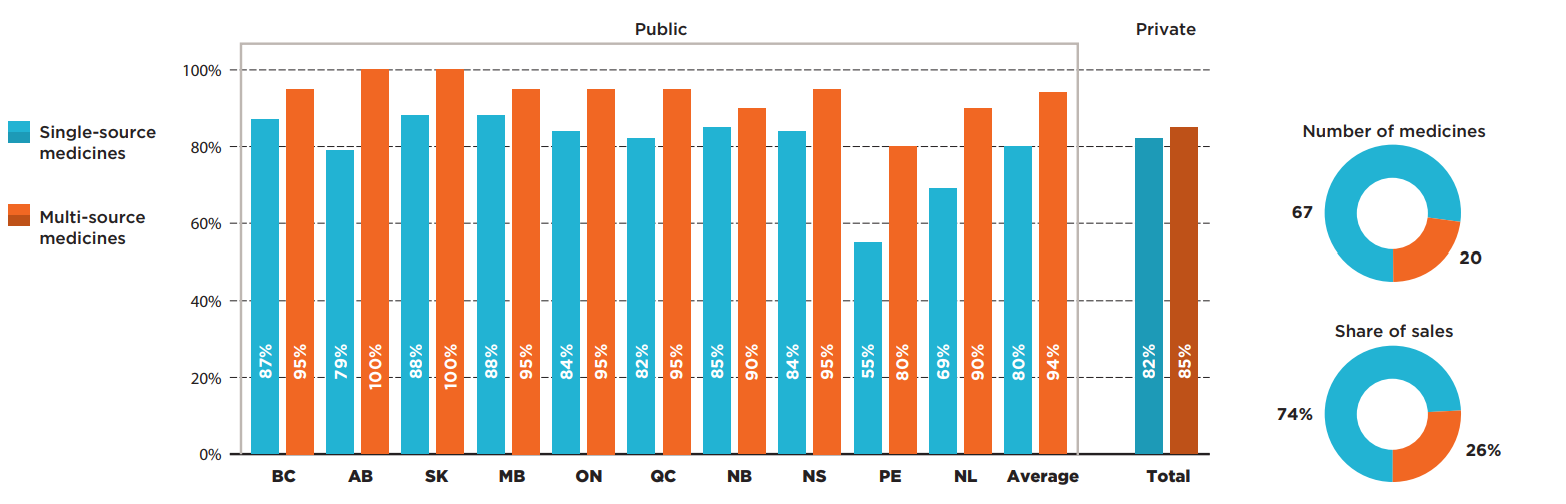
Figure description
This bar graph compares the listing rates in each province for single-source and multi-source oncology medicines. An average is given for all public programs as well as private plans. For this group of medicines, there were 67 single-source medicines accounting for 74% of sales and 20 multi-source medicines accounting for 26% of sales.
| Listing rates for single-source medicines | Listing rates for multi-source medicines | |
|---|---|---|
| British Columbia | 87% | 95% |
| Alberta | 79% | 100% |
| Saskatchewan | 88% | 100% |
| Manitoba | 88% | 95% |
| Ontario | 84% | 95% |
| Quebec | 82% | 95% |
| New Brunswick | 85% | 90% |
| Nova Scotia | 84% | 95% |
| Prince Edward Island | 55% | 80% |
| Newfoundland and Labrador | 69% | 90% |
| Average for all public programs | 80% | 94% |
| Private plans | 82% | 85% |
* Based on 87 medicines assessed by iJODR or pCODR between March 1, 2007, and March 31, 2019.
Data source: Coverage status - Publicly available data including the pCODR and RAMQ websites, March/April 2020; National and provincial sales - IQVIA Canadian Drugstore and Hospital Purchases Audit (CDH) database, 2019; Private data - IQVIA Private Drug Plan (PDP) database, 2019.
Figure 2.5 provides insight into the interprovincial alignment in listing decisions for each market segment. Overall, the findings suggest that the average agreement rates had some slight variations within the given markets.
The average rate of alignment for biologics was slightly lower than the average for small molecule medicines, at 81% and 85%, respectively. The range of provincial pair alignments for biologics was also more widely spread, from 50% (British Columbia and Prince Edward Island) to 100% (Ontario and Saskatchewan).
Of all market segments analyzed, the multi-source medicines, which include generics and biosimilars as well as their originators, had the highest average agreement rate of 89%. All western Canadian provinces were in 97% alignment in listing decisions for multi-source medicines, while New Brunswick and Newfoundland and Labrador were in 100% agreement. By comparison, provinces had an average agreement rate of 84% for single-source medicines. The minimum alignment was 63% (British Columbia and Prince Edward Island) and the maximum was 99% (New Brunswick and Nova Scotia).
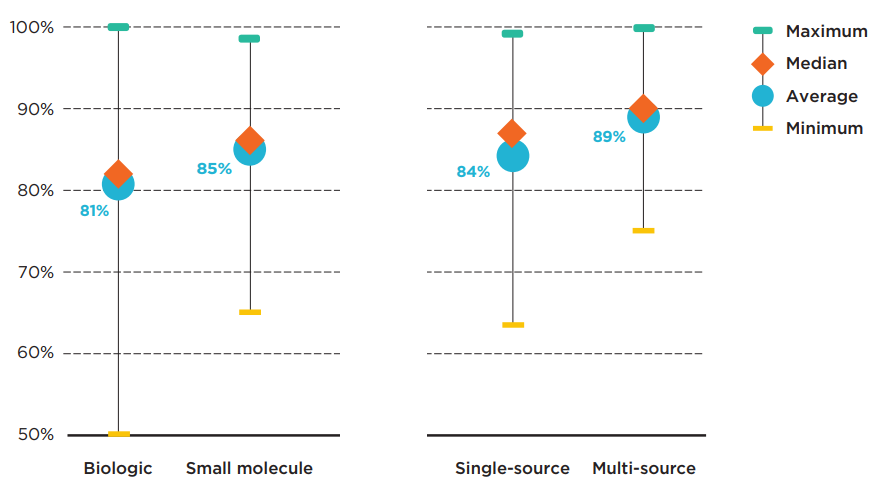
Figure description
This graph gives the range of formulary listing alignment rates for the selected medicines by market segment across all pairs of provincial drug programs. The minimum, maximum, average, and median listing rates are given for each segment analyzed: biologics, small molecule medicines, single-source medicines, and multi-source medicines.
| Market segment | Maximum alignment rate | Average alignment rate | Median alignment rate | Minimum alignment rate |
|---|---|---|---|---|
| Biologics | 100% | 81% | 82% | 50% |
| Small molecule medicines | 98% | 85% | 86% | 65% |
| Single-source medicines | 99% | 84% | 87% | 63% |
| Multi-source medicines | 100% | 89% | 90% | 75% |
Note: Public drug programs from the following provinces were included: British Columbia, Alberta, Saskatchewan, Manitoba, Ontario, Quebec, New Brunswick, Nova Scotia, Prince Edward Island, and Newfoundland and Labrador.
* Based on 87 medicines assessed by iJODR or pCODR between March 1, 2007, and March 31, 2019.
Data source: Coverage status - Publicly available data including the pCODR and RAMQ websites, March/April 2020; National sales - IQVIA Canadian Drugstore and Hospital Purchases Audit (CDH) database, 2019.
3. Oncology medicine funding in Canada
There are some sizeable differences in overall provincial spending and payer split for the selected oncology medicines. Per capita spending and the oncology share of the pharmaceutical market are varied across provinces. Differences in public coverage and drug plan design have created important inconsistencies across the provinces in terms of payer split and patient contributions.
When total public and private sales of the select oncology medicines were considered, most of the provinces with higher coverage rates in public drug programs had lower sales per capita than the national average of $8.3 million per 100,000 people. Manitoba and Saskatchewan, which had some of the highest listing rates, spent the least on the select oncology medicines, together with Alberta, while New Brunswick and Quebec were among the jurisdictions with the highest sales per capita.
A comparison of sales per capita for hospital and take-home oncology medicines demonstrated that the top provinces in spending for hospital medicines were also at the top for per capita spending on take-home medicines. New Brunswick and Quebec ranked first and second for both categories, while Prince Edward Island & Newfoundland and Labrador were third for hospital medicines but sixth for take-home medicines.
The variation in per capita spending across provinces may be influenced by differences in the model of cancer care, drug plan designs, policies, clinical practice, demographics, and disease profiles of the provincial population. These factors are outside the scope of this study.
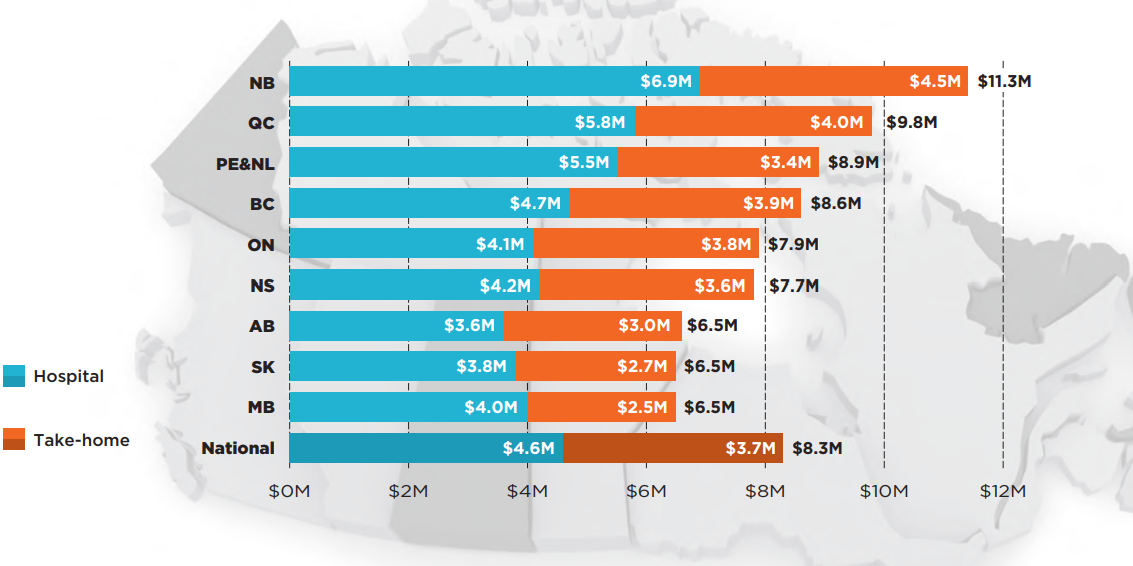
Figure description
This bar graph, shown over a map of the Canadian provinces, gives the provincial sales for hospital and take-home oncology medicines per 100,000 population in the jurisdiction. A total for each province is also given, as well as the national total. Prince Edward Island & Newfoundland and Labrador are reported together in the IQVIA Canadian Drugstore and Hospital Purchases Audit (CDH) Database and have therefore been combined for this analysis.
| Sales for hospital medicines (in millions of dollars) | Sales for take-home medicines (in millions of dollars) | Total sales for oncology medicines (in millions of dollars) | |
|---|---|---|---|
| New Brunswick | $6.9 | $4.5 | $11.3 |
| Quebec | $5.8 | $4.0 | $9.8 |
| Prince Edward Island and Newfoundland and Labrador | $5.5 | $3.4 | $8.9 |
| British Columbia | $4.7 | $3.9 | $8.6 |
| Ontario | $4.1 | $3.8 | $7.9 |
| Nova Scotia | $4.2 | $3.6 | $7.7 |
| Alberta | $3.6 | $3.0 | $6.5 |
| Saskatchewan | $3.8 | $2.7 | $6.5 |
| Manitoba | $4.0 | $2.5 | $6.5 |
| National | $4.6 | $3.7 | $8.3 |
Note: Prince Edward Island and Newfoundland and Labrador are reported together in the IQVIA Canadian Drugstore and Hospital Purchases Audit (CDH) database and have therefore been combined for this analysis
* Based on 87 medicines assessed by iJODR or pCODR between March 1, 2007, and March 31, 2019. Only medicines with available national sales in 2019 were considered for this figure.
Data source: National and provincial sales - IQVIA Canadian Drugstore and Hospital Purchases Audit (CDH) database, 2019.
Despite high alignment in public coverage, there were some provincial variations in spending for the selected oncology medicines funded through a mix of provincial drug programs and/or private drug plans. Figure 3.2 captures the combined effect of public/private coverage decisions for these medicines. Eligibility requirements and other factors may affect access to public and private drug programs in each province. Overall results indicated that oncology medicines accounted for a higher share of pharmaceutical spending in British Columbia, Quebec, and New Brunswick. Private drug plans pay considerably less (3.8%) than the combined public/private sector (9.9%).
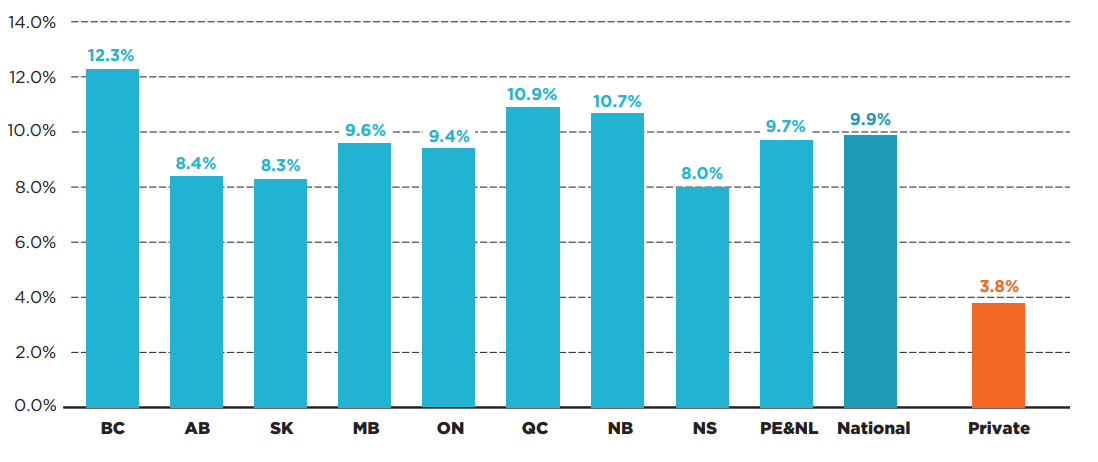
Figure description
This bar graph gives the oncology medicine share of total public and private pharmaceutical sales for each province in 2019. A national share is provided, as well as a share for private-only sales. Prince Edward Island & Newfoundland and Labrador are reported together in the IQVIA Canadian Drugstore and Hospital Purchases Audit (CDH) Database and have therefore been combined for this analysis.
| Oncology medicine share of total sales | |
|---|---|
| British Columbia | 12.3% |
| Alberta | 8.4% |
| Saskatchewan | 8.3% |
| Manitoba | 9.6% |
| Ontario | 9.4% |
| Quebec | 10.9% |
| New Brunswick | 10.7% |
| Nova Scotia | 8.0% |
| Prince Edward Island and Newfoundland and Labrador | 9.7% |
| National | 9.9% |
| Private | 3.8% |
Note: Prince Edward Island and Newfoundland and Labrador are reported together in the IQVIA Canadian Drugstore and Hospital Purchases Audit (CDH) database and have therefore been combined for this analysis.
* Based on 87 medicines assessed by iJODR or pCODR between March 1, 2007, and March 31, 2019.
Data source: National and provincial sales - IQVIA Canadian Drugstore and Hospital Purchases Audit (CDH) database, 2019; Private plans – IQVIA Private drug plan (PDP) database, 2019.
Oncology medicines administered in hospitals are universally covered by hospital budgets in Canada, though there may be medicines from our selection that the hospital formularies do not list. For this reason, an average of 96% of the selected medicines were paid by public budgets in 2019 and only 4% by private payers (Figure 3.3). Provinces uniformly paid 95% or more of sales for hospital-based oncology medicines.
The data shows greater variability in the reimbursement of take-home oncology medicines. The public drug plans in the western provinces—where provincial cancer agencies offer universal and first dollar coverage for all cancer medicines1—paid 83% to 88% of costs for take-home oncology medicines in 2019. Quebec, which offers universal coverage but requires premiums based on age and income in a mandatory insurance environment, paid for 70% of the medicines from public budgets, while Ontario and the Atlantic provinces are not as comprehensive in terms of coverage, resulting in greater contributions from private insurers. Ontario public programs paid just over 60% of take-home oncology medicine sales and the Atlantic provinces paid less than 50% of the total sales.
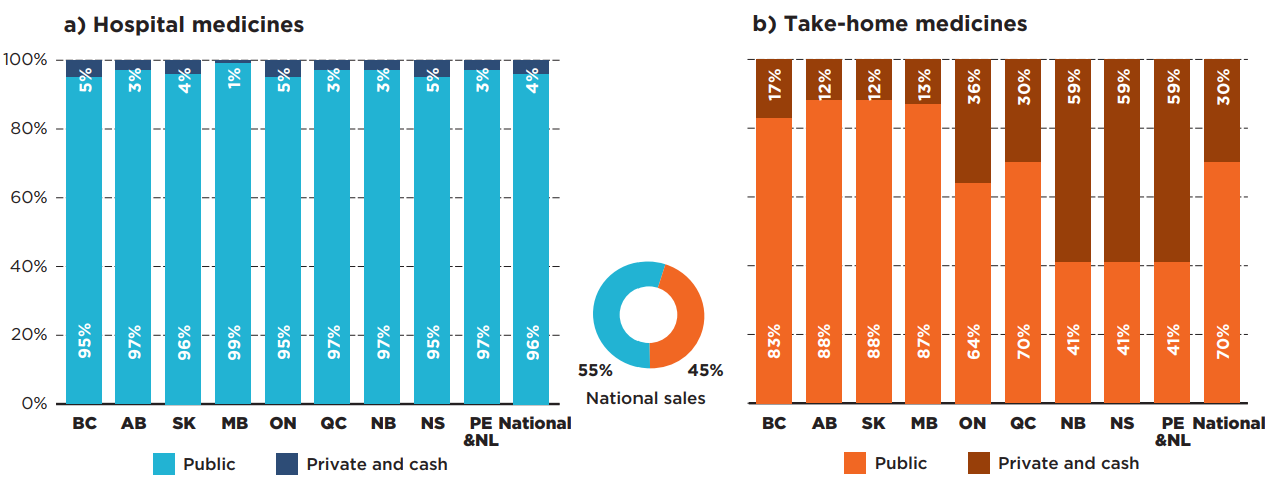
Figure description
Two stacked bar graphs give the distribution of spending by payer for a) hospital and b) take-home oncology medicines. The public payer and private or cash share is provided for each province as well as a national total. Prince Edward Island & Newfoundland and Labrador are reported together in the IQVIA Canadian Drugstore and Hospital Purchases Audit (CDH) Database and have therefore been combined for this analysis.
a) Hospital oncology medicines
These medicines accounted for 55% of national sales for oncology medicines.
| Public plan share of spending | Private plan and cash share of spending | |
|---|---|---|
| British Columbia | 95% | 5% |
| Alberta | 97% | 3% |
| Saskatchewan | 96% | 4% |
| Manitoba | 99% | 1% |
| Ontario | 95% | 5% |
| Quebec | 97% | 3% |
| New Brunswick | 97% | 3% |
| Nova Scotia | 95% | 5% |
| Prince Edward Island and Newfoundland and Labrador | 97% | 3% |
| National | 96% | 4% |
b) Take-home oncology medicines
These medicines accounted for 45% of national sales for oncology medicines.
| Public plan share of spending | Private plan and cash share of spending | |
|---|---|---|
| British Columbia | 83% | 17% |
| Alberta | 88% | 12% |
| Saskatchewan | 88% | 12% |
| Manitoba | 87% | 13% |
| Ontario | 64% | 36% |
| Quebec | 70% | 30% |
| New Brunswick | 41% | 59% |
| Nova Scotia | 41% | 59% |
| Prince Edward Island and Newfoundland and Labrador | 41% | 59% |
| National | 70% | 30% |
Note: Note: Prince Edward Island and Newfoundland and Labrador are reported together in the IQVIA Canadian Drugstore and Hospital Purchases Audit (CDH) database and have therefore been combined for this analysis.
* PMPRB estimates based on various data sources.
† Based on 87 medicines (40 hospital and 47 take-home) assessed by iJODR or pCODR between March 1, 2007, and March 31, 2019; medicines with other non-oncology indications were excluded from the estimates.
Data source: National and provincial sales - IQVIA Canadian Drugstore and Hospital Purchases Audit (CDH) database, 2019; Private plans - IQVIA Private Drug Plan (PDP) database, 2019; Public plans – CIHI NPDUIS database, 2019; Retail sales by payer – IQVIA Payer Insights database, 2019.
Overall results for all 87 oncology medicines analyzed were greatly impacted by the significant interprovincial variability in sources of funding for take-home medicines. As shown in Figure 3.4, public payers in the western provinces paid more than 90% of oncology medicine spending in 2019, while those in Ontario and Quebec paid less, but still held a relatively high share of spending, at 78% and 84%, respectively. Public spending in the Atlantic provinces was lower, at approximately 70%.
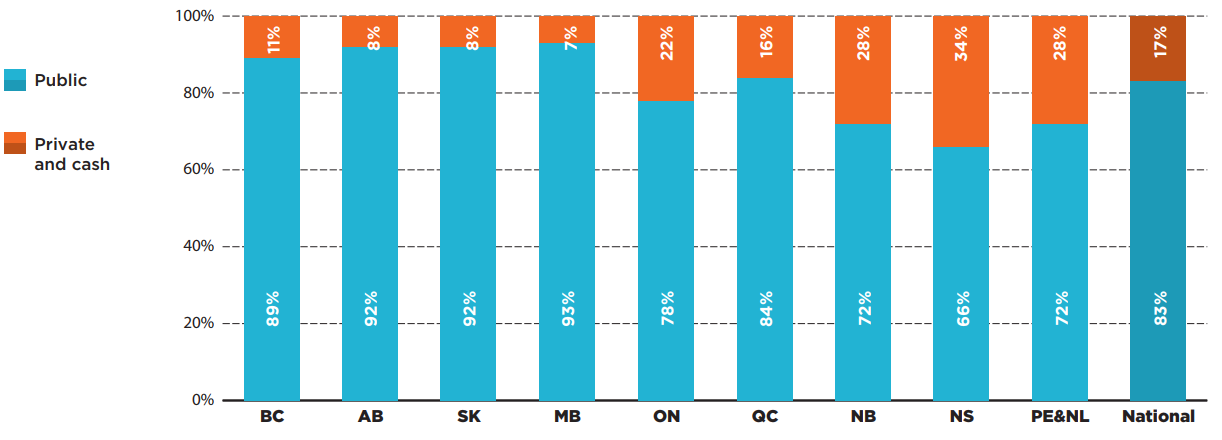
Figure description
A stacked bar graph gives the distribution of total spending on oncology medicines by payer in each province in 2019. A national total is also provided. Prince Edward Island & Newfoundland and Labrador are reported together in the IQVIA Canadian Drugstore and Hospital Purchases Audit (CDH) Database and have therefore been combined for this analysis.
| Public plan share of spending | Private plan and cash share of spending | |
|---|---|---|
| British Columbia | 89% | 11% |
| Alberta | 92% | 8% |
| Saskatchewan | 92% | 8% |
| Manitoba | 93% | 7% |
| Ontario | 78% | 22% |
| Quebec | 84% | 16% |
| New Brunswick | 72% | 28% |
| Nova Scotia | 66% | 34% |
| Prince Edward Island and Newfoundland and Labrador | 72% | 28% |
| National | 83% | 17% |
Note: Prince Edward Island and Newfoundland and Labrador are reported together in the IQVIA Canadian Drugstore and Hospital Purchases Audit (CDH) database and have therefore been combined for this analysis.
* PMPRB estimates based on various data sources.
† Based on 87 medicines assessed by iJODR or pCODR between March 1, 2007, and March 31, 2019; medicines with other non-oncology indications were excluded from the estimates.
Data source: National and provincial sales - IQVIA Canadian Drugstore and Hospital Purchases Audit (CDH) database, 2019; Private plans - IQVIA Private Drug Plan (PDP) database, 2019; Public plans – CIHI NPDUIS database, 2019; Retail sales by payer – IQVIA Payer Insights database, 2019.
Given the inconsistencies in funding sources in Canadian provinces, the financial burden to patients can also vary significantly across the country. The western provinces with universal coverage for all oncology medicines do not require any associated out-of-pocket payments from patients regardless of where the cancer treatments are delivered. Unlike hospital medicines, take-home treatments in other provinces may be associated with out-of-pocket costs such as co-payments and deductibles in both public and private plans. Cost-sharing can pose affordability challenges for many patients, given the high costs of many of these medicines8.
Patients covered by the public drug plans in New Brunswick and Ontario paid 0.3% and 0.7% for their take-home oncology drug costs, respectively, while the patient contributions in Nova Scotia, Prince Edward Island, and Newfoundland and Labrador were notably higher, up to 12.8% of the prescription drug costs.
Privately insured patients paid more for their oncology medications than beneficiaries in the public drug plans across nearly all provinces. Figure 3.5 illustrates the percentage of co-payments and/or deductibles in Canadian provinces by payer type. Although private programs took on a smaller share of spending in provinces with universal coverage for oncology medicines, their co-payment shares were much higher than in the other provinces, ranging from 9.7% in British Columbia to 16.8% in Manitoba.
The results for both public and private programs do not reflect premiums that patients may pay for some plans or contributions from other sources, which may have a significant impact on comparability of patient contributions across jurisdictions.
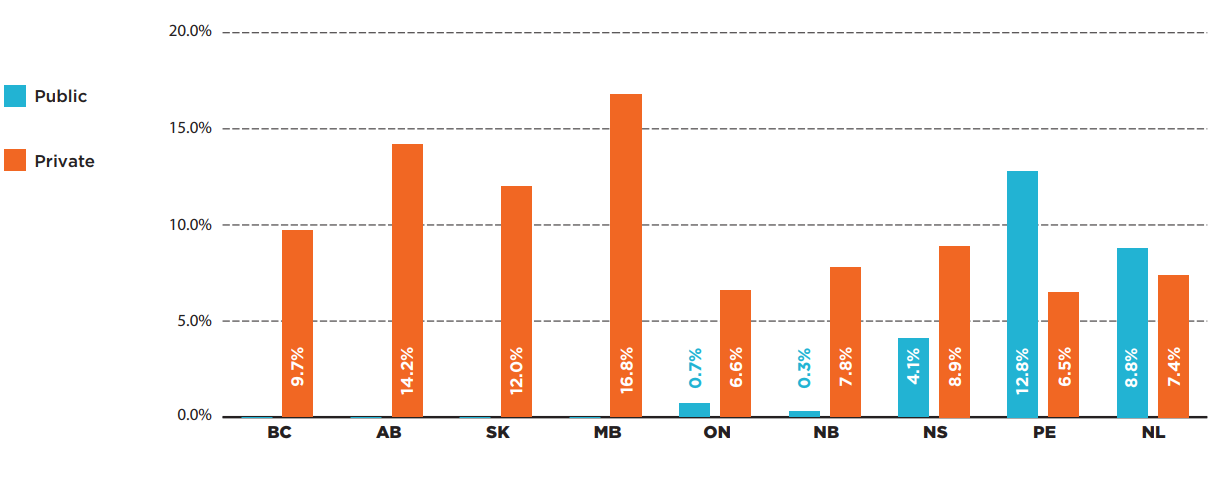
Figure description
This bar graph provides the patient co-payment share of oncology drug costs in each province, for public plans as well as private plans in provinces with available data. Quebec public drug plan data was not available, while the private data for Quebec has the limitations restricting calculating co-payments.
| Patient co-payments in public plans | Patient co-payments in private plans | |
|---|---|---|
| British Columbia | 9.7% | – |
| Alberta | 14.2% | – |
| Saskatchewan | 12.0% | – |
| Manitoba | 16.8% | – |
| Ontario | 6.6% | 0.7% |
| New Brunswick | 7.8% | 0.3% |
| Nova Scotia | 8.9% | 4.1% |
| Prince Edward Island | 6.5% | 12.8% |
| Newfoundland and Labrador | 7.4% | 8.8% |
Note: Quebec public drug plan data was not available, while the private plan data had limitations that restricted the calculation of co-payments.
* Take-home medicines, a subgroup of 87 medicines assessed by iJODR or pCODR between March 1, 2007, and March 31, 2019.
Data sources: Private plans - IQVIA Private Drug Plan (PDP) database, 2019; Public plans – CIHI NPDUIS database, 2019.
The lowest co-payment amounts were found in the New Brunswick public drug plan, at an average of $79 per patient per medicine in 2019, while public beneficiaries in Newfoundland and Labrador paid the highest contribution to their oncology drug cost, at an average of $2,835.
On average, the privately insured patients paid between $1,276 in Alberta and $3,342 in Manitoba. The maximum co-payments per medicine in private plans were high in most provinces, with the top levels recorded in Manitoba ($14,825).
Table 3.1. Average co-payments per patient and medicine in public and private drug plans, select oncology medicines*, 2019
| BC | AB | SK | MB | ON | NB | NS | PE | NL | ||
|---|---|---|---|---|---|---|---|---|---|---|
| Public | Average | N/A | N/A | N/A | N/A | $210 | $79 | $1,102 | $2,210 | $2,835 |
| Maximum | N/A | N/A | N/A | N/A | $863 | $135 | $6,795 | $4,911 | $8,258 | |
| Private | Average | $1,674 | $1,276 | $1,664 | $3,342 | $1,288 | $2,661 | $2,530 | $1,796 | $2,526 |
| Maximum | $11,809 | $4,573 | $3,074 | $14,825 | $8,353 | $5,083 | $9,398 | $3,254 | $5,942 | |
Note: The co-payments were calculated from the available public and private drug plan data as the total prescription minus plan-paid amounts, where available. Quebec public drug plan data was not available, while the private data had limitations that restricted the calculation of co-payments.
* Take-home medicines, a subgroup of 87 medicines assessed by iJODR or pCODR between March 1, 2007, and March 31, 2019.
Data source: Private plans - IQVIA Private Drug Plan (PDP) database, 2019; Public plans – CIHI NPDUIS database, 2019.
References
- Health Canada. 2020. Prescription drug insurance coverage. December 3, 2020. Government of Canada. Available: https://www.canada.ca/en/health-canada/services/health-care-system/pharmaceuticals/access-insurance-coverage-prescription-medicines.html
- Health Canada. 2019. A Prescription for Canada: Achieving Pharmacare for All, Final Report of the Advisory Council on the Implementation of National Pharmacare. Ottawa, ON: Government of Canada. Available: https://www.canada.ca/en/health-canada/corporate/about-health-canada/public-engagement/external-advisory-bodies/implementation-national-pharmacare/final-report.html
- Canadian Agency for Drugs and Technologies in Health. 2014. Drugs reviewed under the Joint Oncology Drug Review Process from 2007 to 2011 Provincial Funding Summary. ON, Canada: CADTH. Available: https://www.cadth.ca/sites/default/files/pcodr/pcodr-ijodr-drugs-provfund.pdf
- Cancer Care Ontario. 2021. Drug Formulary: Public Drug Funding and Administration in Canada. Toronto, ON: CCO. Available: https://www.cancercareontario.ca/en/cancer-treatments/chemotherapy/funding-reimbursement/public-drug-funding-administration-canada
- Cancer Care Ontario. 2021. Drug Formulary: Report on Take-Home Cancer Medications. Toronto, ON: CCO. Available: https://www.cancercareontario.ca/en/cancer-treatments/chemotherapy/funding-reimbursement/report-take-home-cancer-medications
- Sorin M, Franco EL, Quesnel-Vallée A. 2019. Inter- and intraprovincial inequities in public coverage of cancer drug programs across Canada: a plea for the establishment of a pan-Canadian pharmacare program. Curr. Oncol. 26(4):266-2 doi: 10.3747/co.26.4867
- Canadian Cancer Society. 2021. Access to cancer drugs and diagnostics. Toronto, ON: CCS. Available: https://action.cancer.ca/en/get-involved/advocacy/what-we-are-doing/drug-access
- Organisation for Economic Co-operation and Development. 2020. Addressing Challenges in Access to Oncology Medicines, Analytical Report. Paris, France: OECD. Available: https://www.oecd.org/health/health-systems/Addressing-Challenges-in-Access-to-Oncology-Medicines-Analytical-Report.pdf
- Patented Medicine Prices Review Board. 2020. Oncology Medicines in Canada, Trends and International Comparisons, 2010–2019. Ottawa, ON: PMPRB. Available: https://www.canada.ca/en/patented-medicine-prices-review/services/npduis/analytical-studies/oncology-medicines-trends-international-comparisons.html
- Health Canada. 2019. Guidance Document: Regulatory Requirements for Drug Identification Numbers (DINs). Ottawa, ON: Government of Canada. Available: https://www.canada.ca/en/health-canada/services/drugs-health-products/drug-products/applications-submissions/guidance-documents/regulatory-requirements-drug-identification-numbers/document.html
- Pardhan A, Vu K, Gallo-Hershberg D, Forbes L, Gavura S, Kukreti V. 2019. Enhancing the Delivery of Take-Home Cancer Drugs in Ontario. Cancer Care Ontario. Available: https://www.cancercareontario.ca/sites/ccocancercare/files/guidelines/full/1_CCO_THCD_Report_25Apr2019.pdf
Supporting literature
de Oliveira C, Weir S, Rangrej J, et al. 2018. The economic burden of cancer care in Canada: a population-based cost study. CMAJ Open. 6(1):E1-E10. doi: 10.9778/cmajo.20170144
Brandt J, Shearer B, Morgan SG. 2018. Prescription drug coverage in Canada: a review of the economic, policy and political considerations for universal pharmacare. J of Pharm Policy and Pract. 11:28. doi: 10.1186/s40545-018-0154-x
Morgan S., Hanley G., Raymond C., Blais R. 2009. Breadth, Depth and Agreement Among Provincial Formularies in Canada. Health Policy. 4(4):E162-E184. Available: https://www.ncbi.nlm.nih.gov/pmc/articles/PMC2700711/
Taylor DW. 2014. Benefits Outweigh Costs in Universal Healthcare: Business Case for Reimbursement of Take-home Cancer Medicines in Ontario and Atlantic Canada. J. Med. Sci. 4(4): 126-138. doi: 10.5923/j.ajmms.20140404.05
Appendix A: Funding of oncology medicines in Canada, by province and delivery of care
| Province | Hospital oncology medicines | Take-home oncology medicines |
|---|---|---|
| British Columbia |
Funding: Medications for active cancer treatment are funded by BC Cancer for all BC Medical Services Plan patients (including First Nations Health Authority clients). These medications are supplied at no charge to registered BC cancer patients at BC Cancer Centres and Clinics.
Formulary: British Columbia Cancer Agency Benefit Drug List |
|
| Alberta |
Funding: Cancer patients may receive treatment at cancer centres, their community hospitals, or at home. Alberta Health Services provides cancer drugs specified in the Outpatient Cancer Drug Benefit Program, at no charge, to eligible residents for the treatment of cancer. Formulary: Alberta Health Services https://www.albertahealthservices.ca/assets/programs/ps-1025651-drug-benefit-list.pdf |
|
| Saskatchewan |
Funding: The Cancer Agency through funding from the government of Saskatchewan pays for all approved cancer drugs for patients with a valid health card and registered with the Cancer Agency. This includes drugs administered by injection or oral cancer treatments taken at home. Formulary: Saskatchewan Cancer Agency Drug Formulary http://www.saskcancer.ca/health-professionals-article/drug-formulary |
|
| Manitoba |
Funding: CancerCare Manitoba covers in- and outpatient cost of injectable and oral treatments no matter where they are taken. Formularies: For oral drugs, Manitoba Home Cancer Drug Program https://www.gov.mb.ca/health/pharmacare/healthprofessionals.html |
|
| Ontario |
Several payment sources exist for cancer drugs in Ontario. Cancer drugs may be covered by hospitals, public funding programs, or by the patient through third-party insurance and/or out-of-pocket costs. |
|
|
Funding: Ontario Health (Cancer Care Ontario) administers injectable cancer drug funding for outpatient use on behalf of the Ontario Ministry of Health. The cost of most newer injectable cancer drugs administered for outpatient use through the hospitals and regional cancer centres are funded through the New Drug Funding Program (NDFP). Funding options are also available for outpatient use through the Evidence Building Program (EBP) and Case-by-Case Review Program (CBCRP). Almost all inpatient use is assumed by individual hospital budgets. Formulary: NDFP Drug Formulary https://www.cancercareontario.ca/en/cancer-treatments/chemotherapy/drug-formulary |
Funding: Take-home cancer drugs are funded through the Ontario Drug Benefit (ODB) Exceptional Access Program (EAP) for eligible program recipients. Funding options are also available through CBCRP. Formularies:
https://www.formulary.health.gov.on.ca/formulary/ Note: EAP does not have formulary. The link provided below is for a list of frequently requested EAP drugs, which include take-home cancer drugs. This list is updated regularly but does not include all drugs considered for funding through EAP. http://health.gov.on.ca/en/pro/programs/drugs/docs/frequently_requested_drugs.pdf |
|
| New Brunswick |
Funding: All approved drugs administered in hospital to patients with a valid health card are covered by the province. |
Funding: Take-home cancer drugs are covered by the New Brunswick Drug Plans for eligible beneficiaries. Patients not covered by the New Brunswick Drug Plans may have private insurance coverage. Formulary: New Brunswick Drug Plans Formulary |
| Nova Scotia |
Funding: The injectable drugs administered in a hospital setting are funded 100% by the provincial government. |
Funding: For oral cancer drugs and take-home injectables, the patient must cover the drug under public or private insurance and pay deductibles. Formularies: Nova Scotia Formulary https://novascotia.ca/dhw/pharmacare/documents/formulary.pdf Exception Status Drugs https://novascotia.ca/dhw/pharmacare/documents/Criteria-for-Exception-Status-Coverage.pdf |
| Prince Edward Island |
Funding: Injectable cancer medications covered under the Cancer Treatment Centre Formulary and administered at PEI oncology sites or other approved hospital sites are covered through Health PEI at no cost to the patient. Formulary: Cancer Treatment Centre Formulary https://www.princeedwardisland.ca/sites/default/files/publications/oncologyformulary.pdf |
Funding: Cancer drugs that are routinely dispensed from community pharmacies are funded by private insurance plans first, and then one or more PEI Pharmacare programs. Formulary: PEI Pharmacare Formulary https://www.princeedwardisland.ca/sites/default/files/publications/pei_pharmacare_formulary.pdf |
| Newfoundland and Labrador |
Funding: The injectable drugs administered in a hospital setting are funded 100% by the provincial government. |
Funding: For oral cancer drugs and take-home injectables, the patient must cover the drug under public or private insurance and pay deductibles. Drugs not covered on the basic NLPDP formulary, for eligible beneficiaries, can be assessed for coverage by special authorization. Formularies:
Special Authorization Drug Products
|
| Quebec |
Funding: All medications administered in the hospitals are covered by the province for all patients. Each hospital has a formulary. Formulary:
|
Funding: Medications that are taken at home may be covered by the provincial drug benefit plan or by private insurance plans. Formulary:
|
Note: In some cases, compassionate access oncology medicines may be available in individual provinces. Special access programs may also be used to provide access to medicines not approved in Canada.
Appendix B: Oncology medicines included in the study
| Trade Name | Medicinal ingredient(s) | Trade Name | Medicinal ingredient(s) |
|---|---|---|---|
| Abraxane | Nab paclitaxel | Lonsurf | Trifluridine and tipiracil |
| Adcetris | Brentuximab vedotin | Lynparza | Olaparib |
| Afinitor | Everolimus | MabCampath | Alemtuzumab |
| Alecensaro | Alectinib | Mekinist | Trametinib |
| Alimta | Pemetrexed | Metvix | Methyl aminolevulinate |
| Avastin | Bevacizumab | Nexavar | Sorafenib |
| Bavencio | Avelumab | Onivyde | Irinotecan liposome |
| Besponsa | Inotuzumab ozogamicin | Opdivo | Nivolumab |
| Blincyto | Blinatumomab | Perjeta | Pertuzumab |
| Bosulif | Bosutinib | Pomalyst | Pomalidomide |
| Cabometyx | Cabozantinib | Proleukin | Aldesleukin (IL-2) |
| Caelyx | Pegylated liposomal doxorubicin | Revlimid | Lenalidomide |
| Caprelsa | Vandetanib | Rituxan | Rituximab |
| Cotellic | Cobimetinib | Rydapt | Midostaurin |
| Cyramza | Ramucirumab | Sprycel | Dasatinib |
| Darzalex | Daratumumab | Stivarga | Regorafenib |
| Docetaxel | Docetaxel | Sutent | Sunitinib malate |
| Erbitux | Cetuximab | Sylvant | Siltuximab |
| Erivedge | Vismodegib | Tafinlar | Dabrafenib |
| Erleada | Apalutamide | Tagrisso | Osimertinib |
| Faslodex | Fulvestrant | Tarceva | Erlotinib |
| Firmagon | Degarelix | Tasigna | Nilotinib |
| Fludara | Fludarabine | Tecentriq | Atezolizumab |
| Gazyva | Obinutuzumab | Thalomid | Thalidomide |
| Giotrif | Afatinib | Thyrogen | Thyrotropin alfa |
| Gleevec | Imatinib | Torisel | Temsirolimus |
| Halaven | Eribulin mesylate | Treanda | Bendamustine hydrochloride |
| Herceptin | Trastuzumab | Trisenox | Arsenic trioxide |
| Hycamtin | Topotecan | Tykerb | Lapatinib |
| Ibrance | Palbociclib | Unituxin | Dinutuximab |
| Iclusig | Ponatinib | Vectibix | Panitumumab |
| Imbruvica | Ibrutinib | Velcade | Bortezomib |
| Inlyta | Axitinib | Venclexta | Venetoclax |
| Iressa | Gefitinib | Vidaza | Azacitidine |
| Istodax | Romidepsin | Votrient | Pazopanib hydrochloride |
| Jakavi | Ruxolitinib | Xalkori | Crizotinib |
| Jevtana | Cabazitaxel | Xeloda | Capecitabine |
| Kadcyla | Trastuzumab emtansine | Xtandi | Enzalutamide |
| Keytruda | Pembrolizumab | Yervoy | Ipilimumab |
| Kisqali | Ribociclib | Yondelis | Trabectedin |
| Kyprolis | Carfilzomib | Zelboraf | Vemurafenib |
| Lartruvo | Olaratumab | Zydelig | Idelalisib |
| Lenvima | Lenvatinib | Zykadia | Ceritinib |
| Zytiga | Abiraterone acetate |