
Meds Entry Watch 7th Edition
Erratum
The report has been revised to include a correction to Table D1 “Medicines First Approved in Canada in 2020, Availability, Sales, and Prices as of Q4-2021”. The trade name “Cuprior” which was previously associated with the medicine “trientine” has been replaced with “MAR-Trientine”. The purpose of this correction is to associate the medicine with the product that is sold in Canada rather than the highest-selling product in the PMPRB11. Cuprior is not approved or sold in Canada.
The following note that can be found under Table B1 and Table C1 has now been added to Table D1: “Availability and sales information refer to all forms and strengths of the medicine, while pricing and treatment costs are based on the highest-selling form and strength indicated. Sales are based on manufacturer list prices.”
ISSN 2560-6204
Cat. No.: H79-12E-PDF
August 2023
Figures
- Figure A1: New medicines approved by the US FDA, the EMA, and/or Health Canada, 2016 to 2021
- Figure A2: New medicine cumulative share of all brand-name medicine sales by year of approval (2016 to 2020), Canada and the PMPRB11*
- Figure A3: Share of new medicines* from 2016 to 2020 with available sales and their respective share of OECD sales, by country, Q4-2021
- Figure A4: Health Canada review status of new active substances (NAS) with an international approval between 2016 and 2020
- Figure A5: Distribution of 2016-2020 new active substances not submitted for Health Canada review by number of PMPRB11 countries with sales in 2021
- Figure B1: Number of 2020 new medicines with market approval as of Q4-2020 and Q4-2021
- Figure B2: Number of 2020 new medicines with available sales and their respective share of OECD sales, by country, Q4-2021
- Figure B3: Distribution of 2020 new approvals for specialty medicines
- Figure B4: Distribution of new medicines approved in 2020 by treatment cost
- Figure B5: Number of COVID-19 medicines approved and in the pipeline at the end of 2021
- Figure C1: Number of 2021 medicines with market approval as of Q4-2021 and Q3-2022
- Figure C2: Distribution of 2021 new approvals for specialty medicines
- Figure D1: Annual approvals for new medicines in Canada, 2016 to 2021
Tables
- Table B1: New medicines approved in 2020, availability, share of sales, prices, and treatment costs, ranked by therapeutic class share of sales, Q4-2021
- Table B2: Assessments, recommendations, and reimbursement decisions for 2020 new medicines approved in Canada by Q3-2022
- Table B3: Summary of Reimbursement Review assessments for 2020 new medicines approved in Canada by Q3-2022
- Table B4: COVID-19 treatment and prevention medicines approvals 2020-2021
- Table C1: New medicines approved in 2021, availability, prices, and treatment costs, Q4-2021
- Table D1: Medicines first approved in Canada in 2020, availability, sales, and prices as of Q4-2021
About the PMPRB
The Patented Medicine Prices Review Board (PMPRB) is an independent quasi-judicial body established by Parliament in 1987. The PMPRB has a dual regulatory and reporting mandate: to ensure that prices at which patentees sell their patented medicines in Canada are not excessive; and to report on pharmaceutical trends of all medicines and on research and development spending by patentees.
The NPDUIS Initiative
The National Prescription Drug Utilization Information System (NPDUIS) is a research initiative established by federal, provincial, and territorial Ministers of Health in September 2001. It is a partnership between the PMPRB and the Canadian Institute for Health Information (CIHI).
Pursuant to section 90 of the Patent Act, the PMPRB has the mandate to conduct analysis that provides decision makers with critical information and intelligence on price, utilization, and cost trends so that Canada’s health care system has more comprehensive and accurate information on how medicines are being used and on sources of cost pressures.
The specific research priorities and methodologies for NPDUIS are established with the guidance of the NPDUIS Advisory Committee and reflect the priorities of the participating jurisdictions, as identified in the NPDUIS Research Agenda. The Advisory Committee is composed of representatives from public drug plans in British Columbia, Alberta, Saskatchewan, Manitoba, Ontario, New Brunswick, Nova Scotia, Prince Edward Island, Newfoundland and Labrador, Yukon, the Non-Insured Health Benefits Program (NIHB), and Health Canada. It also includes observers from CIHI, the Canadian Agency for Drugs and Technologies in Health (CADTH), the Ministère de la Santé et des Services sociaux du Québec (MSSS), and the pan-Canadian Pharmaceutical Alliance (pCPA) Office.
Acknowledgements
This report was prepared by the Patented Medicine Prices Review Board (PMPRB) as part of the National Prescription Drug Utilization Information System (NPDUIS) initiative.
The PMPRB wishes to acknowledge and thank the members of the NPDUIS Advisory Committee for their expert oversight and guidance in the preparation of this report. Please note that the statements, findings, and conclusions do not necessarily reflect those of the members or their organizations.
Appreciation goes to Blake Wladyka for leading this project, as well as to Tanya Potashnik and Kevin Pothier for their oversight in the development of the report. The PMPRB also wishes to acknowledge the contributions of Dr. Étienne Gaudette to the analysis and the editorial contributions of Shirin Paynter.
Disclaimer
NPDUIS operates independently of the regulatory activities of the Board of the PMPRB. The research priorities, data, statements, and opinions expressed or reflected in NPDUIS reports do not represent the position of the PMPRB with respect to any regulatory matter. NPDUIS reports do not contain information that is confidential or privileged under sections 87 and 88 of the Patent Act, and the mention of a medicine in an NPDUIS report is not and should not be understood as an admission or denial that the medicine is subject to filings under sections 80, 81, or 82 of the Patent Act or that its price is or is not excessive under section 85 of the Patent Act.
Although this information is based in part on data obtained under license from the MIDAS® Database proprietary to IQVIA Solutions Canada Inc. and/or its affiliates ("IQVIA"), the statements, findings, conclusions, views, and opinions expressed in this report are exclusively those of the PMPRB and are not attributable to IQVIA.
Contact Information
Patented Medicine Prices Review Board
Standard Life Centre
Box L40
333 Laurier Avenue West
Suite 1400
Ottawa, ON K1P 1C1
Tel.: 1-877-861-2350
TTY 613-288-9654
Email: PMPRB.Information-Renseignements.CEPMB@pmprb-cepmb.gc.ca
Web: https://www.canada.ca/en/patented-medicine-prices-review.html
Suggested Citation
Patented Medicine Prices Review Board. (2023). Meds Entry Watch, 7th edition. Ottawa: PMPRB.
Executive Summary
This is the seventh edition of the PMPRB’s Meds Entry Watch report, which explores the market entry of new medicines in Canada and other countries. Building on a retrospective analysis of trends since 2017, this report focuses on medicines that received first-time market approval through the US Food and Drug Administration (FDA), the European Medicines Agency (EMA), and/or Health Canada in 2020 and 2021, and analyzes their uptake, pricing, sales, and availability as of the last quarter of 2021 (Q4-2021).
In addition to the international analysis, a Canadian-focused section provides information on medicines that received their first Health Canada approval in 2020, as well as a retrospective review of annual marketing rates over the past five years.
This publication informs decision makers, researchers, and patients of the evolving market dynamics of emerging therapies in Canadian and international pharmaceutical markets.
The IQVIA MIDAS® Database was the primary source for the sales and list prices of new medicines in Canadian and international markets, as well as for the quantity sold.
International markets examined include the Organisation for Economic Co-operation and Development (OECD) members, with a focus on Australia, Belgium, France, Germany, Italy, Japan, the Netherlands, Norway, Spain, Sweden, and the United Kingdom (UK), which will comprise the PMPRB11 comparator countries. Where appropriate, the United States (US) is included to provide additional context.
Key Findings
- Trends in New Medicine Approvals, 2016 to 2021
- From 2016 to 2021, an average of 47 new medicines were approved internationally each year. The five-year orphan and oncology shares of new approvals were 47% and 28%, respectively.
- Two thirds of the new medicines have been submitted for Health Canada approval. Of the medicines not submitted for Health Canada approval, 60% did not record sales in PMPRB11 countries.
- New medicines with Canadian sales accounted for 82% of all new medicine sales in the OECD in Q4-2021, indicating that the higher-selling medicines continue to be among those approved and sold in Canada.
- 2020 New Medicine Approvals and Sales
- In 2020, 50 new medicines were approved by the FDA, the EMA, and/or Health Canada. Of those, 76% had high treatment costs (>$10,000 annually or >$5,000 per 28-day treatment cycle), 58% received an orphan designation, and 36% were oncology medicines.
- Canada ranked fourth among OECD countries in terms of new medicines with sales, despite fewer 2020 new medicines approved in Canada than in the US and Europe.
- Sales of 2020 new medicines were highly concentrated, with remdesivir and rimegepant alone accounting for 59% of OECD sales for new approvals in Q4-2021. While the former was sold in Canada, the latter only showed sales in the US and was undergoing Health Canada review as of the writing of this report.
- 2020 saw the approval of 2 new actives substances indicated for the treatment and prevention of COVID-19: a treatment (remdesivir) and a vaccine class (mRNA COVID-19 vaccines were considered a single medicine).
- 2021 New Medicine Approvals
- In 2021, a five-year high of 55 medicines received first-time market approval through the FDA, the EMA, and/or Health Canada. Of those, three quarters had high treatment costs, 42% received an orphan designation from the FDA and/or the EMA, and 27% were oncology treatments.
- 2021 saw the approval of 8 new medicines indicated for COVID-19, a notable increase from 2020. Moreover, 158 COVID-19 medicines were in phase III clinical trials or pre-registration at the end of 2021.
- Spotlight on Canada
- Canada approved 36 new medicines in 2020 and 43 in 2021. As of Q4-2021, remdesivir and tafamidis were the highest-selling among Canada’s 2020 newly approved medicines with 57% and 24% of new-to-Canada sales, respectively.
Introduction
Meds Entry Watch is an annual PMPRB publication that explores the dynamics of new medicines entering Canadian and international markets, providing information on their availability, sales, and prices.
This report builds on the five previous editions to provide a broad analysis of medicines that have received market approval since 2016, with a special focus on medicines approved in 2020 and 2021. New medicines are identified for each year based on the date of their first market authorization by the US Food and Drug Administration (FDA), the European Medicines Agency (EMA), and/or Health Canada.
The report consists of four main sections: Section A provides an overview of trends from 2016 to 2021; Section B focuses on new medicines that received international market approval in 2020; Section C presents a preliminary analysis of the new medicines approved internationally in 2021; and Section D spotlights Health Canada approvals in 2020.
This publication informs decision makers, researchers, and patients of emerging therapies in Canadian and international pharmaceutical markets.
Methods
This report analyzes new medicines that received first-time market approval from the FDA, the EMA, and/or Health Canada since 2016, with a focus on those approved in 2020 and 2021. A new medicine is selected for analysis if it received market authorization from any of these regulatory bodies during the calendar year for the first time, even if it was not yet listed for reimbursement or if there were no recorded sales in the available source data. For the purposes of this analysis, new medicines are identified at the medicinal ingredient level.
Using these criteria, 230 new medicines were identified as new approvals between 2016 and 2020, including the 50 new approvals in 2020 analyzed in Section B, and 55 medicines identified for the preliminary analysis in 2021 and presented in Section C. The approval of these medicines in Canadian and international markets was assessed as of the third quarter of 2022 (Q3-2022).
The selection of medicines featured in the analysis of the Canadian market in Section D differs from the previous sections. Medicines analyzed in Section D include new and previously marketed medicinal ingredients that received their first Canadian market authorization through Health Canada in 2020. This includes several medicines in the 2020 analysis in Section B, but also encompasses additional medicines that may have received initial approval through the FDA or EMA in previous years but were first approved for the Canadian market in 2020. Marketed status for Canadian approvals was sourced from Health Canada’s Drug Product Database.
International markets examined include the Organisation for Economic Co-operation and Development (OECD) countries, with a focus on Australia, Belgium, France, Germany, Italy, Japan, the Netherlands, Norway, Spain, Sweden, and the United Kingdom (UK), which will comprise the 11 PMPRB Schedule Countries (“PMPRB11”) specified in the amended Patented Medicines Regulations, which came into force July 1, 2022. Results for the United States (US) are also provided for comparison purposes.
The IQVIA MIDAS® Database (all rights reserved) is the main data source for the sales and list prices of new medicines in Canadian and international markets, as well as the volume of units sold. MIDAS® data reflects the national retail and hospital sectors for each country, including all sales (public, private, and out-of-pocket). Sales and volume data encompass all versions of a medicine available in a particular country, produced by any manufacturer in any strength and form. For more information on the MIDAS® Database and other NPDUIS source materials, see the Resources section of the Analytical Studies page on the PMPRB website.
Canadian prices are based on MIDAS® data, if available; otherwise, they are derived from publicly available results of the Reimbursement Review reports published by the Canadian Agency for Drugs and Technologies in Health (CADTH). Treatment costs are calculated using Canadian list prices where possible; if not, the foreign median price is used. Information on dosing regimens is taken from the product monographs published by Health Canada, or if not available, from the FDA or EMA. All medicines were reviewed as of Q3-2022.
Prices and foreign-to-Canadian price ratios are reported for the highest-selling form and strength of each medicine in Canada, or in the PMPRB11 if no Canadian sales were available at the time of the analysis. The foreign-to-Canadian price ratios presented in this report are expressed as an index with the Canadian price set to a value of one and the international median reported relative to this value. For more details on how foreign-to-Canadian price ratios are calculated, see the Resources section of the Analytical Studies page on the PMPRB website.
Prices and sales in foreign currencies are converted into Canadian dollars using the 12-month or 3-month average exchange rate for the year or quarter, respectively.
Limitations
New medicines reported in Sections A, B, and C are selected for analysis based on their date of market approval by the FDA, the EMA, and/or Health Canada. Some of the medicines reported may have earlier approval dates in other countries, such as Australia and Japan, which are governed by other regulatory bodies. Likewise, the medicines included in this analysis do not necessarily represent all of those introduced in 2020 and 2021, as other national regulatory bodies not examined in this report may have approved additional medicines. Nevertheless, as the FDA and EMA represent significant international markets, this is estimated to have little effect on the overall results.
This report reflects the initial market penetration of these new medicines, and their availability and uptake are expected to increase in subsequent years. The availability of a new medicine in each country at any point in time is influenced by a variety of factors including the manufacturer’s business decision to launch, as well as the timing of that decision; the regulatory approval process in place; and the existing market dynamics. Market approval through the EMA does not necessarily mean that the medicine is available in any European country. Likewise, medicines approved through the FDA or Health Canada may not necessarily be marketed, reimbursed, and/or have any recorded sales.
Some medicines with sales may not be reported in the IQVIA MIDAS® Database, and thus, the sales of new medicines may be slightly under-reported. However, as the effect is expected to be approximately consistent across all markets, this should not have an impact on the overall findings.
Canadian and international sales and prices are based on manufacturer list prices as reported in the MIDAS® Database, and do not capture price rebates, managed entry agreements (also known as product listing agreements), dispensing fees, or patient access schemes. The methodology used by MIDAS® for estimating prices varies by country and data availability.
Publicly available prices from the Canadian Agency for Drugs and Technologies in Health (CADTH) are based on the manufacturers’ submitted list prices, which may differ upon market entry.
Aggregated international sales and pricing data are skewed towards the United States and, as a result, the ranking of medicines by international sales generally reflects the order of sales in the US.
The assessment of medicine availability in Canada does not consider non-marketed medicines available through exceptional programs such as the Special Access Program (SAP) for drugs in Canada.
A: Trends in New Medicine Approvals, 2016–2021
This section presents a five-year retrospective review of new medicine approvals and sales. It reports on the number of new medicines approved from 2016 to 2021 and tracks the progress of those approved from 2016 to 2020 through the end of 2021. Sales and pricing information is reported as of Q4-2021.
Specialty medicines such as orphan and oncology treatments make up an important share of the new medicines approved over the past five years. Canada ranked seventh among the PMPRB11 countries and tenth in the OECD in terms of the number of new medicines approved and sold domestically. By the end of 2021, 13% of all brand-name sales in Canada were for medicines first approved by the US FDA, the EMA, or Health Canada between 2016 and 2020.
An average of 47 new medicines received first-time market approval through the FDA, the EMA, and/or Health Canada annually between 2016 and 2021 (Figure A1). In 2020, 50 new medicines were approved, of which over 58% (29) received an orphan designation for at least one indication from the FDA and/or EMA, and approximately one third (18) were indicated to treat cancer.
An additional 55 new medicines were approved in 2021, including slightly lower shares of orphan and oncology treatments: orphan medicines accounted for 42% of new approvals while oncology medicines represented 27%.
Figure A1 New medicines approved by the US FDA, the EMA, and/or Health Canada, 2016 to 2021

Figure A1 - Text version
| 2016 | 2017 | 2018 | 2019 | 2020 | 2021 | |
|---|---|---|---|---|---|---|
| Number of new medicines | 31 | 52 | 51 | 46 | 50 | 55 |
| Share of oncology medicines | 16% | 33% | 31% | 23% | 36% | 27% |
| Share of orphan medicines | 42% | 46% | 59% | 38% | 58% | 42% |
Data source: US Food and Drug Administration, European Medicines Agency, and Health Canada databases.
Figure A2 illustrates the year-over-year uptake in sales for medicines first approved between 2016 and 2020. By Q4-2021, these medicines collectively accounted for 13.4% of the total brand-name pharmaceutical market in Canada and internationally. Medicines that were approved in 2020 represented 0.6% of all branded pharmaceutical sales in Canada and the PMPRB11.
In any given year, the impact of new medicines on pharmaceutical sales depends on their number, therapeutic relevance, and treatment costs. From 2019 to Q4-2021, medicines introduced in 2017 accounted for the largest market shares among new medicines. Q4-2021 sales of new medicines were led by semaglutide, a diabetes medicine approved in 2017, and bictegravir, an HIV medicine approved in 2018.
Figure A2 New medicine cumulative share of all brand-name medicine sales by year of approval (2016 to 2020), Canada and the PMPRB11*
Figure A2a: Canada and the PMPRB11

Figure A2 - Text version
| - | Revenue year | |||||
|---|---|---|---|---|---|---|
| Year of approval | 2017 | 2018 | 2019 | 2020 | 2021 | T4-2021 |
| 2016 | 2.1% | 3.0% | 2.7% | 2.5% | 2.8% | 2.7% |
| 2017 | 0.2% | 2.2% | 3.0% | 4.1% | 5.4% | 5.9% |
| 2018 | 0.0% | 0.1% | 0.6% | 1.5% | 2.1% | 2.3% |
| 2019 | 0.0% | 0.0% | 0.1% | 0.5% | 1.5% | 1.9% |
| 2020 | 0.0% | 0.0% | 0.0% | 0.1% | 0.4% | 0.6% |
| New medicine share of sales | 2.4% | 5.3% | 6.4% | 8.7% | 12.2% | 13.4% |
Of the 230 medicines approved from 2016 to 2020, 76 (33%) had sales in Canada by Q4-2021 (Figure A3). Canada’s proportion of new medicines with sales was higher than the OECD median of 31% but ranked below the 37% median for PMPRB11 countries, all of which have lower average prices for patented medicines than Canada (PMPRB 2022a). The new medicines sold in Canada accounted for 82% of the OECD sales for all new medicines analyzed, representing the tenth-highest share in the OECD, above the median of 78%. These findings are consistent with those observed in previous editions of Meds Entry Watch and show that most of the top-selling new medicines in the OECD are being sold in Canada. Similar results have also been found in targeted analyses of the expensive drugs for rare diseases and oncology market segments (PMPRB 2020; 2022b).
Figure A2b: Canada
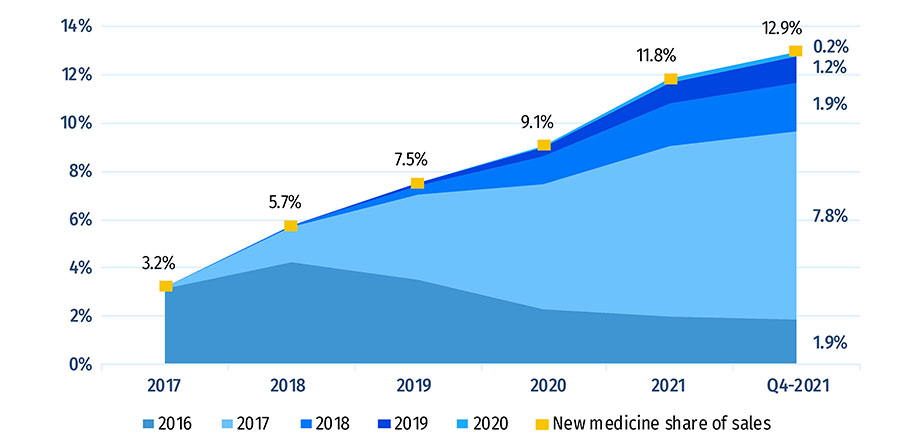
Figure A3 - Text version
| - | Revenue year | |||||
|---|---|---|---|---|---|---|
| Year of approval | 2017 | 2018 | 2019 | 2020 | 2021 | 2021 |
| 2016 | 3.2% | 4.2% | 3.5% | 2.3% | 2.0% | 1.9% |
| 2017 | 0.0% | 1.5% | 3.5% | 5.2% | 7.0% | 7.8% |
| 2018 | 0.0% | 0.0% | 0.4% | 1.2% | 1.8% | 1.9% |
| 2019 | 0.0% | 0.0% | 0.1% | 0.4% | 0.9% | 1.2% |
| 2020 | 0.0% | 0.0% | 0.0% | 0.0% | 0.2% | 0.2% |
| New medicine share of sales | 3.2% | 5.7% | 7.5% | 9.1% | 11.8% | 12.9% |
* Australia, Belgium, France, Germany, Italy, Japan, Netherlands, Norway, Spain, Sweden, and the United Kingdom.
Data source: IQVIA MIDAS® Database, 2021. All rights reserved.
Of the 230 medicines approved from 2016 to 2020, 76 (33%) had sales in Canada by Q4-2021 (Figure A3). Canada’s proportion of new medicines with sales was higher than the OECD median of 31% but ranked below the 37% median for PMPRB11 countries, all of which have lower average prices for patented medicines than Canada (PMPRB 2022a). The new medicines sold in Canada accounted for 82% of the OECD sales for all new medicines analyzed, representing the tenth-highest share in the OECD, above the median of 78%. These findings are consistent with those observed in previous editions of Meds Entry Watch and show that most of the top-selling new medicines in the OECD are being sold in Canada. Similar results have also been found in targeted analyses of the expensive drugs for rare diseases and oncology market segments (PMPRB 2020; 2022b).
Figure A3: Share of new medicines* from 2016 to 2020 with available sales and their respective share of OECD sales, by country, Q4-2021
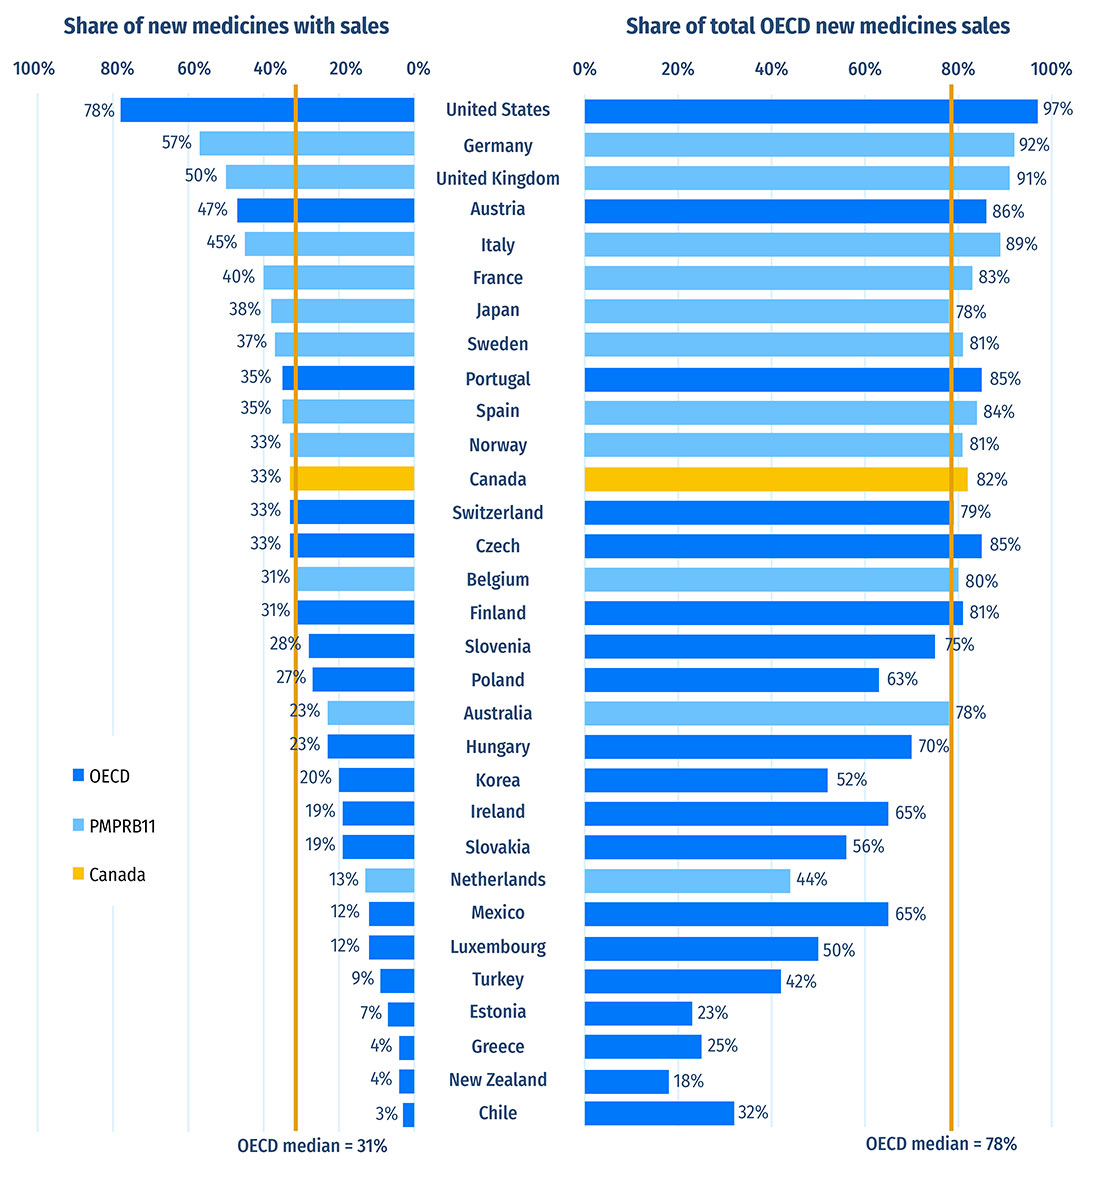
Figure A3 - Text version
| Country | Share of new medicines with sales | Share of total Organisation for Economic Co-operation and Development new medicine sales |
|---|---|---|
| United States | 78% | 97% |
| Germany | 57% | 92% |
| United Kingdom | 50% | 91% |
| Austria | 47% | 86% |
| Italy | 45% | 89% |
| Sweden | 37% | 81% |
| Portugal | 35% | 85% |
| Spain | 35% | 84% |
| Norway | 33% | 81% |
| Canada | 33% | 82% |
| Switzerland | 33% | 79% |
| Czech Republic | 33% | 85% |
| Belgium | 31% | 80% |
| Finland | 31% | 81% |
| Slovenia | 28% | 75% |
| Poland | 27% | 63% |
| Australia | 23% | 78% |
| Hungary | 23% | 70% |
| South Korea | 20% | 52% |
| Ireland | 19% | 65% |
| Slovakia | 19% | 56% |
| Netherlands | 13% | 44% |
| Mexico | 12% | 65% |
| Luxembourg | 12% | 50% |
| Turkey | 9% | 42% |
| Estonia | 7% | 23% |
| Greece | 4% | 25% |
| New Zealand | 4% | 18% |
| Chile | 3% | 32% |
| OECD median | 31% | 78% |
Note: Sales are based on manufacturer list prices and include sales for all OECD countries.
* For the purposes of this analysis, new medicines were defined as those that received their first market authorization through the US Food and Drug Administration (FDA), the European Medicines Agency (EMA), or Health Canada.
Data source: IQVIA MIDAS® Database, 2021. All rights reserved.
In-Depth: New Active Substances Not Submitted for Health Canada Review
This edition of Meds Entry Watch introduces a retrospective analysis of the new active substances (NAS) not submitted for Health Canada review (Figure A4). Of 230 NAS with a first international approval between 2016 and 2020, 155 (67%) had been submitted for Health Canada review as of February 2023. Of those NAS, 142 received a Notice of Compliance (NOC), eight were still under review, and five failed the review process. The remaining 75 medicines (33%) had not yet been submitted for review. The difference between the 142 NAS which received a NOC and the 76 which recorded sales in Q4-2021 (Figure 3) may reflect the time needed for medicines to launch after receiving a NOC and, in some cases, Canadian sales of low-volume new medicines not showing in the sales data.
Figure A4: Health Canada review status of new active substances (NAS) with an international approval between 2016 and 2020
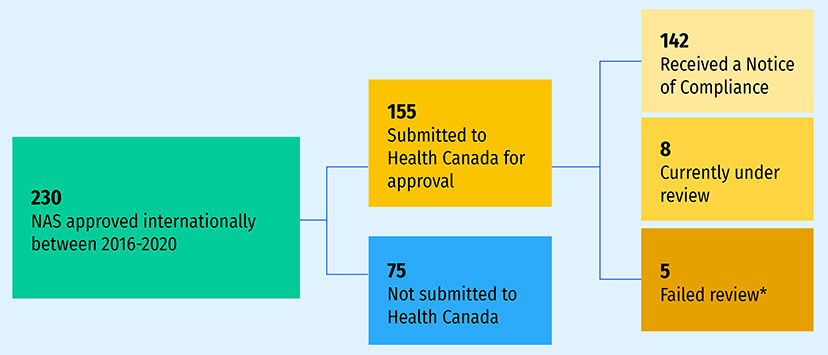
Figure A4 - Text version
- 230 NAS approved internationally between 2016-2020
- 155 Submitted to Health Canada for approval
- 142 Received a Notice of Compliance
- 8 Currently under review
- 5 Failed review*
- 75 Not submitted to Health Canada
- 155 Submitted to Health Canada for approval
Note: Review statuses were last updated on February 10, 2023.
*A medicine was labeled as having failed the review process if the submission resulted in a notice of non-compliance or if the review was cancelled by the sponsor.
Data source: Health Canada’s Notice of Compliance database; Health Canada’s New Drug Submissions Completed website; and Health Canada’s New Drug Submissions Under Review website.
International sales data reveal that the medicines not submitted for Health Canada review were not widely marketed in PMPRB11 countries. Figure A5 shows the distribution of medicines not submitted for Health Canada review by the number of PMPRB11 countries which sold them in 2021. Most medicines (60%; n=45) did not record sales in any PMPRB11 country in 2021, while 26 medicines (35%) recorded sales in 1-5 countries. Only four medicines (5%) recorded sales in over half (6+) of comparator countries: bezlotoxumab, etelcalcetide, avatrombopag, and belantamab mafodotin. All of those counted over 25 drugs marketed in the same pharmacologic subgroup in Canada as of February 1, 2023. This means that multiple offerings in the same therapeutic class and with a similar chemical profile were available to Canadians, although the specific indications treated may differ. None of the medicines not submitted to Health Canada recorded sales in all PMPRB11 countries.
Figure A5: Distribution of 2016-2020 new active substances not submitted for Health Canada review by number of PMPRB11 countries with sales in 2021
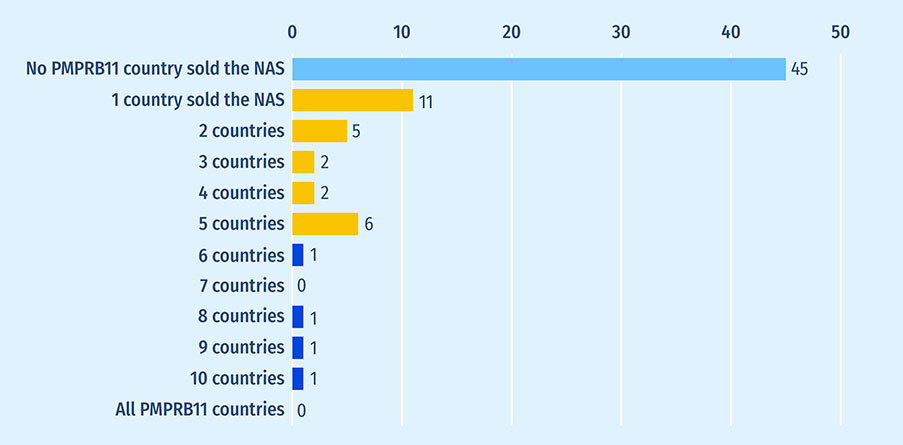
Figure A5 - Text version
| country | review by the number of PMPRB11 |
|---|---|
| No PMPRB11 country sold the new active substance | 45 |
| 1 country sold the new active substance | 11 |
| 2 countries | 5 |
| 3 countries | 2 |
| 4 countries | 2 |
| 5 countries | 6 |
| 6 countries | 1 |
| 7 countries | 0 |
| 8 countries | 1 |
| 9 countries | 1 |
| 10 countries | 1 |
| All PMPRB11 countries | 0 |
Source: IQVIA MIDAS® Database, 2021. All rights reserved.
The countries which recorded sales for the most medicines among the 75 not submitted to Health Canada were Germany (19 medicines with sales), the United Kingdom (15), Italy (14), Japan (14), and France (11). The remaining comparator countries all recorded sales for fewer than 10 of those medicines.
A version of this analysis exploring the characteristics and sales of NAS not submitted to Health Canada in further detail was published in an academic journal (Gaudette et al., 2023).
B: New Medicine Approvals and Sales, 2020
This section reports on new medicines approved in 2020 and tracks their international sales through the calendar year following approval. Sales and pricing data are provided as of Q4-2021, while assessments, recommendations, and reimbursement decisions are reported as of Q3-2022.
Sales for 2020 new medicines were highly concentrated, with two medicines (remdesivir and rimegepant) accounting for over half of revenues in the last quarter of 2021.
Fifty new medicines received their first market approval from Canada, Europe, and the US in 2020. By the end of 2021, 47 of these medicines had been approved by the US FDA, 32 by the EMA, and 21 by Health Canada (Figure B1).
Figure B1: Number of 2020 new medicines with market approval as of Q4-2020 and Q4-2021
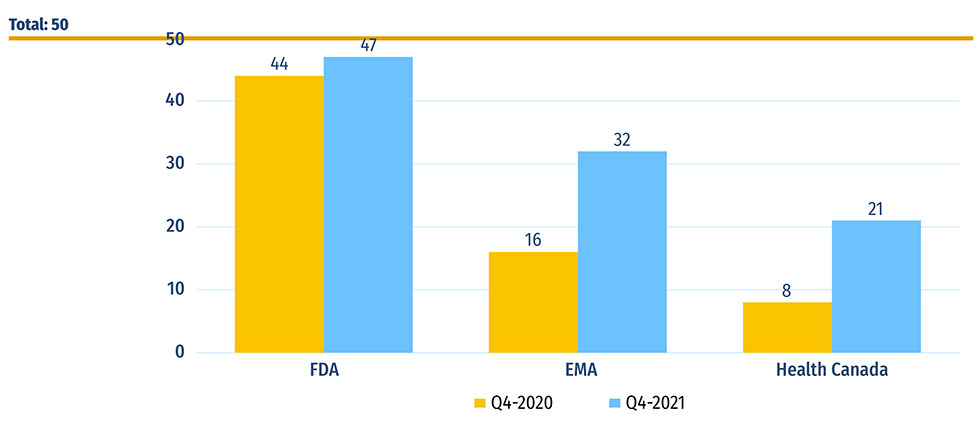
Figure B1 - Text version
| US Food and Drug Administration | European Medicines Agency | Health Canada | |
|---|---|---|---|
| Q4-2020 | 44 | 16 | 8 |
| Q4-2021 | 47 | 32 | 21 |
Data source: US Food and Drug Administration (FDA), European Medicines Agency (EMA), and Health Canada databases.
Of the 21 medicines approved in Canada, 10 had sales data available in MIDAS® by Q4-2021 (Figure B2). This placed Canada seventh in the OECD and fifth in the PMPRB11 in terms of the number of new medicines sold. The corresponding share of total new medicine sales was heavily influenced by the top-selling 2020 new medicine remdesivir, which accounted for 43% of OECD new medicine sales in Q4-2021. Including Canada, only nine countries registered sales of remdesivir in Q4-2021, which explains the uneven distribution on the right side of the figure, where Canada ranked second across the PMPRB11 and fourth in the OECD. Only the US, Germany and the UK had higher shares of total new medicine sales.
These results are representative of the initial market penetration of new medicines. The longer-term availability and uptake in sales for these new medicines are expected to increase in subsequent years.
Figure B2: Number of 2020 new medicines with available sales and their respective share of OECD sales, by country, Q4-2021
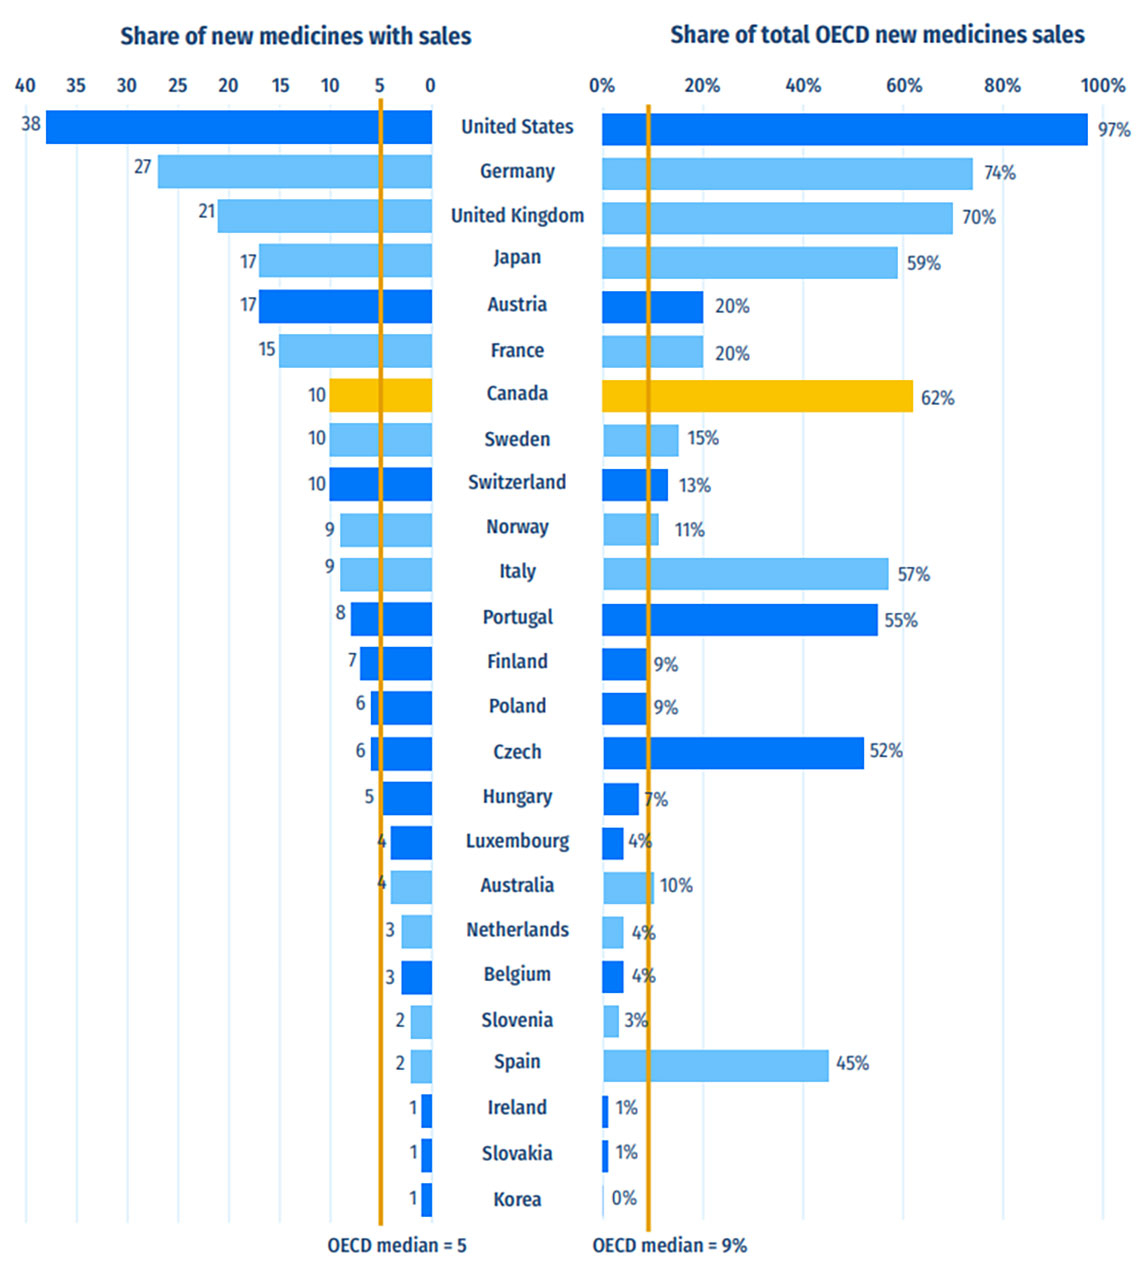
Figure B2 - Text version
| Country | Number of new medicines with available sales | Corresponding share of total Organisation for Economic Co-operation and Development sales for new medicines |
|---|---|---|
| United States | 38 | 97% |
| Germany | 27 | 74% |
| United Kingdom | 21 | 70% |
| Japan | 17 | 59% |
| Austria | 17 | 20% |
| France | 15 | 20% |
| Canada | 10 | 62% |
| Sweden | 10 | 15% |
| Switzerland | 10 | 13% |
| Norway | 9 | 11% |
| Italy | 9 | 57% |
| Portugal | 8 | 55% |
| Finland | 7 | 9% |
| Poland | 6 | 9% |
| Czech Republic | 6 | 52% |
| Hungary | 5 | 7% |
| Luxembourg | 4 | 4% |
| Australia | 4 | 10% |
| Netherlands | 3 | 4% |
| Belgium | 3 | 4% |
| Slovenia | 2 | 3% |
| Spain | 2 | 45% |
| Ireland | 1 | 1% |
| Slovakia | 1 | 1% |
| South Korea | 1 | 0% |
| OECD median | 5 | 9% |
Note: Based on medicines that received market approval through the US Food and Drug Administration (FDA), the European Medicines Agency (EMA), and/or Health Canada in 2020 with recorded sales data as of Q4-2021.
Sales are based on manufacturer list prices and include sales for the selected new medicines in all OECD countries. The following countries did not register sales for any new medicines and have been omitted in the graph: Chile, Estonia, Greece, Mexico, New Zealand, and Turkey. All countries were used to calculate the OECD median.
Data source: IQVIA MIDAS® Database, 2021 (all rights reserved); US Food and Drug Administration, European Medicines Agency, and Health Canada databases.
Table B1 provides detailed information on the new medicines approved in 2020. For each medicine, the country with the first reported sales is given, along with the availability in Canada, the share of sales in Q4-2021, and the prices and corresponding treatment costsFootnote 1. Prices are reported for the highest-selling form and strength of each medicine at the time of the analysis.
In total, the list of 2020 new medicines spanned 22 therapeutic classes. As was the case in previous editions of this report, antineoplastics continued to account for the greatest number of new medicines in 2020, with 17 medicines approved. Other central nervous system medicines and antivirals accounted for the second highest number of new medicines with 4 each.
Two new medicines indicated for COVID-19 are shown in Table B1. The first, remdesivir (Veklury), was the highest-selling medicine with a first approval in 2020. The second consists of mRNA COVID-19 vaccines which, following Meds Entry Watch methodology, were considered a single new medicine in the table. Their sales were omitted from the table because they primarily occurred through government purchasing agreements and could not be established from the primary data source. It is likely that mRNA vaccines would have accounted for the largest share of sales if data on these agreements were available for analysis. Additional information on COVID-19 medicines approved in 2020 and 2021 is provided at the end of this section in the textbox "In-Depth: COVID-19 Treatments and Vaccines Approved in 2020 and 2021".
Despite the range of therapeutic areas represented in Table B1, sales for the 2020 new approvals were highly concentrated. The top three therapeutic classes accounted for 80% of all new medicine sales across the OECD by Q4-2021. Antiviral products had 43% of all sales, driven almost exclusively by remdesivir (Veklury). Analgesics followed with 18% of sales. Most sales within the class were for rimegepant (Nurtec) despite that medicine only registering sales in the US by Q4-2021. Rimegepant was under Health Canada review as of the writing of this report. Antineoplastics, the class with the greatest number of new medicines, was the third highest-selling class with 16% of sales. Medicines without sales included vaccines and diagnostic agents.
A large share of the medicines approved in 2020 were specialty medicines. A proportion of 58% (29) received an orphan designation from the FDA and/or the EMA, 36% (18) were for the treatment of cancer, and 36% (18) were biologics. There was a notable overlap between these categories, as shown in Figure B3. The Venn diagram illustrates that almost 90% (16 of 18) of new cancer medicines received an orphan status from either the FDA or EMA. In total, cancer medicines account for over half of new orphan designations despite representing approximately one third of new medicine approvals. Similarly, a majority of biologic medicines (61%) received an orphan designation. Brexucabtagene autoleucel, indicated for the treatment of mantle cell lymphoma and lymphoblastic leukemia, was the only gene therapy in the group.
Figure B3: Distribution of 2020 new approvals for specialty medicines
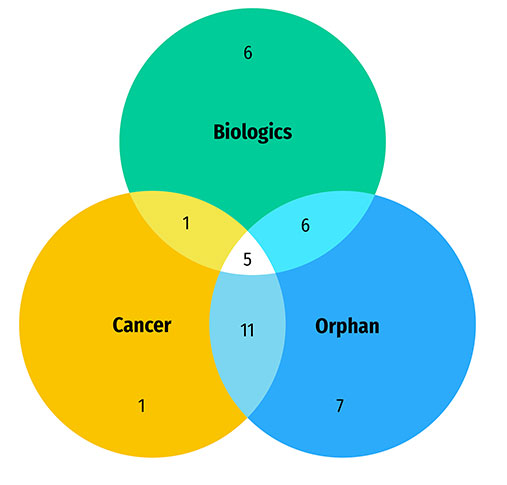
Figure B3 - Text version
- 50 new approvals for specialty medicines in 2020
- 29 medicines with an orphan designation
- 18 biologic medicines
- 18 cancer medicines
- 16 cancer medicines with an orphan designation
- 11 biologic medicines with an orphan designation
- 6 biologic cancer medicines
- 5 biologic cancer medicines with an orphan designation
Data source: US Food and Drug Administration, European Medicines Agency, and Health Canada databases.
Table B1: New medicines approved in 2020, availability, share of sales, prices, and treatment costs, ranked by therapeutic class share of sales, Q4-2021
| Rank | Therapeutic classFootnote * | Medicine (trade name, form, strength, volume) | Availability | Share of new medicine sales across the OECD | No. of countries with salesFootnote ‡ | Canadian priceFootnote § (CAD) | PMPRB11 price (CAD) | US price (CAD) | Treatment costFootnote ** | ||||||
|---|---|---|---|---|---|---|---|---|---|---|---|---|---|---|---|
| First sale in Canada, US, or PMPRB11Footnote † | First sale in Canada | Medicine | Therapeutic class | Min. | Median | Max. | Treatment cost (CAD) | Annual/Course | |||||||
1 |
J5- Antivirals for systemic use |
Remdesivir (Veklury, infus. dry bottle, 100 mg) |
UK |
May-20 |
Sep-20 |
43% |
46% |
7 |
493 |
99 |
462 |
663 |
636 |
2,959 to 5,426 |
5 to 10-day course |
2 |
Cabotegravir (Vocabria, film-ctd tab, 30 mg) |
CAN |
Sep-19 |
Sep-19 |
1% |
8 |
34 |
26 |
27 |
34 |
– |
15,742 / 14,513 |
First / subsequent years |
||
3 |
Bulevirtide (Hepcludex, vial dry, 2 mg)B,O |
FRA |
Sep-19 |
– |
1% |
2 |
– |
555 |
555 |
555 |
– |
– |
– |
||
4 |
Fostemsavir trometamol (Rukobia, film-ctd tab ret., 600 mg) |
US |
Jul-20 |
– |
1% |
5 |
– |
52 |
71 |
84 |
141 |
52,292 |
Annual |
||
5 |
N2-Analgesics |
Rimegepant (Nurtec, orally disintegrating tab, 75 mg) |
US |
Mar-20 |
– |
17% |
18% |
1 |
– |
– |
– |
– |
129 |
129 to 23,590 |
Acute / annual (preventive) |
6 |
Eptinezumab (Yyepti, infus. vial/bottle, 100 mg/ml)B |
US |
Mar-20 |
– |
1% |
1 |
– |
– |
– |
– |
1,800 |
7,799 to 23,396 |
Annual |
||
7 |
Oliceridine (Olinvyk, vial IV, 1 mg/ml, 30 ml) |
US |
Mar-20 |
– |
<1% |
1 |
– |
– |
– |
– |
133 |
266 |
48-hour treatment |
||
8 |
L1-Antineoplastics |
Sacituzumab govitecan (Trodelvy, infus. dry bottle, 180 mg)B,C |
US |
Apr-20 |
Nov-21 |
5% |
16% |
6 |
1,469 |
1,179 |
1,179 |
1,179 |
2,344 |
12,478 |
21-day course |
9 |
Isatuximab (Sarclisa, infus. vial/bottle, 20 mg/ml, 25 ml)B,C,O |
FRA |
Dec-19 |
Jul-20 |
2% |
8 |
3,927 |
0 |
3,235 |
4,430 |
3,796 |
21,221 / 10,611 |
First / subsequent 28-day courses |
||
10 |
Belantamab mafodotin (Blenrep, vial dry, 100 mg)B,C,O |
FRA |
Apr-20 |
– |
2% |
6 |
– |
4,167 |
9,522 |
10,264 |
9,667 |
18,126 |
Every 3 weeks |
||
11 |
Selumetinib (Koselugo, capsule, 25 mg)O |
US |
May-18 |
– |
1% |
4 |
– |
0 |
131 |
262 |
220 |
191,100 |
Annual |
||
12 |
Selpercatinib (Retevmo, capsule, 80 mg)C,O |
US |
May-20 |
– |
1% |
8 |
– |
61 |
132 |
147 |
198 |
11,172 - 14,896 |
28-day cycle |
||
13 |
Tafasitamab (Monjuvi, infus. dry bottle, 200 mg)B,C,O |
US |
Aug-20 |
– |
1% |
2 |
– |
– |
– |
– |
1,363 |
11,679 - 31,422 |
28-day cycle |
||
14 |
Capmatinib (Tabrecta, film-ctd tab, 200 mg)C,O |
US |
May-20 |
– |
1% |
3 |
– |
57 |
57 |
57 |
198 |
2,413 |
21-day cycle |
||
15 |
Tucatinib (Tukysa, film-ctd tab, 150 mg)C,O |
US |
Apr-20 |
– |
1% |
4 |
– |
103 |
106 |
111 |
183 |
12,216 / 11,710 |
First / subsequent 21-day courses |
||
16 |
Cedazuridine (Inqovi, film-ctd tab, 100 mg + 35 mg)C,O |
US |
Sep-20 |
Nov-20 |
1% |
2 |
1,235 |
– |
– |
– |
1,687 |
4,396 |
28-day course |
||
17 |
Naxitamab (Danyelza, infus. vial/bottle, 4 mg/ml, 10 ml)B,C,O |
US |
Feb-21 |
– |
<1% |
1 |
– |
– |
– |
– |
25,098 |
43,832 |
4-week cycle |
||
18 |
Avapritinib (Ayvakyt, film-ctd tab, 100mg)C,O |
US |
Jan-20 |
– |
<1% |
3 |
– |
879 |
1,105 |
1,332 |
|
46,430 to 69,644 |
21-day cycle |
||
19 |
Pemigatinib (Pemazyre, tablet, 13.5 mg) C,O |
US |
May-20 |
– |
<1% |
5 |
– |
– |
773 |
796 |
1,345 |
15,499 |
28-day course |
||
20 |
Pralsetinib (Gavreto, capsule, 100 mg)C,O |
US |
Nov-20 |
– |
<1% |
3 |
– |
0.00 |
49 |
98 |
188 |
4,141 |
21-day cycle |
||
21 |
Brexucabtagene autoleucel (Tecartus, infus. bag, 68 ml)B,C,G,O |
FRA |
Dec-20 |
– |
<1% |
2 |
– |
– |
1 |
471,161 |
– |
533,523 |
One-time |
||
22 |
Ripretinib (Qinlock, tablet, 50 mg)C,O |
US |
Jun-20 |
Mar-21 |
<1% |
3 |
211 |
165 |
165 |
165 |
354 |
18,171 |
28-day course |
||
23 |
Tazemetostat (Tazverik, film-ctd tab, 200 mg)C,O |
US |
May-20 |
– |
<1% |
2 |
– |
26 |
26 |
26 |
76 |
4,412 |
21-day cycle |
||
24 |
Lurbinectedin (Zepzelca, infus. dry bottle, 4 mg)C,O |
US |
Sep-20 |
– |
<1% |
1 |
– |
– |
– |
– |
7,635 |
11,453 |
21-day cycle |
||
25 |
N7-Other central nervous system drugs |
Risdiplam (Evrysdi, dry syrup/drop, 3.75 mg/5 ml)O |
US |
Sep-20 |
Nov-21 |
3% |
7% |
8 |
11,468 |
– |
– |
– |
- |
93,456 - 354,000 |
Annual |
26 |
Ozanimod (Zeposia, capsule, 920 mcg) |
NDL |
May-20 |
Mar-21 |
2% |
9 |
69 |
53 |
68 |
83 |
289 |
25,017 |
Annual |
||
27 |
Satralizumab (Enspryng, prefill syrng sc, 120 mg/ml, 1 ml)B,O |
JPN |
Aug-20 |
Sep-20 |
2% |
5 |
10,039 |
11,113 |
11,671 |
13,395 |
17,241 |
132,300 / 122,850 |
First/ subsequent years |
||
28 |
Inebilizumab (Uplizna, infus. vial/bottle, 10 mg/ml, 10 ml)B,O |
US |
Dec-20 |
– |
1% |
2 |
– |
30,548 |
30,548 |
30,548 |
48,876 |
31,929 / 21,286 |
First / subsequent years |
||
29 |
G4-Urologicals |
Vibegron (Beova, film-ctd tab, 50 mg) |
JPN |
Nov-18 |
– |
3% |
4% |
2 |
– |
2 |
2 |
2 |
– |
847 |
Annual |
30 |
Lumasiran (Oxlumo, vial sc)O |
GER |
Jan-21 |
– |
1% |
3 |
– |
100,176 |
100,176 |
100,176 |
– |
21,162 / 14,108 |
First / subsequent years |
||
31 |
J7-Vaccines |
Vaccine, SARS-CoV-2 mRNA (Comirnaty, vial IM, 100 mcg/ml, 0.3 ml)B |
UK |
Nov-20 |
Dec-20 |
3% |
3% |
7 |
– |
– |
– |
– |
– |
– |
– |
32 |
L2-Cytostatic hormone therapy |
Relugolix (Orgovyx, film-ctd tab, 120 mg)C |
US |
Dec-20 |
– |
2% |
2% |
6 |
– |
– |
– |
– |
84 |
5,811 |
21-day cycle |
33 |
C10-Lipid-regulating/anti-atheroma preparations |
Bempedoic acid (Nexlizet, film-ctd tab, 180 mg + 10 mg) |
US |
Mar-20 |
– |
2% |
2% |
3 |
– |
– |
– |
– |
14 |
5,092 |
Annual |
34 |
Inclisiran (Leqvio, prefill syrng sc ret., 189 mg/ml, 1.5 ml) |
SWE |
Dec-20 |
– |
<1% |
3 |
|
2,959 |
3,084 |
3,301 |
|
8,518 / 5,679 |
First / subsequent years |
||
35 |
M1-musculo-skeletal system |
Filgotinib (Jyseleca, film-ctd tab, 200mg)B |
NDL |
Sep-20 |
– |
1% |
1% |
10 |
– |
26 |
42 |
51 |
– |
– |
– |
36 |
D10-Anti-acne preparations |
Clascoterone (Winlevi, cream, 1%, 60 g) |
US |
Oct-21 |
– |
1% |
1% |
1 |
– |
– |
– |
– |
11 |
22 |
Annual |
37 |
M5-Other drugs for disorders of the musculo-skeletal system |
Viltolarsen (Viltepso, infus. vial/bottle, 50 mg/ml)O |
JPN |
May-20 |
– |
<1% |
<1% |
2 |
– |
796 |
796 |
796 |
– |
994,024 |
Annual |
38 |
D5-Nonsteroidal products for inflammatory skin |
Tirbanibulin (Klisyri, ointment, 250 mg/dose, 250 mg) |
US |
Feb-21 |
– |
<1% |
<1% |
3 |
– |
18 |
21 |
25 |
232 |
1,162 |
5-day treatment |
39 |
A16-Other alimentary tract and metabolism products |
Triheptanoin (Dojolvi, oral liquid, 4.8 g/5 ml, 500 ml)O |
US |
Jul-20 |
– |
<1% |
<1% |
1 |
– |
– |
– |
– |
54 |
118,678 to 466,971 |
Annual |
40 |
V3-All other therapeutic products |
Lonafarnib (Zokinvy, capsule, 50 mg)O |
US |
Feb-21 |
– |
<1% |
<1% |
1 |
– |
– |
– |
– |
806 |
362,440 / 336,176 |
First / subsequent years |
41 |
B6-All other haematological agents |
Berotralstat (Orladeyo, capsule, 150 mg)B |
FRA |
Mar-21 |
– |
<1% |
<1% |
4 |
– |
– |
571 |
790 |
– |
222,670 |
Annual |
42 |
H4-Other hormones |
Osilodrostat (Isturisa, film-ctd tab, 1 mg)O |
FRA |
Jan-20 |
– |
<1% |
<1% |
4 |
– |
– |
29 |
37 |
– |
9,705 to 33,967 |
Annual |
43 |
Somapacitan (Sogroya, prefill pen, 7 mg/ml, 1.5 ml)B |
JPN |
Dec-21 |
– |
<1% |
1 |
– |
456 |
456 |
456 |
- |
3,557 - 18,970 |
Annual |
||
44 |
S1-Ophthalmologicals |
Teprotumumab (Tepezza, infus. dry bottle, 500 mg)B,O |
US |
Feb-20 |
– |
<1% |
<1% |
1 |
– |
– |
– |
– |
– |
$928,486 |
Annual |
45 |
N1-Anaesthetics |
Remimazolam (Anerem, infus. dry bottle, 50 mg) |
JPN |
Aug-20 |
– |
<1% |
<1% |
2 |
– |
– |
– |
– |
– |
$19 |
One-time |
46 |
P03-Ectoparasiticides, incl. scabicides, insecticides and repellents |
Abametapir (Xeglyze) |
FDA |
Jul-20 |
No sales data in MIDAS as of Q4-2021 – date of approval by FDA, EMA, and/or Health Canada.
|
||||||||||
47 |
J06- immune sera and immunoglobulins |
Ansuvimab-zykl (Ebanga)B,O |
FDA |
Dec-20 |
|||||||||||
48 |
Not assigned as of Q3-2022 |
Atoltivimab, maftivimab, and odesivimab-ebgn (Inmazeb)B,O |
FDA |
Oct-20 |
|||||||||||
49 |
A08-Antiobesity preparations, excl. diet products |
Setmelanotide (Imcivree)O |
FDA |
Nov-20 |
|||||||||||
50 |
L04-Immunosuppressants |
Imlifidase (Idefirix)B |
EMA |
Aug-20 |
|||||||||||
Note: A medicine was considered to be new in 2020 if it received initial market authorization through the US Food and Drug Administration (FDA), the European Medicines Agency (EMA), and/or Health Canada during the calendar year.
Availability and sales information refer to all forms and strengths of the medicine, while pricing and treatment costs are based on the highest-selling form and strength indicated. Sales are based on manufacturer list prices.
Specialty medicines are indicated using the following abbreviations: B: biologic; C: cancer; G: gene therapy; O: orphan.
Data source: IQVIA MIDAS® Database, 2021 (all rights reserved); US Food and Drug Administration Novel Drugs 2020; European Medicines Agency Human Medicines Highlights 2020; Health Canada databases.
Of the 43 new medicines with available treatment costs, 29 (67%) cost over $10,000 per year or $5,000 per 28-day cycle for oncology. Of 18 new oncology medicines, 14 fell into this "high-cost" category, along with 15 of 25 non-oncology medicines. Seven non-oncology and 12 oncology medicines were identified as expensive drugs for rare diseases (EDRDs)—orphan-designated therapies exceeding $100,000 in annual treatment costs, or $7,500 per 28-day cycle for oncology. Together, these 19 EDRDs accounted for approximately 15% of 2020 new medicine sales in Q4-2021.
Figure B4: Distribution of new medicines approved in 2020 by treatment cost

Figure B4 - Text version
| - | High-cost medicines: Expensive drugs for rare diseases† | High-cost medicines*, other than EDRDs | Other | Total |
|---|---|---|---|---|
| Oncology medicines | 12 | 2 | 4 | 18 |
| Non-oncology medicines | 7 | 8 | 10 | 25 |
Note: This analysis considers the 43 new medicines approved in 2020 with treatment costs available as of Q3-2022.
* High-cost medicines are defined as those with treatment costs exceeding $10,000 annually or $5,000 per 28-day cycle.
† Expensive drugs for rare diseases (EDRDs) are defined as those with an orphan designation through the FDA or EMA and treatment costs exceeding $7,500 per 28-day cycle or $100,000 annually.
Data source: IQVIA MIDAS® Database, 2021 (all rights reserved); Canadian Agency for Drugs and Technologies in Health (CADTH) reports.
Prior to being marketed in Canada, medicines must be reviewed and authorized by Health Canada. However, to be considered for listing on the formulary of public insurers, medicines must also be assessed and recommended for listing by the Canadian Agency for Drugs and Technologies in Health (CADTH), an independent, not-for-profit health technology assessment organization. This process may also rely on health technology assessments by the Institut national d'excellence en santé et en services sociaux (INESSS) in Quebec. Depending on the results of these assessments, the pan-Canadian Pharmaceutical Alliance (pCPA)—an alliance of public drug plans that conducts joint negotiations for brand-name and generic drugs in Canada—may then choose to enter price negotiations with pharmaceutical manufacturers prior to the drugs being considered for listing on public formularies.
Table B2 provides an overview of the CADTH recommendation and pCPA negotiation status for the 25 approved medicines, as well as information on whether these medicines have recorded sales through private drug plans in Canada. As of Q3-2022, 25 of the medicines first approved in 2020 had been authorized for market in Canada. Of this group, 16 had been reviewed through CADTH's reimbursement review process, with 12 receiving a recommendation to "reimburse with conditions" and four receiving a "do not reimburse" recommendation. Six of the 25 new medicines approved in Canada had completed pCPA negotiations by Q3-2022 and nine others had negotiations underway. Negotiations were not pursued in two cases and the remaining eight medicines had no record of negotiation.
A review of private drug plan data shows that 11 of the 25 new medicines had been reimbursed by a private drug plan in Canada by Q3-2022. These are early results and the rates of reimbursement for new medicines can be expected to increase in the coming years.
The PMPRB's Human Drug Advisory Panel (HDAP) conducts scientific assessments of the clinical benefit of new patented medicines. Eleven of the 50 new medicines approved in 2020 were assessed by the HDAP as of Q3-2022, of which 10 (91%) demonstrated slight or no improvement over their therapeutic comparators and one showed moderate improvement Footnote 2 .
Table B3 provides further details on the pharmacoeconomic assessments conducted by CADTH, including the indications assessed, the recommended condition for reimbursement, the primary evaluation, the incremental cost-effectiveness ratios (ICER) reported, and the price reduction required for the medicine to achieve an ICER of $50,000 per quality-adjusted life year (QALY). The assessments suggest that none of the new medicines reviewed by CADTH were cost-effective at the submitted price. Twelve of the 16 assessments (75%) resulted in recommendations to be approved on the condition that their price be reduced, while the other four medicines (25%) were not recommended for reimbursement. Price reductions needed to reach the $50,000/QALY level were estimated in 11 of the 16 available reports, ranging from approximately 50% to over 99% of the submitted price. Of the 11 assessments, none resulted in an ICER below $50,000/QALY and four resulted in an ICER over $1 million.
Table B2: Assessments, recommendations, and reimbursement decisions for 2020 new medicines approved in Canada by Q3-2022
| ATCFootnote * | Medicine (trade name)Footnote † | Health Canada approval | CADTH recommendation | pCPA negotiation status | Private plans | ||||||
|---|---|---|---|---|---|---|---|---|---|---|---|
| Notice of Compliance | Reimburse | Reimburse with conditions | Do not reimburse | Review in progress | Active | Completed and closed | Concluded without agreement | No negotiations | Covered | ||
B6 |
Berotralstat (Orladeyo)B |
Jun-22 |
- |
- |
- |
- |
- |
- |
- |
- |
- |
L1 |
Brexucabtagene autoleucel (Tecartus)B,C,G,O |
Jun-21 |
- | - | - | - |
- | - | - | ||
J5 |
Cabotegravir (Vocabria) |
Mar-20 |
- | - | - | - |
- | - | |||
L1 |
Capmatinib (Tabrecta)C,O |
May-22 |
- | - | - | - | - | - | - | - | - |
L1 |
Cedazuridine (Inqovi)C,O |
Jul-20 |
- | - | - | - | - | - | |||
N2 |
Eptinezumab (Yyepti)B |
Jan-21 |
- | - |
- | - | - |
- | - | - | |
J5 |
Fostemsavir trometamol (Rukobia) |
Oct-21 |
- | - |
- | - | - | - |
- | - | - |
C10 |
Inclisiran (Leqvio) |
Jul-21 |
- | - |
- | - |
- | - | - | ||
L1 |
Isatuximab (Sarclisa)B,C,O |
Apr-20 |
- | - | - | - |
- | - | |||
G4 |
Lumasiran (Oxlumo)O |
Mar-22 |
- | - |
- | - | - | - | - | - | - |
L1 |
Lurbinectedin (Zepzelca)C,O |
Sep-21 |
- | - |
- | - | - | - | - | - |
|
N7 |
Ozanimod (Zeposia) |
Oct-20 |
- | - |
- | - | - | - | |||
L1 |
Pemigatinib (Pemazyre)C,O |
Sep-21 |
- | - |
- | - |
- | - | - |
||
L1 |
Pralsetinib (Gavreto)C,O |
Jun-21 |
- | - | - | - | - | - | - |
||
J5 |
Remdesivir (Veklury) |
Jul-20 |
- | - |
- | - | - | - | - | - | - |
L1 |
Ripretinib (Qinlock)C,O |
Jun-20 |
- | - | - | - | - | - | |||
N7 |
Risdiplam (Evrysdi)O |
Apr-21 |
- | - | - | - | - | - | |||
L1 |
Sacituzumab govitecan (Trodelvy)B,C |
Sep-21 |
- | - | - | - |
- | - | |||
N7 |
Satralizumab (Enspryng)B,O |
Jun-20 |
- | - | - |
- | - | - | |||
L1 |
Selpercatinib (Retevmo)C,O |
Jun-21 |
- | - | - | - | - | - | - |
||
L1 |
Selumetinib (Koselugo)O |
Aug-22 |
- | - | - | - | - | - | - | - | - |
L1 |
Tafasitamab (Minjuvi)B,C,O |
Aug-21 |
- | - | - | - | - | - | - |
||
A16 |
Triheptanoin (Dojolvi)O |
Feb-21 |
- | - | - | - | - | - | - | ||
L1 |
Tucatinib (Tukysa)C,O |
Jun-20 |
- | - | - | - | - | - | |||
J7 |
Vaccine, SARS-CoV-2 mRNA (Comirnaty)B |
Sep-21 |
- | - | - | - |
- | - | - | - | |
Note: Medicines were assessed through CADTH’s Reimbursement Review process.
Data source: IQVIA Private Drug Plan database, 2021; Health Canada Notice of Compliance Database; Canadian Agency for Drugs and Technologies in Health (CADTH) reports; pan-Canadian Pharmaceutical Alliance (pCPA) reports; and IQVIA MIDAS® Database rights reserved).
Table B3: Summary of Reimbursement Review assessments for 2020 new medicines approved in Canada by Q3-2022
| Medicine (trade name)Footnote * | Date of recommendationFootnote † | Indication(s) | Conditional on priceFootnote ‡ | Type of evaluation (primary)Footnote § | Incremental cost-effectiveness ratio (ICER) ($ per QALY) | Price reduction range ($50,000 per QALY) |
|---|---|---|---|---|---|---|
Brexucabtagene autoleucel (Tecartus)B,C,G,O |
Aug-21 |
Mantle cell lymphoma (MCL) |
Yes |
CUA |
$308,000 to $388,000 |
99% |
Cabotegravir (Vocabria) |
Jul-20 |
HIV-1 infection |
Yes |
CUA |
DominatedFootnote ** |
N/A |
Cedazuridine (Inqovi)C,O |
Sep-21 |
Myelodysplastic Syndromes (MDS) |
Yes |
CUA |
N/A |
N/A |
Isatuximab (Sarclisa)B,C,O |
Apr-21 |
Multiple myeloma |
Yes |
CUA |
$1,555,947 |
N/A |
Ozanimod (Zeposia) |
Jun-21 |
Multiple sclerosis (MS), relapsing - remitting |
Do not reimburse |
CUA |
$578,039 |
N/A |
Pemigatinib (Pemazyre)C,O |
Apr-22 |
Cholangiocarcinoma |
Do not reimburse |
CUA |
$252,718 to $261,226 |
95%–100% |
Pralsetinib (Gavreto)C,O |
Oct-22 |
Non-small cell lung cancer |
Yes |
CUA |
$1,413,900 to $3,064,599 |
> 60% |
Ripretinib (Qinlock)C,O |
May-22 |
Gastrointestinal stromal tumours |
Yes |
CUA |
$242,365 |
83% |
Risdiplam (Evrysdi)O |
Aug-21 |
Spinal muscular atrophy (SMA) |
Yes |
CUA |
$1,203,108 to $37,378,163 |
N/A |
Sacituzumab govitecan (Trodelvy)B,C |
Feb-22 |
Locally advanced or metastatic triple-negative breast cancer |
Yes |
CUA |
$375,333 |
87% |
Satralizumab (Enspryng)B,O |
Apr-21 |
Neuromyelitis optica spectrum disorder (NMOSD) |
Yes |
CUA |
$337,535 |
80%–89% |
Selpercatinib (Retevmo)C,O |
Jul-22 |
Thyroid cancer |
Yes |
CUA |
$402,705 |
89% |
Tafasitamab (Minjuvi)B,C,O |
Oct-22 |
Diffuse large b-cell lymphoma (DLBCL) |
Do not reimburse |
CUA |
$199,353 |
> 99% |
Triheptanoin (Dojolvi)O |
Feb-22 |
Long-chain fatty acid oxidation disorders |
Yes |
CUA |
$1,347,825 |
96% |
Tucatinib (Tukysa)C,O |
Nov-21 |
Advanced or metastatic breast cancer |
Yes |
CUA |
$381,429 to $512,403 |
48%–94% |
Inclisiran (Leqvio) |
Feb-22 |
Primary hypercholesterolemia |
Do not reimburse |
CUA |
$366,650 to $626,458 |
83%–91% |
Note: The type of evaluation and the incremental cost-effectiveness ratio (ICER) are based on the Reimbursement Review reports. The table reports the low-bound and high-bound range estimated for all comparators and conditions analyzed. Cost-utility analysis (CUA) evaluations are provided as a range per quality-adjusted life year (QALY). Additional information can be accessed at https://www.cadth.ca.
Data source: Canadian Agency for Drugs and Technologies in Health (CADTH) reports.
In-Depth: COVID-19 Treatments and Vaccines Approved in 2020 and 2021
While remdesivir and the COVID-19 mRNA vaccines were first approved in 2020, multiple new medicines for the treatment and prevention of COVID-19 followed in 2021. The approval process for some COVID-19 medicines differed between international approval bodies. While the EMA and Health Canada granted standard approvals for many of the medicines, the FDA frequently granted approvals through the Emergency Use Authorization (EUA) process. An EUA approval can be temporary and may come with other limitations. Medicines approved solely under an EUA or similar programs in other jurisdictions are therefore not included in Meds Entry Watch. However, for this analysis, an exception was made and all medicines indicated for the treatment or prevention of COVID-19 with any form of approval by the end of 2021 were considered.
Four vaccines were approved by the FDA, EMA, and Health Canada (Table B4). Five of six treatments were approved or temporarily approved by all three jurisdictions. The FDA issued an EUA for four of the five treatments approved. In many cases, an EUA was issued when the treatment targeted specific mutations of the disease. The only COVID-19 treatment to receive a standard FDA approval was remdesivir. Regdanvimab was only approved by the EMA.
Table B4: COVID-19 treatment and prevention medicines approvals 2020-2021
| Approval Year | Medicine type | Molecule | Product | Approved for Covid (including Emergency Use) |
|---|---|---|---|---|
| 2020 | Vaccine |
MRNA (Tozinameran) |
Comirnaty |
HC, EMA, FDA |
| 2021 | Vaccine |
MRNA (Elasomeran) |
Spikevax |
HC, EMA, FDA |
| 2021 | Vaccine |
Non replicating vector (ChAdOx1-S [recombinant]) |
Vaxzeria / Covishield |
HC, EMA, FDA |
| 2021 | Vaccine |
Non replicating vector (Ad26.COV2.S [recombinant]) |
Jcovden |
HC, EMA, FDA |
| 2021 | Treatment |
Regdanvimab |
Regkirona |
EMA |
| 2021 | Treatment |
Casirivimab and Imdevimab |
Ronapreve |
HC, EMA, FDA (EUA May 2020) |
| 2021 | Treatment |
Sotrovimab |
Xevudy |
HC, EMA, FDA (EUA May 2021) |
| 2020 | Treatment |
Remdesivir |
Veklury |
HC, EMA, FDA |
| 2021 * | Treatment |
Tocilizumab |
Actemra |
HC, EMA, FDA (EUA for covid June 2021) |
| 2021 | Treatment |
Bamlanivimab | Bamlanivimab |
HC, EMA (withdrawn), FDA (EUA withdrawn) |
*COVID-19 indication approval.
These ten medicines will likely be followed by many more in the years to come. Figure B5 illustrates the COVID-19 medicine pipeline broken down by stage of development at the end of 2021. Vaccines account for the majority of the pipeline but are nearly equal with treatments at the pre-registration stage. The sizable number of ongoing trials for COVID-19 medicines is an indication of the active research and development efforts in this area.
Figure B5: Number of COVID-19 medicines approved and in the pipeline at the end of 2021
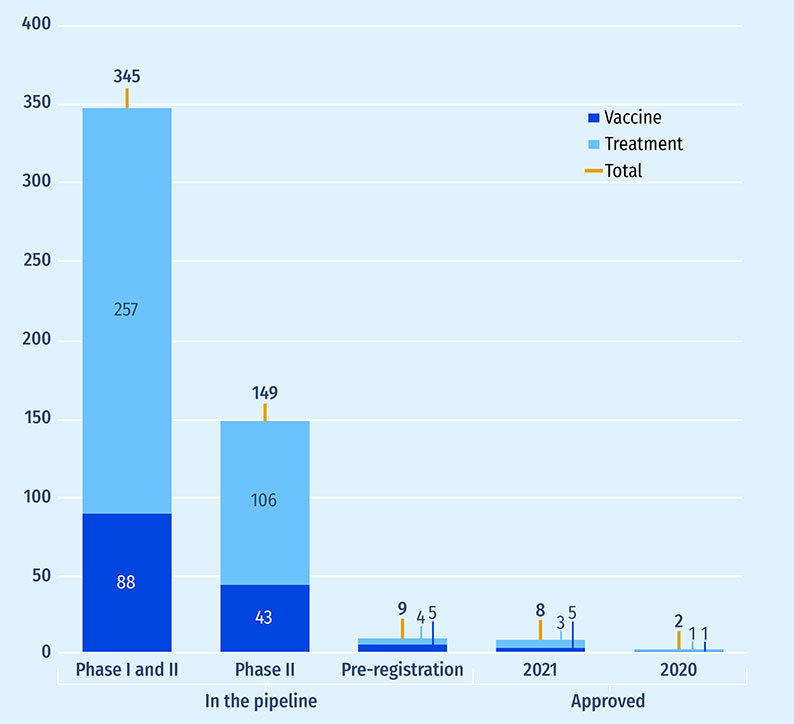
Figure B5 - Text version
| - | Vaccine | Treatment | Total |
|---|---|---|---|
| Phase I and II | 88 | 257 | 345 |
| Phase III | 43 | 106 | 149 |
| Pre-registration | 5 | 4 | 9 |
| Approved in 2021 | 3 | 5 | 8 |
| Approved in 2020 | 1 | 1 | 2 |
Data source: PMPRB, Meds Pipeline Monitor, 2021.
C: New Medicine Approvals, 2021
This section provides an analysis of the new medicines approved internationally in 2021, including information on approval status as of Q3-2022 and pricing as of Q4-2021.
In 2021, 55 medicines received first-time market approval through the FDA, the EMA, and/or Health Canada including 8 medicines indicated for the treatment of COVID-19.
A five-year high of 55 medicines received first-time market approval through the FDA, the EMA, and/or Health Canada in 2021. As of the third quarter of 2022, the US FDA had approved 48 of these new medicines, the EMA had approved 27 and Health Canada had approved 17 (Figure C1). As discussed in the textbox "In-Depth: COVID-19 Treatments and Vaccines Approved in 2020 and 2021", these numbers reflect standard approvals and do not include the temporary or Emergency Use Authorizations for COVID-19 medicines. Manufacturers may choose to submit new medicines for approval in the US, Europe, and Canada at different times, which can affect the number of medicines approved by each regulator.
Figure C1: Number of 2021 medicines with market approval as of Q4-2021 and Q3-2022
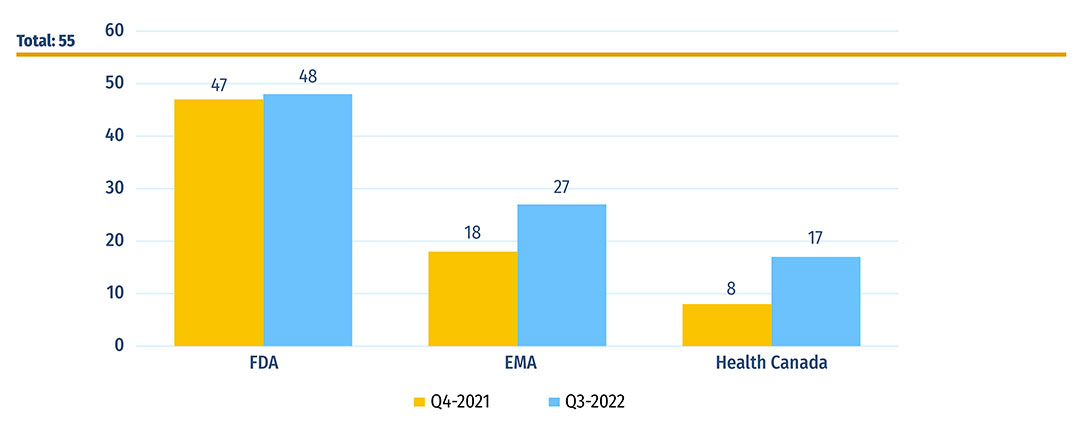
Figure C1 - Text version
| - | US Food and Drug Administration | European Medicines Agency | Health Canada |
|---|---|---|---|
| Q4-2021 | 47 | 18 | 8 |
| Q3-2022 | 48 | 27 | 17 |
Note: Based on medicines that received market approval through the US Food and Drug Administration (FDA), the European Medicines Agency (EMA) and/or Health Canada in 2021.
Data source: US Food and Drug Administration, European Medicines Agency, and Health Canada databases.
Table C1 provides a full list of the 55 new medicines approved in 2021 along with the country with first reported sales, availability in Canada, and price and treatment cost where availableFootnote 3. Prices are reported for the highest-selling form and strength of each medicine. Similarly to Table B1, prices for COVID-19 vaccines have been omitted from Table C1 as the data source did not capture government purchasing agreements. It should be noted that this information reflects the early availability and uptake of these medicines in the markets analyzed.
By Q4-2021, 40 of the new medicines had sales in Canada, the US, and/or the PMPRB11. Three quarters of these (30) had treatment costs exceeding $10,000 per year or $5,000 per 28-day course for oncology medicines, placing them in the high-cost category. Of these medicines, 14 had treatment costs over $100,000 dollars per year.
Table C1: New medicines approved in 2021, availability, prices, and treatment costs, Q4-2021
| Medicine (trade name, form, strength, volume) | Therapeutic classFootnote * | Availability | No. of countries with salesFootnote † | Canadian priceFootnote § (CAD) | PMPRB11 price (CAD) | Treatment costFootnote ** | |||||
|---|---|---|---|---|---|---|---|---|---|---|---|
| First sale in Canada, US, or PMPRB11Footnote ‡ | First sale in Canada | Min. | Median | Max. | Treatment cost (CAD) | Annual/Course | |||||
Abrocitinib (Cibinqo, film-ctd tab, 100 mg) |
D5-Nonsteroidal products for inflammatory skin disorders |
UK |
Oct-21 |
- |
2 |
49 |
46 |
47 |
48 |
17,765 to 19,882 |
Annual |
Aducanumab (Aduhelm, infus. vial/bottle, 100 mg/ml, 1.7 ml)B |
N7-Other central nervous system drugs |
US |
Jun-21 |
- |
1 |
- |
- |
- |
- |
67,926 |
Annual |
Amivantamab (Rybrevant, infus. vial/bottle, 50 mg/ml, 7 ml)B,C |
L1-Antineoplastics |
US |
Jun-21 |
- |
2 |
- |
- |
- |
- |
1,019,480 |
Annual |
Anifrolumab (Saphnelo, infus. vial/bottle, 150 mg/ml, 2 ml)B |
L4-Immunosuppressants |
FRA |
Jul-21 |
- |
2 |
- |
- |
- |
- |
74,441 |
Annual |
Asciminib (Scemblix, film-ctd tab, 40 mg)C,O |
L1-Antineoplastics |
US |
Nov-21 |
- |
1 |
85 |
- |
- |
- |
62,092 |
Annual |
Atogepant (Qulipta, tablet, 60 mg) |
N2-Analgesics |
US |
Oct-21 |
- |
1 |
- |
- |
- |
- |
2,408 to 14,450 |
Annual |
Avacopan (Tavneos, capsule, 10 mg)O |
L4-Immunosuppressants |
US |
Oct-21 |
- |
1 |
- |
- |
- |
- |
97,223 |
Annual |
Avalglucosidase alfa (Nexviazyme, infus. dry bottle, 100 mg)B,O |
A16-Other alimentary tract and metabolism products |
US |
Sep-21 |
- |
2 |
1,597 |
1,721 |
1,721 |
1,721 |
534,563 |
Annual |
Belumosudil (Rezurock, film-ctd tab, 200 mg)O |
L4-Immunosuppressants |
US |
Aug-21 |
- |
1 |
- |
- |
- |
- |
425,946 |
Annual |
Belzutifan (Welireg, afilm-ctd tab, 40 mg)O |
L1-Antineoplastics |
US |
Sep-21 |
- |
1 |
- |
- |
- |
- |
396,481 |
Annual |
Bimekizumab (Bimzelx, prefill autoinj, 160 mg/ml, 1 ml)B |
D5-Nonsteroidal products for inflammatory skin disorders |
NDL |
Aug-21 |
- |
4 |
1,625 |
1,294 |
1,619 |
1,989 |
30,631 / 22,921 |
First / subsequent years |
Casimersen (Amondys-45, infus. vial/bottle, 50 mg/ml, 2 ml)O |
M5-Other drugs for disorders of the musculo-skeletal system |
US |
Apr-21 |
- |
1 |
- |
- |
- |
- |
1,856,207 |
Annual |
Dasiglucagon (Zegalogue, prefil autoinj, 1 mg/ml, 0.6 ml) |
H4-Other hormones |
US |
Jun-21 |
- |
1 |
- |
- |
- |
- |
368 |
Per utilization |
Dostarlimab (Jemperli, infus. vial/bottle, 50 mg/ml, 10 ml)B,C |
L1-Antineoplastics |
FRA |
Nov-20 |
- |
3 |
10,270 |
6,904 |
7,825 |
8,745 |
7,380 to 11,070 |
28-day course |
Estetrol (Nextstellis, film-ctd tab, 3 mg + 15 mg) |
G3-Sex hormones and products with similar desired effects, systemic action only |
CAN |
Jun-21 |
Jun-21 |
6 |
1 |
- |
- |
- |
16 |
28-day course |
Evinacumab (Evkeeza, infus. vial/bottle, 150 mg/ml, 8 ml)B,O |
C10-Lipid-regulating/anti-atheroma preparations |
US |
May-21 |
- |
1 |
- |
- |
- |
- |
4,349,097 |
Annual |
Finerenone (Kerendia, film-ctd tab, 10 mg) |
C3-Diuretics |
US |
Jul-21 |
- |
1 |
- |
- |
- |
- |
16,605 |
Annual |
Ibrexafungerp (Brexafemme, film-ctd tab, 150 mg) |
G1-Gynaecological anti-infectives |
US |
Jul-21 |
- |
1 |
- |
- |
- |
- |
572 |
Per treatment |
Idecabtagene vicleucel (Abecma, infus. bag, 50 ml)B,C,O |
L1-Antineoplastics |
FRA |
May-21 |
- |
1 |
545,000 |
512,160 |
512,160 |
512,160 |
545,000 |
Treatment course |
Infigratinib (Truseltiq, capsule, various strengths)C,O |
L1-Antineoplastics |
US |
Jul-21 |
- |
1 |
- |
- |
- |
- |
14,264 |
28-day course |
Lisocabtagene maraleucel (Breyanzi, vial IV)B,C |
L1-Antineoplastics |
JPN |
May-21 |
- |
1 |
501,900 |
285,329 |
285,329 |
285,329 |
501,900 |
One-time |
Lonapegsomatropin (Skytrofa, dry cartridge, 9.1 mg)B,O |
H4-Other hormones |
US |
Nov-21 |
- |
1 |
- |
- |
- |
- |
37,517 |
Annual |
Maribavir (Livtencity, tablet, 200 mg) |
J5-Antivirals for systemic use |
US |
Dec-21 |
- |
1 |
277 |
- |
- |
- |
58,128 |
7.5-week course |
Mobocertinib (Exkivity, capsule, 40 mg)C,O |
L1-Antineoplastics |
US |
Sep-21 |
- |
1 |
- |
- |
- |
- |
373,088 |
Annual |
Odevixibat (Bylvay, capsule, 200 mcg)O |
A5-Cholagogues and hepatic protectors |
GER |
Sep-21 |
- |
1 |
- |
178 |
178 |
178 |
155,806 |
Annual |
Pegcetacoplan (Empaveli, infus. vial/bottle, 54 mg/ml, 20 ml)O |
L4-Immunosuppressants |
US |
Jul-21 |
- |
1 |
- |
- |
- |
- |
36,381 |
Annual |
Ponesimod (Ponvory, film-ctd tab, 20 mg) |
N7-Other central nervous system drugs |
US |
Apr-21 |
- |
5 |
- |
45 |
76 |
76 |
27,724 |
Annual |
Roxadustat (Evrenzo, film-ctd tab, 50 mg) |
B3-Haematinics, iron and all combinations |
JPN |
Oct-19 |
- |
5 |
- |
7 |
16 |
29 |
- |
- |
Samidorphan (Lybalvi, layered tabs, 10 mg + 10 mg) |
N5-Psycholeptics |
US |
Oct-21 |
- |
1 |
- |
- |
- |
- |
20,169 |
Annual |
Serdexmethylphenidate (Azstarys, capsule, 7.8 mg + 39.2 mg) |
N6-psychoanaleptics excluding anti-obesity preparations |
US |
Jul-21 |
- |
1 |
- |
- |
- |
- |
5,681 |
Annual |
Sotorasib (Lumakras, film-ctd tab, 120 mg)C,O |
L1-Antineoplastics |
US |
Jun-21 |
Oct-21 |
4 |
50 |
42 |
42 |
42 |
145,051 |
Annual |
Sotrovimab (Xevudy, infus. vial/bottle, 62.5 mg/ml, 8 ml)B |
J5-Antivirals for systemic use |
US |
Jun-21 |
- |
2 |
- |
3,596 |
3,596 |
3,596 |
2,603 |
One time |
Tepotinib (Tepmetko, film-ctd tab, 250 mg)C,O |
L1-Antineoplastics |
JPN |
Jun-21 |
- |
2 |
154 |
126 |
126 |
126 |
9,340 |
Monthly course |
Tralokinumab (Adtralza, prefill syrng sc, 150 mg/ml, 1 ml) (b) |
D5-Nonsteroidal products for inflammatory skin disorders |
NDL |
Jun-21 |
- |
4 |
422 |
334 |
411 |
450 |
22,802 / 21,633 |
First / subsequent years |
Trilaciclib (Cosela, infus. dry bottle, 300 mg)B |
L1-Antineoplastics |
US |
Mar-21 |
- |
1 |
- |
- |
- |
- |
3,286 |
One-time |
Umbralisib (Ukoniq, film-ctd tab, 200 mg)C,O |
L1-Antineoplastics |
US |
Feb-21 |
- |
1 |
- |
- |
- |
- |
213,104 |
Annual |
Vaccine, SARS-CoV-2 non-replicating vector (vial IM, 2.5 ml)B |
J7-Vaccines |
SWE |
Jan-21 |
Mar-21 |
6 |
- |
- |
- |
- |
- |
- |
Vericiguat (Verquvo, film-ctd tab, 2.5 mg) |
C6-Other cardiovascular products |
US |
Feb-21 |
- |
3 |
- |
1 |
3 |
5 |
4,167 / 4,467 |
First / subsequent years |
Viloxazine (Gelbree, capsule, 200 mg) |
N7-Other central nervous system drugs |
US |
May-21 |
- |
1 |
- |
- |
- |
- |
2,195 to 8,780 |
Annual |
Vosoritide (Voxzogo, vial dry, 560 mcg)O |
M5-Other drugs for disorders of the musculo-skeletal system |
FRA |
Jul-21 |
- |
1 |
- |
1,104 |
1,104 |
1,104 |
201,411 |
Annual |
Allogeneic processed thymus tissue (Rethymic)B |
N/A |
FDA |
Oct-21 |
No sales data in MIDAS as of Q4-2021 – date of approval by FDA, EMA, and/or Health Canada. |
|||||||
Casirivimab (Ronapreve)B |
J06-Immune sera and immunoglobulins |
EMA |
Nov-21 |
||||||||
Difelikefalin (Korsuva) |
V03-All other therapeutic products |
EMA |
Apr-22 |
||||||||
Efgartigimod (Vyvgart)B |
L04-Immunosuppressants |
FDA |
Dec-21 |
||||||||
Fexinidazole (Fexinidazole)O |
P01-Antiprotozoals |
FDA |
Jul-21 |
||||||||
Fosdenopterin (Nulibry) |
A16-Other alimentary tract and metabolism products |
FDA |
Feb-21 |
||||||||
Loncastuximab tesirine (Zynlonta)B,C,O |
L1-Antineoplastics |
FDA |
Apr-21 |
||||||||
Maralixibat (Livmarli)O |
A05-Bile and liver therapy |
FDA |
Sep-21 |
||||||||
Melphalan flufenamide (Pepaxto)C,O |
L1-Antineoplastics |
FDA |
Feb-21 |
||||||||
Pafolacianine (Cytalux)C |
V04-Diagnostic agents |
FDA |
Nov-21 |
||||||||
Regdanvimab (Regkirona)B |
J06-Immune sera and immunoglobulins |
EMA |
Nov-21 |
||||||||
Somatrogon (Ngenla)B,O |
H01-Pituitary and hypothalamic hormones and analogues |
EMA |
Feb-22 |
||||||||
Tezepelumab (Tezspire)B |
R03-Drugs for obstructive airway diseases |
FDA |
Dec-21 |
||||||||
Tisotumab vedotin (Tivdak)B,C |
L01-Antineoplastic agents |
FDA |
Sep-21 |
||||||||
Voclosporin (Lupkynis) |
L04-Immunosuppressants |
FDA |
Jan-21 |
||||||||
Note: A medicine was considered to be new in 2021 if it received market approval through the US Food and Drug Administration (FDA), the European Medicines Agency (EMA), and/or Health Canada during the calendar year.
Availability and sales information refers to all forms and strengths of the medicine while pricing and treatment costs are based on the highest-selling form and strength indicated. Sales are based on manufacturer list prices. Specialty medicines are indicated using the following abbreviations: B: biologic; C: cancer; G: gene therapy; O: orphan.
Data source: IQVIA MIDAS® Database, 2021 (all rights reserved); US Food and Drug Administration Novel Drugs 2021; European Medicines Agency Human Medicines Highlights 2021; Health Canada Notice of Compliance Database.
Figure C2 illustrates the overlap between the number of new specialty medicines authorized for market in 2021. Of the 55 new medicines approved in 2021, 42% (23) had received an orphan designation from the FDA and/or the EMA, 26% (15) were oncology treatments, and 38% (21) were biologic medicines. The main overlap was between orphan and oncology medicines, as 16% (9) of the new approvals were orphan oncology medicines.
Figure C2: Distribution of 2021 new approvals for specialty medicines
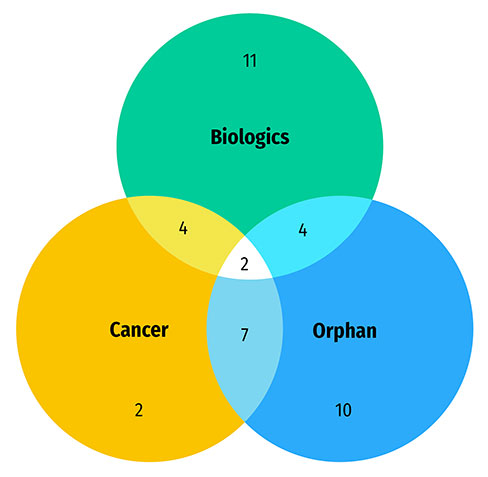
Figure C2 - Text version
- 55 new approvals for specialty medicines in 2021
- 23 medicines with an orphan designation
- 19 biologic medicines
- 15 cancer medicines
- 9 cancer medicines with an orphan designation
- 6 biologic medicines with an orphan designation
- 6 biologic cancer medicines
- 2 biologic cancer medicines with an orphan designation
Data source: US Food and Drug Administration Novel Drugs 2020; European Medicines Agency Human Medicines Highlights 2020; Health Canada Notice of Compliance Database.
D: Spotlight on Canada
While Sections B and C reported new medicines approved internationally, this section reports on Canadian approvals between 2016 and 2021, with a focus on the 36 medicines that received their first Canadian market authorization in 2020. As of Q4-2021, remdesivir and tafamidis were the highest-selling among Canada’s 2020 newly approved medicines with 57% and 24% of new-to-Canada sales, respectively.
In 2020, Health Canada granted initial market authorization to 36 medicines, slightly below the five-year average rate of 38 new medicines approvals (Figure D1). Approvals rose sharply in 2021 to 43.
Figure D1: Annual approvals for new medicines in Canada, 2016 to 2021
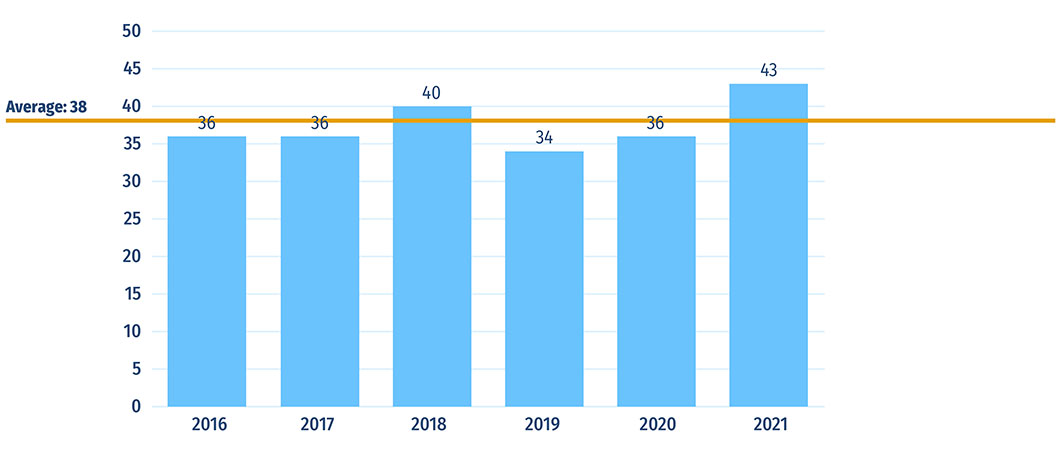
Figure D1 - Text version
| Annual approvals for new medicines in Canada | |
|---|---|
| 2016 | 36 |
| 2017 | 36 |
| 2018 | 40 |
| 2019 | 34 |
| 2020 | 36 |
| 2021 | 43 |
| Moyenne | 38 |
Data source: Health Canada Notice of Compliance database (NOC).
Table D1 reports on the therapeutic class, availability, sales, and pricing of the 36 new-to-Canada medicines approved in 2020 as of the end of 2021. The 34 new medicines with sales collectively accounted for less than 1% of branded pharmaceutical sales in Canada by Q4-2021. As was the case from an international perspective (Section B), the COVID-19 treatment remdesivir was the highest-selling new-to-Canada medicine, accounting for over half of the cohort’s sales, while tafamidis accounted for 24% of sales. Sold under the brand name Vyndaqel, tafamidis is intended to slow the progression of amyloidosis and was the only new medicine in the table to record sales in Canada, the US and all PMPRB11 countries. Darolutamide, indicated for the treatment of prostate cancer, was the third highest selling medicine with 9% of sales. These three medicines accounted for 90% of the overall sales of the medicines in the table.
For each medicine, Table D1 also provides foreign-to-Canadian price ratios, which compare the median price of medicines in the PMPRB11 countries and the US price with the Canadian price. The average price of the medicine in Canada is set to a value of one and the corresponding foreign prices are reported relative to this value. The resulting ratios reflect how much more or less Canadians would have paid for a new medicine if they had paid the median international price or the US price. The median PMPRB11 to Canadian price ratio reported across new medicines was 1.02, indicating that international prices in Q4 2021 were close to Canadian prices at introduction. In contrast, the median US price ratios show that the US pays 51% more than Canada for the same medicines. With respect to the prices of the top-selling medicines, Canada’s prices were close to those of PMPRB11 countries. While the Canadian price of remdesivir was roughly on par with the median of the PMPRB11, Canadian prices were much lower than the PMPRB11 for both tafamidis and darolutamide.
Table D1: Medicines first approved in Canada in 2020, availability, sales, and prices as of Q4-2021
| Medicine (trade name, form, strength, volume) | Therapeutic classFootnote * | Availability | Share of Canadian new medicine sales | No. of countries with salesFootnote † | Price (CAD) | ||||||
|---|---|---|---|---|---|---|---|---|---|---|---|
| First sale in the PMPRB11Footnote ‡ | First sale in Canada | First sale in US | CanadaFootnote § | PMPRB11 median | US | Median PMPRB11-to-Canadian price ratio | US-to-Canadian price ratio | ||||
Alpelisib (Piqray, film-ctd tab, 150 mg)C |
L1H9-Protein kinase inhibitor (PKI) antineoplastics, other |
Feb-20 |
Jul-20 |
Jun-19 |
1% |
5 |
94 |
127 |
- |
1.34 |
- |
Amifampridine (Firdapse, tablet, 10mg) |
N7X0-All other CNS drugs |
Dec-09 |
|
Jan-20 |
0% |
7 |
22 |
30 |
209 |
1.36 |
9.55 |
Baloxavir marboxil (Xofluza, film-ctd tab, 20 mg) |
J5B4-Influenza antivirals |
Mar-18 |
Nov-18 |
0% |
3 |
- |
24 |
87 |
- |
- |
|
Brolucizumab (Beovu, prefill syrng ophth., 120mg/ml, 0.05 ml)B,C,G,O |
S1P0-Ocular antineovascular products |
Feb-20 |
May-20 |
Oct-19 |
1% |
9 |
1,497 |
1,417 |
- |
0.95 |
- |
Cabotegravir (Cabenuva, vial IM ret., 200 mg/ml + 300 mg/ml) |
J5C9-HIVantivirals, other |
Dec-20 |
Sep-20 |
Feb-21 |
0% |
1 |
1,784 |
- |
- |
- |
- |
Caplacizumab (Cablivi, vial dry, 11 mg)B,O |
B6X0-Other haematologic agents |
Aug-18 |
- |
Mar-19 |
0% |
6 |
6,200 |
- |
9,104 |
- |
1.47 |
Cedazuridine (Inqovi, film-ctd tab, 100 mg + 35mg)B,C |
L1B0-Antimetabolites |
Jan-00 |
Nov-20 |
Sep-20 |
0% |
2 |
1,233 |
- |
1,766 |
- |
1.43 |
Darolutamide (Nubeqa, film-ctd tab, 300mg)C |
L2B2-Cyto anti-androgens |
Mar-20 |
Apr-20 |
Aug-19 |
9% |
7 |
28 |
45 |
114 |
1.60 |
4.08 |
Entrectinib (Rozlytrek, capsule, 200 mg)C,O |
L1H9-Protein kinase inhibitor (PKI) antineoplastics, other |
Sep-19 |
Jun-20 |
Aug-19 |
0% |
7 |
99 |
85 |
222 |
0.85 |
2.24 |
Etomidate (Amidate, vial IV, 2 mg/ml, 20 ml) |
N1A2-Injectable general anaesthetics |
Nov-77 |
Sep-20 |
Mar-83 |
0% |
9 |
- |
- |
9 |
- |
- |
Fedratinib (Inrebic, capsule, 100 mg)C,O |
L1H9-Protein kinase inhibitor (PKI) antineoplastics, other |
Mar-21 |
- |
Aug-19 |
0% |
1 |
85 |
- |
200 |
- |
2.36 |
Fostamatinib (Tavalisse, film-ctd tab, 100 mg)O |
B6X0-Other haematologic agents |
Jun-20 |
- |
Jun-18 |
0% |
3 |
81 |
- |
232 |
- |
2.87 |
Fremanezumab (Ajovy, prefill syrng sc, 150mg/ml, 1.5 ml)B |
N2C2-Antimigraine CGRP antagonists |
Mar-19 |
Aug-20 |
Sep-18 |
2% |
9 |
592 |
660 |
722 |
1.12 |
1.22 |
Givosiran (Givlaari, vial sc, 189 mg/ml, 1ml)O |
B6X0-Other haematologic agents |
Mar-20 |
- |
Oct-21 |
0% |
1 |
64,454 |
71,451 |
- |
1.11 |
- |
Glasdegib (Daurismo, film-ctd tab, 100 mg)C,O |
L1X9-All other antineoplastics |
Sep-20 |
- |
Dec-18 |
0% |
3 |
573 |
570 |
716 |
1.00 |
1.25 |
Isatuximab (Sarclisa, infus. vial/bottle, 20 mg/ml, 25 ml)B,C,O |
L1G9-Monoclonal antibody antineoplastics, other |
Dec-19 |
Jul-20 |
Mar-20 |
1% |
6 |
3,999 |
3,328 |
3,803 |
0.83 |
0.95 |
Lefamulin (Xenleta, film-ctd tab, 600 mg) |
J1X9-All other antibacterials |
Jan-00 |
- |
Sep-19 |
0% |
1 |
- |
- |
164 |
- |
- |
Lemborexant (Dayvigo, film-ctd tab, 5 mg) |
N5B1-Non-barbiturates, plain |
Jul-20 |
Jan-21 |
May-20 |
0% |
2 |
- |
1 |
11 |
- |
- |
Luspatercept (Reblozyl, vial dry, 75 mg)B,O |
B3X0-Other anti-anaemic preparations + folic acid |
Aug-20 |
- |
Nov-19 |
0% |
2 |
6,567 |
6,889 |
12,347 |
1.05 |
1.88 |
Mecasermin (Increlex, fpe vial sc, 10mg/ml, 4ml)B,O |
H4C0-Growth hormones |
Aug-07 |
- |
Feb-06 |
0% |
9 |
5,917 |
935 |
5,432 |
0.16 |
0.92 |
Onasemnogene abeparvovec (Zolgensma, infus. vial/bottle, 16.5 ml)B,G,O |
N7X0-All other CNS drugs |
May-20 |
- |
Jul-19 |
0% |
1 |
2,910,500 |
3,021,882 |
1.04 |
- |
|
Ozanimod (Zeposia, capsule, 920 mcg) |
N7A0-Multiple sclerosis products |
May-20 |
Mar-21 |
Jun-20 |
0% |
3 |
68 |
87 |
267 |
1.28 |
3.90 |
Polatuzumab vedotin (Polivy, infus. dry bottle, 140 mg)B,C,O |
L1G9-Monoclonal antibody antineoplastics, other |
Jan-20 |
Jun-21 |
Jun-19 |
0% |
7 |
14,750 |
15,326 |
15,487 |
1.04 |
1.05 |
Ranolazine (Corzyna/Ranexa, film-ctd tab ret., 500 mg) |
C1D0-Coronary therapy excluding calcium antagonists and nitrites |
Feb-09 |
Apr-21 |
Mar-06 |
1% |
7 |
4 |
1 |
8 |
0.35 |
2.16 |
Remdesivir (Veklury, infus. dry bottle, 100 mg) |
J5B5- Respiratory antivirals, other |
Jul-20 |
Sep-20 |
Oct-20 |
57% |
6 |
503 |
462 |
639 |
0.92 |
1.27 |
Ripretinib (Qinlock, tablet, 50 mg)C,O |
L1H9-Protein kinase inhibitor (PKI) antineoplastics, other |
Jan-00 |
Mar-21 |
Jun-20 |
0% |
1 |
216 |
- |
403 |
- |
1.86 |
Satralizumab (Enspryng, prefill syrng sc, 120 mg/ml, 1 ml)B,O |
N7X0-All other CNS drugs |
Aug-20 |
Sep-20 |
Sep-20 |
0% |
2 |
- |
15,212 |
17,275 |
- |
- |
Siponimod (Mayzent, film-ctd tab, 2 mg) |
N7A0-Multiple sclerosis products |
Jan-20 |
Apr-20 |
May-19 |
3% |
6 |
91 |
84 |
318 |
0.92 |
3.51 |
Sonidegib (Odomzo, capsule, 200 mg)C |
L1X9-All other antineoplastics |
Feb-18 |
- |
Oct-15 |
0% |
6 |
267 |
234 |
466 |
0.88 |
1.74 |
Tafamidis (Vyndaqel, capsule, 20 mg)O |
C1X0-All other cardiac preparations |
Nov-11 |
Apr-20 |
May-19 |
24% |
13 |
204 |
495 |
179 |
2.43 |
0.88 |
Tenapanor (Ibsrela, tablet, 50 mg) |
A3G0-Gastro-intestinal sensorimotor modulators |
Jan-00 |
Nov-20 |
- |
0% |
1 |
3 |
- |
- |
- |
- |
Trientine (MAR-Trientine, film-ctd tab, 150 mg)O |
V3E0-Antidotes |
Sep-94 |
- |
Apr-86 |
0% |
7 |
- |
63 |
- |
- |
- |
Tucatinib (Tukysa, film-ctd tab, 150 mg)C,O |
L1H9-Protein kinase inhibitor (PKI) antineoplastics, other |
Dec-20 |
- |
Apr-20 |
0% |
1 |
120 |
- |
173 |
- |
1.45 |
Voretigene neparvovec (Luxturna, ophth. vial, 0.5 ml)B,G,O |
S1X2-Other ophthalmologicals, topical |
Apr-19 |
- |
Jun-18 |
0% |
3 |
515,750 |
460,055 |
434,547 |
0.89 |
0.84 |
Gallium (68GA) chloride, germanium chloride (Galliapharm) |
V09IX-Other diagnostic radiopharmaceuticals for tumour detection |
Aug-20 |
No sales data in MIDAS as of Q4-2021 – date of approval by FDA, EMA, and/or Health Canada. |
||||||||
Obiltoxaximab (Anthim) |
J06BB-Specific immunoglobulins |
Jul-20 |
|||||||||
Note: Availability and sales information refer to all forms and strengths of the medicine, while pricing and treatment costs are based on the highest-selling form and strength indicated. Sales are based on manufacturer list prices.
Specialty medicines are indicated using the following abbreviations: B: biologic; C: cancer; G: gene therapy; O: orphan.
Data source: IQVIA MIDAS® Database, 2021, all rights reserved; Health Canada Notice of Compliance Database
References
European Medicines Agency. 2021. Human Medicines Highlights 2020. Available: https://www.ema.europa.eu/en/news/human-medicines-highlights-2020
European Medicines Agency. 2022. Human Medicines Highlights 2021. Available: https://www.ema.europa.eu/en/news/human-medicines-highlights-2021
Food and Drug Administration. 2021. Novel Drug Approvals for 2020. Silver Spring, Maryland: US FDA, Center for Drug Evaluation and Research. Available: https://www.fda.gov/drugs/new-drugs-fda-cders-new-molecular-entities-and-new-therapeutic-biological-products/novel-drug-approvals-2020
Food and Drug Administration. 2022. Novel Drug Approvals for 2021. Silver Spring, Maryland: US FDA, Center for Drug Evaluation and Research. Available: https://www.fda.gov/drugs/new-drugs-fda-cders-new-molecular-entities-and-new-therapeutic-biological-products/novel-drug-approvals-2021
Gaudette, É., Rizzardo, S., Wladyka, S.B., Rahman, T., Pothier, K.R. 2023. Is Canada Missing Out? An Assessment of Drugs Approved Internationally Between 2016 and 2020 and Not Submitted for Health Canada Review. CMAJ, 195 (23), E815-E820; DOI: 10.1503/cmaj.230339.
Health Canada. 2021. Drug and medical device highlights 2020: Helping you maintain and improve your health. Ottawa: Health Canada. Available: https://www.canada.ca/en/health-canada/services/publications/drugs-health-products/drug-medical-device-highlights-2020.html
Health Canada. 2022. Health product highlights 2021: Helping you maintain and improve your health. Ottawa: Health Canada. Available: https://www.canada.ca/en/health-canada/services/publications/drugs-health-products/health-product-highlights-2021.html
PMPRB. 2020. Oncology Medicines in Canada: Trends and International Comparisons, 2010-2019. Ottawa: Patented Medicine Prices Review Board. Available: https://www.canada.ca/en/patented-medicine-prices-review/services/npduis/analytical-studies/oncology-medicines-trends-international-comparisons/intro.html
PMPRB. 2022a. Annual Report, 2021. Ottawa: Patented Medicine Prices Review Board. Available: https://www.canada.ca/en/patented-medicine-prices-review/services/annual-reports/annual-report-2021.html
PMPRB. 2022b. Expensive Drugs for Rare Diseases: Canadian Trends and International Comparisons, 2011-2020. Ottawa: Patented Medicine Prices Review Board. Available: https://www.canada.ca/en/patented-medicine-prices-review/services/npduis/analytical-studies/chartbook/expensive-drugs-rare-diseases-2011-2020.html
PMPRB. 2022c. Meds Pipeline Monitor, 2021. Ottawa: Patented Medicine Prices Review Board. Available: https://www.canada.ca/en/patented-medicine-prices-review/services/npduis/analytical-studies/meds-pipeline-monitor-2021