
ARCHIVED - Canadian Incidence Study of Reported Child Abuse and Neglect 2008
Chapter 3 - Rates of Maltreatment-Related Investigations in the CIS-1998, CIS-2003, and CIS-2008
Chapter 3
- Comparisons between CIS-1998, 2003, and 2008
- Maltreatment-Related Investigations
- Child Age in Investigations
- Types of Investigations and Substantiation Decisions
- Referral Source
- Rates of Ongoing Services, Placement, and Court
- Previous Child Maltreatment Investigations
- Child Welfare Court Applications
Nico Trocmé, Barbara Fallon, Bruce MacLaurin, Vandna Sinha, Tara Black, Elizabeth Fast, Caroline Felstiner, Sonia Hélie, Daniel Turcotte, Pamela Weightman, Janet Douglas, and Jill Holroyd
This chapter compares rates of maltreatment-related investigations found in the 1998, 2003, and 2008 cycles of the CIS. These results should be interpreted with caution since a number of factors are not controlled for in these descriptive tables. Changes in rates of maltreatment-related investigations can be attributed to a number of factors including (1) changes in public and professional awareness of the problem, (2) changes in legislation or in casemanagement practices, (3) changes in CIS study procedures and definitions,22 and (4) changes in the actual rate of maltreatment (Trocmé et al., in press). As noted in the introductory and methods chapters of this report, changes in practices with respect to investigations of risk of maltreatment pose a particular challenge since these cases were not clearly identified in the 1998 and 2003 cycles of the study. Readers are reminded that because of these changes, the findings presented in this report are not directly comparable to findings presented in the CIS-1998 and CIS-2003 reports. Given the growing complexity of the CIS, more detailed analyses will be developed in subsequent publications.23
The estimates presented in this chapter are weighted estimates derived from child-maltreatment–related investigations from representative samples of child welfare organizations conducted in 1998, 2003, and 2008. The sampling design and weighting procedures specific to each study should be considered before inferences are drawn from these estimates (see Chapter 2 of this report, as well as the methods chapters of the 1998 and 2003 reports) (Trocmé et al., 2001; Trocmé, Fallon et al., 2005).
Estimates presented from the CIS-1998, CIS-2003, and CIS-2008 do not include (1) incidents that were not reported to child welfare, (2) reported cases that were screened out by child welfare before being fully investigated, (3) new reports on cases already opened by the child welfare sites, and (4) cases that were investigated only by the police.
Data are presented in terms of the estimated annual number of investigations, as well as the incidence of investigations per 1,000 children aged newborn to 15 years (inclusively).24 These figures refer to child investigations and not to the number of investigated families. Investigations include all maltreatment-related investigations including cases that were investigated because of future risk of maltreatment. Because risk of future maltreatment cases were not tracked separately in the 1998 and 2003 cycles of the CIS, comparisons other than total counts of investigations are beyond the scope of this report.
Comparisons Between CIS-1998, 2003, and 2008
Comparisons focus on changes in rates and key characteristics of investigations. Where possible, the tables present Canada-wide data for the three cycles; however, some tables exclude Québec because equivalent data were not available in the 2003 cycle of the study (Trocmé, Fallon et al., 2005). Certain estimates reported in Chapter 3 tables were re-calculated for the 2008 report to ensure consistency in estimation procedures. As a result, estimates for the CIS-1998 and the CIS-2003 used in the 2008 report may differ slightly from those published in previous reports. Statistical tests of significance were used to test differences between the 2003 and 2008 estimates. Tests of significance for 1998 to 2003 differences were presented in the CIS-2003 report (Trocmé, Fallon et al., 2005).
Québec estimates for Tables 3-5 and 3-6 are derived from an updated version of the EIQ-2003 database. Subsequent to the publication of the CIS-2003 report, the EIQ research team was able to retrieve previously unavailable information from the PIJ information system, including information on ongoing services and placement. These updated estimates were presented in a technical report (Turcotte et al., 2007) and used to derive 2003 Québec estimates for Tables 3-5 and 3-6 of the present report. A number of caveats should be noted in interpreting these estimates. Because estimates were derived from aggregate figures from the EIQ-2003 technical report (Tables 12b and 14b) tests of significance could not be completed.
Maltreatment-Related Investigations
Table 3-1 presents the number and incidence of maltreatment-related investigations in 1998, 2003, and 2008. In 1998, an estimated 135,261 investigations were conducted in Canada, a rate of 21.47 investigations per 1,000 children. In 2003, the number of investigations nearly doubled, with an estimated 235,315 investigations and a rate of 38.33 per 1,000 children (Trocmé et al., in press). In contrast, the number of investigations has not changed significantly between 2003 and 2008. In 2008, an estimated 235,842 maltreatment-related investigations were conducted across Canada, representing a rate of 39.16 investigations per 1,000 children.
| Child Welfare Investigations | |||||
|---|---|---|---|---|---|
| 1998 | 2003 | 2008 | |||
| Number of investigations |
Rate per 1,000 children |
Number of investigations |
Rate per 1,000 children |
Number of investigations |
Rate per 1,000 children |
| 135,261 | 21.47 | 235,315 | 38.33 | 235,842 | 39.16ns |
Canadian Incidence Study of Reported Child Abuse and Neglect – 2008
^ Based on a sample of 7,633 investigations in 1998, 14,200 investigations in 2003, and 15,980 investigations in 2008.
ns Difference between 2003 and 2008 incidence rates is not statistically significant (p>.05).
Child Age in Investigations
Table 3-2 describes the number and incidence of maltreatment-related investigations by age group, in 1998, 2003, and 2008. In 2008, children under the age of one year were the most likely to be investigated, with a rate of 51.81 investigations per 1,000 children. Rates of investigations decreased with age: 43.14 investigations per 1,000 children one to three years old, 41.73 investigations per 1,000 children four to seven years old, 36.92 investigations per 1,000 children eight to 11 years old, and 34.26 investigations per 1,000 children 12 to 15 years old. The age-related pattern is similar to the pattern observed in 1998 and in 2003.
Comparing the incidence of investigation by age group between 2003 and 2008, there has been a non-statistically significant increase in rates for children seven and under, and a non-statistically significant decrease in rates for children 8 to 15. The incidence of investigations for children under age one increased from 49.54 investigations per 1,000 children in 2003 to 51.81 investigations per 1,000 children in 2008, but this increase was not statistically significant. Readers should note that comparisons between age groups should always be made on the basis of incidence rates that take into consideration variations in the age distribution in the general population, rather than on the basis of the count of investigations.
| 1998 | 2003 | 2008 | |||||||
|---|---|---|---|---|---|---|---|---|---|
| Child age group |
Number of investigations | Rate per 1,000 children |
% | Number of investigations | Rate per 1,000 children |
% | Number of investigations | Rate per 1,000 children |
% |
| < 1 year | 6,317 | 17.23 | 5% | 15,727 | 49.54 | 7% | 17,501 | 51.81ns | 7% |
| 1-3 years | 24,637 | 21.46 | 18% | 37,147 | 36.51 | 16% | 43,694 | 43.14ns | 19% |
| 4-7 years | 36,623 | 22.66 | 27% | 59,978 | 39.42 | 25% | 58,405 | 41.73ns | 25% |
| 8-11 years | 33,098 | 20.99 | 24% | 65,455 | 39.46 | 28% | 57,601 | 36.92ns | 24% |
| 12-15 years | 34,586 | 21.68 | 26% | 57,008 | 35.10 | 24% | 58,641 | 34.26ns | 25% |
| Total Investigations | 135,261 | 21.47 | 100% | 235,315 | 38.33 | 100% | 235,842 | 39.16ns | 100% |
Canadian Incidence Study of Reported Child Abuse and Neglect – 2008
^ Based on a sample of 7,633 investigations in 1998, 14,200 investigations in 2003, and 15,980 investigations in 2008. Percentages are column percentages.
ns Difference between 2003 and 2008 incidence rates is not statistically significant (p>.05).
Types of Investigations and Substantiation Decisions
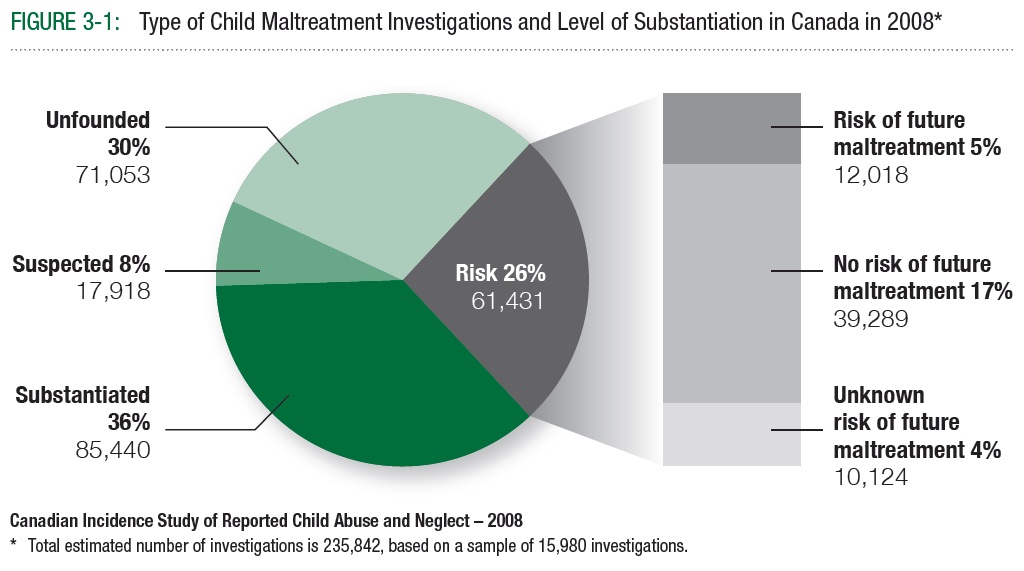
Figure 3-1 describes types of investigations and substantiation decisions resulting from maltreatmentrelated investigations conducted across Canada in 2008. As noted above, the CIS-2008 tracked two types of investigations: those conducted because of a concern about a maltreatment incident that may have occurred and those conducted because there may be significant risk of future maltreatment. The outcomes of maltreatment investigations are classified into three levels of substantiation:
- Substantiated: the balance of evidence indicates that abuse or neglect has occurred;
- Suspected: insufficient evidence to substantiate abuse or neglect, but maltreatment cannot be ruled out;
- Unfounded: the balance of evidence indicates that abuse or neglect has not occurred. Unfounded does not mean that a referral was inappropriate or malicious; it simply indicates that the worker determined that the child had not been maltreated.

[Accessible Version]
Of the estimated 235,842 child-maltreatment-related investigations conducted in Canada in 2008, 74% focused on possible incidents of abuse or neglect that may have already occurred (174,411 investigations) and 26% were concerns about risk of future maltreatment (61,431 investigations).
Thirty-six percent of the investigations (or 85,440) were substantiated. In a further 8% of investigations (or 17,918), there was insufficient evidence to substantiate maltreatment; however, maltreatment remained suspected by the worker at the completion of the intake investigation. Thirty percent of investigations (or 71,053) were unfounded.
In 5% of investigations (or 12,018), the worker concluded there was a risk of future maltreatment. In 17% of investigations (or 39,289), no risk of future maltreatment was indicated. In 4% of investigations (or 10,124), workers did not know whether the child was at risk of future maltreatment.
For additional information, refer to pages 23-24.
The outcome of risk of future maltreatment investigations are classified into three response categories:
- Risk of future maltreatment
- No risk of future maltreatment
- Unknown risk of future maltreatment
CIS-2008
Of the estimated 235,842 child maltreatment investigations conducted in Canada in 2008, 74% of investigations focused on a concern of abuse or neglect (174,411 child maltreatment investigations or 28.97 investigations per 1,000 children) and 26% of investigations were concerns about risk of future maltreatment (61,431 investigations or 10.19 investigations per 1,000 children). Thirty-six percent of all investigations were substantiated (85,440 investigations or 14.19 investigations per 1,000 children). In a further 8% of investigations (17,918 child investigations or 2.98 investigations per 1,000 children) there was insufficient evidence to substantiate maltreatment; however, maltreatment remained suspected by the worker at the conclusion of the investigation. Thirty percent of investigations (71,053 child investigations or 11.80 investigations per 1,000 children) were unfounded. In 5% of investigations, the worker concluded there was a risk of future maltreatment (2.00 per 1,000 children or 12,018 child investigations). In 17% of investigations, no risk of future maltreatment was indicated (39,289 investigations or 6.52 investigations per 1,000 children). In 4% of investigations workers did not know whether the child was at risk of future maltreatment.
CIS-1998, 2003, and 2008
As shown in Table 3-3, rates of substantiated maltreatment doubled from 1998 to 2003. In contrast with this increase, the rate of substantiated maltreatment appears to have decreased between 2003 and 2008 from 18.67 per 1,000 children to 14.19 per 1,000. This comparison, however, is complicated, since the 1998 and 2003 cycles of the CIS did not specifically track risk of future maltreatment investigations. It is not possible to determine to what extent some confirmed risk of future maltreatment cases may have been classified as “substantiated” maltreatment. As noted in Chapter 2, a validation study using a subsample of CIS-2003 investigations found that several cases had been coded in this manner. Combining the 2008 rate of confirmed cases of risk of future maltreatment (2.00 per 1,000 children) with the 2008 rate of substantiated cases (14.19 per 1,000 children), yields a rate of 16.19 investigations per 1,000 children, where either maltreatment has been substantiated or future risk has been confirmed. Further analysis of the CIS-2008 risk of future maltreatment investigations is required before differences between categories of investigation outcomes can be appropriately interpreted.
| 1998 | 2003 | 2008 | ||||||||
|---|---|---|---|---|---|---|---|---|---|---|
| Child maltreatment investigations | Number of investigations | Rate per 1,000 children |
% | Number of investigations | Rate per 1,000 children |
% | Child maltreatment and risk-only investigations | Number of investigations | Rate per 1,000 children |
% |
| Substantiated maltreatment | 58,012 | 9.21 | 43% | 114,607 | 18.67 | 49% | Substantiated maltreatment | 85,440 | 14.19 | 36% |
| Risk of future maltreatment | 12,018 | 2.00 | 5% | |||||||
| Total substantiated maltreatment | 58,012 | 9.21 | 43% | 114,607 | 18.67 | 49% | Total substantiated maltreatment and risk of future maltreatment | 97,458 | 16.19ns | 41% |
Canadian Incidence Study of Reported Child Abuse and Neglect – 2008
^ Based on a sample of 2,046 substantiated child maltreatment investigations in 1998, 5,660 substantiated child maltreatment investigations in 2003, and 7,032 substantiated investigations (6,163 child maltreatment and 869 risk of future maltreatment) in 2008. Percentages are column percentages.
ns Difference between 2003 and 2008 incidence rates is not statistically significant (p>.05).
Referral Source
Each independent contact with the child welfare site regarding a child (or children) was counted as a separate referral. The person who contacted the child welfare site was identified as the referral source. For example, if a child disclosed an incident of abuse to a schoolteacher, who made a report to a child welfare site, the school was counted as a referral source. However, if both the schoolteacher and the child’s parent called, both would be counted as referral sources.
The CIS-2008 Maltreatment Assessment Form included 19 pre-coded referral source categories, which for the purposes of analysis are collapsed into the 12 categories listed below.
Non-Professional Referral Sources
Parent: This includes parents involved as a caregiver to the reported child, as well as non-custodial parents.
Child: A self-referral by any child listed on the Intake Face Sheet of the CIS-2008 Maltreatment Assessment Form.
Relative: Any relative of the child in question. Workers were asked to code “other” for situations in which a child was living with a foster parent and a relative of the foster parent reported maltreatment.
Neighbour/Friend: This category includes any neighbour or friend of the children or his/her family.
Professional Referral Sources
Community Agencies: This includes social assistance worker (involved with the household), crisis service/shelter worker (includes any shelter or crisis services worker) for domestic violence or homelessness, community recreation centre staff (refers to any person from a recreation or community activity programs), day care centre staff (refers to a child care or day care provider), and community agency staff.
Health Professional: This includes hospital referrals that originate from a hospital made by either a doctor, nurse or social worker rather than a family physician’s office, community health nurse (nurses involved in services such as family support, family visitation programs and community medical outreach), and physician (any family physician with a single or ongoing contact with the child and/or family).
School: Any school personnel (teacher, principal, teacher’s aide, etc.)
Mental Health Professional/Agency: Includes family service agencies, mental health centres (other than hospital psychiatric wards), and private mental health practitioners (psychologists, social workers, other therapists) working outside of a school/hospital/child welfare/Youth Justice Act setting.
Other Child Welfare Services: Includes referrals from mandated Child Welfare service providers from other jurisdictions or provinces.
Police: Any member of a Police Force, including municipal, provincial/ territorial or the Royal Canadian Mounted Police (RCMP).
Other Referral Sources
Anonymous: A caller who is not identified.
Other Referral Source: Any other source of referral not listed above.
For Table 3-4a, referral sources were collapsed into three main categories: any non-professional referral, any professional referral, and other referral sources. This table describes the sources of referrals (excluding Québec) in 1998, 2003, and 2008. Data regarding referral sources for all investigations were not available for Québec for the 2003 data collection cycle. Although there was a significant change in the distribution of referral sources between 1998 and 2003, from 2003 to 2008 it remained approximately the same.
| 1998 | 2003 | 2008 | |||||||
|---|---|---|---|---|---|---|---|---|---|
| Referral Source | Number of investigations | Rate per 1,000 children |
% | Number of investigations | Rate per 1,000 children |
% | Number of investigations | Rate per 1,000 children |
% |
| Any non-professional referral | 40,118 | 8.31 | 34% | 56,254 | 11.82 | 26% | 57,847 | 12.40ns | 26% |
| Any professional referral | 68,687 | 14.22 | 58% | 145,411 | 30.56 | 67% | 148,555 | 31.83ns | 68% |
| Anonymous/other referral | 14,100 | 2.92 | 12% | 21,602 | 4.54 | 10% | 18,932 | 4.06ns | 9% |
| Total Investigations | 118,552 | 24.54 | 100% | 217,319 | 45.67 | 100% | 217,960 | 46.68ns | 100% |
Canadian Incidence Study of Reported Child Abuse and Neglect - 2008
^ Based on a sample of 5,363 investigations in 1998, 11,562 investigations in 2003, and 14,050 investigations in 2008. Columns are not additive because an investigation could have had more than one referral source. Percentages are column percentages.
ns Difference between 2003 and 2008 incidence rates is not statistically significant (p>.05).
Table 3-4a shows referral source data from 2008 (excluding Québec): 26% of investigations or an estimated 57,847 investigations were referred by nonprofessional sources (rate of 12.40 investigations per 1,000 children), and 68% of investigations were referred by professionals (an estimated 148,555 investigations or 31.83 investigations per 1,000 children). In 9% of investigations (4.06 investigations per 1,000 children) the referral source was classified as other, either because it was anonymous or was categorized as an “other” source of referral.
Unlike Table 3-4a, Table 3-4b includes Québec; as a result, the two tables cannot be directly compared. Some specific referral sources have been collapsed into categories: custodial parents and non-custodial parent (custodial or noncustodial parent) and social assistance worker, crisis service/shelter, community recreation centre, community health nurse, community physician, community mental health professional or community agency (community, health and social services). The largest number of referrals was from schools (24% of investigations or 9.34 investigations per 1,000 children). The second largest source of referrals was police (22% of investigations or 8.77 investigations per 1,000 children). Custodial or non-custodial parents were the largest non-professional referral source (11% of investigations or 4.42 per thousand children).
| Including Quebec | |||
|---|---|---|---|
| Referral Source | Number of investigations | Rate per 1,000 children | % |
| Non-professional | |||
| Custodial or non-custodial parent | 26,612 | 4.42 | 11% |
| Child (subject of referral) | 3,608 | 0.60 | 2% |
| Relative | 16,463 | 2.73 | 7% |
| Neighbour/friend | 16,508 | 2.74 | 7% |
| Professional | |||
| Community health or social services | 27,683 | 4.60 | 12% |
| Hospital (any personnel) | 11,812 | 1.96 | 5% |
| School | 56,255 | 9.34 | 24% |
| Other child welfare service | 13,855 | 2.30 | 6% |
| Day care centre | 2,489 | 0.41 | 1% |
| Police | 52,792 | 8.77 | 22% |
| Anonymous/other | |||
| Anonymous | 11,414 | 1.90 | 5% |
| Other | 8,046 | 1.34 | 3% |
| Total Investigations | 235,842 | 39.16 | 100% |
Canadian Incidence Study of Reported Child Abuse and Neglect - 2008
^ Based on a sample of 15,980 investigations. Columns are not additive because an investigation could have had more than one referral source.
Percentages are column percentages.
Rates of Ongoing Services, Placement, and Court
Three key service events occur as a result of a child welfare investigation: a child can be brought into out-of-home care, an application can be made for a child welfare court order, and a decision is made to close a case or provide ongoing services. While the CIS tracks these decisions made during the investigation, the study does not track events that occur after the initial investigation. Additional admissions to out-of-home care may occur for cases kept open after the initial investigation. It should also be noted that investigation intervention statistics presented apply only to child welfare cases opened because of alleged maltreatment or risk of future maltreatment. Children referred to child welfare for reasons other than child maltreatment or risk of maltreatment (e.g., behavioural or emotional problems; see Chapter 2) may have been admitted to care or received ongoing services, but were not tracked by the CIS.
Ongoing Child Welfare Services
Workers were asked whether the investigated case would remain open for further child welfare services after the initial investigation (Table 3-5). An estimated 62,715 (27%) investigations in 2008 were identified as remaining open for ongoing services while an estimated 172,782 (73%) investigations were closed.
There was a decrease in the incidence of investigations remaining open for ongoing services from 11.73 investigations per 1,000 children in 2003 to 10.41 per 1,000 children in 2008. As with all other major trends documented by the CIS, this decrease follows an increase in cases remaining open for ongoing services from 7.27 per 1,000 children in 1998 to 11.73 per 1,000 children in 2003. Because of limitations with some of the 2003 data in Table 3-5, it was not possible to test statistical significance.
| 1998 | 2003 | 2008 | ||||||||
|---|---|---|---|---|---|---|---|---|---|---|
| Provision of ongoing services |
Number of investigations | Rate per 1,000 children |
% | Number of investigations | Rate per 1,000 children |
% | Number of investigations | Rate per 1,000 children |
% | |
| Case to stay open for ongoing services | 45,814 | 7.27 | 35% | 72,023 | 11.73 | 29% | 62,715 | 10.41 | 27% | |
| Case to be closed | 85,131 | 13.51 | 65% | 163,117 | 26.57 | 71% | 172,782 | 28.70 | 73% | |
| Total investigations | 130,945 | 20.78 | 100% | 235,140 | 38.30 | 100% | 235,497 | 39.11 | 100% | |
Canadian Incidence Study of Reported Child Abuse and Neglect - 2008
^ Based on a sample of 7,458 investigations in 1998 (with information on openings or closures), 14,105 investigations in 2003, and 15,945 investigations in 2008 with information about transfers to ongoing services.
Percentages are column percentages.
Out-of-Home Placement
The CIS tracked out-of-home placements that occurred at any time during the investigation. Workers were asked to specify the type of placement. In cases where there may have been more than one placement, workers were asked to indicate the setting where the child had spent the most time. The following placement classifications were used:
No Placement Required: No placement is required following the investigation.
Placement Considered: At this point of the investigation, an out-of home placement is still being considered.
Informal Kinship Care: An informal placement has been arranged within the family support network (kinship care, extended family, traditional care); the child welfare authority does not have temporary custody.
Kinship Foster Care: A formal placement has been arranged within the family support network (kinship care, extended family, traditional care); the child welfare authority has temporary or full custody and is paying for the placement.
Family Foster Care (non-kinship): Includes any family-based care, including foster homes, specialized treatment foster homes, and assessment homes.
Group Home Placement: An out-of-home placement required in a structured group living setting.
Residential/Secure Treatment: Placement required in a therapeutic residential treatment centre to address the needs of the child.
For the purposes of Table 3-6, these placement categories were combined into four broader categories: child remained at home (no placement required or placement considered), child with relative (not a formal child welfare placement), foster care (which includes kinship care and non-kinship family care), and group home or residential treatment placement (group home and residential/secure treatment).
| 1998 | 2003 | 2008 | |||||||
|---|---|---|---|---|---|---|---|---|---|
| Placement status | Number of investigations | Rate per 1,000 children | % | Number of investigations | Rate per 1,000 children | % | Number of investigations | Rate per 1,000 children |
% |
| Child remained at home | 117,712 | 18.68 | 87% | 216,724 | 35.30 | 92% | 215,878 | 35.85 | 92% |
| Informal kinship care | 5,851 | 0.93 | 4% | 7,122 | 1.16 | 3% | 8,713 | 1.45 | 4% |
| Foster care (kinship and non-kinship) | 8,835 | 1.40 | 7% | 8,533 | 1.39 | 4% | 9,454 | 1.57 | 4% |
| Group home and residential/ secure treatment |
2,168 | 0.34 | 2% | 2,776 | 0.45 | 1% | 1,432 | 0.24 | 0% |
| Total investigations | 134,566 | 21.35 | 100% | 235,156 | 38.30 | 100% | 235,477 | 39.10 | 100% |
Canadian Incidence Study of Reported Child Abuse and Neglect - 2008
^ Based on a sample of 7,544 investigations in 1998, 14,105 investigations in 2003, and 15,945 investigations in 2008 with information about child welfare placement.
Percentages are column percentages.
In 2008, there were no placements in 92% of investigations (215,878 investigations or 35.85 investigations per 1,000 children). Eight percent of investigations resulted in a change of residence for the child: 4% to informal kinship care (an estimated 8,713 investigations or 1.45 investigations per 1,000 children; 4% to foster care or kinship care (an estimated 9,454 investigations or 1.57 investigations per 1,000 children) and fewer than 1% to residential secure treatment or group homes (an estimated 1,432 investigations or 0.24 investigations per 1,000 children).
There generally has been little change in placement rates (as measured during the maltreatment investigation) across the three cycles of the CIS, other than an increase in informal placements of children with relatives. Because of limitations with some of the 2003 data in Table 3-6, it was not possible to test statistical significance.
Previous Child Maltreatment Investigations
Workers were asked if the investigated child had been previously reported to the child welfare site for suspected maltreatment. Table 3-7 does not include estimates from Québec because of differences in the way these were tracked in the province.
| 1998 | 2003 | 2008 | |||||||
|---|---|---|---|---|---|---|---|---|---|
| Previous investigations | Number of investigations | Rate per 1,000 children |
% | Number of investigations | Rate per 1,000 children |
% | Number of investigations | Rate per 1,000 children |
% |
| Child previously investigated | 53,243 | 11.02 | 45% | 108,769 | 22.86 | 49% | 103,810 | 22.26ns | 48% |
| Child not previously investigated | 58,288 | 12.07 | 49% | 106,675 | 22.42 | 50% | 111,084 | 23.82ns | 51% |
| Unknown | 6,557 | 1.36 | 6% | 1,835 | 0.39 | 1% | 3,003 | 0.64ns | 1% |
| Total investigations | 118,088 | 24.45 | 100% | 217,278 | 45.67 | 100% | 217,897 | 46.72ns | 100% |
Canadian Incidence Study of Reported Child Abuse and Neglect - 2008
^ Based on a sample of 5,349 investigations in 1998, 11,560 investigations in 2003, and 14,046 investigations in 2008 with information about previous referrals. Percentages are column percentages.
ns Difference between the 2003 and 2008 incidence rates is not statistically significant (p>.05).
In 2008, the number of children who had been previously investigated was almost evenly divided between previously investigated and not previously investigated. In 48% of 2008 investigations, workers indicated that the child had been referred previously for suspected maltreatment (103,810 investigations, representing a rate of 22.26 per 1,000 children). In 51% of investigations, the child had not been previously investigated for suspected maltreatment (111,084 investigations, representing a rate of 23.82 investigations per 1,000 children). In 1% of investigations, the worker did not know whether the child had been previously reported for suspected maltreatment (an estimated 3,003 investigations, representing a rate of 0.64 investigations per 1,000 children).
There were no statistically significant changes in the rates between the CIS-2003 and CIS-2008.
Child Welfare Court Applications
Table 3-8 describes any applications made to child welfare court during the investigation period. Applications to child welfare court can be made for a number of reasons, including orders of supervision with the child remaining in the home, as well as out-of-home placement orders, temporary or permanent. Although applications to court can be made during the investigation period, many statutes require that, where possible, non-courtordered services be offered before an application is made to court. Because the CIS could track only applications made during the investigation period, the CIS court application rate does not account for applications made at later points of service.
| 2008 | |||
|---|---|---|---|
| Child Welfare Court | Number of investigations | Rate per 1,000 children |
% |
| No application to court | 223,063 | 37.04 | 95% |
| Application made | 12,700 | 2.11 | 5% |
| Total investigations | 235,763 | 39.15 | 100% |
Canadian Incidence Study of Reported Child Abuse and Neglect -2008
^ Based on a sample of 15,972 investigations with information about child welfare court.
Percentages are column percentages.
Workers chose from three possible statuses for court involvement during the initial investigation:
No Application: Court involvement was not considered.
Application Considered: The child welfare worker was considering whether or not to submit an application to child welfare court.
Application Made: An application to child welfare court was submitted.
Table 3-8 collapses “no court” and “court considered” into a single category (no application to court). Furthermore, Table 3-8 describes only court applications documented in the CIS-2008. Canadawide estimates for court use in 1998 and 2003 could not be produced because of differences in the way court information was tracked in Québec in the CIS-1998 and CIS-2003.
In the CIS-2008, 5% of all child investigations (an estimated 12,700 investigations or an incidence of 2.11 court applications per 1,000 children) resulted in an application to child welfare court, either during or at the completion of the initial maltreatment investigation.