
Highlights from the 2021 childhood National Immunization Coverage Survey (cNICS)
On this page
Key highlights
- The impact of the pandemic is not fully captured among 2-, 14-, and 17-year-olds in the cNICS 2021 sample, as many children had received some of their routine vaccines prior to the start of the pandemic.
- National vaccine coverage estimates for 2-year-olds were similar in 2021 compared to 2019 and ranged from a low of 77% for diphtheria, pertussis and tetanus (DTaP) to a high of 92% for polio and measles. Varicella vaccine coverage increased from 83% in 2019 to 87% in 2021.
- Two-year-old children identifying as Black had significantly lower vaccine coverage for DTaP (66%), Hib (65%), pneumococcal (73%) and rotavirus (69%) vaccines compared to white children (DTaP: 78%, Hib: 77%, pneumococcal: 86%, rotavirus: 86%).
- Vaccine coverage was similar among Indigenous and white children except for polio which was higher among Indigenous children (95% vs. 91%, respectively).
- In 2021, an index of remotenessEndnote 1 was calculated and used to assess how close and easy it is for children to access services. Two-year-old children living in remote areas generally had lower vaccine coverage compared to those living in more accessible locations.
- Although not statistically significant, some decreases in coverage were observed for vaccines measured at 7 years of age in 2021 compared to 2019 (e.g., DTaP coverage decreased by 6%, measles coverage decreased by 4%, while polio and rubella coverage decreased by 2%) indicating that vaccine doses due at school-entry may have been impacted by the COVID-19 pandemic.
- National vaccine coverage estimates for 14-year-olds have generally increased in 2021 compared to 2019.
- HPV vaccine coverage among 14-year-olds has increased overall from 80% in 2019 to 84% in 2021 and has increased among 14-year-old males from 73% in 2019 to 81% in 2021. HPV vaccine coverage has not changed for 14-year-old girls (87% in 2019 and 86% in 2021).
- Hepatitis B coverage by 14 years of age has increased from 85% in 2019 to 89% in 2021 and is approaching the vaccination coverage goal of 90%.
- National vaccine coverage estimates for 17-year-olds have remained generally stable between 2021 and 2019. To date, none of Canada's national vaccination coverage goals have been reached for any age group, except for receipt of 1 dose of Tdap vaccine by 17 years of age (93% in 2021 against a coverage goal of 90%).
- In 2021, 2% of 2-year-old children had not received any vaccine in their lifetime. The main reason reported among parents/guardians who chose not to vaccinate was concern about the risk of side effects (55%).
- In 2021, 6% of parents of 2-year-old children and 20% of parents of 14-year-old children were initially hesitant, but ended up having their child vaccinated.
- In 2021, 9% of parents of 2- and 14-year-olds had decided to delay at least 1 vaccine for their child.
-
Impact of the pandemic:
- The majority of parents of 2-year-olds (89%) reported that the pandemic did not change the inclination to vaccinate their children; 11% of parents of 2-year-olds encountered an obstacle to vaccination that was related to the COVID-19 pandemic and 10% had a vaccine delayed for their child by more than 30 days also due to the pandemic.
- Among parents of 2-year-old children, the most commonly reported obstacles to vaccination due to the COVID-19 pandemic were limited appointment availability (74%) and concern about being exposed to COVID-19 (36%).
- Knowledge, attitudes, and beliefs: In 2021, most parents and guardians of 2-year-old children continue to agree that childhood vaccines are safe (97%), effective (98%), and help to protect their child's health (97%). However, in 2021, a larger proportion of parents/guardians believed that alternative practices (15%) and healthy nutrition and hygiene (16%) can replace the need for vaccination, up from 11% for both in 2019.
Introduction
The childhood National Immunization Coverage Survey (cNICS) has been conducted every 2 years since 1994. Starting in 2011, the cNICS has been conducted by the Public Health Agency of Canada in collaboration with Statistics Canada. The cNICS measures the proportion of children who have received routine vaccinations recommended by the National Advisory Committee on Immunization (NACI) by the ages of 2, 7, 14, or 17 years. Parents/guardians of children in these age groups are asked to complete the survey in which they provide information on their child's vaccine history and answer questions on their knowledge, attitudes, and beliefs towards vaccination.
As part of Canada's National Immunization Strategy (NIS) objectives, national vaccination coverage goals were set in 2017 to be achieved by 2025 for vaccines that are publicly funded in all provinces and territories (PT). This includes a vaccine coverage goal of 95% coverage for childhood vaccines (assessed at ages 2 and 7 years) and 90% coverage for adolescent vaccines (assessed at age 17 years).
cNICS results are relied upon to:
- determine if children are vaccinated in accordance with the recommended immunization schedules;
- provide information on parental knowledge, attitudes and beliefs about vaccines;
- evaluate progress towards Canada National Vaccination Coverage Goals (by 2025);
- meet Canada's international reporting obligations for vaccination to the World Health Organization (WHO) and the Pan American Health Organization (PAHO);
- guide the development of immunization policies; and
- identify populations and/or vaccines with low immunization coverage.
The COVID-19 pandemic was officially declared by the World Health Organization (WHO) on March 11, 2020, and had immediate and wide-ranging impacts on the health and life of Canadians. The COVID-19 pandemic affected vaccine uptake due to changes in immunization program resources and delivery, health care providers being redirected towards pandemic efforts, and disruptions to school-based immunization programs during periods of school closures. It is important to close any gaps in coverage that have emerged due to the COVID-19 pandemic to ensure children are not vulnerable to vaccine-preventable diseases.
Results
Vaccine coverage by age group
Note: All differences noted are significant at the 95% confidence level.
Vaccine coverage among 2-year-old children
In 2021, vaccine coverage by the second birthday ranged from a low of 77.1% for receipt of at least 4 doses of a vaccine against diphtheria, pertussis and tetanus (DTaP) to a high of 91.8% for receipt of at least 3 doses of a vaccine against polio and 91.6% for at least 1 dose of a vaccine against measles. Protection in early infancy is especially important and DTaP vaccine coverage prior to 1 year of age remains at similar levels in 2021 compared to 2019 (2021: 90.6% by 3 months, 76.4% by 7 months, 87.6% by 12 months).
The national vaccine coverage goal of 95% was not met for any vaccine recommended for 2-year-old children (Figure 1).
There were no changes in national vaccine coverage estimates between 2019 and 2021, except for varicella which increased from 82.7% in 2019 to 87.5% in 2021. The timing of the COVID-19 pandemic did not fully overlap with when this age cohort was eligible to receive all routine childhood vaccines. Doses due at 2, 4, 6, and 12 months did not overlap with the timing of the pandemic, therefore coverage estimates were not noticeably affected.
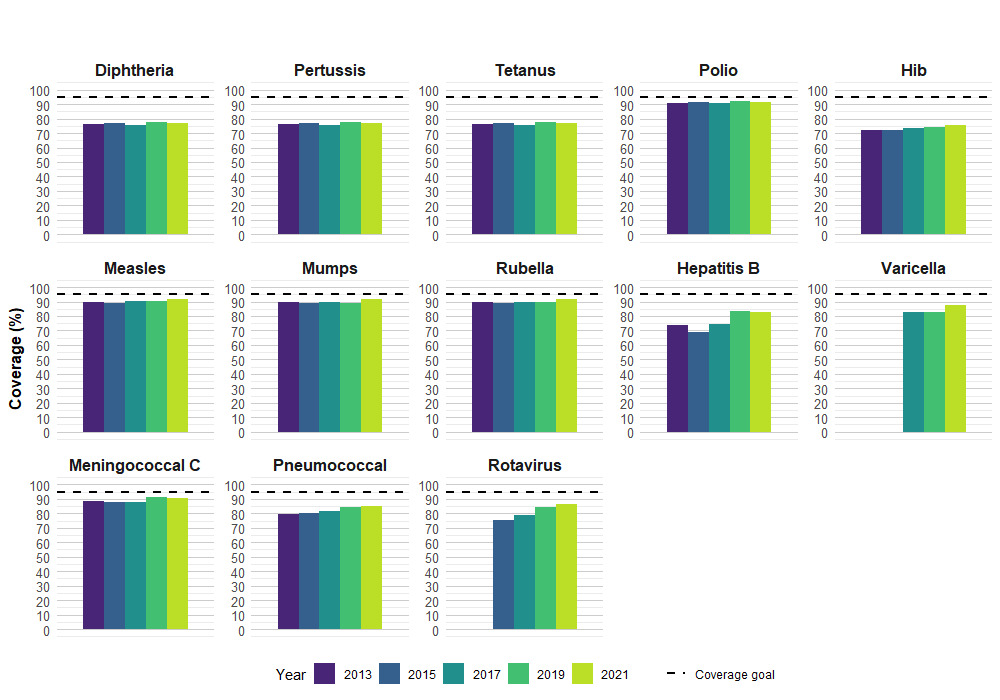
| Antigen | Number of dosesTable 1 note ‡ | 2013 | 2015 | 2017 | 2019 | 2021 |
|---|---|---|---|---|---|---|
| Diphtheria | ≥ 4 | 76.6 (74.5–78.6) | 76.9 (71.7–81.5) | 75.8 (73.01–78.45) | 77.5Table 1 note ↑ (73.2–81.4) | 77.1 (74.8–79.3) |
| Pertussis | ≥ 4 | 76.4 (74.2–78.4) | 77.0 (71.7–81.5) | 75.8 (73.1–78.5) | 77.5Table 1 note ↑ (73.2–81.4) | 77.1 (74.8–79.3) |
| Tetanus | ≥ 4 | 76.4 (74.2–78.4) | 76.7 (71.5–81.2) | 75.8 (73.1–78.5) | 77.5Table 1 note ↑ (73.2–81.4) | 77.1 (74.8–79.3) |
| Polio | ≥ 3 | 90.9 (89.5–92.2) | 91.2 (87.1–94.0) | 90.7 (89.1–92.1) | 91.9 (88.7–94.2) | 91.8 (90.2–93.1) |
| Haemophilus influenzae type b (Hib) | ≥ 4 | 71.9 (69.8–74.0) | 71.9 (66.5–76.7) | 73.4 (70.7–75.9) | 74.4 (69.8–78.5) | 75.3 (72.9–77.6) |
| Measles | ≥ 1 | 89.7 (88.3–91.0) | 89.2 (85.1–92.3) | 90.2 (88.2–92.0) | 90.2 (86.8–92.8) | 91.6 (89.9–93.1) |
| Mumps | ≥ 1 | 89.4 (87.9–90.7) | 88.9 (84.6–92.0) | 89.9 (87.8–91.7) | 89.2 (85.6–91.9) | 91.5Table 1 note ↑ (89.8–93.0) |
| Rubella | ≥ 1 | 89.4 (87.9–90.7) | 88.9 (84.6–92.0) | 90.0 (87.8–91.7) | 89.4 (85.9–92.1) | 91.5Table 1 note ↓ (89.8–93.0) |
| Hepatitis BTable 1 footnotenote a | ≥ 3 | 73.5 (69.2–77.4) | 69.2 (53.6–81.3) | 74.1 (71.2–76.8) | 83.6 (77.2–88.5) | 82.6 (79.7–85.1) |
| Varicella | ≥ 1 | Table 1 footnotenote # | Table 1 footnotenote # | 82.9 (80.3–85.3) | 82.7 (78.6–86.0) | 87.5Table 1 note ↓Table 1 note ** (85.5–89.2) |
| Meningococcal type CTable 1 footnotenote b | ≥ 1–2 | 88.7 (87.1–90.2) | 87.8 (83.3–91.3) | 87.6 (85.7–89.3) | 91.1 (87.9–93.5) | 90.5Table 1 note ↓ (88.7–92.0) |
| PneumococcalTable 1 footnotenote c | ≥ 3–4 | 79.2 (77.1–81.1) | 80.3 (75.1–84.7) | 81.4 (79.1–83.5) | 84.4 (80.4–87.6) | 85.1 (83.1–87.0) |
| RotavirusTable 1 footnotenote d | ≥ 2 | n/a | 75.4 (69.3–80.6) | 78.8 (76.6–80.9) | 84.5 (80.5–87.7) | 85.6 (83.5–87.5) |
Notes: 95% CI – 95% Confidence Interval (weighted). Footnotes: |
||||||
The 2021 cNICS measured jurisdiction-level vaccine coverage estimates among 2-year-olds only (Table 2a and Table 2b). Overall, the 2021 estimates remained comparable to the 2017 cycle, which was the last survey cycle to measure vaccine coverage by jurisdiction. Vaccine coverage estimates among 2-year-olds varied by province and territory with notable increases in coverage for some antigens over time.
The largest increases were observed for rotavirus where coverage increased by 5% to 14% in 6 jurisdictions (QC, ON, BC, YT, MB, and PEI) from 2017 to 2021.
From 2017 to 2021, coverage estimates increased for 10 antigens in British Columbia (DTaP, polio, Hib, Hep B, varicella, Men C, pneumococcal and rotavirus). Prince Edward Island also noted increases in vaccine coverage from 2017 to 2021 for 10 antigens (DTaP, Hib, mumps, rubella, hep B, meningococcal, pneumococcal, and rotavirus vaccine).
Manitoba reported increases in vaccine coverage for DTaP, Hib, meningococcal, pneumococcal, and rotavirus vaccines, while in Nova Scotia and Quebec varicella coverage increased from 2017 to 2021. In Ontario, the cNICS reported an increase in coverage for pneumococcal and rotavirus vaccines, while in Yukon an increase in rotavirus vaccine coverage was observed. In Saskatchewan an increase in meningococcal vaccine coverage was observed.
No changes in coverage were observed for any vaccines from 2017 to 2021 in New Brunswick.
Vaccine coverage was lower in 2021 compared to 2017 in Newfoundland for DTaP and Hib and lower in Alberta and Northwest Territories for polio.
Nunavut reported decreases in coverage for all recommended childhood vaccines from 2017 to 2021. Some 2-year-old children could have experienced a true decrease in coverage due to missed vaccinations as a result of the COVID-19 pandemic. A portion of the cohort of 2-year-old children in the cNICS were due to receive some of their vaccinations during the start of the pandemic, for example the 18-month doses of DTaP and MMRV.
| Province or territory | Diphtheria, pertussis, and tetanus | Polio | Haemophilus type B | Measles | Mumps | Rubella | ||||||
|---|---|---|---|---|---|---|---|---|---|---|---|---|
| (≥ 4 doses) | (≥ 3 doses) | (≥ 4 doses) | (≥ 1 dose) | (≥ 1 dose) | (≥ 1 dose) | |||||||
| 2017 | 2021 | 2017 | 2021 | 2017 | 2021 | 2017 | 2021 | 2017 | 2021 | 2017 | 2021 | |
| Newfoundland and Labrador | 88.9 (82.0–93.4) | 80.0Table 2a note ** (74.0–85.0) | 96.9 (94.0–98.5) | 95.4 (91.6–97.6) | 87.7 (81.6–92.0) | 76.8Table 2a note ** (70.6–82.0) | 96.9 (93.6–98.5) | 97.0 (93.9–98.6) | 96.9 (93.6–98.5) | 97.0 (93.9–98.6) | 96.9 (93.6–98.5) | 97.0 (93.9–98.6) |
| Prince Edward Island | 81.2 (69.2–89.3) | 95.8Table 2a note ** (92.3–97.7) | 93.9 (85.5–97.5) | Table 2a note F (95.8–99.4) | 79.8 (67.7–88.2) | 95.8Table 2a note ** (92.3–97.7) | 93.2 (86.7–96.6) | 98.0 (95.3–99.2) | 92.6 (86.8–96.0) | 98.0Table 2a note ** (95.3–99.2) | 92.6 (86.8–96.0) | 98.0Table 2a note ** (95.3–99.2) |
| Nova Scotia | 73.8 (66.7–79.8) | 70.3 (63.9–76.0) | 93.5 (87.8–96.6) | 87.9 (82.6–91.8) | 68.5↑ (61.6–74.7) | 66.8 (60.2–72.8) | 87.1 (79.0–92.4) | 93.6 (89.4–96.2) | 86.8 (78.8–92.1) | 93.6 (89.4–96.2) | 86.8 (78.8–92.1) | 93.6 (89.4–96.2) |
| New Brunswick | 75.5Table 2a note ↓ (67.3–82.1) | 78.1 (72.6–82.8) | 90.1 (85.0–93.5) | 89.6 (85.1–92.9) | 74.7 (66.4–81.5) | 75.9 (70.2–80.7) | 92.0 (87.3–95.0) | 94.3 (90.9–96.5) | 92.0 (87.3–95.0) | 94.3 (90.8–96.5) | 92.0 (87.3–95.0) | 94.3 (90.8–96.5) |
| Quebec | 73.7 (69.2–77.7) | 76.2 (71.8–80.1) | 90.9 (87.9–93.3) | 91.7 (88.5–94.0) | 71.3 (66.4–75.8) | 75.8 (71.4–79.8) | 91.0 (88.0–93.3) | 93.2 (90.2–95.3) | 90.5Table 2a note ↑ (87.4–92.9) | 93.2 (90.2–95.3) | 90.5Table 2a note ↑ (87.4–92.9) | 93.2 (90.2–95.3) |
| Ontario | 75.7 (71.7–79.4) | 76.7 (71.6–81.1) | 91.0 (87.8–93.5) | 94.4 (90.9–96.6) | 72.9 (68.8–76.7) | 73.8 (68.6–78.5) | 90.9 (87.2–93.6) | 92.0 (88.1–94.7) | 90.5Table 2a note ↑ (86.8–93.3) | 91.7 (87.7–94.5) | 90.5Table 2a note ↑ (86.8–93.3) | 91.7 (87.7–94.5) |
| Manitoba | 67.5Table 2a note ↓ (61.4–73.0) | 75.5Table 2a note ↓Table 2a note ** (70.2–80.1) | 85.6 (81.2–89.1) | 87.9 (83.2–91.4) | 62.2 (56.5–67.5) | 75.3Table 2a note ** (70.0–79.9) | 86.1 (80.8–90.1) | 87.1 (82.4–90.7) | 85.9 (80.7–89.9) | 86.6 (81.8–90.2) | 86.2 (81.1–90.1) | 86.6 (81.8–90.2) |
| Saskatchewan | 78.6 (73.0–83.3) | 80.9 (74.1–86.3) | 90.0 (86.0–93.0) | 91.0 (85.6–94.5) | 75.1 (69.6–80.0) | 80.6 (73.8–85.9) | 89.5Table 2a note ↑ (85.4–92.6) | 91.4 (85.5–95.0) | 89.5Table 2a note ↑ (85.4–92.6) | 91.0 (85.2–94.7) | 89.5Table 2a note ↑ (85.4–92.6) | 91.0 (85.2–94.7) |
| Alberta | 79.9 (73.1–85.4) | 74.6 (68.5–79.8) | 93.0 (89.5–95.4) | 85.7Table 2a note ** (80.1–89.9) | 79.1 (72.5–84.4) | 71.1 (64.7–76.8) | 91.7 (87.4–94.6) | 88.4 (83.3–92.1) | 91.4 (87.1–94.4) | 88.4 (83.3–92.1) | 91.4 (87.1–94.4) | 88.4 (83.3–92.1) |
| British Columbia | 76.6 (71.2–81.2) | 83.6Table 2a note ** (78.7–87.5) | 87.5Table 2a note ↑ (83.6–90.6) | 92.6Table 2a note ** (88.7–95.2) | 74.4 (69.1–79.1) | 82.8Table 2a note ** (77.8–86.8) | 86.1 (81.6–89.6) | 91.3 (87.1–94.2) | 86.1 (81.6–89.6) | 91.3 (87.1–94.2) | 86.1 (81.6–89.6) | 91.3 (87.1–94.2) |
| Yukon | 70.7 (62.1–78.0) | 66.6 (56.3–75.6) | 93.7 (87.2–97.1) | 86.3 (77.6–92.0) | 69.3 (60.8–76.6) | 64.0 (53.6–73.3) | 91.0 (85.4–94.6) | 85.3 (76.4–91.2) | 91.0 (85.4–94.6) | 85.3 (76.4–91.2) | 91.0 (85.4–94.6) | 85.3 (76.4–91.2) |
| Northwest Territories | 76.7 (62.1–86.9) | 66.0 (56.0–74.7) | 91.1 (82.6–95.7) | 80.4Table 2a note ** (71.3–87.1) | 75.5Table 2a note ↓ (61.1–85.8) | 60.0 (50.0–69.3) | 91.8 (83.0–96.2) | 90.8 (83.3–95.2) | 91.8 (83.0–96.2) | 89.5 (81.8–94.2) | 91.8 (83.0–96.2) | 88.2 (80.2–93.3) |
| Nunavut | 63.8 (51.2–74.8) | 24.1Table 2a note ETable 2a note ** (15.2–35.9) | 82.1 (69.9–90.0) | 33.5Table 2a note ETable 2a note ** (23.1–45.8) | 57.2 (44.7–68.9) | 24.1Table 2a note ETable 2a note ** (15.2–35.9) | 88.7 (77.1–94.8) | 34.6Table 2a note ETable 2a note ** (24.0–46.9) | 88.7 (77.1–94.8) | 34.6Table 2a note ETable 2a note ** (24.0–46.9) | 88.7 (77.1–94.8) | 34.6Table 2a note ETable 2a note ** (24.0–46.9) |
Notes: 95% CI – 95% Confidence Interval (weighted). |
||||||||||||
| Province or territory | Hepatitis B | Varicella | Meningococcal type C | Pneumococcal | Rotavirus | |||||
|---|---|---|---|---|---|---|---|---|---|---|
| (≥ 3 doses)Table 2b footnote a | (≥ 1 dose) | (≥ 1–2 doses)Table 2b footnote b | (≥ 3–4 doses)Table 2b footnote c | (≥ 2 doses)Table 2b footnote d | ||||||
| 2017 | 2021 | 2017 | 2021 | 2017 | 2021 | 2017 | 2021 | 2017 | 2021 | |
| Newfoundland and Labrador | n/a | n/a | 95.1 (91.4-97.3) | 96.4 (93.0-98.2) | 93.2 (88.1–96.2) | 93.6 (89.6–96.1) | 90.2 (85.2–93.6) | 87.8 (82.5–91.7) | n/a | 93.3 (88.7–96.1) |
| Prince Edward Island | 86.7 (77.3–92.6) | 97.7Table 2b note ** (95.1–99.0) | 92.0 (85.7–95.7) | 96.7 (93.6–98.3) | 92.7 (85.9–96.3) | Table 2b note F (95.8–99.4)Table 2b note ** | 89.5Table 2b note ↑ (83.0–93.7) | 97.4Table 2b note ** (94.3–98.8) | 85.9 (79.2–90.7) | 96.4Table 2b note ** (93.1–98.2) |
| Nova Scotia | n/a | n/a | 84.8 (77.0–90.3) | 93.2Table 2b note ** (89.1–95.8) | 81.8 (74.3–87.5) | 89.4 (84.5–92.9) | 80.4 (72.9–86.2) | 79.0 (73.1–83.8) | n/a | n/a |
| New Brunswick | 81.0 (75.6–85.4) | 79.8 (74.2–84.3) | 90.9 (86.3–94.1) | 91.2 (87.2–94.0) | 88.3 (82.7–92.2) | 90.6 (86.3–93.6) | 82.2 (75.8–87.2) | 86.7 (81.6–90.5) | n/a | 66.6 (60.6–72.1) |
| Quebec | 75.7 (71.7–79.2) | 80.6 (76.5–84.2) | 76.1 (71.9–79.9) | 89.9Table 2b note ** (86.6–92.5) | 89.9 (86.6–92.5) | 90.2 (86.7–92.8) | 83.3 (79.8–86.4) | 85.3 (81.5–88.5) | 81.0 (77.4–84.2) | 86.0Table 2b note ** (82.2–89.0) |
| Ontario | n/a | n/a | 84.3 (79.9–87.8) | 85.9 (81.3–89.5) | 85.7 (81.8–88.9) | 90.1 (86.0–93.1) | 80.5Table 2b note ↓ (76.5–83.9) | 86.1Table 2b note ** (81.5–89.7) | 77.7 (73.6–81.3) | 84.7Table 2b note ** (79.8–88.5) |
| Manitoba | n/a | n/a | 81.6 (75.8–86.2) | 86.9 (82.2–90.5) | 82.2 (77.7–86.0) | 88.8Table 2b note ** (84.3–92.2) | 74.6 (69.5–79.1) | 81.7Table 2b note ** (76.8–85.8) | 68.4 (63.4–73.0) | 82.2Table 2b note ** (77.3–86.3) |
| Saskatchewan | n/a | n/a | 84.8 (79.5–89.0) | 80.9 (74.1–86.2) | 81.1 (76.0–85.4) | 89.1Table 2b note ** (83.3–93.1) | 83.7 (79.0–87.6) | 83.7 (77.3–88.6) | 84.0 (78.9–88.0) | 88.2 (82.1–92.4) |
| Alberta | n/a | n/a | 86.7 (81.6–90.6) | 83.3 (77.6–87.7) | 91.0 (87.2–93.8) | 89.8 (84.7–93.3) | 82.6 (76.3–87.6) | 81.3 (75.4–85.9) | n/a | 84.8 (79.3–89.1) |
| British Columbia | 69.7 (64.6–74.3) | 87.1Table 2b note ** (82.2–90.8) | 83.7 (78.7–87.8) | 91.0Table 2b note ** (86.9–93.9 | 89.3 (85.2–92.4) | 94.2Table 2b note ** (90.7–96.4) | 80.3 (75.3–84.5) | 88.2Table 2b note ** (83.8–91.6) | 80.2 (75.7–84.0) | 91.2Table 2b note ** (87.0–94.1) |
| Yukon | 62.8 (54.8–70.2) | 71.3 (61.1–79.7) | 85.5Table 2b note ↓ (79.0–90.2) | 81.8 (72.5–88.5) | 93.7 (87.1–97.0) | 90.0 (81.9–94.7) | 83.2 (75.1–89.1) | 73.2 (63.1–81.4) | 76.6 (69.1–82.8) | 86.7Table 2b note ** (78.1–92.3) |
| Northwest Territories | 80.5Table 2b note ↑ (73.3–86.1) | 81.0 (71.9–87.6) | 88.9 (79.3–94.4) | 80.2 (71.1–87.0) | 95.2 (89.1–98.0) | 88.8 (80.8–93.7) | 63.8 (48.7–76.5) | 59.9 (49.8–69.2) | 66.3 (58.2–73.5) | 75.6 (66.1–83.2) |
| Nunavut | 70.8 (58.7–80.6) | 32.5Table 2b note ETable 2b note ** (22.3–44.8) | 82.1 (69.7–90.1) | 21.2Table 2b note ETable 2b note ** (13.0–32.8) | 80.1 (67.5–88.6) | 34.5Table 2b note ETable 2b note ↑Table 2b note ** (24.0–46.9) | 62.4 (49.9–73.3) | 21.0Table 2b note ETable 2b note ** (12.8–32.6) | n/a | n/a |
Notes: 95% CI – 95% Confidence Interval (weighted). Footnotes: |
||||||||||
Socio-demographic characteristics: Among 2-year-olds, there are variations in vaccine uptake by population group, geographic location, and socio-demographic characteristics of respondents.
Children identifying as Black, had significantly lower vaccine coverage for diphtheria, tetanus and pertussis (65.5%), Hib (65.1%), pneumococcal (73.1%) and rotavirus (69.0%), compared to white children (Table 3).
Children identifying as Filipino have reached the national vaccine coverage goals of 95% for several vaccines and had higher vaccine coverage for polio (96.7%), measles/mumps/rubella (96.5%), varicella (95.0%), pneumococcal (97.4%), and rotavirus coverage (92.7%) compared to white children (polio: 91.1%, MMR: 92.0%, varicella: 87.6%, pneumococcal: 85.5%, rotavirus: 85.6%). Similarly, children identifying as Chinese had higher vaccine coverage for DTaP (87.4%) and Hib (86.7%) compared to white children (DTaP 78.1%; Hib 76.5%).
Polio vaccine coverage was significantly higher among Indigenous children (95.3%) compared to white children (91.1%) and has reached the national vaccine coverage goal of 95% for 2-year-olds. Coverage was not different for Indigenous respondents for other vaccines (Table 3).
Based on an index of remotenessEndnote 1, vaccine coverage estimates were significantly lower for all vaccines measures among 2-year-old children living in more remote compared to easily accessible areas, except for hepatitis B.
Coverage estimates for all vaccines were significantly higher among children with parents/guardians who had a bachelor's degree or above, compared to those whose parents completed high school or less. Vaccine coverage among 2-year-old children whose parents had a bachelor's degree or above, has reached the national coverage goal of 95% for measles, mumps, rubella and is approaching the goal for polio.
Vaccine coverage estimates were also higher among children with parents/guardians who reported an annual household income of more than $160K in 2020 compared to less than $80K. Coverage for measles, mumps, rubella, polio and meningococcal vaccine among those with a household income of more than $160K has also reached or surpassed the national vaccine coverage goal of 95% for this age group.
| Demographic factors | Diphtheria, pertussis, and tetanus | Polio | Haemophilus influenzae type b (Hib) | Measles | Mumps | Rubella | Hepatitis B | Varicella | Meningococcal type C | Pneumococcal | Rotavirus |
|---|---|---|---|---|---|---|---|---|---|---|---|
| (≥ 4 doses) | (≥ 3 doses) | (≥ 4 doses) | (≥ 1 dose) | (≥ 1 dose) | (≥ 1 dose) | (≥ 3 doses)Table 3 footnote a | (≥ 1 dose) | (≥ 1-2 doses)Table 3 footnote b | (≥ 3-4 doses)Table 3 footnote c | (≥ 2 doses)Table 3 footnote d | |
| Gender of child | |||||||||||
| Male | 75.0 (71.3–78.3) | 91.8 (89.6–93.7) | 73.1 (69.4–76.5) | 91.3 (88.8–93.2) | 91.0 (88.5–93.0) | 91.0 (88.5–93.0) | 81.6 (79.5–85.4) | 86.5 (83.6–89.1) | 89.7 (87.0–91.8) | 84.4 (81.4–87.0) | 84.1 (80.9–86.8) |
| Female | 79.4 (76.2–82.3) | 91.7 (89.4–93.5) | 77.6 (74.3–80.6) | 92.0 (89.4–94.0) | 92.0 (89.4–94.2) | 92.0 (89.4–94.0) | 83.6 (79.5–87.1) | 88.4 (85.6–90.7) | 91.4 (88.7–93.4) | 85.9 (82.9–88.4) | 87.2 (84.2–89.7) |
| Education level: Parent | |||||||||||
| High School or less | 66.9 (60.3–72.9) | 85.4 (80.4–89.3) | 66.7 (60.1–72.7) | 80.2 (74.0–85.2) | 80.1 (73.9–85.1) | 80.1 (73.9–85.1) | 76.1 (66.8–83.5) | 79.4 (73.6–84.2) | 83.7 (78.3–87.9) | 72.2 (65.8–77.8) | 71.7 (64.8–77.8) |
| Above high school, below bachelor's | 75.6Table 3 note * (71.1–79.6) | 92.3Table 3 note ** (89.6–94.4) | 75.0Table 3 note ** (70.5–79.0) | 92.8Table 3 note ** (89.7–95.0) | 92.7Table 3 note ** (89.7–94.9) | 92.7Table 3 note ** (89.7–94.9) | 80.7 (74.9–85.4 | 86.7Table 3 note ** (82.6–89.9) | 90.9Table 3 note ** (87.3–93.6) | 86.2Table 3 note ** (82.4–89.3) | 89.8Table 3 note ** (86.8–92.1) |
| Bachelor's and above | 81.9Table 3 note ** (78.8–84.6) | 94.1Table 3 note ** (91.9–95.6) | 78.8Table 3 note ** (75.5–81.7) | 95.3Table 3 note ** (93.4–96.7) | 95.1Table 3 note ** (93.1–96.5) | 95.1Table 3 note ** (93.1–96.5) | 85.5Table 3 note ↓Table 3 note ** (81.6–88.6) | 91.1Table 3 note ** (88.5–93.1) | 92.9Table 3 note ** (90.6–94.7) | 89.3Table 3 note ** (86.6–91.4) | 88.4Table 3 note ** (85.6–90.7) |
| 2020 household income | |||||||||||
| Less than $40,000 | 59.7Table 3 note ** (47.8–70.5) | 89.4 (80.9–94.4) | 58.6Table 3 note ** (46.5–69.6) | 80.2Table 3 note ** (68.7–88.2) | 80.0Table 3 note ** (68.6–88.1) | 80.0Table 3 note ** (68.6–88.1) | Table 3 note F | 79.5 Table 3 note ↑Table 3 note ** (68.6–87.3) | 83.8Table 3 note ** (73.4–90.6) | 74.8Table 3 note ** (63.0–83.8) | 74.3Table 3 note ETable 3 note ** (62.9–83.1) |
| $40,000–$79,999 | 68.5Table 3 note ↓Table 3 note ** (62.8–73.6) | 82.8Table 3 note ** (77.9–86.7) | 65.4Table 3 note ** (59.6–70.8) | 86.1Table 3 note ** (81.3–89.8) | 85.5Table 3 note ** (80.7–89.3) | 85.5Table 3 note ↑Table 3 note ** (80.7–89.3) | 75.6Table 3 note ** (67.8–82.0) | 80.8Table 3 note ** (75.6–85.1) | 82.3Table 3 note ** (76.9–86.6) | 73.9Table 3 note ** (68.5–78.7) | 76.2Table 3 note ** (70.7–80.9) |
| $80,000–$99,999 | 73.9Table 3 note ** (67.0–79.8) | 92.8 (88.7–95.5) | 72.9Table 3 note ** (65.9–79.0) | 91.1Table 3 note ** (85.8–94.5) | 91.0Table 3 note ** (85.7–94.5) | 91.0Table 3 note ** (85.7–94.5) | 88.8 (81.9–93.3) | 87.0 (81.0–91.3) | 89.1Table 3 note ** (83.3–93.1) | 85.7 (79.8–90.0) | 86.1Table 3 note ** (79.9–90.6) |
| $100,000–$119,999 | 80.6 (74.9–85.3) | 93.7 (89.9–96.1) | 78.4 (72.4–83.4) | 92.4Table 3 note ** (88.4–95.1) | 92.4Table 3 note ** (88.4–95.1) | 92.4Table 3 note ** (88.4–95.1) | 78.9Table 3 note ** (69.9–85.7) | 87.4 (82.3–91.2) | 90.7Table 3 note ** (86.2–93.9) | 88.1 (83.5–91.6) | 85.2Table 3 note ** (79.1–89.7) |
| $120,000–$139,999 | 82.2 (75.1–87.6) | 97.1 (93.7–98.7) | 81.2 (74.1–86.7) | 97.1 (93.7–98.7) | 97.1 (93.7–98.7) | 97.1 (93.7–98.7) | 87.3 (79.1–92.5) | 93.0 (88.1–96.0) | 96.1 (92.6–98.0) | 93.4 (88.6–96.3) | 90.2 (84.4–94.0) |
| $140,000–$159,999 | 89.1 (82.4–93.5) | 97.1 (94.3–98.5) | 89.5Table 3 note ↑Table 3 note ** (83.3–93.6) | 95.9 (89.7–98.4) | 95.9 (89.7–98.4) | 95.9 (89.7–98.4) | 88.6 (80.6–93.6) | 96.4Table 3 note ** (92.9–98.2) | 97.1 (93.9–98.7) | 93.3 (88.6–96.2) | 95.5Table 3 note ↑ (91.7–97.6) |
| More than $160,000 | 84.2 (79.8–87.9) | 95.1 (92.2–97.0) | 81.8 (77.1–85.8) | 96.6 (94.3–98.0) | 96.6 (94.3–98.0) | 96.6 (94.3–98.0) | 88.3 (82.5–92.4) | 90.9 (86.7–93.8) | 96.4 (93.6–98.0) | 90.2 (86.4–93.1) | 92.6 (89.1–95.0) |
| Population group: Child | |||||||||||
| White | 78.1 (75.1–80.8) | 91.1 (89.2–92.8) | 76.5Table 3 note ↑ (73.5–79.3) | 92.0 (90.0–93.7) | 92.0 (89.9–93.6) | 92.0 (89.9–96.6) | 82.2 (78.6–85.4) | 87.6 (85.2–89.7) | 90.1 (87.8–92.1) | 85. 5Table 3 note ↑ (83.0–87.8) | 85.6 (83.0–87.9) |
| Indigenous | 67.4 (52.4–79.5) | 95.3Table 3 note ** (91.2–97.6) | 65.3 (50.5–77.6) | 82.5 (68.4–91.1) | 82.5Table 3 note ↓ (68.3–91.1) | 82.5 (68.4–91.4) | 67.3Table 3 note E (45.1–83.7) | 78.0 (64.6–87.3) | 89.4 (81.0–94.4) | 87.0 (78.5–92.4) | 84.7Table 3 note E (74.1–91.5) |
| South Asian | 79.6 (70.1–86.6) | 92.6 (84.2–96.7) | 70.8 (60.3–79.5) | 94.1 (86.6–97.6) | 92.7 (84.8–96.7) | 92.7 (84.8–96.7) | Table 3 note F | 89.3 (81.3–94.1) | 93.4 (85.4–97.1) | 86.8 (77.7–92.6) | 90.9 (82.1–95.6) |
| Chinese | 87.4Table 3 note ** (79.8–92.4) | 93.4 (86.1–97.0) | 86.7 (79.2–91.8) | 94.5Table 3 note ↑ (88.5–97.5) | 94.5Table 3 note ↑ (88.5–97.5) | 94.5Table 3 note ↑ (88.5–97.5) | Table 3 note F | 93.6 (85.6–97.3) | 92.6 (84.4–96.7) | 88.8 (81.5–93.5) | 85.3Table 3 note E (75.9–91.4) |
| Black | 65.5Table 3 note ↑Table 3 note ** (53.9–75.6) | 88.1 (78.7–93.7) | 65.1Table 3 note ** (53.6–75.0) | 82.4 (70.8–90.1) | 82.1 (70.5–89.8) | 82.1 (70.5–89.8) | Table 3 note F | 83.5 (71.9–90.6) | 88.1 (77.9–93.9) | 73.1Table 3 note ** (61.5–82.2) | 69.0Table 3 note **Table 3 note E (56.4–79.3) |
| Filipino | 84.3 (73.8–91.1) | 96.7Table 3 note ** (91.9–98.7) | 84.0Table 3 note **(73.6–90.9) | 96.5Table 3 note ↓Table 3 note ** (91.9–98.5) | 96.5Table 3 note ↓Table 3 note ** (91.9–98.5) | 96.5Table 3 note ↓Table 3 note ** (91.9–98.5) | Table 3 note F | 95.0Table 3 note ** (89.9–97.6) | 93.9 (85.1–97.6) | 97.4Table 3 note ** (93.4–99.0) | 92.7Table 3 note **Table 3 note E (83.9–96.8) |
| Other racialized groups | 70.5 (61.7–78.1) | 93.0 (87.21–96.3) | 69.9 (61.3–77.3) | 92.8 (87.2–96.0) | 92.9 (87.3–96.1) | 92.9 (87.3–96.1) | 78.4Table 3 note E (67.4–86.5) | 83.6 (75.9–89.1) | 90.6 (84.4–94.5) | 81.6 (74.4–87.1) | 89.2 (82.5–93.5) |
| Remoteness indexTable 3 footnote e | |||||||||||
| Easily accessible area | 77.4 (74.6–79.9) | 92.8 (90.9–94.3) | 75.2 (72.3–77.9) | 92.5Table 3 note ↑ (90.6–94.1) | 92.4 (90.4–94.0) | 92.4 (90.4–94.0) | 81.7 (78.1–84.8) | 87.9 (85.5–89.9) | 91.4 (89.3–93.1) | 86.5Table 3 note ↓ (84.1–88.5) | 86.5Table 3 note ↑ (84.0–88.7) |
| Accessible area | 80.7 (76.6–84.2) | 90.0 (86.6–92.6) | 79.4 (75.2-83.1) | 90.7 (86.9–93.4) | 90.4 (86.7–93.2) | 90.4– (86.7–93.2) | 88.1Table 3 note ** (82.4–92.1) | 89.0 (85.3–91.9) | 88.8 (84.8–91.9) | 82.9 (78.3–86.7) | 84.7 (80.5–88.1) |
| Less accessible area | 65.8Table 3 note ** (54.4–75.6) | 85.0Table 3 note ** (76.2–90.9) | 67.8 (57.3–76.7) | 84.1 (72.7–91.3) | 84.0 (72.7–91.2) | 84.0 (72.7–91.2) | 79.5Table 3 note ↓ (66.8–88.1) | 80.7 (71.0–87.7) | 86.5 (77.7–92.2) | 75.2Table 3 note ** (64.7–83.4) | 75.9Table 3 note ** (65.8–83.8) |
| Remote and very remote area | 44.8Table 3 note **Table 3 note E (28.0–62.8) | 64.8Table 3 note **Table 3 note E (44.3–80.9) | 42.8Table 3 note **Table 3 note E (26.5–60.8) | 65.3Table 3 note **Table 3 note E (45.6–80.9) | 65.3Table 3 note **Table 3 note E (45.6–80.9) | 65.1Table 3 note **Table 3 note E (45.5–80.7) | 74.9Table 3 note E (48.9–90.3) | 50.7Table 3 note **Table 3 note E (32.2–69.0) | 54.4Table 3 note **Table 3 note E (35.1–72.4) | 51.5Table 3 note ↓Table 3 note **Table 3 note E (32.8–69.7) | Table 3 note F |
Notes: 95% CI – 95% Confidence Interval (weighted). Footnotes: |
|||||||||||
Vaccine coverage among 7-year-old children
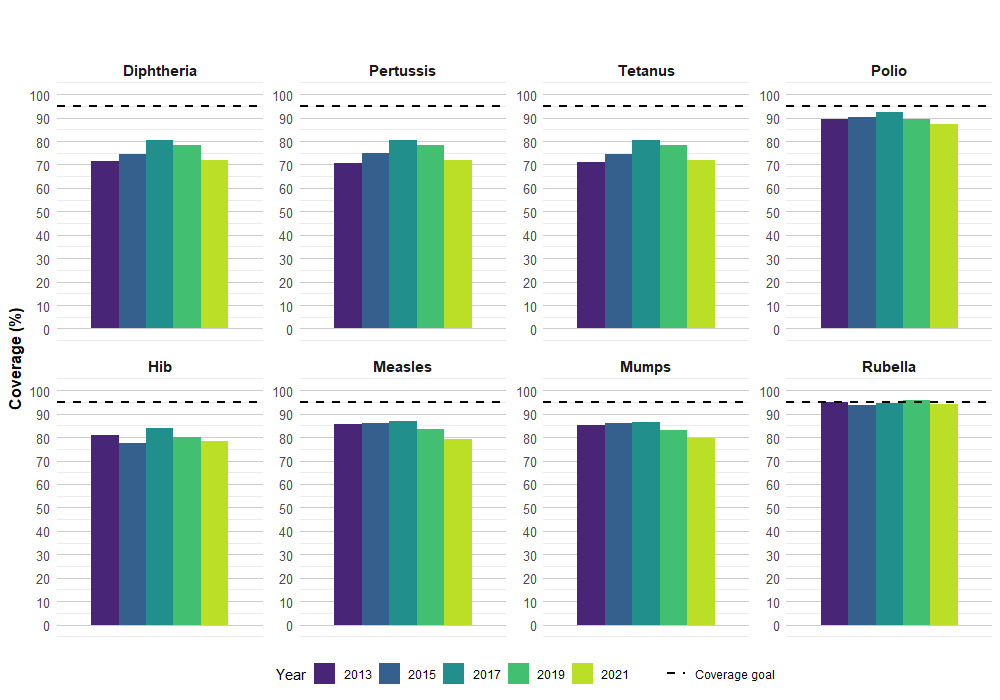
In 2021, vaccine coverage by 7 years of age ranged from 71.9% for 5 doses of DTaP to 94.0% for at least 1 dose of rubella.
In the 2021 cNICS survey cycle, vaccines recommended when children were 6 to 7 years of age overlapped with the timing of the COVID-19 pandemic. For example, the 5th dose of DTaP-IPV-Hib recommended between 4 to 6 years of age and prior to school entry would have been most affected by pandemic related factors.
Although not statistically significant, decreases in coverage were observed among 7-years-olds. Compared to 2019, most coverage estimates measured in 2021 for 7-year-olds range from 2 to 6 percentage points lower, but these differences are not statistically significant (e.g., DTaP is 71.9% in 2021 compared to 78.1% in 2019). Gradual declines in coverage for 7-year-old children were observed starting in 2017, with significant decreases observed when comparing coverage for some antigens between 2017 to 2021.
None of the national goals and targets for this age group have been reached in 2021 (95% goal to be reached by 2025) [Figure 2].
| Antigen | Number of dosesTable 4 note ‡ | 2013 | 2015 | 2017 | 2019 | 2021 |
|---|---|---|---|---|---|---|
| Diphtheria | ≥ 5 | 71.4 (69.2–73.5) | 74.6 (69.2–79.3) | 80.5Table 4 note ↓ (76.4–84.0) | 78.1 (73.2–82.4) | 71.9 (67.0–76.3) |
| Pertussis | ≥ 5 | 70.8 (68.6–73.0) | 74.9 (69.5–79.6) | 80.5Table 4 note ↓ (76.4–84.0) | 78.1 (73.2–82.4) | 71.9 (67.0–76.3) |
| Tetanus | ≥ 5 | 71.0 (68.7–73.1) | 74.6 (69.2–79.3) | 80.5Table 4 note ↓ (76.4–84.0) | 78.1 (73.2–82.4) | 71.9 (67.0–76.3) |
| Polio | ≥ 4 | 89.5Table 4 note ↑ (88.0–90.8) | 90.2 (85.9–93.2) | 92.3 (89.4–94.4) | 89.3 (85.4–92.3) | 87.3 (83.4–90.4) |
| Haemophilus influenzae type b (Hib) | ≥ 4 | 80.7 (78.8–82.5) | 77.3 (72.3–81.7) | 83.9 (80.0–87.3) | 80.0 (75.2–84.1) | 78.5Table 4 note ↑ (73.6–82.8) |
| Measles | ≥ 2 | 85.7 (84.0–87.3) | 85.8 (81.2–89.4) | 87.0 (83.2–90.0) | 83.3 (78.8–87.0) | 79.2 (74.7–83.1) |
| Mumps | ≥ 2 | 85.1 (83.3–86.7) | 86.2 (81.7–89.7) | 86.4 (82.6–89.6) | 83.1 (78.5–86.8) | 79.5Table 4 note ↓ (75.0–83.4) |
| Rubella | ≥ 1 | 94.8 (93.6–95.7) | 93.5Table 4 note ↑ (90.0–95.9) | 94.5Table 4 note ↑ (92.0–96.3) | 95.9 (93.1–97.5) | 94.0 (90.9–96.1) |
Notes: 95% CI – 95% Confidence Interval (weighted). |
||||||
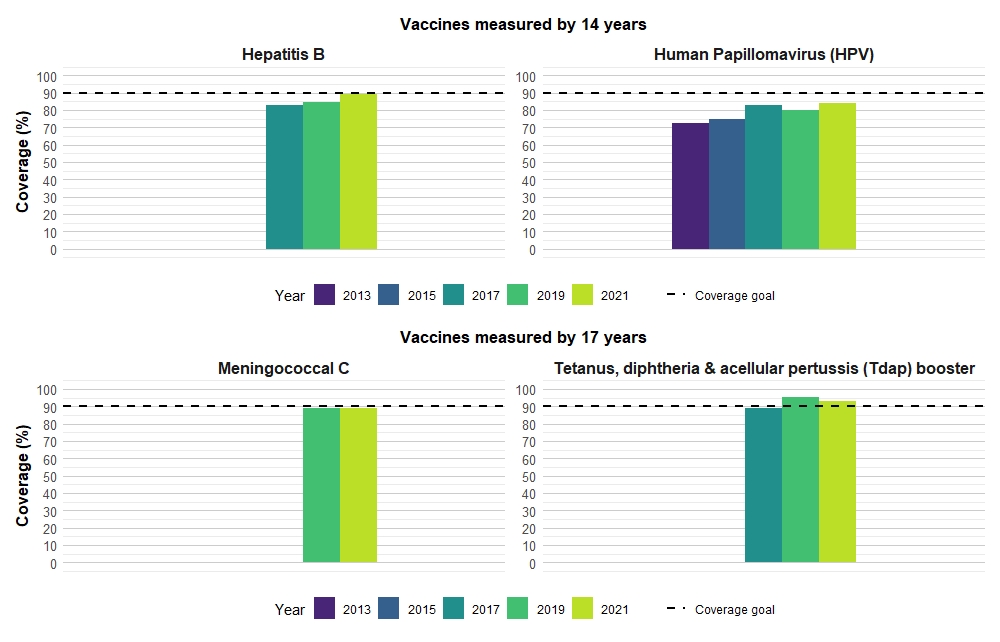
Vaccine coverage among 14- and 17-year-old children
Both the 14- and 17-year-old cNICS cohorts may have received a portion of their school-based vaccines in the earlier part of the 2019/2020 school year, prior to the onset of the pandemic; therefore, the impact of the pandemic among these age groups at a national level may not be fully measured.
Results from the 2021 cNICS indicate that among 14-year-olds, HPV vaccine coverage was 84.0% in 2021 and has increased significantly since 2019 (80.2%). While HPV coverage in 2021 has not changed for females (2021: 86.4%; 2019: 87.1%), uptake has increased among 14-year-old males from 73.0% in 2019 to 81.5% in 2021 further closing the gap in coverage between the genders. Hepatitis B coverage has also increased from 2019 (84.5%) to 2021 (89.0%), mainly driven by an increase among females (2019: 86.0%; 2021: 91.5%) and was 86.5% for males in 2021.
There have been no significant changes in vaccine coverage for the Tdap booster or meningococcal vaccine in 2021 compared to 2019 among 17-year-olds. Only vaccine coverage for the Tdap booster continues to meet the national coverage goal of 90%, with coverage estimated at 92.8% in 2021 (Figure 3).
| Antigen | Number of dosesTable 5 note ‡ | 2013 | 2015 | 2017 | 2019 | 2021 | |
|---|---|---|---|---|---|---|---|
| 14 | Hepatitis BTable 5 footnote a | ≥ 1 | n/a | n/a | 83.1 (80.8–85.2) | 84.5Table 5 note ↑ (82.1–86.7) | 89.0Table 5 note ** (86.3–91.2) |
| Human papillomavirus (HPV)Table 5 footnote b | ≥ 1 | 72.7 (70.8–74.6) | 74.6 (70.2–78.5) | 83.0 (79.5–85.9) | 80.2 (77.7–82.6) | 84.0Table 5 note ** (80.9–86.6) | |
| 17 | Tetanus, diphtheria and acellular pertussis (Tdap) boosterTable 5 footnote c | 1 | n/a | n/a | 89.3 (86.8–91.4) | 95.3 (93.1–96.8) | 92.8 (89.5–95.1) |
| Meningococcal type CTable 5 footnote c | 1 | n/a | n/a | n/a | 89.3 (86.3–91.7) | 89.0 (85.2–92.0) | |
Notes: 95% CI – 95% Confidence Interval (weighted). Footnotes: |
|||||||
Vaccine refusal/unvaccinated children
Parents or guardians of all children surveyed were asked whether their child had ever been vaccinated with any vaccine. Among children who had been vaccinated at least once, parents/guardians were subsequently asked if they had refused any vaccine in particular.
In the 2021 cNICS, 2.1% of 2-year-old children had not received any vaccine in their lifetime (Table 6). This is not significantly different from the proportion of unvaccinated 2-year-old children in the 2019 cNICS (1.7%). In 2021, cNICS results showed that 3.7% of 7-year-olds and less than 1% of 14-year-olds had not received any vaccine in their lifetime. The proportion of unvaccinated 17-year-old children is unreportable due to small sample size.
Among parents of 2-year-old children with no history of vaccination, the main reasons cited for not vaccinating their child were:
- Concerns about risk of side effects (54.6%);
- Did not consider it necessary (42.7%); and
- Not confident in effectiveness (26.1%).
These estimates are of marginal quality due to high sampling variability and should be used with caution.
Among 2- and 14-year-olds who had been vaccinated, 6.7% of parents/guardians had refused at least 1 vaccine for their child (excluding influenza) in 2021, down from 9.0% in 2019. Vaccines most frequently refused in 2021 were varicella (25.2%), rotavirus (14.0%), and hepatitis B (11.1%) vaccines, which are the same top 3 vaccines refused in 2019.
| Age (years) | 2019 | 2021 |
|---|---|---|
| 2 | 1.7 (0.8–3.4) | 2.1 (1.6–2.9) |
| 7 | Table 6 note F | 3.7 (2.2–6.4) |
| 14 | Table 6 note F | 0.4 (0.2–1.3) |
| 17 | 1.5Table 6 note ↓ (0.7–2.9) | Table 6 note F |
Notes: 95% CI – 95% Confidence Interval (weighted). |
||
Hesitancy/reluctance to vaccinate
The proportion of parents of 2-year-olds (whose child had received at least 1 vaccine) who reported being initially hesitant about vaccinating their child with a vaccine other than influenza but ended up having their child vaccinated decreased from 2019 to 2021 (9.9% to 5.6%, respectively). This is in contrast to parents of 14-year-old children who reported being more hesitant in 2021 (19.7%), compared to 2019 (14.5%).
The most commonly reported reasons for parental hesitancy (among parents of 2- and 14-year-olds) in 2021 were similar to 2019 and included concern about side effects (66.7%), believing that vaccines were not necessary (24.4%) and not being confident in vaccine effectiveness (18.5%).
Also, in 2021, the most common reasons that parents decided to have their child vaccinated despite initial reluctance was to protect the child from disease (41.7%), because of advice from their doctor or health care professional (29.0%), and the perception that the benefits of getting the vaccine for their child outweighed the risks (22.5%).
Delays and obstacles to vaccination
Among parents/guardians of children 2 and 14 years of age whose child had been vaccinated, 9.3% had decided to delay at least 1 vaccine for their child in 2021. The most commonly reported reasons for delaying a vaccine were that the parent/guardian wanted more time to decide about vaccines (25.8%), too many vaccines are given to children at the same time (22.7%), their child had a health issue or was sick (20.1%), and they thought their child was too young to be vaccinated (15.5%).
Similarly, 5.4% of parents/guardians of 2- and 14-year-old children in 2021 had encountered an obstacle that prevented them from having their child vaccinated. Among parents/guardians who reported encountering an obstacle to routine vaccination, the most frequently reported obstacle was the inability to get an appointment (36.5%), very likely due to the pandemic, as reflected by the section presented below.
Impact of the COVID-19 pandemic on vaccination
The 2021 cNICS included new questions to determine the impact of the COVID-19 pandemic on parents' inclination to vaccinate their child against vaccine preventable diseases, and if COVID-19 related public health measures had resulted in delays or obstacles to vaccinate their child.
Inclination to vaccinate
Parents/guardians of children in all age groups were asked if the inclination to vaccinate their child had changed due to the COVID-19 pandemic. More than three-quarters of parents/guardians reported no change in their inclination to vaccinate their child due to the COVID-19 pandemic (79.7%) and a small proportion indicated that they were less inclined to vaccinate their child (2.5%) [Table 7]. The proportion of parents/guardians who reported being more inclined to vaccinate their child due to the influence of the pandemic (17.7%), was greater among parents/guardians of older children compared to younger children (2 yrs.: 7.7%, 7 yrs.: 17.5%, 14 yrs.: 23.9% and 17 yrs.: 20.9%) [Table 7].
Parents/guardians of children who identified as Inuit (35.7%), Filipino (21.7%), Chinese (19.0%) and South Asian (15.1%), reported a higher inclination to vaccinate due to the COVID-19 pandemic, compared to parents/guardians of children who identified as white (Table 7).
| Factor | Yes, more inclined as a result of the COVID-19 pandemic | Yes, less inclined as a result of the COVID-19 pandemic | No, it did not influence my decision |
|---|---|---|---|
| All age groups | 17.7 (16.0–19.6) | 2.5Table 7 note ↑ (2.0–3.3) | 79.7 (77.8–81.5) |
| Child's age group | |||
| 2 years | 7.7 (6.6–9.0) | 3.5Table 7 note ↓ (2.7–4.6) | 88.8 (87.2–90.2) |
| 7 years | 17.5Table 7 note ↑Table 7 note ** (13.8–22.0) | 2.0 (0.9–4.3) | 80.5Table 7 note ↓Table 7 note ** (75.9–84.4) |
| 14 years | 23.9Table 7 note ** (20.9–27.2) | 3.5Table 7 note ↓ (2.3–5.1) | 72.6Table 7 note ** (69.2–75.8) |
| 17 years | 20.9Table 7 note ** (17.0–25.4) | 1.3Table 7 note ** (0.5–3.0) | 77.8Table 7 note ** (73.2–81.8) |
| Ethnicity of child | |||
| White | 4.4 (3.4–5.7) | 2.9 (2.0–4.3) | 92.6 (90.9–94.1) |
| Indigenous | 6.5Table 7 note ↑ (3.1–13.0) | 4.6 (1.3–14.9) | 88.9 (79.6–94.3) |
| First Nations | 2.0Table 7 note E (0.6–6.4) | 2.4 (0.8–7.5) | 95.6 (89.7–98.2) |
| Inuit | 35.7Table 7 note ** (14.9–63.8) | 2.2 (0.9–5.7) | 62.1Table 7 note ** (35.4–83.0) |
| South Asian | 15.1Table 7 note ** (9.9–22.4) | 1.1Table 7 note ** (0.3–3.5) | 83.8Table 7 note ** (76.4–89.1) |
| Chinese | 19.0Table 7 note ** (12.1–28.8) | 8.1 (4.3–14.9) | 72.8Table 7 note ** (62.9–80.9) |
| Black | 6.7 (3.4–12.9) | 5.9 (2.9–11.6) | 87.4 (80.3–92.1) |
| Filipino | 21.7Table 7 note ** (14.6–30.9) | 3.1 (1.3–7.0) | 75.3Table 7 note ** (65.8–82.8) |
| Other racialized groups | 10.8Table 7 note ** (6.9–16.5) | 4.2 (1.8–9.7) | 85.0Table 7 note ** (78.2–89.9) |
Question: "Excluding the COVID-19 and influenza vaccines, did the COVID-19 pandemic influence your decision to get [child's name] vaccinated?" Notes: 95% CI – 95% Confidence Interval (weighted). |
|||
Delays and obstacles to vaccination due to the COVID-19 pandemic
Parents and guardians of children in all age groups were also asked if they had encountered any obstacles or delayed any of their child's vaccinations by more than 30 days due to the COVID-19 pandemic.
The largest proportion who reported that they encountered a COVID-19 related obstacle was among parents/guardians of 2-year-olds (11.5%), followed by 14-year-olds (8.9%), 7-year-olds (2.9%) and 17-year-olds (2.5%). Among parents/guardians of 2-year-olds who reported experiencing a pandemic related obstacle to vaccination, the majority of parents/guardians cited:
- Limited appointment availability (74.0%);
- Concern about being exposed to COVID-19 (36.2%); and
- No one could take care of their other children during the appointment (14.3%).
The largest proportion who reported a delay of more than 30 days was among parents/guardians of 14-year-olds (12.9%), followed by 2-year-olds (10.4%), 17-year-olds (2.8%) and 7-year-olds (2.5%). The reasons for delay were similar to those who reported an obstacle. The majority of parents/guardians of 2- year-olds cited:
- Limited appointment availability (52.3%);
- Concern about being exposed to COVID-19 (24.9%); and
- Child was unwell and could not attend the appointment (5.3%).
Influence of COVID-19 pandemic on coverage among 2-year-old children
Two-year-old children with parents/guardians who reported lower inclination to vaccinate as a result of the COVID-19 pandemic, reported lower vaccine coverage for some vaccines compared to parents/guardians who reported no change in their inclination to vaccinate. This was the case for diphtheria, tetanus, pertussis, Hib, varicella and meningococcal vaccines (Table 8).
Among parents/guardians of 2-year-old children who encountered an obstacle or delay in vaccination due to the COVID-19 pandemic, lower vaccine coverage was reported for all vaccines, except rotavirus, pneumococcal, and polio, compared to those who did not report an obstacle or delay of more than 30 days.
| COVID-19 factor | Diphtheria, Pertussis, and Tetanus | Polio | Haemophilus influenzae type b (Hib) | Measles | Mumps | Rubella | Hepatitis B | Varicella | Meningococcal type C | Pneumococcal | Rotavirus |
|---|---|---|---|---|---|---|---|---|---|---|---|
| (≥ 4 doses) | (≥ 3 doses) | (≥ 4 doses) | (≥ 1 dose) | (≥ 1 dose) | (≥ 1 dose) | (≥ 3 doses)Table 8 footnote a | (≥ 1 dose) | (≥ 1–2 doses)Table 8 footnote b | (≥ 3–4 doses)Table 8 footnote c | (≥ 2 doses)Table 8 footnote d | |
| Change in inclination to vaccinate due to COVID-19 pandemic | |||||||||||
| Yes, more inclined as a result of the COVID-19 pandemic | 75.2 (67.0–82.0) | 90.4 (83.8–94.5) | 74.4 (66.0–81.3) | 92.2 (86.5–95.6) | 92.2 (86.5–95.6) | 92.2 (86.5–95.6) | 82.7Table 8 note E (70.7–90.4) | 89.1 (82.6–93.4) | 94.6Table 8 note ** (91.1–96.8) | 85.7 (78.2–90.8) | 83.6 (75.0–89.7) |
| Yes, less inclined as a result of the COVID-19 pandemic | 62.9Table 8 note E (46.8–76.6) | 88.7Table 8 note E (78.5–94.4) | 62.9Table 8 note **Table 8 note E (46.8–76.6) | 86.3Table 8 note E (74.7–93.1) | 86.3Table 8 note E (74.7–93.1) | 86.3 (74.7–93.1)Table 8 note E | Table 8 note F | 72.0Table 8 note **Table 8 note E (55.0–84.4) | 75.2Table 8 note **Table 8 note E (58.1–86.9) | 81.5Table 8 note ↓Table 8 note ** (67.4–90.3) | Table 8 note F |
| No, it did not influence my decision | 77.9 (75.4–80.2) | 92.0 (90.3–93.4) | 75.9 (73.4–78.3) | 91.8 (89.9–93.3) | 91.6 (89.7–93.2) | 91.6 (89.7–93.2) | 83.1 (80.0–85.8) | 87.8 (85.7–89.6) | 90.7 (88.8–92.3) | 85.2 (83.0–87.2) | 85.7 (83.4–87.7) |
| COVID-19 related obstacle to vaccination | |||||||||||
| Yes | 64.6Table 8 note ** (56.3–72.1) | 90.5Table 8 note ↑ (84.4–94.4) | 65.0Table 8 note ** (56.7–72.4) | 86.3Table 8 note ** (78.8–91.4) | 86.3Table 8 note ** (78.8–91.4) | 86.3Table 8 note ** (78.8–92.4) | 62.7Table 8 note ** (50.8–73.3) | 79.8Table 8 note ** (71.5–86.1) | 82.9Table 8 note ** (74.6–88.9) | 82.8 (75.3–88.4) | 85.6 (77.7–91.0) |
| No | 81.2 (78.8–83.4) | 94.6 (93.3–95.8) | 79.0 (76.5–81.3) | 95.0 (93.5–96.2) | 94.9 (93.3–96.1) | 94.9 (93.3–96.1) | 86.8 (83.8–89.3) | 91.0 (89.1–92.6) | 94.2 (92.5–95.5) | 88.0 (85.9–89.8) | 88.2 (86.1–90.0) |
| Delayed vaccination by 30+ days due to COVID-19 pandemic | |||||||||||
| Yes | 55.1Table 8 note ** (45.5–64.3) | 89.9 (83.0–94.2) | 55.4 (45.7–64.7) | 79.8Table 8 note ** (70.9–86.5) | 79.8Table 8 note ** (70.9–86.5) | 79.8Table 8 note ** (70.9–86.5) | 58.8Table 8 note ** (45.4–70.9) | 74.9Table 8 note ** (65.6–82.3) | 79.1Table 8 note ** (70.0–86.0) | 78.6Table 8 note ** (69.8–85.4) | 83.4 (74.4–89.7) |
| No | 82.1 (79.7–84.2) | 94.7 (93.3–95.8) | 79.9 (77.5–82.2) | 95.7 (94.3–96.8) | 95.5Table 8 note ↑ (94.1–96.6) | 95.5Table 8 note ↑ (94.1–96.6) | 86.9 (84.0–89.3) | 91.4 (89.5–93.0) | 94.5Table 8 note ↓ (92.9–95.7) | 88.4 (86.4–90.1) | 88.3 (86.3–90.1) |
Notes: 95% CI – 95% Confidence Interval (weighted). Footnotes: |
|||||||||||
Parental knowledge, attitudes, and beliefs about childhood vaccines
To better understand the factors influencing decisions on vaccination, parents and guardians were asked about their views on childhood vaccination (Table 9).
Most parents and guardians of 2-year-old children still agree that childhood vaccines are safe (97.0%), effective (97.9%), and help to protect their child's health (97.4%).
However, in 2021, a larger proportion of parents/guardians believe that alternative practices, healthy nutrition and hygiene can replace the need for vaccination compared to 2019. In 2021, 14.9% of parents and guardians believe that alternative practices such as homeopathy or naturopathy can replace vaccines (up from 11.3% in 2019) and 16.1% of parents/guardians believe that a healthy lifestyle can replace vaccination (up from 11.1% in 2019).
| Statements | AgreeTable 9 footnote a, %Table 9 note * | |
|---|---|---|
| 2019 | 2021 | |
| In general, childhood vaccines are safe. | 96.2 (94.4–98.0) | 97.0 (96.0–97.7) |
| In general, childhood vaccines are effective. | 97.7 (96.2–99.1) | 97.9 (97.0–98.5) |
| In general, vaccines help to protect my child's health. | 97.5Table 9 note ↓ (96.0–99.0) | 97.4 (96.4–98.1) |
| In general, I am concerned about the potential side effects from vaccines. | 49.4 (44.7–54.1) | 49.7 (47.3–52.1) |
| In general, a vaccine can give you a serious case of the very same disease it was meant to prevent. | 20.8 (16.8–24.7) | 23.5Table 9 note ↑ (21.4–25.7) |
| In general, the use of alternative practices, such as homeopathy or naturopathy, can eliminate the need for vaccination. | 11.3 (8.2–14.3) | 14.9Table 9 note ** (13.2–16.7) |
| In general, a healthy lifestyle such as healthy nutrition and hygiene can replace the need for vaccination. | 11.1 (8.2–13.9) | 16.1Table 9 note ** (14.3–18.0) |
| Having my child vaccinated helps to protect the health of others in my family. | 96.0 (94.3–97.8) | 93.2Table 9 note ** (91.8–94.3) |
| Having my child vaccinated helps to protect the health of others in my community. | 96.5Table 9 note ↑ (94.9–98.2) | 93.8Table 9 note ** (92.6–94.8) |
| Most parents in my community have their children vaccinated with all recommended vaccines. | 95. 5Table 9 note ↑ (93.4–97.6) | 92.3Table 9 note ** (90.9–93.6) |
| Children receive too many vaccines at the same visit. | 32.5Table 9 note ↓ (28.1–36.9) | 31.0 (28.7–33.4) |
| Children receive too many vaccines overall. | 22.1 (18.1–26.1) | 22.2 (20.2–24.4) |
| It is better to develop immunity from having a disease rather than from a vaccine. | 20.3 (16.5–24.1) | 20.3 (18.3–22.5) |
| Delaying child vaccines causes risks to their health. | 77.3 (73.3–81.2) | 77.0 (74.8–79.0) |
| Unvaccinated children are at higher risk of getting some serious diseases. | 94.0 (91.8–96.3) | 91.6 (90.2–92.8) |
Notes: 95% CI – 95% Confidence Interval (weighted). Footnotes: |
||
Trusted sources of information on vaccines
Parent/guardians of 2-year-old children were also asked which sources of vaccine-related information they trusted most. Doctors remained the most trusted source of information on vaccines (92.1%), followed by nurses (88.1%), and medical associations (84.1%).
Trust in alternative health care providers (e.g., naturopath, homeopath) increased from 21.8% in 2019 to 29.4% in 2021. Trust in other sources of information such a midwives (2019: 54.9%, 2021: 64.1%) and pharmacists (2019: 76.5%, 2021: 82.6%) also increased from 2019 to 2021.
Trust in provincial/territorial ministries of health has decreased from 2019 to 2021 (82.3% to 77.6%, respectively). Trust in the Public Health Agency of Canada/Health Canada has also decreased from 2019 to 2021 (85.9% to 81.6%, respectively).
Methodology
Data collection
Data collection for the 2021 cNICS was conducted from January 10, 2022, to July 14, 2022, and data from one or multiple sources were used to produce national immunization coverage estimates for 2-, 7-, 14-year-olds (males and females separately) and 17-year-olds. Provincial- or territorial-level results were also produced for 2-year-olds.
The data collection phase of the cNICS involved the administration of a self-response electronic questionnaire or a computer-assisted telephone interview (CATI) during which the parent or guardian answered questions about the vaccines their child had received. The target population for this phase consisted of all children aged 2, 7, 14, or 17 years of age as of March 1, 2021. The survey population is based on the list of applicants to the Canada Child Benefit (CCB), which is a monthly file provided by the Canada Revenue Agency.
For children aged 2 and 7 years, the parent or guardian had to have the immunization booklet or record on hand to respond to questions about the child's vaccinations. For children aged 14 and 17 years, if the respondent did not have the immunization booklet available, they could answer questions about their child's vaccine history based on memory.
Parents and guardians of children aged 2 and 14 years were also asked questions about their knowledge, attitudes and beliefs about vaccination.
A total of 5,446 parents responded to the survey. Table 10 includes a summary of participation by age group.
| Province or territory | Total | 2 years (n) | 7 years (n) | 14 years (n) | 17 years (n) |
|---|---|---|---|---|---|
| Canada | 5,446 | 3,954 | 351 | 758 | 383 |
| Newfoundland and Labrador | n/a | 287 | n/a | n/a | n/a |
| Prince Edward Island | n/a | 284 | n/a | n/a | n/a |
| Nova Scotia | n/a | 314 | n/a | n/a | n/a |
| New Brunswick | n/a | 328 | n/a | n/a | n/a |
| Quebec | n/a | 461 | n/a | n/a | n/a |
| Ontario | n/a | 407 | n/a | n/a | n/a |
| Manitoba | n/a | 354 | n/a | n/a | n/a |
| Saskatchewan | n/a | 315 | n/a | n/a | n/a |
| Alberta | n/a | 365 | n/a | n/a | n/a |
| British Columbia | n/a | 362 | n/a | n/a | n/a |
| Yukon | n/a | 150 | n/a | n/a | n/a |
| Northwest Territories | n/a | 136 | n/a | n/a | n/a |
| Nunavut | n/a | 191 | n/a | n/a | n/a |
Notes: n = non-weighted count. n/a = Not applicable |
|||||
The validation phase of the cNICS involved verification of parent-reported vaccine histories using records from Health Care Providers (HCP). The data from the health care providers were used to correct and complete the vaccine history information reported by parents/guardians during the survey.
During the survey, respondents were asked to complete and return a consent form by mail to authorize Statistics Canada to contact their child's health care providers for all ages to obtain their child's records of vaccination history.
For parents who provided consent, Statistics Canada mailed a detailed child immunization history questionnaire to the child's health care providers. They were asked to complete and return the form to Statistics Canada by mail.
For the 2021 cNICS, respondents from Prince Edward Island and Manitoba were asked for permission to access their child's immunization record from provincial immunization registries for all ages. When parent consent was provided during the survey, parents and guardians living in these 2 provinces were able to skip the detailed questions about their child's vaccination history and registry data were used in place of parent or health care provider data.
The sources of the immunization data used by age group is provided in Table 11. Overall, immunization registry data was used for 11.5% of respondents and 18% were validated using healthcare provider records.
| Age group | 2 years old | 7 years old | 14 years old | 17 years old | Total | |||||
|---|---|---|---|---|---|---|---|---|---|---|
| n | % | n | % | n | % | n | % | n | % | |
| Parent/guardian with booklet | 1,377 | 34.8 | 179 | 51.0 | 199 | 26.3 | 0 | 0 | 1,755 | 32.2 |
| Healthcare provider (HCP) | 142 | 3.6 | 19 | 5.4 | 52 | 6.9 | 44 | 11.5 | 257 | 4.7 |
| Parent/guardian with booklet and HCP | 819 | 20.7 | 112 | 31.9 | 70 | 9.2 | 0 | 0 | 1,001 | 18.4 |
| Parent/guardian with booklet and HCP (exact match) | 125 | 3.2 | 6 | 1.7 | 5 | 0.7 | 0 | 0 | 136 | 2.5 |
| Parent/guardian no booklet | 932 | 23.6 | 14 | 4.0 | 397 | 52.4 | 330 | 86.2 | 1,673 | 30.7 |
| Registry data only (MB and PEI only) | 559 | 14.1 | 21 | 6.0 | 35 | 4.6 | 9 | 2.4 | 624 | 11.5 |
Notes: n = non-weighted count. |
||||||||||
Technical notes
Coverage estimates from the cNICS may be different than those reported from provincial/territorial immunization registries due to different sampling methodologies and time periods of interest.
Children were considered to be "up-to-date" for specific antigens if they had received the recommended number of doses by 2, 7, 14, and 17 years of age. Variation in provincial or territorial vaccination programs were considered in calculating the required number of doses. The timing of doses was not considered when assessing coverage, however, 2 doses of the same antigen had to be at least 28 days apart to be considered as distinct.
Coverage estimates for 2- and 7-year-old children were calculated based on parental immunization records, health care provider records and/or immunization registry information (PEI and MB only), whereas for 14- and 17-year-olds coverage estimates could be based on recall of vaccine history if documentation was not available.
For 2- and 7-year-old Canadian-born children, adjustments were made for diphtheria, pertussis, and tetanus because in Canada, these antigens are always given together as part of a combination vaccine. If a dose was reported for any one of diphtheria, pertussis, or tetanus, it was assumed that the child received all of these antigens on that given date, plus polio (i.e., diphtheria, tetanus, pertussis, and polio). Since polio vaccination can be given on its own outside of Canada, a single dose of polio was not used to correct or impute vaccine entries or other antigens.
Four routine vaccines are recommended during adolescence: HPV, hepatitis B, meningococcal, and a Tdap booster. Currently, 3 of these are offered in school-based vaccination programs in Canada. Depending on the jurisdiction, hepatitis B is offered either in infancy or between grades 4 and 7, HPV vaccine is offered between grades 4 and 7, with catch-up programs available in later years in some provinces. Meningococcal vaccine is offered anywhere between grades 4 to 12 depending on the jurisdiction.
School programs in Canada have been disrupted since the onset of the pandemic, however provinces have implemented catch-up programs. Among 14-year-olds, the impact of the pandemic will be evident on vaccine doses given after these children have turned 13 years (doses given at ages 13 and/or 14 years old - grades 7, 8, and 9), such as HPV. Among 17-year-olds, the impact of the pandemic will be evident on vaccine doses given after those children have turned 16 years (doses given at ages 16 and/or 17 years old - grades 10 and 11), for example TDaP is given in grades 6 to 9; meningococcal conjugate vaccine is mostly given in grades 6, 7, and 9.
Since 2019, CNICS asks respondents about their child's gender, which is different from sex assigned at birth – more information about gender can be found on the Statistics Canada website. Due to small sample sizes, and in alignment with the recommended practices for the dissemination of statistical information on gender adopted prior to the 2021 Census of Population at Statistics Canada, non-binary respondents were re-categorized randomly into "men+" and "women+" categories. Mention of boys refers to the men+ category and girls refer to women+.
Limitations
The sample size for 7-, 14- and 17-year-old children was not sufficient to report coverage estimates by demographic factors or by factors that are related to the impact of the COVID-19 pandemic (e.g., delays, obstacles).
Interviews were conducted in English or French, excluding children with parents that are not fluent in either official language.
A portion of the cNICS data was collected from parent-held vaccination records, in which some information may be incomplete, erroneous, or missing altogether, especially among vaccines delivered in schools such as Tdap, HPV, and hepatitis B.
Caution is advised when comparing with coverage estimates from previous iterations of CNICS, as apparent differences in estimates may reflect changes in methodology. For example, the 2019 cNICS was the first iteration to use web-based data collection.
The cNICS excludes First Nations children on-reserve communities, children in foster care, and institutionalized children.
What you need to know
- Vaccination is the best way to prevent serious diseases that can cause severe complications, or even death.
- Community immunity, referred to as herd immunity, also protects those infants who are too young to be vaccinated and those who are unable to be vaccinated due to medical reasons.
- Vaccines are safe and effective. They go through many tests before they are approved and can be used in Canada.
Contact us
For more information, please contact us at cnics-encve@phac-aspc.gc.ca.
Related links
- Childhood National Immunization Coverage Survey, 2021
- Vaccination coverage in Canadian children: Results from the 2019 cNICS
- Vaccination coverage in Canada
- Vaccine preventable diseases
- Vaccines for children
- Provincial and territorial routine and catch-up vaccination schedule for infants and children in Canada
- Your child's vaccination schedule
- A Parent's Guide to Vaccination