
FluWatch report: March 31 to April 6, 2019 (Week 14)
Download the alternative format
(PDF format, 871 KB, 10 pages)
Organization: Public Health Agency of Canada
Date published: 2019-04-12
Related Topics
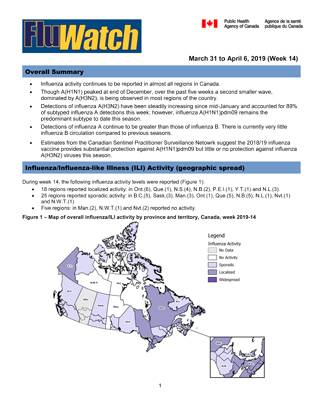
Overall Summary
- Influenza activity continues to be reported in almost all regions in Canada.
- Though A(H1N1) peaked at end of December, over the past five weeks a second smaller wave, dominated by A(H3N2), is being observed in most regions of the country.
- Detections of influenza A(H3N2) have been steadily increasing since mid-January and accounted for 89% of subtyped influenza A detections this week; however, influenza A(H1N1)pdm09 remains the predominant subtype to date this season.
- Detections of influenza A continue to be greater than those of influenza B. There is currently very little influenza B circulation compared to previous seasons.
- Estimates from the Canadian Sentinel Practitioner Surveillance Network suggest the 2018/19 influenza vaccine provides substantial protection against A(H1N1)pdm09 but little or no protection against influenza A(H3N2) viruses this season. For more information, please see the new vaccine monitoring section in the FluWatch report.
On this page
- Influenza/ILI Activity (geographic spread)
- Laboratory Confirmed Influenza Detections
- Syndromic/Influenza-like Illness Surveillance
- Participatory Syndromic Surveillance
- Influenza Outbreak Surveillance
- Severe Outcomes Influenza Surveillance
- Influenza Strain Characterizations
- Antiviral Resistance
- Vaccine Monitoring
- Provincial and International Influenza Reports
Influenza/Influenza-like Illness Activity (geographic spread)
During week 14, the following influenza activity levels were reported (Figure 1):
- 18 regions reported localized activity: in Ont.(6), Que.(1), N.S.(4), N.B.(2), P.E.I.(1), Y.T.(1) and N.L.(3).
- 25 regions reported sporadic activity: in B.C.(5), Sask.(3), Man.(3), Ont.(1), Que.(5), N.B.(5), N.L.(1), Nvt.(1) and N.W.T.(1)
- Five regions: in Man.(2), N.W.T.(1) and Nvt.(2) reported no activity.
Figure 1 – Map of overall influenza/ILI activity by province and territory, Canada, week 2019-14
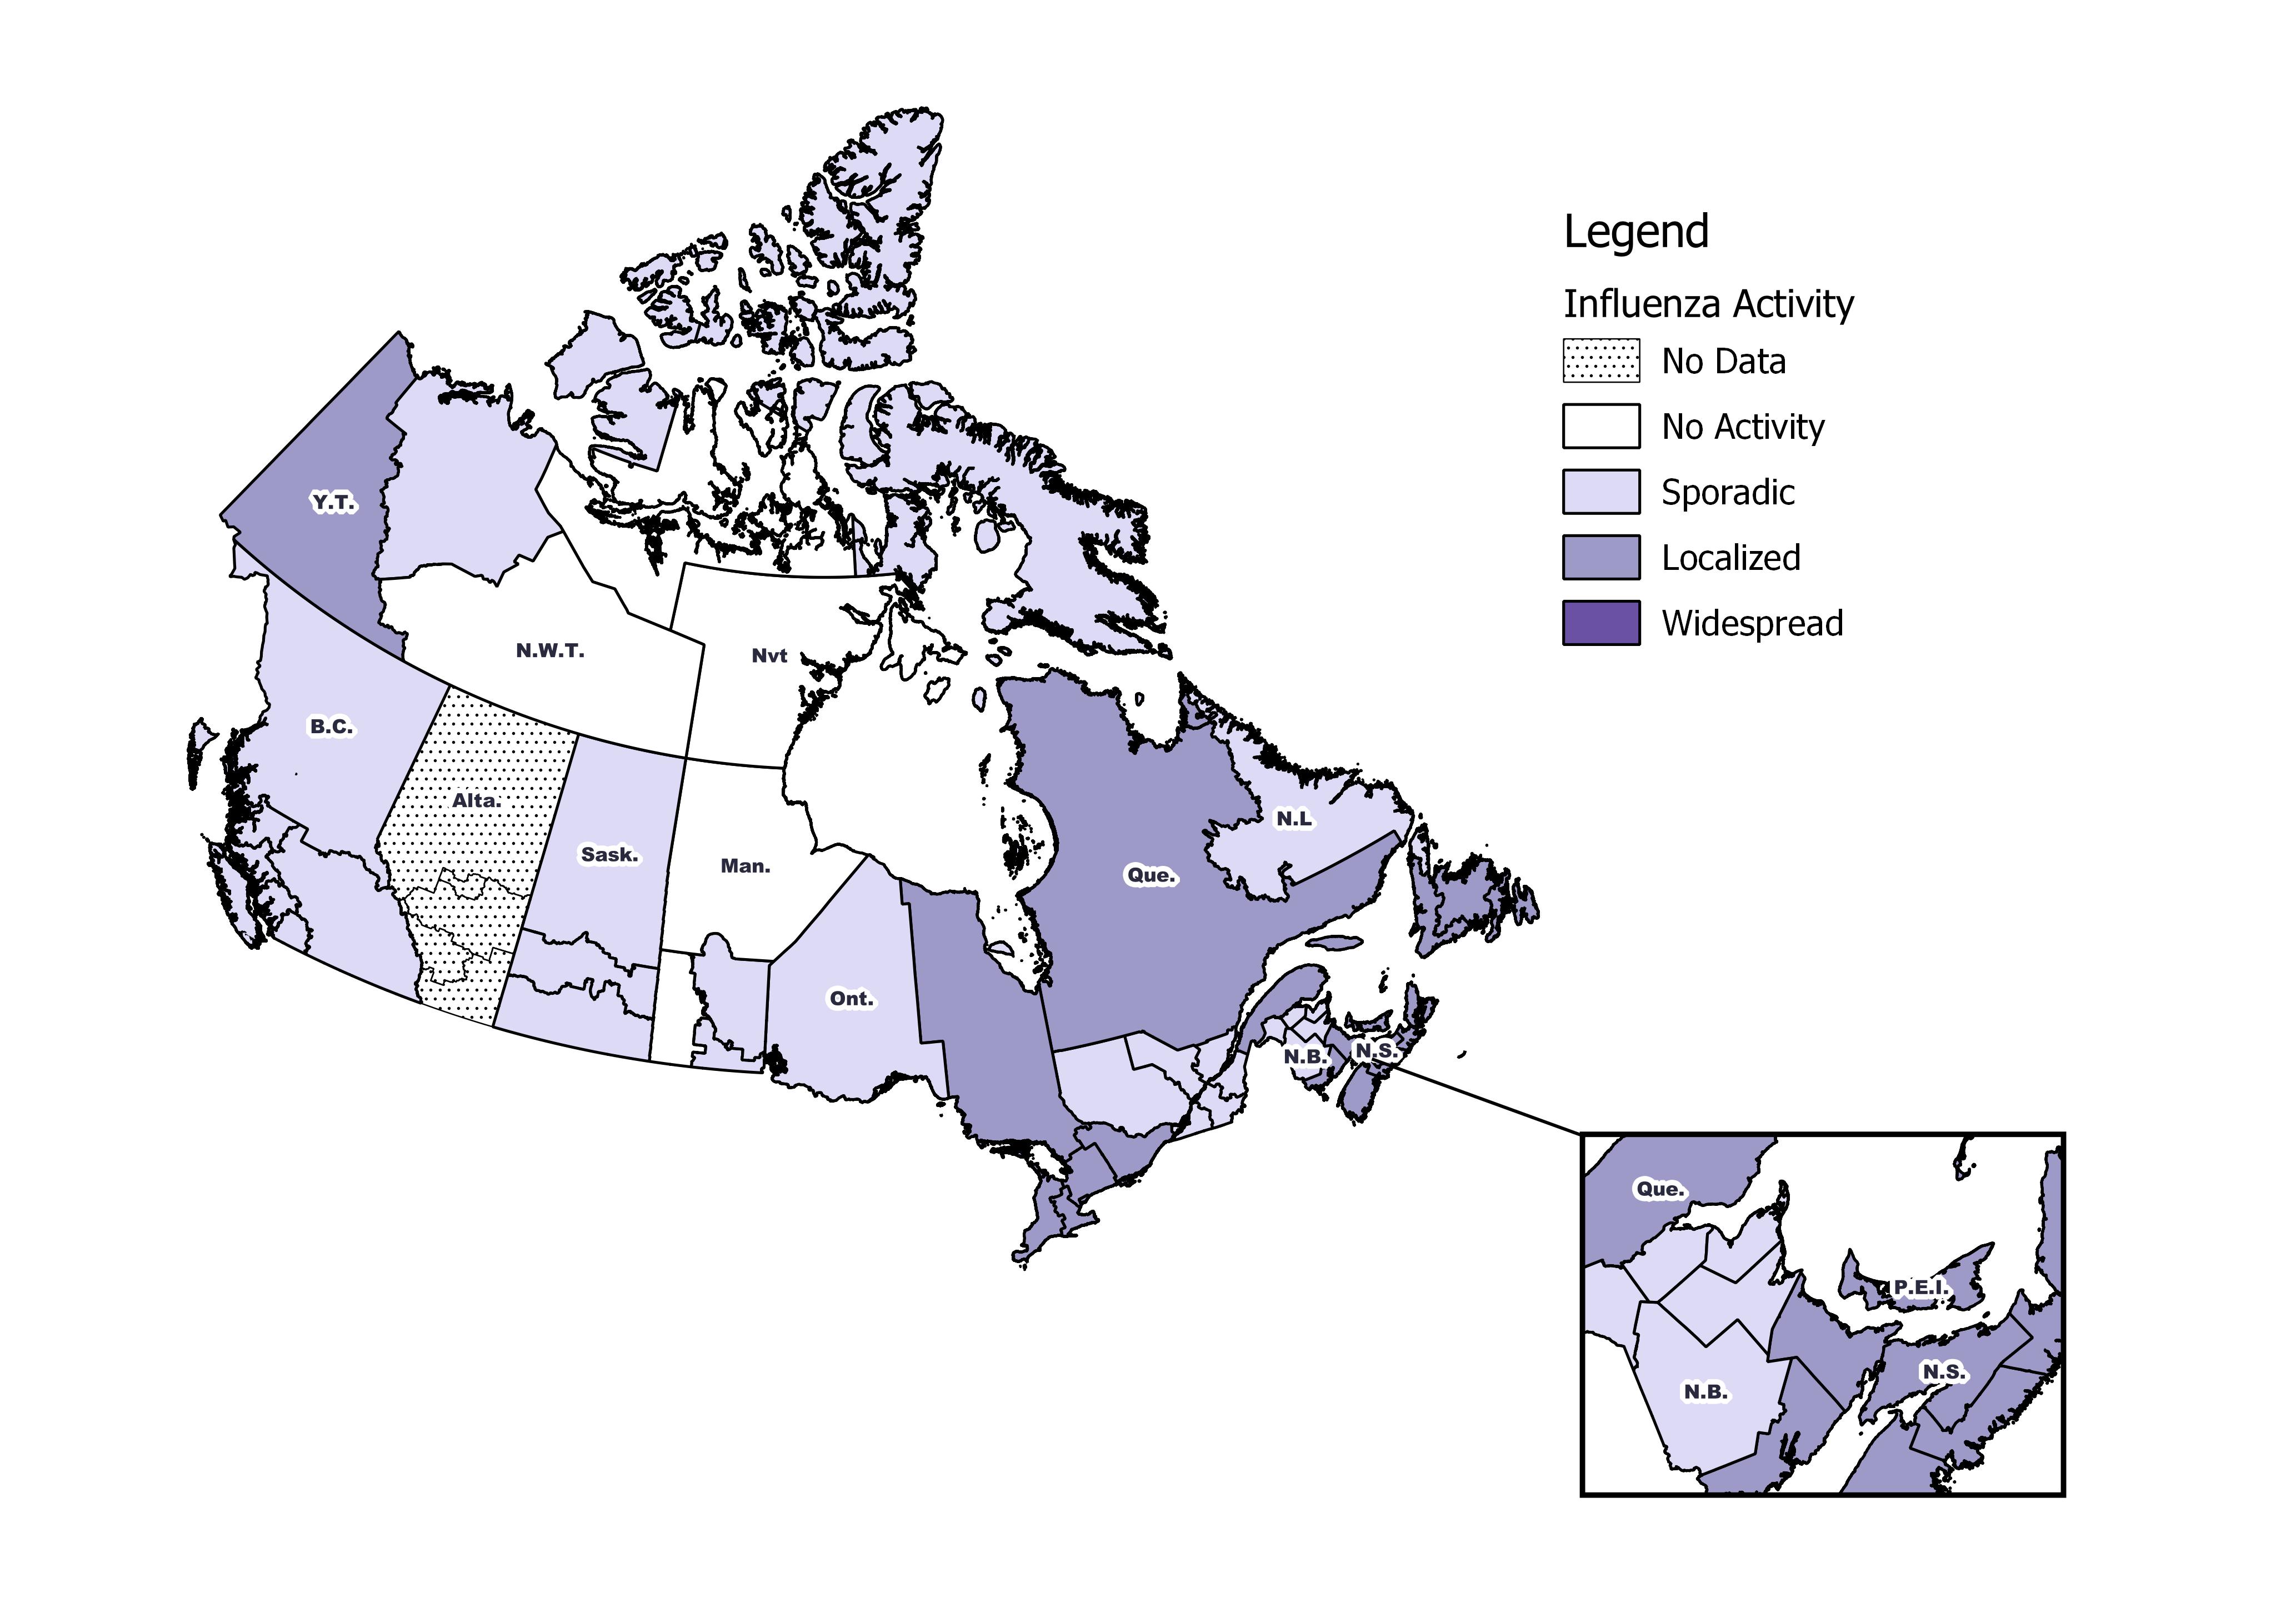
Figure 1 - Text equivalent
| Province | Influenza Surveillance Region | Activity Level |
|---|---|---|
| N.L. | Eastern | Localized |
| N.L. | Labrador-Grenfell | Sporadic |
| N.L. | Central | Localized |
| N.L. | Western | Localized |
| P.E.I. | Prince Edward Island | Localized |
| N.S. | Zone 1 - Western | Localized |
| N.S. | Zone 2 - Northern | Localized |
| N.S. | Zone 3 - Eastern | Localized |
| N.S. | Zone 4 - Central | Localized |
| N.B. | Region 1 | Localized |
| N.B. | Region 2 | Localized |
| N.B. | Region 3 | Sporadic |
| N.B. | Region 4 | Sporadic |
| N.B. | Region 5 | Sporadic |
| N.B. | Region 6 | Sporadic |
| N.B. | Region 7 | Sporadic |
| Que. | Nord-est | Localized |
| Que. | Québec et Chaudieres-Appalaches | Sporadic |
| Que. | Centre-du-Québec | Sporadic |
| Que. | Montréal et Laval | Sporadic |
| Que. | Ouest-du-Québec | Sporadic |
| Que. | Montérégie | Sporadic |
| Ont. | Central East | Localized |
| Ont. | Central West | Localized |
| Ont. | Eastern | Localized |
| Ont. | North East | Localized |
| Ont. | North West | Sporadic |
| Ont. | South West | Localized |
| Ont. | Toronto | Localized |
| Man. | Northern Regional | No Activity |
| Man. | Prairie Mountain | No Activity |
| Man. | Interlake-Eastern | Sporadic |
| Man. | Winnipeg | Sporadic |
| Man. | Southern Health | Sporadic |
| Sask. | North | Sporadic |
| Sask. | Central | Sporadic |
| Sask. | South | Sporadic |
| Alta. | North Zone | No Data |
| Alta. | Edmonton | No Data |
| Alta. | Central Zone | No Data |
| Alta. | Calgary | No Data |
| Alta. | South Zone | No Data |
| B.C. | Interior | Sporadic |
| B.C. | Fraser | Sporadic |
| B.C. | Vancouver Coastal | Sporadic |
| B.C. | Vancouver Island | Sporadic |
| B.C. | Northern | Sporadic |
| Y.T. | Yukon | Localized |
| N.W.T. | North | Sporadic |
| N.W.T. | South | No Activity |
| Nvt. | Qikiqtaaluk | Sporadic |
| Nvt. | Kivalliq | No Activity |
| Nvt. | Kitimeot | No Activity |
Laboratory-Confirmed Influenza Detections
In week 14, the following results were reported from sentinel laboratories across Canada (Figures 2 and 3):
- The percentage of tests positive for influenza was 19%; however, due to data quality issues this is likely an underestimate and should be interpreted with caution at this time.
- A total 1,243 laboratory detections of influenza were reported, of which 90% were influenza A.
- Influenza A(H3N2) accounted for 89% of subtyped influenza A detections.
- Since week 4 (mid-January), detections of influenza A(H3N2) have been steadily increasing.
To date this season, 42,104 laboratory-confirmed influenza detections have been reported:
- 97% have been influenza A.
- Among the 14,268 influenza A viruses subtyped, 77% have been A(H1N1)pdm09.
- Influenza B often circulates later in the season in Canada (Feb-Apr). Fewer influenza B detections have been reported this season compared to recent seasons at this time of year.
To date this season, detailed information on age and type/subtype has been received for 33,953 laboratory-confirmed influenza cases (Table 1):
- 83% of all influenza A(H1N1)pdm09 detections have been reported in individuals younger than 65 years of age.
- 57% of all influenza A(H3N2) detections have been reported in adults 65 years of age and older.
For more detailed weekly and cumulative influenza data, see the text descriptions for Figures 2 and 3 or the Respiratory Virus Detections in Canada Report.
Figure 2 – Number of positive influenza tests and percentage of tests positive, by type, subtype and report week, Canada, weeks 2018-35 to 2019-14
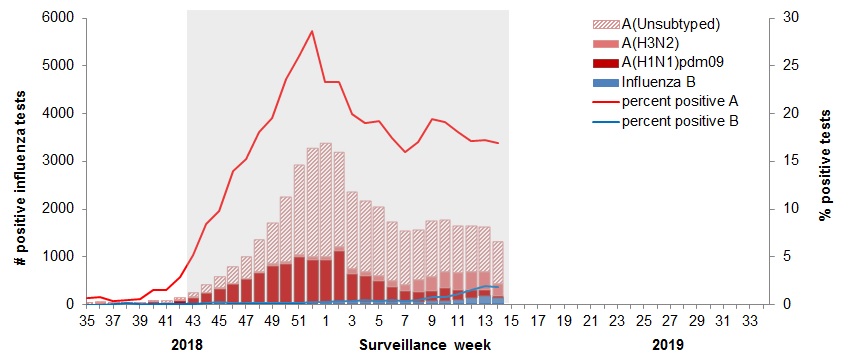
The shaded area indicates weeks where the positivity rate was at least 5% and a minimum of 15 positive tests were observed, signalling the period of seasonal influenza activity.
Figure 2 - Text equivalent
| Surveillance Week | A(Unsubtyped) | A(H3N2) | A(H1N1)pdm09 | Influenza B |
|---|---|---|---|---|
| 35 | 3 | 2 | 7 | 0 |
| 36 | 4 | 7 | 4 | 0 |
| 37 | 3 | 2 | 3 | 1 |
| 38 | 6 | 3 | 2 | 3 |
| 39 | 11 | 5 | 1 | 3 |
| 40 | 16 | 7 | 29 | 3 |
| 41 | 27 | 6 | 21 | 3 |
| 42 | 40 | 19 | 55 | 2 |
| 43 | 83 | 23 | 128 | 4 |
| 44 | 169 | 13 | 214 | 6 |
| 45 | 244 | 18 | 295 | 15 |
| 46 | 346 | 10 | 404 | 9 |
| 47 | 449 | 17 | 507 | 8 |
| 48 | 679 | 29 | 632 | 10 |
| 49 | 851 | 35 | 785 | 16 |
| 50 | 1368 | 35 | 828 | 14 |
| 51 | 1890 | 54 | 953 | 21 |
| 52 | 2292 | 55 | 903 | 26 |
| 1 | 2387 | 58 | 893 | 31 |
| 2 | 1985 | 93 | 1061 | 43 |
| 3 | 1613 | 101 | 585 | 40 |
| 4 | 1483 | 93 | 532 | 48 |
| 5 | 1449 | 112 | 433 | 43 |
| 6 | 1234 | 118 | 315 | 42 |
| 7 | 1116 | 128 | 244 | 33 |
| 8 | 1066 | 236 | 216 | 40 |
| 9 | 1172 | 285 | 213 | 64 |
| 10 | 1085 | 335 | 268 | 71 |
| 11 | 990 | 357 | 197 | 90 |
| 12 | 959 | 380 | 155 | 131 |
| 13 | 945 | 384 | 126 | 167 |
| 14 | 883 | 257 | 34 | 130 |
Figure 3 – Cumulative numbers of positive influenza specimens by type/subtype and province/territory, Canada, weeks 2018-35 to 2019-14
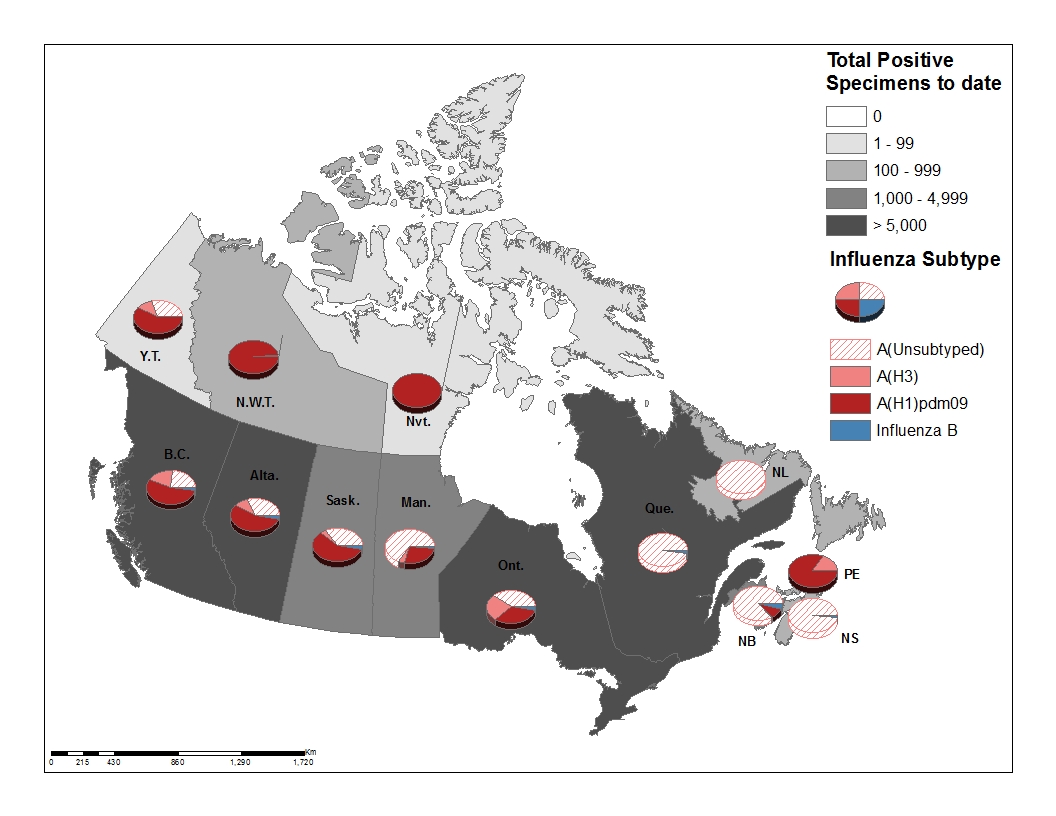
Figure 3 - Text equivalent
| Reporting provincesTable Figure 3 - Footnote 1 |
Week (March 31 to April 6, 2019) | Cumulative (August 26, 2018 to April 6, 2019) | |||||||||
|---|---|---|---|---|---|---|---|---|---|---|---|
| Influenza A | B | Influenza A | B | A & B Total |
|||||||
| A Total |
A (H1N1)pdm09 |
A (H3N2) |
A(UnS)Table Figure 3 - Footnote 3 | B Total |
A Total |
A (H1N1)pdm09 |
A (H3N2) |
A(UnS)Table Figure 3 - Footnote 3 | B Total |
||
| BC | 0 | 0 | 0 | 0 | 0 | 5469 | 3016 | 1117 | 1336 | 146 | 5615 |
| AB | 157 | 8 | 106 | 43 | 22 | 6257 | 3581 | 659 | 2017 | 187 | 6444 |
| SK | 14 | 0 | 9 | 5 | 6 | 2295 | 1374 | 93 | 828 | 70 | 2365 |
| MB | 17 | 6 | 5 | 6 | 1 | 1075 | 302 | 52 | 721 | 19 | 1094 |
| ON | 217 | 12 | 120 | 85 | 6 | 5564 | 2033 | 1258 | 2273 | 143 | 5707 |
| QC | 432 | 0 | 0 | 432 | 35 | 15644 | 0 | 0 | 15644 | 395 | 16039 |
| NB | 73 | 0 | 0 | 73 | 50 | 2613 | 230 | 34 | 2349 | 132 | 2745 |
| NS | 42 | 0 | 0 | 42 | 2 | 709 | 0 | 0 | 709 | 13 | 722 |
| PEI | 8 | 2 | 6 | 0 | 0 | 263 | 219 | 43 | 1 | 0 | 263 |
| NL | 149 | 0 | 0 | 149 | 0 | 822 | 1 | 0 | 821 | 3 | 825 |
| YT | 11 | 3 | 7 | 1 | 0 | 92 | 53 | 11 | 28 | 0 | 92 |
| N.W.T | 1 | 1 | 0 | 0 | 0 | 172 | 170 | 2 | 0 | 1 | 173 |
| NU | 0 | 0 | 0 | 0 | 0 | 20 | 20 | 0 | 0 | 0 | 20 |
| Canada | 1121 | 32 | 253 | 836 | 122 | 40995 | 10999 | 3269 | 26727 | 1109 | 42104 |
| PercentageTable Figure 3 - Footnote 2 | 90% | 3% | 23% | 75% | 10% | 97% | 27% | 8% | 65% | 3% | 100% |
Discrepancies in values in Figures 2 and 3 may be attributable to differing data sources. Cumulative data includes updates to previous weeks. |
|||||||||||
| Age groups (years) | Cumulative (August 26, 2018 to April 6, 2019) | ||||||
|---|---|---|---|---|---|---|---|
| Influenza A | B | Influenza A and B | |||||
| A Total | A(H1N1) pdm09 | A(H3N2) | A (UnS)Table 1 – Note 1 | Total | # | % | |
| 0-4 | 6383 | 1667 | 163 | 4553 | 161 | 6544 | 19% |
| 5-19 | 4764 | 1378 | 352 | 3034 | 242 | 5006 | 15% |
| 20-44 | 6370 | 1957 | 442 | 3971 | 171 | 6541 | 19% |
| 45-64 | 6466 | 1908 | 462 | 4096 | 86 | 6552 | 19% |
| 65+ | 9117 | 1404 | 1902 | 5811 | 193 | 9310 | 27% |
| Total | 33100 | 8314 | 3321 | 21465 | 853 | 33953 | 100% |
|
|||||||
Syndromic / Influenza-like Illness Surveillance
Healthcare Professionals Sentinel Syndromic Surveillance
In week 14, 1.1% of visits to healthcare professionals were due to influenza-like illness (ILI) (Figure 4).
Figure 4 – Percentage of visits for ILI reported by sentinels by report week, Canada, weeks 2018-35 to 2019-14
Number of Sentinels Reporting in Week 14: 98
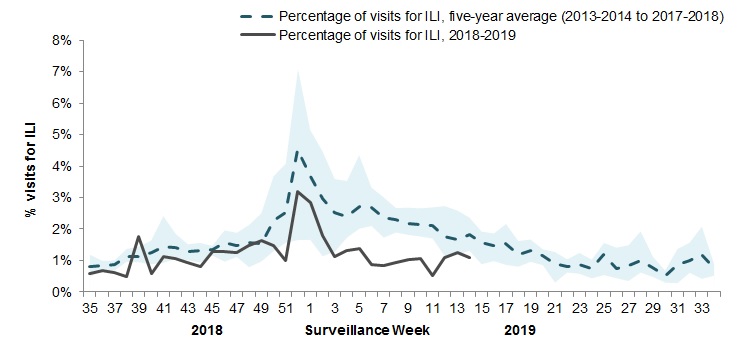
The shaded area represents the maximum and minimum percentage of visits for ILI reported by week from seasons 2013-2014 to 2017-2018
Figure 4 - Text equivalent
| Surveillance Week | 2018-19 | Average | Min | Max |
|---|---|---|---|---|
| 35 | 0.6% | 0.8% | 0.5% | 1.2% |
| 36 | 0.7% | 0.8% | 0.7% | 1.0% |
| 37 | 0.6% | 0.9% | 0.7% | 1.0% |
| 38 | 0.5% | 1.1% | 1.0% | 1.4% |
| 39 | 1.8% | 1.1% | 0.9% | 1.4% |
| 40 | 0.6% | 1.3% | 0.9% | 1.6% |
| 41 | 1.1% | 1.4% | 0.9% | 2.4% |
| 42 | 1.0% | 1.4% | 1.0% | 1.9% |
| 43 | 0.9% | 1.3% | 1.0% | 1.5% |
| 44 | 0.8% | 1.3% | 0.9% | 1.6% |
| 45 | 1.3% | 1.3% | 1.2% | 1.5% |
| 46 | 1.3% | 1.6% | 1.0% | 2.0% |
| 47 | 1.3% | 1.5% | 1.1% | 1.9% |
| 48 | 1.5% | 1.6% | 0.8% | 2.1% |
| 49 | 1.6% | 1.5% | 1.0% | 2.5% |
| 50 | 1.5% | 2.3% | 1.3% | 3.7% |
| 51 | 1.0% | 2.5% | 1.6% | 4.1% |
| 52 | 3.2% | 4.5% | 1.7% | 7.1% |
| 1 | 2.8% | 3.7% | 1.7% | 5.2% |
| 2 | 1.8% | 3.0% | 1.1% | 4.5% |
| 3 | 1.1% | 2.5% | 1.3% | 3.6% |
| 4 | 1.3% | 2.4% | 1.7% | 3.5% |
| 5 | 1.4% | 2.7% | 2.0% | 4.4% |
| 6 | 0.9% | 2.7% | 2.1% | 3.3% |
| 7 | 0.8% | 2.4% | 1.7% | 3.0% |
| 8 | 0.9% | 2.3% | 1.9% | 2.7% |
| 9 | 1.0% | 2.2% | 1.8% | 2.7% |
| 10 | 1.1% | 2.1% | 1.8% | 2.7% |
| 11 | 0.5% | 2.1% | 1.7% | 2.7% |
| 12 | 1.1% | 1.8% | 1.1% | 2.7% |
| 13 | 1.2% | 1.7% | 1.2% | 2.6% |
| 14 | 1.1% | 1.8% | 1.3% | 2.4% |
Participatory Syndromic Surveillance
In week 14, 2,074 participants reported to FluWatchers, of which 48 (2.3%) reported symptoms of cough and fever (Figure 5).
Among the 48 participants who reported fever and cough:
- 25% consulted a healthcare professional;
- 83% reported days missed from work or school, resulting in a combined total of 111 missed days of work or school.
Figure 5 - Percentage of participants reporting cough and fever, Canada, weeks 2018-40 to 2019-14
Number of Participants Reporting in Week 14: 2,074
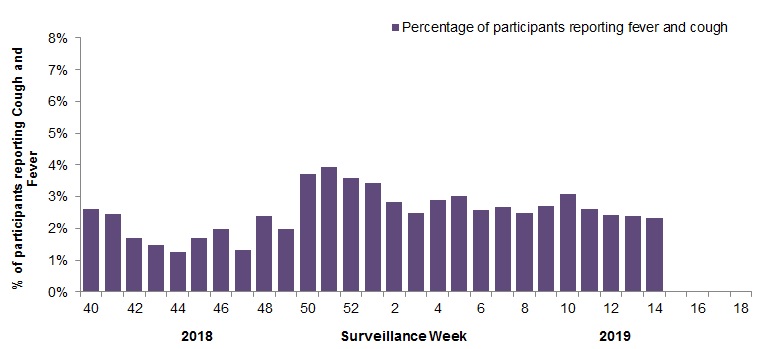
Figure 5 - Text equivalent
| Surveillance Week | % cough and fever |
|---|---|
| 40 | 2.6% |
| 41 | 2.5% |
| 42 | 1.7% |
| 43 | 1.5% |
| 44 | 1.3% |
| 45 | 1.7% |
| 46 | 2.0% |
| 47 | 1.3% |
| 48 | 2.4% |
| 49 | 2.0% |
| 50 | 3.7% |
| 51 | 3.9% |
| 52 | 3.6% |
| 1 | 3.4% |
| 2 | 2.8% |
| 3 | 2.5% |
| 4 | 2.9% |
| 5 | 3.0% |
| 6 | 2.6% |
| 7 | 2.7% |
| 8 | 2.5% |
| 9 | 2.7% |
| 10 | 3.1% |
| 11 | 2.6% |
| 12 | 2.4% |
| 13 | 2.4% |
| 14 | 2.3% |
Influenza Outbreak Surveillance
In week 14, 18 new laboratory-confirmed influenza outbreaks were reported: long-term care facilities (LTCF) (13), acute care facilities (2) and other settings (3). Five new ILI outbreaks (LTCF (1), schools and daycares (3) and other settings (1)) were also reported in week 14. Among the outbreaks with available subtype information (6), all were associated with influenza A(H3N2).
To date this season, 706 laboratory-confirmed influenza outbreaks have been reported (Figure 6):
- 417 (59%) outbreaks were in LTCF, 30 were in schools and daycares, 105 in acute care facilities, and 154 were in other settings.
- Among the 633 outbreaks for which the influenza type was available, 97% (616) were associated with influenza A.
- Among the 271 outbreaks for which the influenza A subtype was available, 52% (141) were associated with influenza A(H3N2);
To date this season, 145 ILI outbreaks have been reported; 81 occurred in LTCF, 59 in schools, one in other settings and four in acute care facilities.
Figure 6 – Number of new outbreaks of laboratory-confirmed influenza by report week, Canada, weeks 2018-35 to 2019-14
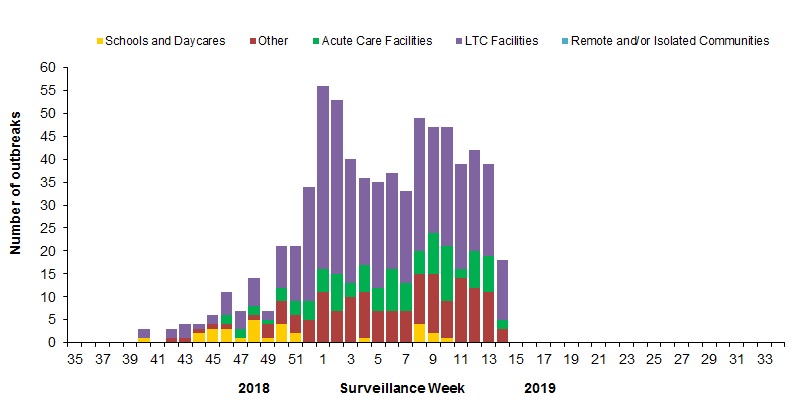
Figure 6 - Text equivalent
| Surveillance Week | Acute Care Facilities | Long Term Care Facilities | Other | Schools and Daycares | Remote and/or Isolated Communities |
|---|---|---|---|---|---|
| 35 | 0 | 0 | 0 | 0 | 0 |
| 36 | 0 | 0 | 0 | 0 | 0 |
| 37 | 0 | 0 | 0 | 0 | 0 |
| 38 | 0 | 0 | 0 | 0 | 0 |
| 39 | 0 | 0 | 0 | 0 | 0 |
| 40 | 0 | 2 | 0 | 1 | 0 |
| 41 | 0 | 0 | 0 | 0 | 0 |
| 42 | 0 | 2 | 1 | 0 | 0 |
| 43 | 0 | 3 | 1 | 0 | 0 |
| 44 | 0 | 1 | 1 | 2 | 0 |
| 45 | 0 | 2 | 1 | 3 | 0 |
| 46 | 2 | 5 | 1 | 3 | 0 |
| 47 | 2 | 4 | 0 | 1 | 0 |
| 48 | 2 | 6 | 1 | 5 | 0 |
| 49 | 1 | 2 | 3 | 1 | 0 |
| 50 | 3 | 9 | 5 | 4 | 0 |
| 51 | 3 | 12 | 4 | 2 | 0 |
| 52 | 4 | 25 | 5 | 0 | 0 |
| 1 | 5 | 40 | 11 | 0 | 0 |
| 2 | 8 | 38 | 7 | 0 | 0 |
| 3 | 3 | 27 | 10 | 0 | 0 |
| 4 | 6 | 19 | 10 | 1 | 0 |
| 5 | 5 | 23 | 7 | 0 | 0 |
| 6 | 9 | 21 | 7 | 0 | 0 |
| 7 | 6 | 20 | 7 | 0 | 0 |
| 8 | 5 | 29 | 11 | 4 | 0 |
| 9 | 9 | 23 | 13 | 2 | 0 |
| 10 | 12 | 26 | 8 | 1 | 0 |
| 11 | 2 | 23 | 14 | 0 | 0 |
| 12 | 8 | 22 | 12 | 0 | 0 |
| 13 | 8 | 20 | 11 | 0 | 0 |
| 14 | 2 | 13 | 3 | 0 | 0 |
Severe Outcomes Influenza Surveillance
Provincial/Territorial Influenza Hospitalizations and Deaths
To date this season, 2,845 influenza-associated hospitalizations have been reported by participating provinces and territoriesFootnote 1.
Hospitalizations (Table 2):
- 98.4% (2,798) were associated with influenza A
- Among the 1,643 cases for which the influenza subtype was available, 1,387 (84%) were associated with A(H1N1)pdm09.
- The highest estimated rate of hospitalization is among adults over 65 years of age.
Intensive Care Unit (ICU) cases and deaths:
- To date this season 508 ICU admissions and 147 deaths have been reported.
- 42% (212) of reported ICU admissions were in adults aged 45-64 years.
- All but five ICU admissions were associated with influenza A.
- All but one of the deaths were associated with influenza A.
| Age Groups (years) | Cumulative (August 26, 2018 to April 6, 2019) | ||
|---|---|---|---|
| Influenza A | Influenza B | Rate per 100,000 population | |
| 0-4 | 378 | 17 | 82.99 |
| 5-19 | 225 | 15 | 17.30 |
| 20-44 | 338 | 5 | 12.06 |
| 45-64 | 732 | 4 | 33.82 |
| 65+ | 1125 | 6 | 92.96 |
| Total | 2798 | 47 | |
| % | 98.3% | 1.7% | |
|
|||
Pediatric Influenza Hospitalizations and Deaths
In week 14, 31 pediatric (≤16 years of age) hospitalizations with influenza have been reported by the Immunization Monitoring Program Active (IMPACT) network (Figure 7). Of the 31 hospitalizations, 21 (68%) were due to influenza A.
To date this season, 1,147 pediatric hospitalizations have been reported (Figure 8):
- 67% of cases were in children under 5 years of age.
- 96% (1,098) of cases have been associated with influenza A.
- Among the 335 cases for which the influenza subtype was available, 290 (87%) were associated with A(H1N1)pdm09.
To date this season, 203 ICU admissions, and 10 deaths have been reported.
- 60% (122) of ICU admissions were in children under 5 years of age.
- All but six of the ICU admissions have been associated with influenza A.
- 80% (8) of deaths occurred in children 2 to 4 years of age.
- All deaths have been associated with influenza A.
Figure 7 – Number of pediatric (≤16 years of age) hospitalizations reported by the IMPACT network, by week, Canada, weeks 2018-35 to 2019-14
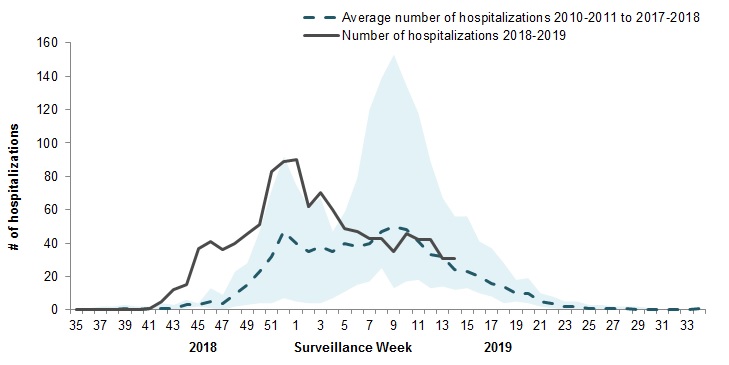
The shaded area represents the maximum and minimum number of cases reported by week from seasons 2010-11 to 2017-18
Figure 7 - Text equivalent
| Surveillance week | 2018-19 | Average | Min | Max |
|---|---|---|---|---|
| 35 | 0 | 0 | 0 | 0 |
| 36 | 0 | 0 | 0 | 1 |
| 37 | 0 | 0 | 0 | 2 |
| 38 | 0 | 0 | 0 | 2 |
| 39 | 0 | 1 | 0 | 3 |
| 40 | 0 | 0 | 0 | 2 |
| 41 | 1 | 1 | 0 | 2 |
| 42 | 5 | 1 | 0 | 4 |
| 43 | 12 | 1 | 0 | 3 |
| 44 | 15 | 3 | 1 | 6 |
| 45 | 37 | 3 | 2 | 4 |
| 46 | 41 | 5 | 1 | 13 |
| 47 | 36 | 4 | 0 | 9 |
| 48 | 40 | 9 | 2 | 23 |
| 49 | 46 | 15 | 3 | 28 |
| 50 | 51 | 23 | 4 | 47 |
| 51 | 83 | 32 | 4 | 72 |
| 52 | 89 | 47 | 7 | 92 |
| 1 | 90 | 40 | 5 | 75 |
| 2 | 62 | 35 | 4 | 62 |
| 3 | 70 | 38 | 4 | 67 |
| 4 | 60 | 35 | 7 | 47 |
| 5 | 49 | 40 | 11 | 59 |
| 6 | 47 | 38 | 15 | 79 |
| 7 | 43 | 40 | 17 | 120 |
| 8 | 43 | 47 | 25 | 139 |
| 9 | 35 | 50 | 13 | 153 |
| 10 | 46 | 48 | 17 | 135 |
| 11 | 42 | 41 | 18 | 118 |
| 12 | 42 | 33 | 13 | 89 |
| 13 | 31 | 32 | 14 | 67 |
| 14 | 31 | 24 | 12 | 56 |
Figure 8 - Cumulative numbers of pediatric hospitalizations (≤16 years of age) with influenza by age-group reported by the IMPACT network, Canada, weeks 2018-35 to 2019-14
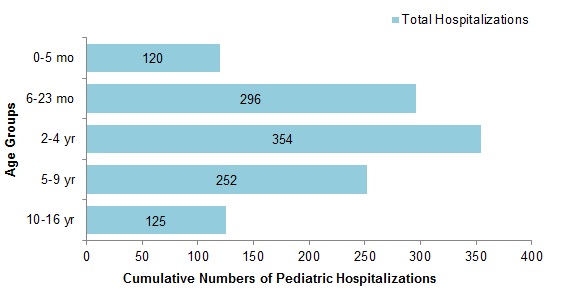
Figure 8 - Text equivalent
| Age Group | Total |
|---|---|
| 0-5 mo | 120 |
| 6-23 mo | 296 |
| 2-4 yr | 354 |
| 5-9 yr | 252 |
| 10-16 yr | 125 |
Adult Influenza Hospitalizations and Deaths
Surveillance of laboratory-confirmed influenza-associated adult (≥16 years of age) hospitalizations by the Canadian Immunization Research Network (CIRN) Serious Outcomes Surveillance (SOS) network began on November 1st for the 2018-19 season.
To date this season, 847 hospitalizations, 103 ICU admissions and 46 deaths have been reported (Figure 9):
- 790 (93%) hospitalizations were associated with influenza A.
- A greater proportion of hospitalizations have been reported among adults ≥65 years of age (59%) compared to adults <65 years of age (41%).
- Among the 182 cases for which the influenza subtype was available, 106 (58%) were associated with A(H1N1)pdm09.
- 88% of hospitalized cases reported more than one type of comorbid condition.
- The most commonly reported comorbidity was endocrine disorders, which were reported in 95% of hospitalized cases.
Figure 9 - Cumulative numbers of adult hospitalizations (>20 years of age) with influenza by age-group reported by CIRN, Canada, 2018-19, weeks 2018-44 to 2019-14
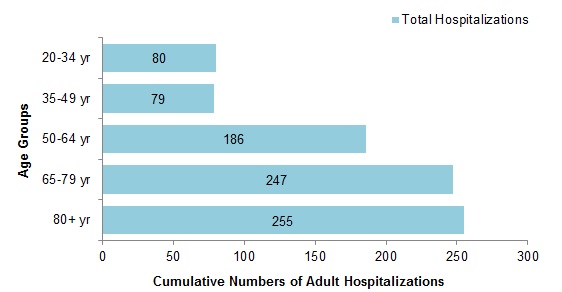
Figure 9 - Text equivalent
| Age Group | Total |
|---|---|
| 20-34 yr | 80 |
| 35-49 yr | 79 |
| 50-64 yr | 186 |
| 65-79 yr | 247 |
| 80+ yr | 255 |
Influenza Strain Characterizations
Since September 1, 2018, the National Microbiology Laboratory (NML) has characterized 1,904 influenza viruses (314 A(H3N2), 1,523 A(H1N1) and 67 B) that were received from Canadian laboratories.
Genetic Characterization of Influenza A(H3N2):
155 influenza A(H3N2) viruses did not grow to sufficient hemagglutination titer for antigenic characterization by hemagglutination inhibition (HI) assay. Therefore, NML has performed genetic characterization to determine the genetic group identity of these viruses.
Sequence analysis of the HA gene of the viruses showed that:
- 20 viruses belonged to genetic group 3C.2a.
- 131 viruses belonged to subclade 3C.2a1.
- Three viruses belonged to 3C.3a.
- One isolate could not be sequenced.
A/Singapore/INFIMH-16-0019/2016-like virus belongs to genetic group 3C.2a1 and is the influenza A(H3N2) component of the 2018-19 Northern Hemisphere influenza vaccine.
Antigenic Characterization:
Influenza A (H3N2):
- 103 influenza A(H3N2) viruses were antigenically characterized as A/Singapore/INFIMH-16-0019/2016-like by HI testing using antiserum raised against egg-propagated A/Singapore/INFIMH-16-0019/2016.
- 53 viruses showed reduced titer with ferret antisera raised against egg-propagated A/Singapore/INFIMH-16-0019/2016.
- A/Singapore/INFIMH-16-0019/2016-like virus is the influenza A(H3N2) component of the 2018-19 Northern Hemisphere influenza vaccine.
- 67 influenza A(H3N2) viruses characterized belonged to genetic group 3C.2a1. 17 viruses belonged to genetic group 3C.2a and 29 to 3C.3a. Sequencing is pending for the remaining isolates.
Influenza A(H1N1):
- 1,480 A(H1N1) viruses characterized were antigenically similar to A/Michigan/45/2015, which is the influenza A(H1N1) component of the 2018-19 Northern Hemisphere influenza vaccine.
- 43 viruses showed reduced titer with ferret antisera raised against cell culture-propagated A/Michigan/45/2015
Influenza B:
Influenza B viruses can be divided into two antigenically distinct lineages represented by B/Yamagata/16/88 and B/Victoria/2/87 viruses. The recommended influenza B components for the 2018-19 Northern Hemisphere influenza vaccine are B/Colorado/06/2017 (Victoria lineage) and B/Phuket/3073/2013 (Yamagata lineage).
- 16 influenza B viruses were characterized as B/Colorado/06/2017, which belong to the Victoria lineage and are included as an influenza B component of the 2018-19 Northern Hemisphere influenza vaccine.
- 28 viruses showed reduced titer with ferret antisera raised against cell culture-propagated B/Colorado/06/2017.
- 23 influenza B viruses were characterized as B/Phuket/3073/2013-like, which belongs to the Yamagata lineage and is included as an influenza B component of the 2018-19 Northern Hemisphere quadrivalent influenza vaccine.
Antiviral Resistance
Antiviral Resistance – Amantadine:
416 influenza A (73 A(H3N2) and 343 A(H1N1)) viruses were tested for resistance to amantadine and it was found that:
- All 416 influenza A viruses were resistant to amantadine.
Antiviral Resistance – Oseltamivir:
1,096 influenza viruses (112 A(H3N2), 933 A(H1N1) and 51 B) were tested for resistance to oseltamivir and it was found that:
- All 112 A(H3N2) viruses were sensitive to oseltamivir.
- Of the 933 A(H1N1) viruses tested, 929 were sensitive to oseltamivir and four viruses were resistant to oseltamivir with a H275Y mutation.
- All 51 B viruses were sensitive to oseltamivir.
Antiviral Resistance – Zanamivir:
1,095 influenza viruses (112 A(H3N2), 932 H1N1 and 51 B) were tested for resistance to zanamivir and it was found that:
- All 1,095 influenza viruses were sensitive to zanamivir.
Vaccine Monitoring
Vaccine monitoring refers to activities related to the monitoring of influenza vaccine coverage and effectiveness.
Vaccine Coverage
The Seasonal Influenza Immunization Coverage Survey is an annual telephone survey conducted between January and February that collects information related to the influenza vaccine in Canada. This survey measures vaccine coverage, which is the percentage of people who received the annual seasonal influenza vaccine in a specific influenza season.
In the 2018-19 influenza season, coverage was:
- 34% among adults aged 18 to 64 years.
- 31% among adults aged 18-64 wihout chronic diseases.
- 43% among adults aged 18 to 64 years with chronic diseases.
- 70% among seniors (aged 65 years and older).
| Age group (years) | Male | Female | Combined | |||
|---|---|---|---|---|---|---|
| Total | Vaccine Coverage (%) | Total | Vaccine Coverage (%) | Total | Vaccine Coverage (%) | |
| All adults (≥18) | 1568 | 36.6 | 2150 | 46.8 | 3726 | 41.8 |
| 18-64 | 1252 | 28.6 | 1640 | 39.9 | 2898 | 34.3 |
| without chronic diseases |
948 | 25.8 | 1171 | 36.1 | 2124 | 30.8 |
| with chronic diseases |
304 | 36.3 | 465 | 48.5 | 770 | 42.8 |
| ≥65 | 316 | 69.0 | 510 | 70.9 | 828 | 69.9 |
|
||||||
Vaccine Effectiveness
Vaccine effectiveness is a measure of how well the influenza vaccine is able to prevent influenza illness. Throughout the season, surveillance networks monitor how well the influenza vaccine is working in the current season. Estimates can vary depending on several factors such as the study methods; the population, setting and outcomes that are being studied; the type and mix of vaccine products; the stage of the season and the kinds of influenza viruses that are circulating when the study is conducted.
Given an atypical late-season wave of influenza A(H3N2), the community-based Canadian Sentinel Practitioner Surveillance Network (SPSN) has undertaken an additional interim analysis to assess effectiveness of the 2018/19 influenza vaccine against A(H3N2) illness. The Canadian SPSN includes participation by sentinel practitioners in the four most populous provinces of Canada: Alberta, British Columbia, Ontario and Quebec. Vaccine effectiveness (VE) monitoring methods are as described in prior publications, available at the SPSN website alongside historic and current VE findings.
Based on data collected as of March 30th, 2019 including more than 2800 participants, the 2018/19 northern hemisphere vaccine has provided little or no protection against medically-attended outpatient A(H3N2) illness (VE of 23%; 95% CI: -9 to 46), including among working age adults 20-64 years old who comprise the majority of SPSN participants (VE of -16%; 95% CI: -76 to 23). Consistent with expected patterns, VE estimates for this delayed A(H3N2) wave are considerably lower than reported earlier by the SPSN for the primary A(H1N1)pmd09 epidemic based on data collected as of January 12th, 2019. In that mid-season analysis, VE against A(H1N1)pdm09 was 72% (95% CI: 60 to 81) overall, with substantial protection observed in all age groups. In the most recent analysis spanning March 30th, estimates against A(H1N1)pmd09 have remained stable at approximately 70%. The SPSN continues to monitor and will further update VE estimates at end of season.