
Hepatitis C in Canada: 1991-2012

Download this article as a PDF (740 KB - 8 pages)
Published by: The Public Health Agency of Canada
Issue: Volume 40-19: Hepatitis C
Date published: December 18, 2014
ISSN: 1481-8531
Submit a manuscript
About CCDR
Browse
Volume 40-19, December 18, 2014: Hepatitis C
Surveillance
Hepatitis C surveillance in Canada
Payne E1, Totten S1, Archibald C1
Affiliation
1 Centre for Communicable Diseases and Infection Control, Public Health Agency of Canada, Ottawa, ON
Correspondence
DOI
https://doi.org/10.14745/ccdr.v40i19a01
Abstract
Background: Hepatitis C is a highly transmissible virus that can lead to chronic liver disease. It continues to be a major public health concern in Canada.
Objective: To describe surveillance trends of reported cases of Hepatitis C virus (HCV) in Canada by age and sex from 1991-2012.
Methods: Cases of HCV reported to the Canadian Notifiable Disease Surveillance System were compiled at the national level. As most reported cases are not differentiated by acute or chronic HCV infection status, presented results are based on total HCV cases. Time trends are provided from 1991-2012, with a more detailed examination of age and sex patterns from 2005-2012.
Results: The rate of reported HCV infection increased sharply from 1991 (the year it was first notifiable) until 1998, when the highest overall rate of 66.9 per 100,000 was observed. From that time until 2012, rates of reported cases decreased in both sexes, but remained consistently higher among males than females. In 2012, the overall rate of reported HCV infection was 29.3 per 100,000. In younger age groups, rates among females were marginally higher, while males in older age groups (30 and above) exhibited substantially higher rates.
Conclusion: This surveillance summary presents the longer-term trends in reported cases and corresponding rates of HCV in Canada using national surveillance data. Canada continues to experience a downward trend in HCV rates; however, the burden of infection will continue to increase as chronically infected individuals develop severe illness.
Introduction
Hepatitis C is a highly transmissible virus, spread through contact with infected blood. Hepatitis C infection can lead to chronic liver disease and affects approximately 3% of the world's population Footnote 1. Globally, approximately 130-150 million individuals have a chronic Hepatitis C virus (HCV) infection and 350,000 to 500,000 people die annually from HCV-related illnesses Footnote 2. The seroprevalence of anti-HCV among the general public in Canada was recently estimated by the Community Health Measures Survey as 0.5% Footnote 3, while mathematical and epidemiologic models incorporating data from high-risk populations have estimated the seroprevalence of anti-HCV to be approximately 0.96% Footnote 4. In 2011, acute HCV infection was reported as the underlying cause of 35 deaths in Canada and chronic HCV infection as the underlying cause of 346 deaths Footnote 5. This may be an underestimate as deaths attributable to chronic HCV may have been coded as more proximal causes such as hepatocellular carcinoma or cirrhosis.
HCV was first identified in 1989, facilitating the development of HCV antibody and nucleic acid amplification screening methods that were implemented for screening the blood supply in Canada in 1990. Prior to this discovery, thousands of individuals were infected with HCV after receiving transfusions of blood components or products. The introduction of universal blood supply screening significantly improved the quality of Canada's blood supply and virtually eliminated this transmission risk Footnote 6.
However, certain populations continue to be at elevated risk for Hepatitis C infection. Transmission of HCV among people who inject drugs is now the most significant contributor to overall HCV rates; the majority of recent HCV infections in Canada occurred through the sharing of drug preparation and injection materialsFootnote 7.
Less common routes of HCV transmission include contact with infected blood through sharing of sharp instruments, personal hygiene equipment (e.g., razors, toothbrushes, scissors and nail clippers) and vertical transmission from mother to child Footnote 8,Footnote 9. While sexual transmission of HCV is uncommon, this mode of transmission has been observed among HIV-infected MSM Footnote 10.
HCV continues to be a major public health concern and was ranked first among 51 pathogens for its relative contribution to the overall burden of infectious diseases in Ontario Footnote 11. Hepatitis C is not preventable by vaccine and although some individuals will spontaneously clear and recover from their infection, up to 85% will progress to chronic infection with potentially life-threatening consequences Footnote 12. The health care burden presented by existing cases that progress to more serious sequelae continues to escalate.
The objective of this analysis was to describe trends in Hepatitis C cases reported to the Canadian Notifiable Disease Surveillance System (CNDSS) from 1991-2012, with a more detailed review of patterns by age and sex from 2005-2012.
Methods
Data sources
Data on HCV cases are reported to the CNDSS by provincial and territorial ministries of health, which in turn obtain data from local and regional health authorities. HCV infection has been nationally notifiable since 1991. Surveillance of Hepatitis C cases was phased in over time by provinces and territories, with all jurisdictions reporting cases by 1999. Nunavut data from 2007-2012 were not available for this analysis.
The HCV case definition used for national surveillance has evolved since 1991 Footnote 13, with revisions in 1999 Footnote 14, 2008 Footnote 15 and 2011 (Unpublished update 2011. Public Health Agency of Canada. Case definitions for communicable diseases under national surveillance). Most provinces and territories confirm cases using HCV antibody testing and do not currently distinguish reported HCV cases by infection status. Therefore, acute and chronic HCV cases were combined for analysis purposes.
Analysis
Descriptive analysis of HCV infection by year, age group and sex was conducted using data reported to the CNDSS. Analyses included all Hepatitis C cases reported to the CNDSS and rates are given per 100,000 population. Because Hepatitis C was not reported by all provinces and territories during some time periods, national rates for each year were calculated with denominators adjusted to include only those jurisdictions with available data. Demographic patterns in age and sex were examined in HCV cases reported for 2012 to provide a more detailed snapshot of the most recent available data.
Population data for the calculation of rates were obtained from Statistics CanadaFootnote 16. The following estimates were used: for 2005, final intercensal estimates; for 2006, final postcensal estimates; for 2007-2010, final intercensal estimates; for 2011, final postcensal estimates; and for 2012, updated postcensal estimates. Rates, percentages and percent change in rates were calculated using unrounded numbers, and therefore presented results may differ compared to calculations based on rounded numbers. As population denominator data has been updated, rates reported may differ from previous reports.
Results
Long-term trends (1991-2012)
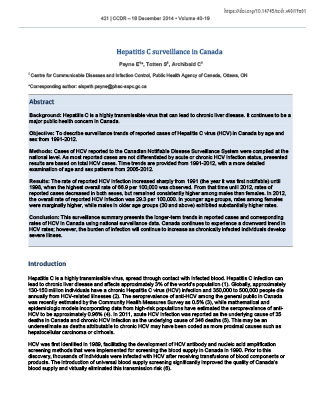
Between 1991 and 1998, there was an overall increase in the rate of reported Hepatitis C cases. In 1991 there were 912 reported cases, corresponding to a rate of 5.2 per 100,000. By 1998, this rate had increased by over 1000%, to a rate of 66.9 per 100,000 and 19,379 cases. Throughout this time period, rates of reported cases of Hepatitis C were consistently higher among males than females (Figure 1).
From 1998-2012, the rate of reported cases of Hepatitis C decreased steadily among both males and females. In 2012, a total of 10,180 cases of Hepatitis C were reported, corresponding to a rate of 29.3 per 100,000 and a 56.2% decrease from 1998. Although the rates of reported cases of Hepatitis C were consistently higher among males than females over this time frame, the gap between the sexes narrowed over time. Among males, rates decreased by 58.6%, from 88.9 to 36.8 per 100,000; among females, rates decreased by 52.3%, from 45.0 to 21.5 per 100,000 (Figure 1).
Figure 1: Rates of reported cases of Hepatitis C in CanadaFigure 1 Footnote 1 by sex, CNDSSFigure 1 Footnote 2, 1991-2012
- Figure 1 Footnote 1
-
Includes PEI, ON, SK, AB, BC 1991-2012; NL, NB, NT 1993-2012; YT 1994-2012; NS, QC 1996-2012; MB 1999-2012; NU 1999-2006. For rate calculation, population denominators were adjusted to include only those jurisdictions for which data were available in a given year.
- Figure 1 Footnote 2
-
CNDSS = Canadian Notifiable Disease Surveillance System
Text Equivalent - Figure 1
| Year | TOTAL rate per 100,000 | MALE rate per 100,000 | FEMALE rate per 100,000 |
|---|---|---|---|
| 1991 | 5.2 | 6.4 | 3.9 |
| 1992 | 15.6 | 20.2 | 10.9 |
| 1993 | 20.8 | 27.3 | 13.9 |
| 1994 | 32.0 | 41.3 | 22.2 |
| 1995 | 64.5 | 83.9 | 44.4 |
| 1996 | 53.6 | 68.6 | 38.1 |
| 1997 | 60.9 | 79.0 | 42.5 |
| 1998 | 66.9 | 88.9 | 45.0 |
| 1999 | 62.7 | 81.8 | 42.9 |
| 2000 | 57.8 | 73.7 | 38.3 |
| 2001 | 54.3 | 71.5 | 36.2 |
| 2002 | 50.9 | 67.2 | 34.5 |
| 2003 | 46.8 | 61.1 | 32.3 |
| 2004 | 45.2 | 59.0 | 30.9 |
| 2005 | 40.3 | 53.1 | 27.5 |
| 2006 | 36.9 | 48.1 | 25.5 |
| 2007 | 36.6 | 46.2 | 26.2 |
| 2008 | 35.8 | 45.7 | 25.5 |
| 2009 | 33.3 | 42.7 | 23.3 |
| 2010 | 31.1 | 40.2 | 21.6 |
| 2011 | 28.9 | 36.8 | 20.7 |
| 2012 | 29.3 | 36.8 | 21.5 |
Recent trends by age group and sex (2005-2012)
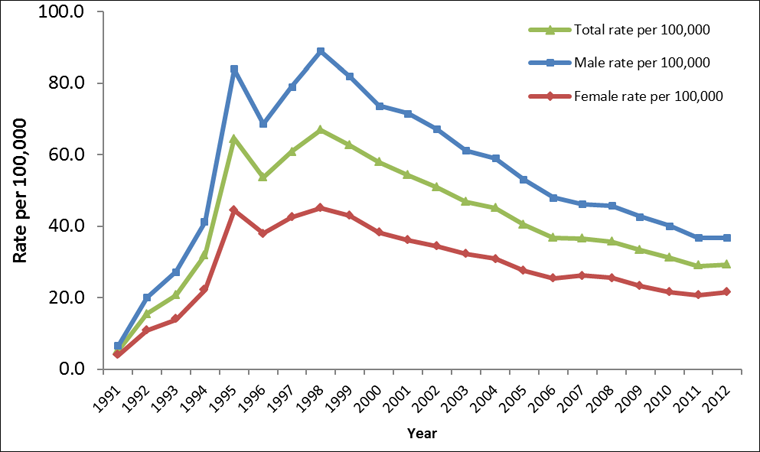
Between 2005 and 2012, males of all age groups experienced rate decreases, with the exception of those aged 60 and over who experienced a slight rate increase from 21.8 to 26.3 per 100,000. In males less than 15 years of age, HCV rates were less than 1.0 per 100,000 for all years. In 2005, males aged 40 to 59 years had the highest rate of reported acute HCV infection at 101.0 per 100,000. By 2012, this rate had decreased to 64.4 per 100,000. A large rate decrease was also observed among males aged 30 to 39; from 2005-2012 rates of HCV infection decreased from 83.9 to 51.7 per 100,000 (Figure 2).
Figure 2: Rates of reported cases of Hepatitis C in males in CanadaFigure 2 Footnote 1 by age group, CNDSSFigure 2 Footnote 2, 2005-2012
- Figure 2 Footnote 1
-
Hepatitis C data were not available for NU from 2007-2012 at the time of analysis. The population has been removed from the denominator for rate calculation.
- Figure 2 Footnote 2
-
CNDSS = Canadian Notifiable Disease Surveillance System
Text Equivalent - Figure 2
| Age group (years) | |||||||
|---|---|---|---|---|---|---|---|
| Year | 10-14 | 15-19 | 20-24 | 25-29 | 30-39 | 40-59 | 60+ |
| 2005 | 0.6 | 6.8 | 33.2 | 56.7 | 83.9 | 101.0 | 21.8 |
| 2006 | 0.7 | 5.8 | 28.7 | 50.8 | 72.7 | 93.0 | 20.8 |
| 2007 | 0.3 | 6.7 | 29.0 | 50.6 | 68.0 | 88.1 | 22.2 |
| 2008 | 0.8 | 5.8 | 30.8 | 51.1 | 62.0 | 88.7 | 22.3 |
| 2009 | 0.5 | 5.0 | 27.8 | 50.2 | 61.1 | 81.5 | 20.4 |
| 2010 | 0.6 | 5.8 | 26.8 | 42.1 | 55.1 | 76.9 | 22.8 |
| 2011 | 0.3 | 6.0 | 23.8 | 42.6 | 50.7 | 67.2 | 24.6 |
| 2012 | 0.2 | 5.7 | 30.8 | 41.5 | 51.7 | 64.4 | 26.3 |
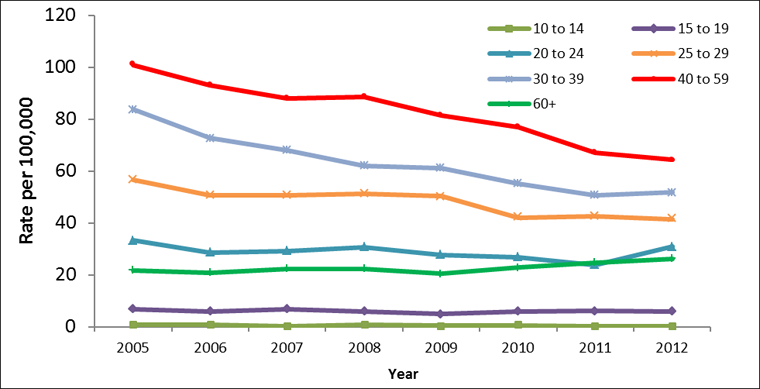
During the same time period, rate decreases were observed among females, with the exception of those in the 25 to 29 age group who experienced a rate increase from 35.6 to 38.2 per 100,000. The greatest rate decrease was observed among females between 10 and 14 years, from 1.2 to 0.3 per 100,000, though is largely reflective of the small HCV counts in this age group and the resulting instability in rates. Excluding females in the 10 to 14 age group, the largest rate decrease was noted among females aged 30 to 39, from 45.6 to 32.3 per 100,000 (Figure 3).
Figure 3: Rates of reported cases of Hepatitis C in females in CanadaFigure 3 Footnote 1 by age group, CNDSSFigure 3 Footnote 2, 2005-2012
- Figure 3 Footnote 1
-
Hepatitis C were not available for NU from 2007-2012 at the time of analysis. The population has been removed from the denominator for rate calculation.
- Figure 3 Footnote 2
-
CNDSS = Canadian Notifiable Disease Surveillance System
Text Equivalent - Figure 3
| Age group (years) | |||||||
|---|---|---|---|---|---|---|---|
| Year | 10-14 | 15-19 | 20-24 | 25-29 | 30-39 | 40-59 | 60+ |
| 2005 | 1.2 | 13.4 | 36.6 | 35.6 | 45.6 | 40.7 | 15.9 |
| 2006 | 0.6 | 12.1 | 30.4 | 40.8 | 39.4 | 38.1 | 14.7 |
| 2007 | 0.5 | 11.8 | 31.4 | 39.7 | 40.0 | 40.7 | 14.2 |
| 2008 | 0.9 | 12.9 | 33.7 | 38.1 | 40.5 | 37.7 | 14.6 |
| 2009 | 0.7 | 13.0 | 29.9 | 36.1 | 35.1 | 35.3 | 13.0 |
| 2010 | 0.5 | 9.1 | 29.4 | 33.5 | 32.1 | 33.1 | 12.0 |
| 2011 | 0.6 | 7.9 | 27.1 | 32.0 | 31.0 | 31.4 | 12.5 |
| 2012 | 0.3 | 10.0 | 33.0 | 38.2 | 32.3 | 29.9 | 12.7 |
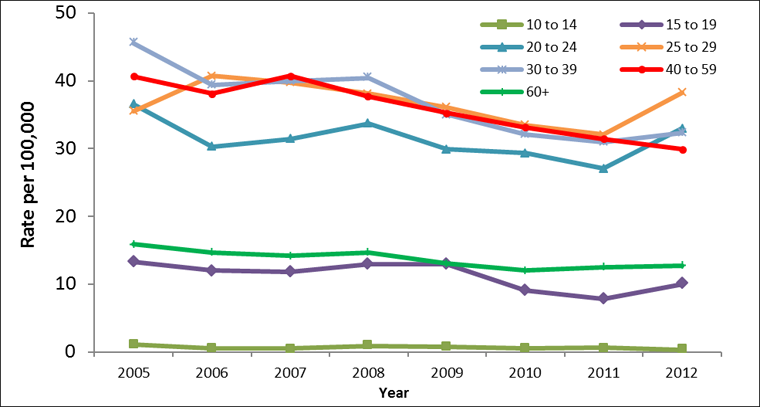
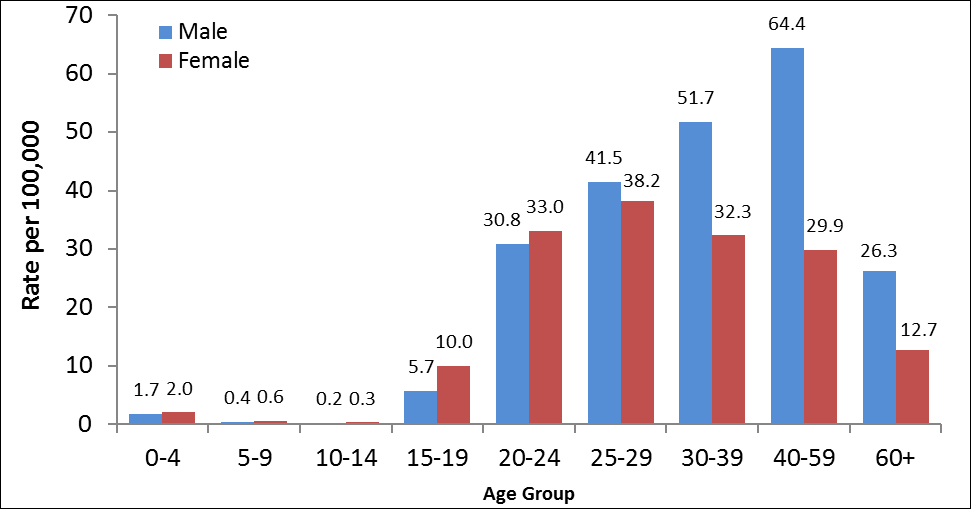
In 2012, the highest rate of Hepatitis C was observed among males in the 40 to 59 age group, followed by males in the 30 to 39 age group (Figure 4). For both sexes, rates were higher among those over 19 years of age. Differences in rates between males and females were more pronounced in older age groups (30 and above) with males exhibiting substantially higher rates.
Figure 4: Rates of reported cases of Hepatitis C in CanadaFigure 4 Footnote 1 by age group and sex, CNDSSFigure 4 Footnote 2, 2012
- Figure 4 Footnote 1
-
2012 Hepatitis C data were not available for NU at the time of analysis and this population has been removed for rate calculation.
- Figure 4 Footnote 2
-
CNDSS = Canadian Notifiable Disease Surveillance System
Text Equivalent - Figure 4
| Age group (years) | |||||||||
|---|---|---|---|---|---|---|---|---|---|
| Sex | 0-4 | 5-9 | 10-14 | 15-19 | 20-24 | 25-29 | 30-39 | 40-59 | 60+ |
| Male | 1.7 | 0.4 | 0.2 | 5.7 | 30.8 | 41.5 | 51.7 | 64.4 | 26.3 |
| Female | 2.0 | 0.6 | 0.3 | 10.0 | 33.0 | 38.2 | 32.3 | 29.9 | 12.7 |
Discussion
This analysis provides the most up-to-date data currently available on reported cases and corresponding rates of HCV in Canada.
From 1991 to 1998, the rate of reported cases of Hepatitis C in Canada increased steadily as those infected through the blood supply were identified by look-back and trace-back procedures Footnote 17. Growing awareness of HCV transmission risk in light of the national inquiry conducted by the Krever Commission Footnote 18 and related media reports may have also impacted HCV testing rates, thus contributing to a rise in case reports over this time period. The implementation of HCV surveillance by provinces and territories across Canada should not have a significant impact on the increase in rates over this timeframe, as rates were calculated using adjusted denominators.
Since 1998, the rates of reported cases of HCV have declined by 56.2%, although certain populations continue to be at risk. Among newly acquired HCV cases with known risk factor information, 61% had reported a history of injection drug useFootnote 19. I-Track, the national behavioural and biological surveillance system that monitors HIV and Hepatitis C and associated risk behaviours among people who inject drugs in Canada, found the lifetime exposure to Hepatitis C (as measured by the presence of HCV antibody in a dried blood spot specimen) was 68% in Phase 3 of data collection conducted from 2010-2012 Footnote 20. In Phase 3 of I-Track, 68.2% of participants were maleFootnote 20, indicating that a greater proportion of those who use injection drugs are male and potentially explaining why males continue to represent a larger proportion of reported HCV cases. However, differences in male and female rates of reported HCV have narrowed since 2005; females are more likely to be assisted with drug injection or be in sexual partnerships that are reliant on drug exchange and are at a higher risk for sharing drug-use equipmentFootnote 21. Changing rates among males and females may also be a reflection of different serologic testing behaviours. Females are more likely to seek health care and be testedFootnote 22, leading to increasing reported rates of HCV detection.
An additional source of HCV cases may be immigration to Canada from countries where Hepatitis C infections are endemic, particularly from those regions where universal precautions to prevent the transmission of bloodborne infections are not routinely implemented Footnote 23. Household, vertical and sexual transmissions are less common in Canada and unlikely to contribute a significant number of cases to the national total.
An analysis of cohort effects among reported cases of HCV found that those born between 1946 and 1965 contributed more than half of all HCV cases reported between 1991 and 2010 in Canada Footnote 24. While the rate of reported cases in Canada appears to be decreasing, the number of individuals infected decades ago that develop sequelae is likely to increase over time as individuals advance to more severe stages of disease progression Footnote 25. In addition, undiagnosed cases represent an unknown future burden of illness Footnote 25.
While no vaccine exists, treatments are available for HCV infection. Previously, treatment was limited to pegylated interferon-α in combination with ribavirin Footnote 26. However, highly effective direct-acting antiviral agents (DAA) have recently been approved by Health Canada Footnote 27,Footnote 28 and more are in clinical development Footnote 29. Over time, increased availability of new treatments and implementation of other public health interventions Footnote 30 may reduce transmission and affect rates of newly reported cases.
Limitations
These findings need to be interpreted in light of several limitations of the data. First, the HCV case definition used for national surveillance and the reporting protocols used by provinces and territories have evolved since 1991, which may have affected case reporting over time. The case definition has consistently allowed confirmatory testing to be conducted using a second manufacturer's enzyme immunoassay (EIA). The lower sensitivity and specificity of first and second generations of these HCV assays have likely resulted in an unknown proportion of false positive HCV cases Footnote 31.
It is uncertain to what extent these data reflect true HCV incidence. Those with acute HCV infection are commonly asymptomatic and thus may not have been tested or diagnosed. According to results from the Community Health Measures Survey, only 30% of Canadian respondents who tested positive for a current HCV infection reported having been diagnosed with HCV Footnote 3. In addition, due to the long duration of infection, it is possible that an individual may be tested and diagnosed in more than one province or territory over time and consequently counted more than once in the CNDSS dataset.
Information on whether reported HCV cases were acute or chronic was not available from most provinces and territories and therefore, findings cannot shed light on potential current trends in transmission or the potential burden of HCV infection in Canada.
Finally, the data are limited to analysis by age and sex. At this time, there are no additional data elements in the CDNSS that could explain observed trends. Consequently, it is not clear what proportion of reported HCV infections are due to transmission through injection drug use or other risk factors.
Conclusion
Following an initial increase in cases during a period of increased screening, Canada continues to have a downward trend in the rate of new reported cases of HCV. Although there are significant limitations, these findings contribute to our understanding of HCV in Canada. Surveillance, supported by research that examines factors affecting observed trends, can contribute to the development of tailored HCV interventions in Canada.
Acknowledgements
The authors would like to acknowledge participation of health care providers, public health officials and laboratories and the provinces and territories involved in the routine reporting of Hepatitis C. We would also like to acknowledge and thank Rachel MacLean for her contribution to Hepatitis C surveillance at the Public Health Agency of Canada.
Conflict of interest
None
Funding
Funding was provided by the Public Health Agency of Canada
References
- Footnote 1
-
Mohd Hanafiah K, Groeger J, Flaxman AD, Wiersma ST. Global epidemiology of Hepatitis C virus infection: new estimates of age-specific antibody to HCV seroprevalence. Hepatology 2013; Apr;57(4):1333-1342.
- Footnote 2
-
World Health Organization. Hepatitis C (Fact sheet no.164). http://www.who.int/mediacentre/factsheets/fs164/en/, 2014.
- Footnote 3
-
Rotermann M, Langlois K, Andonov A, Trubnikov M. Seroprevalence of Hepatitis B and C virus infections: Results from the 2007 to 2009 and 2009 to 2011. Canadian Health Measures Survey. Health Rep 2013; 24(11):3-13.
- Footnote 4
-
Trubnikov M, Yan P, Archibald C. Estimated prevalence of Hepatitis C Virus infection in Canada, 2011. CCDR 2014;40-19; 429-436. .
- Footnote 5
-
Statistics Canada, Canadian Vital Statistics, Death Database. CANSIM Table 102-0521. Deaths, by cause, Chapter I: Certain infectious and parasitic diseases (A00 to B99), age group and sex, Canada. 2014. http://www5.statcan.gc.ca/cansim/a26?lang=eng&retrLang=eng&id=1020521&pattern=death&tabMode=dataTable&srchLan=-1&p1=1&p2=-1.
- Footnote 6
-
O'Brien SF, Yi QL, Fan W, Scalia V, Fearon MA, Allain JP. Current incidence and residual risk of HIV, HBV and HCV at Canadian Blood Services. Vox Sang. 2012; Jul;103(1):83-86.
- Footnote 7
-
Delage G, Infante-Rivard C, Chiavetta JA, Willems B, Pi D, Fast M. Risk factors for acquisition of Hepatitis C virus infection in blood donors: Results of a case-control study. Gastroenterology. 1999; Apr;116(4):893-899.
- Footnote 8
-
Bevilacqua E, Fabris A, Floreano P, Pembrey L, Newell ML, Tovo PA, et al. Genetic factors in mother-to-child transmission of HCV infection. Virology. 2009; Jul 20;390(1):64-70.
- Footnote 9
-
Ngo-Giang-Huong N, Jourdain G, Sirirungsi W, Decker L, Khamduang W, Le Coeur S, et al. Human immunodeficiency virus-Hepatitis C virus co-infection in pregnant women and perinatal transmission to infants in Thailand. Int J Infect Dis. 2010; Jul;14(7):e602-7.
- Footnote 10
-
Myers T, Allman D, Xu K, Remis RS, Aguinaldo J, Burchell A, et al. The prevalence and correlates of Hepatitis C virus (HCV) infection and HCV-HIV co-infection in a community sample of gay and bisexual men. Int J Infect Dis. 2009; Nov;13(6):730-739.
- Footnote 11
-
Kwong J, Crowcroft N, Campitelli M, Ratnasingham S, Daneman N, Deeks S, et al. Ontario Burden of Infectious Disease Study (ONBOIDS): An OAHPP/ICES Report. Toronto: Ontario Agency for Health Protection and Promotion, Institute for Clinical Evaluative Sciences; 2010.
- Footnote 12
-
Seeff LB. The history of the "natural history" of Hepatitis C (1968-2009). Liver Int. 2009; Jan;29 Suppl 1:89-99.
- Footnote 13
-
Health Canada. Canadian Communicable Disease Surveillance System: Disease-specific case definitions and surveillance methods. Can Dis Wkly Rep. 1991;17S3.
- Footnote 14
-
Health Canada. Case definitions for diseases under national surveillance. CCDR 2000; 26S3:69.
- Footnote 15
-
Public Health Agency of Canada. Supplement - case definitions for communicable diseases under national surveillance - 2009. Canada Communicable Disease Report 2009; 35(Supplement 2).
- Footnote 16
-
Statistics Canada. Demography Division, Demographic estimates section, July population estimates. 2013.
- Footnote 17
-
Norris S, for the Parliamentary Information and Research Service. Canada's blood supply ten years after the Krever commission. Library of Parliament 2008; PRB 08-14E.
- Footnote 18
-
Krever H. Commission of Inquiry on the Blood System in Canada, Final report. Ottawa: The Commission 1997;CP32-62/3-1997E-PDF.
- Footnote 19
-
Public Health Agency of Canada, Hep C & STI, surveillance and epi section. Epidemiology of acute Hepatitis C infection in Canada: results from the enhanced Hepatitis strain surveillance system (EHSSS). 2009.
- Footnote 20
-
Public Health Agency of Canada. Summary of key findings from the I-track phase 3 (2010-2012). Surveillance and Epidemiology Division, Centre for Communicable Diseases and Infection Control; 2014. http://www.phac-aspc.gc.ca/aids-sida/publication/reports/i-track-phase-3/index-eng.php
- Footnote 21
-
Tompkins C, Sheard L, Wright N, Jones L, Howes N. Exchange, deceit, risk, harm: The consequences for women of receiving injections from other drug users. Drugs: education, prevention and policy. 2006; 13:281-297.
- Footnote 22
-
Galdas PM, Cheater F, Marshall P. Men and health help-seeking behaviour: Literature review. J Adv Nurs. 2005; Mar;49(6):616-623.
- Footnote 23
-
Ellison LF, Wilkins K. Canadian trends in cancer prevalence. Health Rep. 2012; 23(1):7-16.
- Footnote 24
-
Trubnikov M, Yan P, Njihia J, Archibald C. Identifying and describing a cohort effect in the national database of reported cases of Hepatitis C virus infection in Canada (1991-2010): An age-period-cohort analysis. CMAJ Open in press 2014.
- Footnote 25
-
Remis RS. Modelling the incidence and prevalence of Hepatitis C infection and its sequelae in Canada, 2007. Ottawa: Public Health Agency of Canada; 2007.
- Footnote 26
-
Sherman M, Shafran S, Burak K, Doucette K, Wong W, Girgrah N, et al. Management of chronic Hepatitis C: Consensus guidelines. Can J Gastroenterol. 2007; Jun;21 Suppl C:25C-34C.
- Footnote 27
-
Health Canada. Drugs and health products: Galexos. 2014. http://www.hc-sc.gc.ca/dhp-mps/prodpharma/sbd-smd/drug-med/sbd_smd_2014_galexos_164021-eng.php.
- Footnote 28
-
Health Canada. Drugs and health products: Sovaldi. 2014. http://www.hc-sc.gc.ca/dhp-mps/prodpharma/sbd-smd/drug-med/sbd_smd_2014_sovaldi_165043-eng.php.
- Footnote 29
-
Kiser JJ, Flexner C. Direct-acting antiviral agents for Hepatitis C virus infection. Annu Rev Pharmacol Toxicol. 2013; 53:427-429.
- Footnote 30
-
Hagan H, Pouget ER, Des Jarlais DC. A systematic review and meta-analysis of interventions to prevent Hepatitis C virus infection in people who inject drugs. JID. 2011; 204:74-83.
- Footnote 31
-
Kesli R. Evaluation of assay methods and false positive results in the laboratory diagnosis of Hepatitis C virus infection. Archives of Clinical Microbiology. 2011; 2(4):1-4.
Page details
- Date modified: