
Hepatitis C virus genotypes distribution in British Columbia: 2000-2013

Download this article as a PDF (685 KB - 7 pages)
Published by: The Public Health Agency of Canada
Issue: Volume 40-19: Hepatitis C
Date published: December 18, 2014
ISSN: 1481-8531
Submit a manuscript
About CCDR
Browse
Volume 40-19, December 18, 2014: Hepatitis C
Surveillance
Distribution of Hepatitis C virus genotypes among newly acquired HCV infections in British Columbia (2000-2013)
Andonov A1*, Lin L1, McGuinness L2, Krajden M2
Affiliations
1 National Microbiology Laboratory, Public Health Agency of Canada, Winnipeg MB
2 Public Health Microbiology and Reference Laboratory, British Columbia Centre for Disease Control, Vancouver, BC
Correspondence
DOI
https://doi.org/10.14745/ccdr.v40i19a03
Abstract
Background: Characterization of newly acquired Hepatitis C virus (HCV) infections is important in order to understand the epidemiology and spread of HCV.
Objective: To describe the Hepatitis C virus (HCV) genotype distribution of newly acquired HCV infections in the province of British Columbia for the period 2000-2013.
Methods: A descriptive cross-sectional analysis of multi-year data on HCV genotypes. Time trends for the proportion of different HCV genotypes are presented only for newly acquired (incident) HCV infections.
Results: For acute cases, genotype 1a remains the dominant HCV type in circulation (50%), followed by genotype 3a (34%). HCV genotype 1b declined, while genotype 2 was relatively stable. Phylogenetically-related clusters of HCV strains were observed indicating a common source of infection.
Conclusion: Enhanced hepatitis surveillance provides a mechanism for monitoring different HCV strains currently circulating in the community. While HCV genotype 1a continues to be the most prevalent, changes in the relative frequency of genotypes 1 and 3 have been observed. This may have important implications for the control and prevention of the infection.
Introduction
Hepatitis C virus infection (HCV) is a major cause of liver disease with a global prevalence of 2.8% affecting about 185 million people Footnote 1. In Canada HCV remains a major public health issue. A recent study from Ontario ranked HCV first among 51 pathogens based on their relative contribution to the overall infectious diseases burden Footnote 2.
Hepatitis C virus is classified in the genus Hepacivirus, family Flaviviridae and is characterized by high genetic variability. According to the latest nomenclature there are seven genotypes and at least 67 subtypes Footnote 3. HCV genotypes differ in their geographical distribution based on disease endemicity and transmission route. In Europe genotype 3a became common in people who inject drugs (PWID), in some cases displacing the previously predominant genotypes 1b and 1a Footnote 4,Footnote 5. Studies in the US Footnote 6 and Canada Footnote 7 identified 1a as the predominant genotoype. An early genotyping study of chronic Hepatitis C patients in in British Columbia in the 1990s reported that the three main genotypes were genotype 1 (59.1%), genotype 2 (18.2%) and genotype 3 (22.7%) Footnote 8. Based on a re-analysis of this study using an up-to-date classification approach, genotypes 1a and 1b were almost evenly distributed (54% for HCV 1a and 46% for 1b respectively).
The infecting HCV genotypes and the viral load level are important for treatment with interferon-based therapies. For example, sofosbuvir is less effective in patients infected with genotype 3 and requires longer treatment regimens Footnote 9. HCV genotyping is also important as a laboratory tool to identify outbreaks and transmission clusters Footnote 10,Footnote 11.
Data available on HCV infection in Canada is based on mandatory reporting of cases to the Canadian Notifiable Disease Surveillance System (CNDSS) but it cannot identify incident infection rates Footnote 12. The Enhanced Hepatitis strain surveillance (EHSSS), involving the collection of additional epidemiological and laboratory information was designed to identify incident cases Footnote 13.
EHSSS was launched in Western Canada in 2000 and seven additional sites joined between 2004 and 2010 (Toronto, Hamilton, London, Thunder Bay, Montreal, Saskatoon and North West Territories).
The objective of this paper is to describe the Hepatitis C virus (HCV) genotype distribution of newly acquired HCV infections in the province of British Columbia for the period 2000-2013. The focus is on BC as it is the only province participating in the EHSSS where the entire population is covered.
Materials and methods
Study population
The BC EHSSS data were gathered by two sites: the Vancouver Coastal Health Authority (VCHA) which included the communities of Richmond, Vancouver, the North Shore, Sunshine Coast, Sea to Sky area, Powell River, Bella Bella and Bella Coola; and the BC Centre for Disease Control (BCCDC) which included VCHA and BCCDC for the rest of the province.
There were some important differences between the two sites. Between 2009 and 2011, for example, the rates for incident HCV in VCHA remained mostly unchanged; 4.42, 3.23 and 5.11 per 100,000, while the rates for the rest of BC were lower and declined further (2.15, 1.48 and 1.41 per 100,000) (Unpublished EHSSS data). The incidence rate peaked in those aged 40-49 years for the VCHA population, compared to those aged 20-39 years for the rest of the province. More men than women were infected in VCHA; whereas the M:F ratio was lower in the rest of the province. Surprisingly 82% of the newly acquired HCV cases were among women aged 0-19 years. The main risk factor in the previous 12 months before diagnosis for both sites was injection drug use (IDU); 50% for VCHA and another 30% reported non-injection drug use (NIDU), while in the rest of the province, IDU was reported to be 70%. Another major risk factor identified was a history of incarceration (15%).
Data sources
Case definitions for acute HCV infection
In EHSSS, an acute HCV infection meets one of two criteria: (a) seroconversion from negative anti-HCV to positive within twelve months or (b) evidence of clinical Hepatitis C, requiring both clinical and laboratory criteria. Laboratory testing for HCV infection in the province of British Columbia is largely centralized at the BCCDC. Samples submitted for testing between January 2000 and March 2013 was used in this survey to identify anti-HCV seroconversion. From 2000-2001, the BCCDC collected information from all patients in the province with evidence of seroconversion and sent samples for genotyping to the National Microbiology Laboratory (NML). In 2002, the Vancouver Coastal Health Authority was also recruited to identify recent HCV cases based on the clinical case definition (b). The BCCDC continued to collect information and samples based on the laboratory criteria of anti-HCV seroconversion (a). Samples from incident HCV cases identified by VCHA were also referred to the NML for genotyping.
HCV genotype identification
HCV-RNA was extracted from 250 μL of sera using QIAamp viral RNA kit (QIAGEN Inc., Mississauga, Ontario, Canada) and/or the automated nucleic acid extraction system NucliSENS easyMag (bioMerieux Inc, Durham, US) and amplified by RT-PCR using primers specific for 5' non-coding region(5'-NCR), the core, E1 and NS5B genes (additional information is available upon request).
Amplicon products were gel purified prior to being Sanger sequenced. Sequence data were used to determine the HCV genotype of each viral sample and further analysis was performed to determine their phylogenetic relatedness. Genetic distances were estimated by Kimura two-parameter analysis and a phylogenetic tree was constructed by the maximum likelihood method using MEGA 5.05 Footnote 8. Significant taxonomic relationships were obtained by bootstrap resampling analysis (200 replicates) using the maximum likelihood method.
Statistical analysis
The proportion of genotypes 1 and 3 were analyzed by the chi-square test. P values of <0.05 were considered to be significant. The robustness of phylogenetic reconstruction was evaluated by bootstrap analysis and clusters were identified with bootstrap thresholds > 90 % and a maximum genetic distance threshold of 0.05. Pairwise genetic distances of related sequences were assessed using MEGA 5.05.
Results
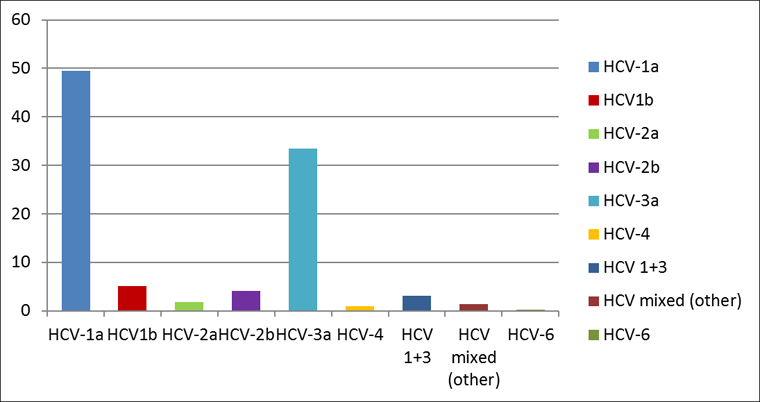
Between 2000 and 2013, 918 genotyped samples were analyzed; 258 from VCHA and 660 from the rest of BC. The cumulative HCV genotype distribution for the province is shown in Figure 1. Genotype 1a remained the dominant HCV type in circulation among the acute HCV cases (50%), followed by genotype 3a which accounted for 34% of the newly acquired HCV infections. HCV genotype 2 and genotype 1b were almost evenly distributed at 6% for 2a+2b and 5% for 1b respectively. A small proportion (3%) of cases had genotypes 1 and 3 dual infections which is consistent with these two genotypes being the two most commonly in circulation. There was no difference between the genotype pattern distribution when both geographic sites were compared.
Figure 1: HCV genotype distribution among cases of acute/recent HCV infection in British Columbia (2000-2013)
Text Equivalent - Figure 1
| HCV-1a | HCV1b | HCV-2a | HCV-2b | HCV-3a | HCV-4 | HCV 1+3 | HCV mixed (other) | HCV-6 | %HCV genotype | |
|---|---|---|---|---|---|---|---|---|---|---|
| All of BC | 49.56 | 5.12 | 1.85 | 4.14 | 33.44 | 0.98 | 3.16 | 1.42 | 0.33 | |
| VCHA | 48.83 | 5.81 | 1.55 | 2.32 | 36.04 | 1.16 | 2.32 | 1.55 | 0.38 | distribution |
| Rest of BC | 49.85 | 4.85 | 1.97 | 4.85 | 32.42 | 0.9 | 3.48 | 1.36 | 0.3 | 2000-2013 |
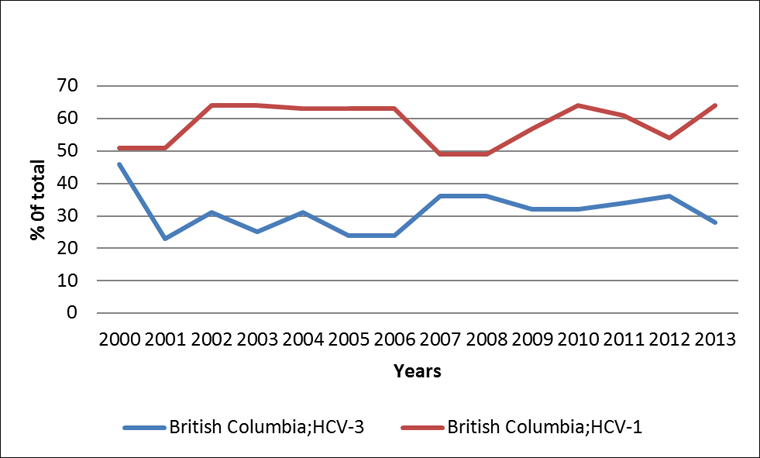
In 2000, HCV genotypes 1 and 3 were distributed equally among all acute HCV cases in the province (Figure 2), however during most of the following 13-year observation period, genotype 1 was significantly more common than genotype 3 (p<0.05). A notable exception is the two-year period 2007-2008 when the difference between genotype 1 (49%) and 3 (36%) was not statistically significant. Another important observation is the rise of genotype 3. When comparing the average proportion of genotype 3 for the period of 2001-2006 with that of 2007-2012, a statistically significant increase was observed at the 95% confidence level.
Figure 2: Proportion of HCV genotype 1 and 3a among cases of acute/recent HCV infection in British Columbia: 2000-2013
Text Equivalent - Figure 2
| Percentage of total | ||
|---|---|---|
| Year | British Columbia;HCV-3 | British Columbia;HCV-1 |
| 2000 | 46 | 51 |
| 2001 | 23 | 51 |
| 2002 | 31 | 64 |
| 2003 | 25 | 64 |
| 2004 | 31 | 63 |
| 2005 | 24 | 63 |
| 2006 | 24 | 63 |
| 2007 | 36 | 49 |
| 2008 | 36 | 49 |
| 2009 | 32 | 57 |
| 2010 | 32 | 64 |
| 2011 | 34 | 61 |
| 2012 | 36 | 54 |
| 2013 | 28 | 64 |
The third most common HCV genotype was two although it fluctuated from 0% to slightly over 10% throughout the observation period. Due to limited numbers, however, it is difficult to assess the trend. Comparing genotypes 1a and 1b reveals a trend toward a reduction of genotype 1b from an average of 13% for the first three years of the survey (2000-2002) to around 3% over the last ten years, while the level of 1a has increased since 2000 and remained relatively stable afterwards. The evaluation of the genotype distribution between the two sites demonstrates a similar pattern with slight year-to-year variations.
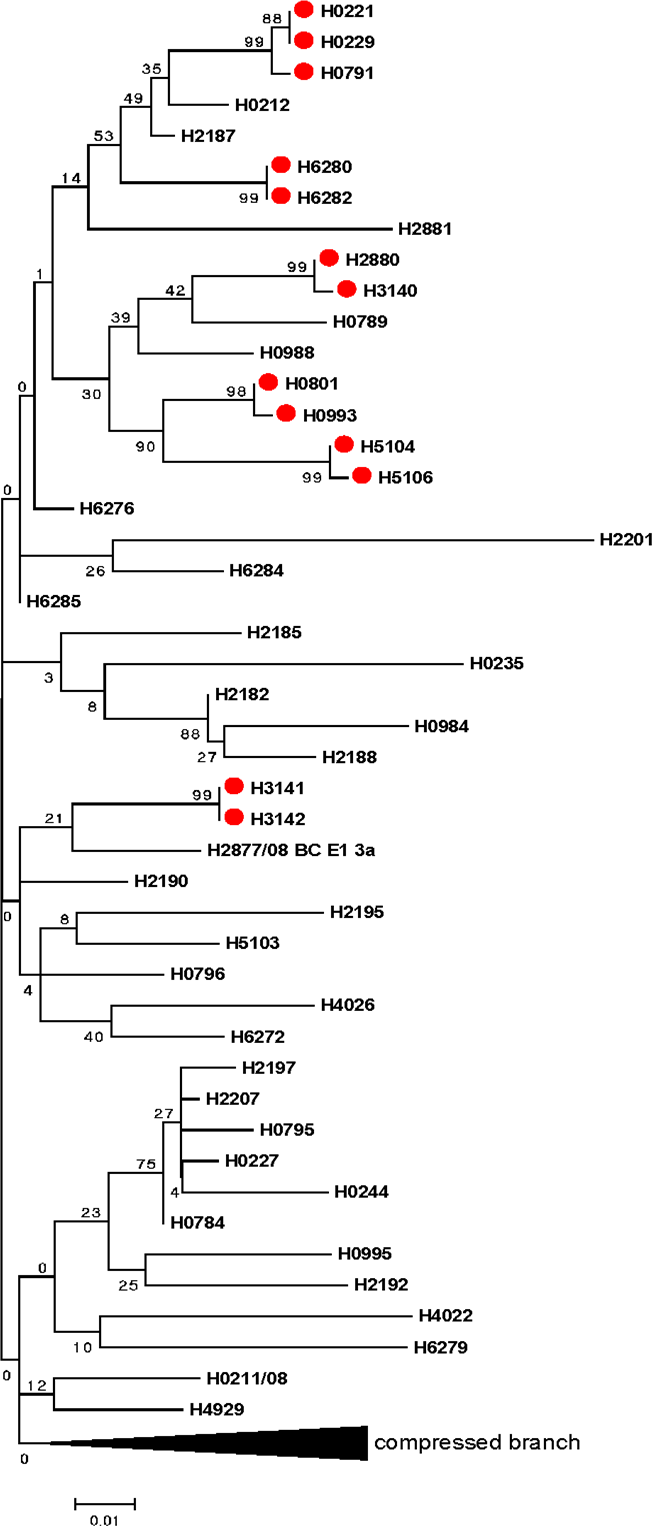
Sequence-based HCV genotyping of different genetic regions allows for accurate HCV genotyping and subtyping but also allows for phylogenetic analysis. Figure 3 illustrates that phylogenetic analysis can lead to the identification of transmission clusters even without comprehensive epidemiological data. The circled areas identify identical or almost identical sequences that, when present in different specimens, indicate statistically plausible transmission from the same source.
Figure 3: Phylogentic tree based on Hepatitis C virus E1 gene
Text Equivalent - Figure 3
Phylogenetic tree demonstrates the genetic relatedness of different Hepatitis C virus isolates. Sequences on the same vertical line are identical. The length of horizontal lines separating sequences or branches of sequences is proportional to the number of differences (measured in single nucleotides) between the sequences. There are red dots on 13 among over 40 different nucleotide sequences that, when present in different specimens, indicate statistically plausible transmission from the same source.
Discussion
Over the last 13 years, almost 90% of the newly acquired HCV infections in BC belong to genotypes 1 and 3. The prevalence of genotype 1a has remained stable during the last ten years, while genotype 3a has slowly increased. HCV genotype 1b has decreased significantly during the 13-year observation period. This identifies a shift in the epidemiology of HCV genotypes since the early 1990s among those acutely infected Footnote 14.
Compared with earlier studies done nationally Footnote 7 and in BC Footnote 14, HCV genotype 1a continues to be the dominant genotype in newly acquired HCV infection. In contrast, genotype 1b has declined in frequency over the last ten years. In prior decades this genotype was associated with blood product related transmission which has virtually been eliminated since 1990 as a result of blood screening.
The fact that the EHSSS was able to capture a change in the genotype pattern related to a modification of a particular risk factor (in this case blood product transfusion) highlights its capacity to track the changing epidemiology of incident HCV infections. In contrast to other cross-sectional studies reporting routine genotyping data, EHSSS monitors HCV incident trends and their association with risk activities.
In Europe, genotype 3a has been strongly associated with PWID and has been the predominant genotype during the last two decades Footnote 4,Footnote 15. In contrast, in BC genotype 1a has remained dominant although there were some years where there were similar rates of genotypes 1a and 3a (2000, 2007 and 2008). This suggests that genotype 3 transmissions may be slowly increasing over time.
The EHSSS study was able to identify clusters of related strains though phylogenetic analysis. A recent publication from the Vancouver Injection Drug Use Study (VIDUS) also identified clustering of extensive networks among PWID in Vancouver Footnote 11. In the VIDUS study, factors independently associated with clustering included age <40, HIV infection, HCV seroconversion and syringe-borrowing. In this study, most patients whose HCV strains were found in the same clusters (Figure 3) could not be located or refused to be interviewed, but collected epidemiologic data revealed at least two of the above mentioned risk factors. Of note, the VIDUS study also corroborates the findings on genotype distribution with 1a (48%), 1b (6%) 2a (3%), 2b (7%) and 3a (33%) Footnote 10.
An inherent limitation of any Hepatitis C surveillance system is that infections are rarely symptomatic and most cases remain undetected. This drawback is mitigated to some extent by the use of two case definitions for incident cases; the one based on seroconversion will identify asymptomatic infections especially among those whose continuous testing is driven by their own awareness of possibly being exposed to infection. In addition, not all incident cases respond favourably to requests for follow-up interviews and, as a result, risk factor information may be incomplete. The newly acquired HCV cases reported from some regions (Fraser Health Authority) are skewed due to the presence of federal and provincial correctional facilities located within that health authority. Finally, for cases with more than one risk factor, the analysis did not account for potential confounding by other possible factors.
Conclusion
The EHSSS data provides a comprehensive account of the HCV genotype distribution in acutely infected individuals in BC and underscores the value of sentinel surveillance for monitoring disease trends of public health importance. Monitoring these trends provides information on transmission dynamics and, when combined with phylogenetics, can enable the identification of transmission clusters in the absence of proper epidemiological data. This will help guide the selection and planning of direct-acting HCV antivirals and other future prevention and treatment strategies.
Acknowledgements
We would like to thank all site investigators who contributed to the EHSSS during the last 13 years as well as Warren Hill and Ciro Panessa (BCCDC); and Monica Lindergger and Margot Smythe (VCHA).
Conflict of interest
None
Funding
The EHSSS was established and funded by the Public Health Agency of Canada.
References
Page details
- Date modified: