
TB drug resistance in Canada: 2003−2013

 Download this article as a PDF (706 KB - 8 pages)
 Published by: The Public Health Agency of Canada
Issue: Volume 41S-2: Tuberculosis
Date published: March 19, 2015
ISSN: 1481-8531
Submit a manuscript
About CCDR
Browse
Volume 41S-2, March 19, 2015: Tuberculosis
Surveillance
A summary of tuberculosis drug resistance in Canada, 2003−2013
McGuire M1, Gallant V1, Bourgeois A-C1, Ogunnaike-Cooke S1*
Affiliation
1 HIV/AIDS and Tuberculosis Section, Public Health Agency of Canada, Ottawa, ON
Correspondence
DOI
https://doi.org/10.14745/ccdr.v41is2a02
Abstract
Background: Drug-resistant strains of tuberculosis (TB) pose a serious threat to prevention and control efforts. In response to this growing worldwide concern, the Public Health Agency of Canada (PHAC) established and maintains the Canadian Tuberculosis Laboratory Surveillance System (CTBLSS) in partnership with the Canadian Tuberculosis Laboratory Technical Network (CTLTN) and participating laboratories.
Objective: To report on national trends and patterns in anti-tuberculosis drug resistance in Canada for the years 2003 to 2013.
Method: At the beginning of each calendar year, participating laboratories submit to PHAC reports on the results of anti-tuberculosis drug susceptibility testing for all isolates tested during the preceding year. These data are then analyzed by PHAC and the results are validated by supplying laboratories. The results are published annually as the Tuberculosis Drug Resistance in Canada series.
Results: In 2013, anti-tuberculosis drug susceptibility test results for 1,380 isolates were reported to PHAC. Of these, 762 (54%) were reported as Mycobacterium tuberculosis complex (MTBC) where the species was known. Two thirds (68%) of all the reported isolates originated from the three largest provinces, British Columbia, Ontario and Quebec. Overall, of the laboratory results received, 112 (8.1%) showed resistance to at least one first-line drug and, of these, the majority (93 or 83%) were monoresistant.
Conclusion: TB drug resistance observed in Canada remains well below the global average. Over the last 10 years, the percentage of isolates with resistance to one or more of the first-line medications has decreased from 10.5% in 2003 to 8.1% in 2013.
Introduction
Drug-resistant strains of tuberculosis (TB) pose a serious threat to prevention and control efforts. Although drug-resistant TB has not yet been identified as a major problem in Canada, its potential to become an issue is high because of the frequency with which Canadians travel abroad.
In 1998, in response to a growing concern about TB drug resistance worldwide, the Government of Canada in partnership with the Canadian Tuberculosis Laboratory Technical Network (CTLTN)—a network of provincial and territorial TB laboratories across Canada with representation from their respective technical or scientific TB programs leads—established the Canadian Tuberculosis Laboratory Surveillance System (CTBLSS) to monitor trends and patterns in tuberculosis drug resistance in Canada over time. This article provides an overview of the most recent data on TB drug resistance in Canada as well as details on the overall level of TB drug resistance in Canada for the period 2003 to 2013, focusing, in particular, on 2013Footnote 1.
Background
The CTBLSS is an isolate-based surveillance system designed to collect timely data on TB drug resistance across Canada. Information on the results of all unique isolates tested for drug resistance during the previous calendar year are voluntarily submitted by provincial TB laboratories to PHAC for inclusion in the CTBLSS. The primary objectives of the CTBLSS are:
- To describe the number of drug-resistant TB isolates in Canada on an annual basis by resistance pattern and by originating province/territory, and by sex and age.
- To monitor trends in drug-resistant TB in Canada over time by originating province/territory, and by sex and age.
TB drug resistance is determined through susceptibility testing of cultures grown from clinical specimens obtained from individuals with culture-positive TBFootnote 2. People with active TB disease are said to have drug-resistant TB if the strain of Mycobacterium tuberculosis complex (MTBC) causing their disease is resistant to one or more of the four first-line anti-TB drugs, isoniazid, rifampin, ethambutol or pyrazinamide. Data are submitted for confirmed cases of MTBC, including Mycobacterium tuberculosis, M. africanum, M. canetti, M. caprae, M. microti, M. pinnipedii or M. bovis, but excluding M. bovis Bacille Calmette-Guérin (BCG). See text box below for definitions of the different drug-resistant patterns.
Definiontis of different drug-resistant patterns to tuberculosis
Monoresistance
- Resistance to only one first-line anti-TB drug
Polyresistance (other patterns)
- Resistance to more than one first-line anti-TB drug, not including the isoniazid and rifampin combination of MDR-TB
Multidrug-resistant tuberculosis (MDR-TB)
- TB due to bacteria resistant to isoniazid and rifampin with or without resistance to other anti-TB drugs
Extensively drug-resistant TB (XDR-TB)
- TB due to bacteria resistant to isoniazid and rifampin and any fluoroquinolone and at least one of the three injectable second-line anti-TB drugs (amikacin, capreomycin or kanamycin)
Methods
At the beginning of each calendar year, participating laboratories voluntarily submit drug susceptibility testing (DST) results for all MTBC isolates tested in the previous year. Although some laboratories report results for M. bovis BCG strain, these are excluded from this article.
The following information is submitted to PHAC: the date the isolate or specimen was received at the laboratory and its identification number; the province/territory where the isolate was tested in the province or territory where it originates from; the sex, date of birth (or age) of the person the isolate came from; and the drug susceptibility results.
With respect to DST results, participating laboratories are asked to submit test results for all first-line anti-TB drugs (isoniazid [INH], rifampin [RMP], ethambutol [EMB] and pyrazinamide [PZA]). If isolates show resistance to isoniazid and rifampin, second-line drug testing should be done to rule out XDR-TBFootnote 2. Laboratories are requested to report on the DST results for a fluoroquinolone (ofloxacin, moxifloxacin or levofloxacin) and the injectable agents (amikacin, kanamycin and capreomycin).
The analysis presented here is based on descriptive statistics only. No statistical procedures were used for comparative analyses, nor were any statistical techniques applied to account for missing data. Data in tables with small cell sizes (n≤5) were not suppressed, since disclosure is not deemed to pose any risk of identifying individual cases. These procedures are in line with PHAC’s Directive for the collection, use and dissemination of information relating to public healthFootnote 3.
Results
Reporting for 2013
In 2013, TB DST results for 1,397 isolates were reported to PHAC. Of these, 762 (54%) were reported as MTBC where the species was known (750 were M. tuberculosis; 8 were M. africanum and 4 were M. bovis) and 618 (44%) were MTBC of an unknown species. Seventeen (1.2%) isolates were identified as M. bovis BCG and were excluded from further analyses (data not shown). As a result, laboratory results for 1,380 isolates were analyzed for this article. Of these, 68% of all the reported isolates originated from the three largest provinces, British Columbia, Ontario and Quebec. Figure 1 provides a breakdown of the number of isolates tested by province or territory of origin of the isolate.
Figure 1: Number of Mycobacterium tuberculosis complex isolates tested by province or territory of origin, Canada, 2013

Text description: Figure 1
Figure 1: Number of Mycobacterium tuberculosis complex isolates tested by province or territory of origin, Canada, 2013
| Province/territory | Reported Mycobacterium tuberculosis complex isolates in Canada by province/territory: 2013 |
|---|---|
| Ontario | 511 |
| British Columbia | 223 |
| Quebec | 205 |
| Alberta | 154 |
| Manitoba | 148 |
| Saskatchewan | 71 |
| Nunavut | 41 |
| Newfoundland and Labrador | 11 |
| Nova Scotia | 9 |
| Northwest Territorries | 3 |
| New Brunswick | 3 |
| Yukon | 1 |
| Prince Edward Island | 0 |
Monoresistance
In 2013, of the 112 TB isolates reported to be resistant to at least one of the four first-line drugs, the majority, 93 (83%), were monoresistant . Of these, 74 (80%) were isoniazid-resistant, 17 (18%) were pyrazinamide-resistant, and 2 (2%) were rifampin-resistant. No isolates were identified as ethambutol-monoresistant. Figure 2 provides a breakdown of the percentage of all the isolates tested that showed any resistance to one of the four first-line TB drugs.
Figure 2: Reported tuberculosis drug resistance in Canada by first-line drug, 2013

Text description: Figure 2
Figure 2: Reported tuberculosis drug resistance in Canada by first-line drug, 2013
| Type of drug resistance | Percentage of drug resistance |
|---|---|
| Any resistance to isoniazid | 6.7 |
| Any resistance to pyrazinamide | 2.2 |
| Any resistance to rifampin | 1.2 |
| Any resistance to ethambutol | 0.7 |
Multidrug-resistance
In 2013, fifteen isolates were resistant to both isoniazid and rifampin (classifying these isolates as MDR-TB at least), six (40%) of which were resistant only to isoniazid and rifampin. In addition to being resistant to isoniazid and rifampin, three of these fifteen (20%) were also resistant to ethambutol, one (6%) to pyrazinamide, and five (33%) to all first-line drugs. An additional four isolates (0.3%) were resistant to two or more of the first-line drugs excluding the isoniazid and rifampin combination.
Extensively drug-resistance
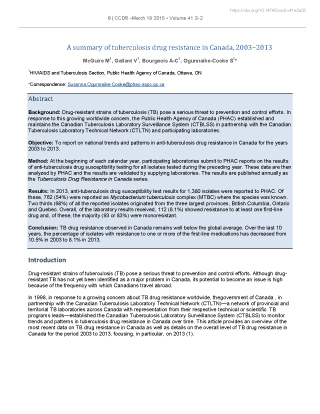
To rule out XDR-TB, all fifteen isolates that were resistant to bothisoniazid and rifampin were subsequently tested for resistance to select second-line drugs. Of these, twelve isolates were susceptible to both the injectable agents and the fluoroquinolones, one was resistant to an injectable, and one was resistant to a fluoroquinolone. As a result, these fourteen isolates (1.0% of all isolates tested) were classified as MDR-TB. The remaining isolate was resistant to at least one of the injectables and to a fluoroquinolone, which classified it as XDR-TB (0.1% of all isolates tested). Thus, results from additional second-line testing in 2013 identified fourteen isolates as MDR-TB and one as XDR-TB (Figure 3).
Figure 3: Patterns of reported TB drug resistance as a percentage of isolates tested, 2013
Text description: Figure 3
Figure 3: Patterns of reported TB drug resistance as a percentage of isolates tested, 2013
| Type of resistance | Drug resistance percentage |
|---|---|
| Any resistance | 8.1 |
| Monoresistance | 6.7 |
| Multidrug-resistant TBFigure 3 table footnote 1 | 1.0 |
| Extensively drug-resistant TBFigure 3 table footnote 2 | 0.1 |
| Other patterns | 0.3 |
Geographic distribution
In 2013, 68% of all the reported isolates originated from the three largest provinces, British Columbia, Ontario and Quebec. All isolates from Northwest Territories, Nunavut, Yukon, and Newfoundland and Labrador were fully susceptible to all the first-line drugs tested. Prince Edward Island did not report a case of TB in 2013 and no laboratory results were reported by that province. Of the 15 isolates resistant to both isoniazid and rifampin in 2013, 13 originated from Ontario and 2 from Quebec.
Demographic data
In 2013, sex information was reported for all but two individuals from whom isolates were obtained, and age or date of birth was available for all. Males accounted for 55% of all reports. Figure 4 shows the number of isolates tested by age group and sex.
Figure 4: All isolates tested by sex and age group, 2013
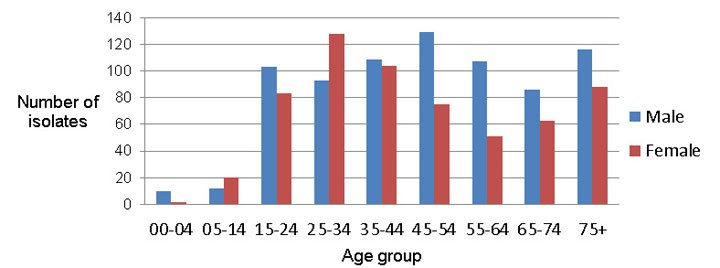
Text description: Figure 4
Figure 4: All isolates tested by sex and age group, 2013
| Age Group | Males | Females |
|---|---|---|
| 0 to 4 | 10 | 2 |
| 5 to 14 | 12 | 20 |
| 15 to 24 | 103 | 83 |
| 25 to 34 | 93 | 128 |
| 35 to 44 | 109 | 104 |
| 45 to 54 | 129 | 75 |
| 55 to 64 | 107 | 51 |
| 65 to 74 | 86 | 63 |
| 75 and over | 116 | 88 |
Of the 112 isolates for which any drug-resistance pattern was identified, 23% were from individuals between the ages of 24 and 34 years and 21% were from individuals 45 to 54 years of age. Less than 2% of isolates were from individuals under 15 years of age. All MDR-TB isolates were from individuals between the ages of 15 and 64 years. There were no MDR-TB cases reported for individuals less than 15 years of age or over 65 years of age. Females accounted for 56% of the isolates showing any resistance and 67% (10/15) of the isolates with resistance to both isoniazid and rifampin. Figure 5 provides the breakdown of isolates showing any resistance and those MDR-TB isolates by sex and age for 2013.
Figure 5: Number of isolates showing resistance by age group and sex, 2013

Text description: Figure 5
Figure 5: Number of isolates showing resistance by age group and sex, 2013
| Age Group | Males | Females | ||
|---|---|---|---|---|
| Any resistance not MDR | MDR-TB | Any resistance not MDR | MDR-TB | |
| 00 to 04 | -1 | 0 | 0 | 0 |
| 05 to 14 | 0 | 0 | 1 | 0 |
| 15 to 24 | -7 | -2 | 4 | 1 |
| 25 to 34 | -5 | -3 | 16 | 2 |
| 35 to 44 | -3 | 0 | 11 | 3 |
| 45 to 54 | -12 | 0 | 8 | 3 |
| 55 to 64 | -4 | -1 | 7 | 0 |
| 65 to 74 | -7 | 0 | 3 | 0 |
| 75 and over | -4 | 0 | 4 | 0 |
Trends: 2003–2013
For the period 2003 to 2013, DST results were reported for 14,841 isolates. On average 1,349 results were received each year ranging from a high of 1,405 in 2003 to a low of 1,267 in 2007.
Between 2003 and 2013, 8% (range: 6.7%–9.4%) of all isolates tested were isoniazid-resistant. From 2011 to 2013, isoniazid resistance dropped slightly, from 9.2% in 2011 to 7.9% in 2012 and then to an all-time low of 6.7% in 2013. For the period 2003 to 2013, ethambutol, rifampin and pyrazinamide resistance have consistently remained below 3% (Figure 6).
Figure 6: Any drug resistance, by type of first-line drug, as a percentage of all isolates tested, 2003–2013

Text description: Figure 6
Figure 6: Any drug resistance, by type of first-line drug, as a percentage of all isolates tested, 2003–2013
| Years | 2003 | 2004 | 2005 | 2006 | 2007 | 2008 | 2009 | 2010 | 2011 | 2012 | 2013 |
|---|---|---|---|---|---|---|---|---|---|---|---|
| Isoniazid | 9.4 | 7.4 | 8.2 | 7.3 | 8.7 | 7.5 | 8.5 | 7.9 | 9.2 | 7.9 | 6.7 |
| Rifamping | 1.6 | 1.0 | 1.8 | 1.7 | 1.0 | 1.4 | 1.6 | 1.4 | 1.6 | 0.7 | 1.2 |
| Ethambutol | 1.2 | 0.8 | 1.5 | 0.9 | 1.8 | 1.0 | 1.3 | 0.8 | 0.7 | 0.3 | 0.7 |
| Pyrazinamide | 2.6 | 2.4 | 2.1 | 1.5 | 2.7 | 2.1 | 1.7 | 2.4 | 2.6 | 2.8 | 2.2 |
Of all the results reported between 2003 and 2013, 1,399 (approximately 9%) were resistant to one or more of the first-line medications, ranging from a high of 10.5%, reported in 2003, 2007 and 2011, to a low of 8.1% in 2013.
For the period 2003 to 2013, 170 isolates were classified as MDR-TB, representing 1.1% of isolates tested over this time. Seven isolates were classified as XDR-TB, representing an annual average of less than 0.1% of the total number of isolates tested for the period 2003 to 2013. An average of 16 MDR-TB isolates were reported each year, ranging from a high of 22 (1.6% of all isolates tested) in 2005 to a low of 8 (0.6% of all isolates tested) in 2012. For the period 2003 to 2013, all 170 MDR-TB isolates originated from six provinces: Alberta, British Columbia, Manitoba, Ontario, Quebec, and Saskatchewan. Of the additional seven isolates identified as XDR-TB, five were reported from Ontario, one from Manitoba and one from Québec.
Figure 7 shows the overall pattern of reported TB drug resistance as a percentage of isolates tested for the period 2003 to 2013. While there have been small fluctuations in the percentage of isolates showing various resistance patterns, there has been no notable change over this time.
Figure 7: Patterns of reported TB drug resistance as a percentage of isolates tested, 2003–2013

Text description: Figure 7
Figure 7: Patterns of reported TB drug resistance as a percentage of isolates tested, 2003–2013
| Years | 2003 | 2004 | 2005 | 2006 | 2007 | 2008 | 2009 | 2010 | 2011 | 2012 | 2013 |
|---|---|---|---|---|---|---|---|---|---|---|---|
| Resistance to one or more drugs | 10.5 | 8.6 | 9.6 | 9.1 | 10.5 | 8.6 | 9.5 | 8.8 | 10.5 | 9.9 | 8.1 |
| Monoresistance | 8.3 | 6.8 | 7.7 | 7.7 | 8.8 | 6.9 | 7.4 | 6.9 | 9.0 | 9.1 | 6.7 |
| Multidrug-resistant TBFigure 7 table footnote 1 | 1.4 | 0.9 | 1.6 | 1.1 | 0.9 | 1.1 | 1.4 | 1.3 | 1.4 | 0.6 | 1.0 |
| Other patterns | 0.7 | 0.9 | 0.2 | 0.2 | 0.9 | 0.4 | 0.8 | 0.5 | 0.1 | 0.1 | 0.3 |
| Extensively drug-resistant TBFigure 7 table footnote 2 | 0.1 | 0.0 | 0.0 | 0.1 | 0.0 | 0.1 | 0.0 | 0.1 | 0.1 | 0.1 | 0.1 |
Discussion
TB drug resistance in Canada remains well below the global average. Over the last 11 years, the percentage of isolates resistance to one or more of the first-line medications has decreased from 10.5% in 2003 to 8.1% in 2013.
Organisms resistant to both isoniazid and rifampin, a resistance pattern defined as multidrug-resistant TB (MDR-TB); pose a considerable challenge to treatment and prevention efforts because effective anti-tuberculosis drugs are limited. Data published by the World Health Organization (WHO) show that globally, in 2012, about 3.6% (95% CI: 2.1%–5.1%) of new TB cases and 20.2% (95% CI: 13.3%–27.2%) of previously treated TB cases were MDR-TBFootnote 4. In Canada, overall MDR-TB rate is 1.1%.
These data need to be considered in light of some limitations. Given the minimal identifying information available for each isolate (age and sex), it is possible that multiple records from one individual could be included in the database. However, this bias is believed to be minimal.
Typically, only isolates with MDR-TB or other extensive resistance patterns will undergo drug sensitivity testing to select second-line drugs. Although the Clinical and Laboratory Standards Institute recommends that isoniazid-monoresistant isolates, as well as other poly-resistant, non-MDR isolates, be tested for second-line drug resistance, this is not universally done in Canada. Other isolates which are not MDR-TB may be resistant to a fluoroquinolone because of the widespread use of these antibiotics for other respiratory infections. To some extent, this limits our understanding of the emergence of second-line resistance within Canada. The demographic and clinical data collected through the CTBLSS are minimal. As such, no differentiation can be made between primary and secondary/acquired drug resistance, nor can differentiation be made between resistance patterns for new cases versus re-treatment cases. However, the Tuberculosis in Canada report also presents case-based data on primary and acquired drug resistance in Canada and, combined with the Tuberculosis: Drug Resistance in Canada Report, provides a comprehensive overview of TB-case and drug-resistance surveillance data from a national perspective.
Data collected to date indicate that the presence of TB drug resistance in Canada is below the global average and that it has remained relatively stable since reporting began. With growing worldwide concern about drug resistance and the emergence of XDR-TB, however, the CTBLSS remains vital to the monitoring of TB drug resistance in Canada.
Acknowledgments
The Surveillance and Epidemiology Division at the Public Health Agency of Canada would like to acknowledge the members of the Canadian Tuberculosis Laboratory Technical Network and their teams, and colleagues at the National Microbiology Laboratory for their contribution to and participation in the Canadian Tuberculosis Laboratory Surveillance System.
Conflict of interest
None.
Funding
This work was supported by the Public Health Agency of Canada.
Page details
- Date modified: