
Screening for tuberculosis, Nunavik Quebec

 Download this article as a PDF
Published by: The Public Health Agency of Canada
Issue: Volume 44-10: Climate change and Lyme disease
Date published: October 4, 2018
ISSN: 1481-8531
Submit a manuscript
About CCDR
Browse
Volume 44-10, October 4, 2018: Climate change and Lyme disease
Outbreak report
Results of a population screening intervention for tuberculosis in a Nunavik village, Quebec, 2015–2016
R Dion1, M Brisson2, JF Proulx2, H Zoungrana2
Affiliations
1 Institut national de santé publique du Québec, Laboratoire de santé publique du Québec, Sainte‑Anne‑de‑Bellevue, QC
2 Department of Public Health, Nunavik Regional Board of Health and Social Services, Kuujjuaq, QC
Correspondence
Suggested citation
Dion R, Brisson M, Proulx JF, Zoungrana H. Results of a population screening intervention for tuberculosis in a Nunavik village, Quebec, 2015–2016. Can Commun Dis Rep 2018;44(10):257-63. https://doi.org/10.14745/ccdr.v44i10a04
Keywords: tuberculosis, Inuit, screening, tuberculin skin test, chest X-ray, latent tuberculosis infection, tuberculosis prophylaxis
Abstract
Background: A small village in Nunavik, Quebec experienced a tuberculosis (TB) outbreak in 2012–2013 and then a resurgence in 2015–2016. Cases were still occurring, despite the fact that contact tracing had already been conducted on one quarter of the population. A decision was taken to conduct large-scale screening of the population for TB.
Objective: To describe the results of a population-based TB screening intervention designed to identify individuals with latent TB infection (LTBI) or active TB requiring treatment.
Methodology: The history of TB infection (either active TB or LTBI, defined as a positive tuberculin skin test result of at least five mm induration) and treatment (considered adequate if at least 80% of prescribed doses were taken) were determined. Those who were two years of age and older and had not been included in contact tracing after June 1, 2015 were included for TB screening (n=1,026 eligible individuals). Screening included a nurse assessment, tuberculin skin test (TST) for those with previous negative TST or of unknown status and chest X-ray for the others.
Results: Of the eligible individuals in the affected village, 1,004 (98%) participated in the screening. Of these, 30% had a history of previous TB infection. A TST screening was administered to 71% of the participants, 10% of whom had positive results. Assessments were performed on 425 participants and 385 underwent a chest X-ray. Fifty-two cases of previously diagnosed active TB and three cases of new active TB were documented. In addition, there were 247 individuals with LTBI who had been previously identified (191 were found to have had adequate LTBI treatment, 56 were found to have had inadequate LTBI treatment) and 69 were identified with de novo LTBI. In addition, 633 participants were found to have no TB infection. There were 125 participants who were referred for LTBI treatment. Follow-up information was available for 120 and 85 (71%) of these completed the treatment.
Conclusion: Within this northern village, which had persistent TB transmission despite classic control measures, population-based screening had a high degree of coverage and was an effective way to detect additional cases of individuals with active TB and those with LTBI.
Introduction
The incidence rate of tuberculosis (TB) among the Inuit is almost 300 times that of non-Aboriginals born in Canada Footnote 1Footnote 2. The determinants of TB and the challenges associated with TB control in Inuit communities include poverty, food insecurity, overcrowded housing, unstable access to culturally-adapted health care, low levels of education, smoking, alcohol and drug abuse and a high prevalence of several chronic medical conditions Footnote 2Footnote 3.
This paper focuses on a recent outbreak of TB in one village in Nunavik, Quebec. Nunavik comprises the northern third of the province of Quebec and is one of the four Inuit regions in northern Canada. Together, these four regions comprise the Nunangat region. The well-established challenges of dealing with TB in remote Inuit populations were similar to those seen in this village. Socio-economic characteristics of this village are typical of most Inuit communities. The vast majority (99.5%) of the population of the village is of Aboriginal (in this case, Inuit) ancestry, and the population is relatively young (35.5% was 14 years of age or younger in 2016) Footnote 4. The housing conditions are poor, with 52% of the housing described as overcrowded and 24% of the housing requiring major repairs Footnote 5. Tobacco use throughout Nunavik is high, with 67% reporting regular use in 2012 Footnote 6. In 2012, 55% of Inuit in the Nunangat region who were 25 years of age or older reported food insecurity. A high percentage of household expenditures in Nunavik were on food (42%) and for low-income households this proportion was even higher. Food insecurity and expense are especially common in the smaller and more remote communities, since planes are the only means of transport linking the villages in all seasons Footnote 7Footnote 8Footnote 9.
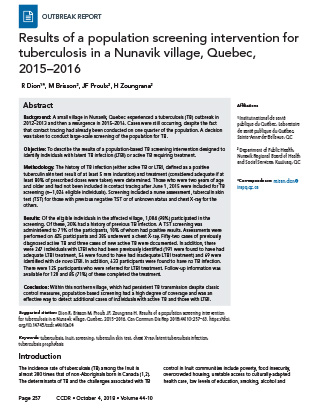
As a result of these challenges, and despite efforts by the public health authorities, the incidence rate of TB has been on the rise in Nunavik since 2008 (Figure 1).
Figure 1: Five-year mean incidence rate of tuberculosis in Nunavik, QC, 1990–2017Figure 1 footnote a
Text description: Figure 1
| Period of receipt of report | Incidence Rate/ 100 000 residents |
|---|---|
| 1990-1994 | 66.1 |
| 1995-1999 | 75.9 |
| 2000-2004 | 51.5 |
| 2005-2009 | 112.2 |
| 2010-2014 | 283.8 |
| 2015-2017 | 283.1 |
The Nunavik village in this study had an outbreak of 31 cases of TB in 2012–2013. This was not a village previously known for TB; no cases had been identified from 1990 to 2006, only one case per year had been identified in 2007 and 2008 and no cases had been identified in 2009. However, a few cases had been identified in the two years prior to the outbreak (five cases in 2010 and eight cases in 2011). Following a concerted public health response, the 2012–2013 outbreak was considered under control in 2014. However, June 2015 saw resurgence, and by September 19, 2015, the cumulative number of detected cases since the beginning of that year was 22. In response to this, the Nunavik Department of Public Health (DPH) and the Inuulitsivik Health Center (IHC) conducted contact tracing that included almost one quarter of the population. In addition, on the recommendation of the Comité sur l’immunisation du Québec (CIQ), bacillusCalmette-Guérin (BCG) vaccination was reintroduced for children younger than two years of age (Groupe de travail sur le vaccin BCG. Avis sur la pertinence de la réintroduction du vaccin BCG au Nunavik pour le contrôle d’une recrudescence de la tuberculose. Document de travail. p 1-86. INSPQ; 2015. Unpublished document).
Despite this extensive contact tracing, additional TB cases were subsequently reported, indicative of persistent transmission.
In light of the fact that new cases were being detected outside of contact tracing, the DPH decided to implement a population-based TB screening program. Beginning on October 19, 2015, the intervention was carried out in collaboration with various stakeholders and partners, including DPH, IHC, the Nunavik Regional Board of Health and Social Services (RBHSS), the Institut national de santé publique du Québec (INSPQ), the Canadian Field Epidemiology Program of the Public Health Agency of Canada (PHAC) and the First Nations and Inuit Health Branch (FNIHB) then with Health Canada (HC). The objectives of the intervention were to enhance community awareness, knowledge and response to TB, detect individuals with active TB and provide prompt treatment to interrupt transmission and detect individuals with new or incompletely treated latent tuberculosis infection (LTBI) and offer LTBI treatment.
The purpose of this article is to describe this population-based screening intervention and identify the additional number of cases of active TB and LTBI it detected, and how many received treatment.
Methodology
Population
The target population included all village residents of at least two years of age after August 15, 2015, who had not already been included in the contact tracing undertaken since June 1, 2015. The population database consisted of a combination of the municipality’s census files, the Municipal Housing Bureau’s household counts, IHC medical records and the DPH’s contact tracing files. From the database, a list of individuals to include in the intervention was established and the values of certain fields on the screening questionnaire were pre-filled.
Definition of terms
A tuberculin skin test (TST) with a positive result (at least five mm induration), in the absence of active TB, was classified as LTBI. This threshold was selected in the context of the ongoing village outbreak. LTBI was further classified as recent (less than two-year interval between a negative and a positive TST at screening, with a difference of at least six mm between both results), new (undetermined date, no previous TST or previous negative TST at least two years previous) or old (positive TST from at least two years previous). Recent and new LTBI were grouped as de novo LTBI. LTBI was assessed as adequately treated if there had been at least an 80% completion of the prophylaxis treatment (number of doses taken divided by the number of doses prescribed). Previous TB infection was defined either as active TB, if the diagnosis was validated as confirmed or probable based on surveillance case definitions Footnote 10, or LTBI documented in the past. Suspected active TB was defined by the presence of any of the following symptoms or clinical signs: unusual cough for equal to or greater than two weeks; persistent fever; significant weight loss (or absence of or delayed weight gain in a growing person); or hemoptysis. A non-specific clinical abnormality was defined as clinical manifestation non-suggestive of active TB but requiring follow-up with a nurse to check for persistence and, if necessary, a medical assessment. Contact tracing was defined as the follow-up of persons in contact with TB cases to identify and treat any secondary cases of TB or LTBI, in order to offer treatment Footnote 3.
Data collection
A standardized questionnaire and user guide was developed for data collection that included the following sections: demographic information; history of TB infection (including active TB or LTBI); clinical nurse assessment; TST (administration and results); chest X-ray; and medical assessment.
A clinical algorithm for the screening procedure was developed by the DPH in collaboration with partners, including pneumologists from the Réseau universitaire intégré de santé at McGill University, Montreal, QC. The screening procedure was then conducted by the Nunavik nurses and included the following steps:
- verification and completion of pre-existing clinical data, medical file number as unique identifier and demographic information (including house civic number);
- verification of history of active TB (with most recent year of onset), of TST and last TST result, diagnosis of LTBI, administration of preventive treatment and its completeness;
- questions on the presence of symptoms and clinical signs suggestive of active TB;
- administration of TST to individuals without a history of TB infection and without symptoms or clinical signs suggestive of active TB;
- reading and documentation of TST results 48–72 hours after its administration;
- referral of individuals with a history of active TB or LTBI and those with a TST screening result of at least five mm for chest X-ray;
- questions on recent exposure (since January 1, 2015) to a hospitalized case of active TB;
- follow-up in the presence of non-specific clinical abnormalities;
- immediate referral to clinical physicians of individuals with symptoms or clinical signs suggestive of active TB for diagnosis and medical follow-up, as appropriate; and
- referral to clinical physicians of individuals with a history of TB infection, or a TST at screening of at least five mm, for diagnosis and decision on next steps.
Screening and referral
The TST test was administered according to the Quebec Immunization Protocol Footnote 11; those that had not been read or had been read more than 72 hours after administration were retaken. The subject was either discharged (normal clinical evaluation and negative TST) or referred to a clinical physician.
Screening started in the secondary school and then continued by neighbourhood and household with people brought to the village’s Local Community Service Center (CLSC), with the help of municipal transportation services.
Analysis
The data were entered into a Microsoft Access 2007 (Redmond, Washington State, US) file and validated by the DPH. The CLSC’s medical records were reviewed at the conclusion of the intervention. Finally, records of individuals identified as candidates for prophylaxis were matched with a database of LTBI treatment follow-ups. The data were analyzed using Epi InfoTM 7.1.5.2 (Centers for Disease Control and Prevention, Atlanta, Georgia, US) Footnote 12 and SPSS 23 (IBM Analytics, Armonk, New York, US) Footnote 13 softwares.
Results
The total population of the village was estimated to be 1,477 (Agence de la santé publique du Canada. Shane A, Born J. Dépistage de la tuberculose en milieu scolaire et dans la population au Nunavik, Québec, du 6 octobre au 13 novembre 2015. p 1-38. ASPC; 2015. Unpublished report). Two groups were excluded from the TB screening: 69 children younger than two years of age who had received BCG vaccine; and 350 individuals who were already covered by the contact tracing. A further 32 individuals were removed for various reasons (including 18 individuals who were living outside the village and 14 who were hospitalized or incarcerated). Thus, the final number of eligible individuals was 1,026. Of these, two refused to participate and 20 could not be reached.
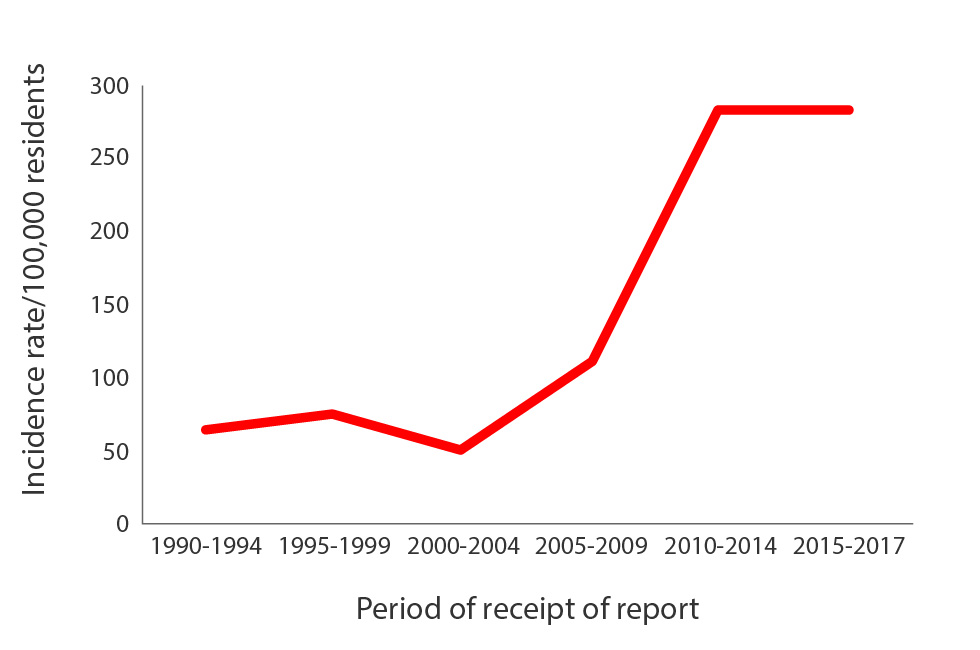
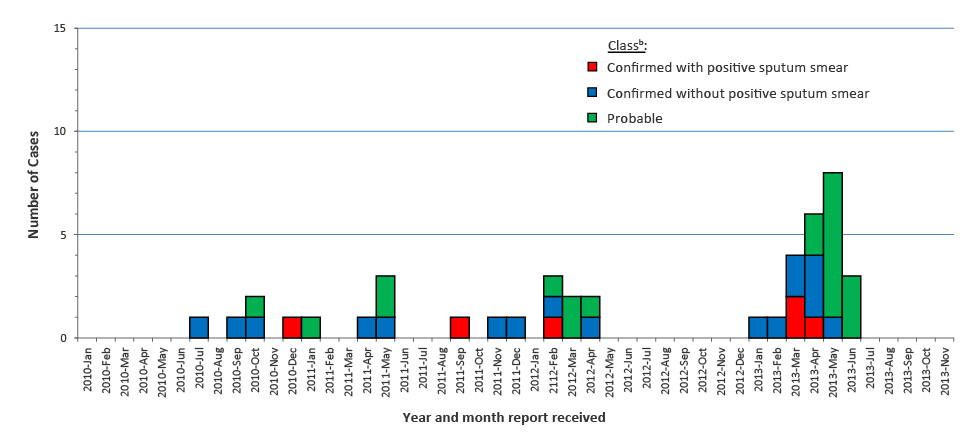
Clinical evaluations were conducted on the remaining 1,004 from October 19, 2015 to March 21, 2016 (Figure 2).
Figure 2: Number of confirmed and probable cases of tuberculosis in a village in Nunavik, QC, by date of notification, 2010–2017Figure 2 footnote a
Text description: Figure 2
| Year-Month report received | Confirmed with positive sputum smear | Confirmed without positive sputum smear | Probable |
|---|---|---|---|
| 2010-Jan | 0 | 0 | 0 |
| 2010-Feb | 0 | 0 | 0 |
| 2010-Mar | 0 | 0 | 0 |
| 2010-Apr | 0 | 0 | 0 |
| 2010-May | 0 | 0 | 0 |
| 2010-Jun | 0 | 0 | 0 |
| 2010-Jul | 0 | 0 | 0 |
| 2010-Aug | 0 | 1 | 0 |
| 2010-Sep | 0 | 0 | 0 |
| 2010-Oct | 0 | 1 | 0 |
| 2010-Nov | 0 | 1 | 1 |
| 2010-Dec | 0 | 0 | 0 |
| 2011-Jan | 1 | 0 | 0 |
| 2011-Feb | 0 | 0 | 1 |
| 2011-Mar | 0 | 0 | 0 |
| 2011-Apr | 0 | 0 | 0 |
| 2011-May | 0 | 1 | 0 |
| 2011-Jun | 0 | 1 | 2 |
| 2011-Jul | 0 | 0 | 0 |
| 2011-Aug | 0 | 0 | 0 |
| 2011-Sep | 0 | 0 | 0 |
| 2011-Oct | 1 | 0 | 0 |
| 2011-Nov | 0 | 0 | 0 |
| 2011-Dec | 0 | 1 | 0 |
| 2012-Jan | 0 | 1 | 0 |
| 2112-Feb | 0 | 0 | 0 |
| 2012-Mar | 1 | 1 | 1 |
| 2012-Apr | 0 | 0 | 2 |
| 2012-May | 0 | 1 | 1 |
| 2012-Jun | 0 | 0 | 0 |
| 2012-Jul | 0 | 0 | 0 |
| 2012-Aug | 0 | 0 | 0 |
| 2012-Sep | 0 | 0 | 0 |
| 2012-Oct | 0 | 0 | 0 |
| 2012-Nov | 0 | 0 | 0 |
| 2012-Dec | 0 | 0 | 0 |
| 2013-Jan | 0 | 0 | 0 |
| 2013-Feb | 0 | 1 | 0 |
| 2013-Mar | 0 | 1 | 0 |
| 2013-Apr | 2 | 2 | 0 |
| 2013-May | 1 | 3 | 2 |
| 2013-Jun | 0 | 1 | 7 |
| 2013-Jul | 0 | 0 | 3 |
| 2013-Aug | 0 | 0 | 0 |
| 2013-Sep | 0 | 0 | 0 |
| 2013-Oct | 0 | 0 | 0 |
| 2013-Nov | 0 | 0 | 0 |
| 2013-Dec | 0 | 0 | 0 |
| 2014-Jan | 0 | 0 | 0 |
| 2014-Feb | 0 | 1 | 0 |
| 2014-Mar | 0 | 0 | 0 |
| 2014-Apr | 0 | 0 | 0 |
| 2014-May | 0 | 0 | 0 |
| 2014-Jun | 0 | 0 | 1 |
| 2014-Jul | 0 | 0 | 0 |
| 2014-Aug | 0 | 0 | 0 |
| 2014-Sep | 0 | 0 | 0 |
| 2014-Oct | 0 | 0 | 0 |
| 2014-Nov | 0 | 0 | 0 |
| 2014-Dec | 1 | 0 | 1 |
| 2015-Jan | 0 | 0 | 0 |
| 2015-Feb | 0 | 0 | 0 |
| 2015-Mar | 0 | 1 | 0 |
| 2105-Apr | 0 | 0 | 0 |
| 2015-May | 0 | 0 | 0 |
| 2015-Jun | 1 | 0 | 1 |
| 2015-Jul | 1 | 1 | 2 |
| 2015-Aug | 0 | 2 | 2 |
| 2015-Sep | 1 | 4 | 6 |
| 2015-Oct | 0 | 3 | 1 |
| 2015-Nov | 1 | 0 | 1 |
| 2015-Dec | 1 | 1 | 1 |
| 2016-Jan | 1 | 0 | 1 |
| 2016-Feb | 0 | 1 | 2 |
| 2016-Mar | 1 | 0 | 1 |
| 2016-Apr | 0 | 0 | 1 |
| 2016-May | 0 | 0 | 0 |
| 2016-Jun | 0 | 0 | 0 |
| 2016-Jul | 0 | 0 | 0 |
| 2016-Aug | 0 | 0 | 0 |
| 2016-Sep | 0 | 0 | 0 |
| 2016-Oct | 0 | 0 | 0 |
| 2016-Nov | 0 | 0 | 0 |
| 2016-Dec | 0 | 0 | 0 |
| 2017-Jan | 0 | 0 | 1 |
| 2017-Feb | 0 | 0 | 0 |
| 2017-Mar | 0 | 0 | 0 |
| 2017-Apr | 0 | 0 | 0 |
| 2017-May | 0 | 0 | 0 |
| 2017-Jun | 0 | 0 | 0 |
| 2017-Jul | 0 | 0 | 0 |
| 2017-Aug | 0 | 0 | 0 |
| 2017-Sep | 0 | 0 | 0 |
| 2017-Oct | 0 | 0 | 0 |
| 2017-Nov | 0 | 0 | 0 |
| 2017-Dec | 0 | 0 | 0 |
Ninety individuals (73.8% of the student population of 122, or 9.0% of the total study group) were screened in schools and 914 (91.0%) were screened in households.
Of the 1,004 participants, 531 (52.9%) were male and 473 (47.1%) were female. Their ages ranged from 20 months to 85 years (mean: 27.0 years; median: 23.0 years), with a similar distribution across both sexes. Six individuals were children younger than two years of age whose parents had previously refused the BCG vaccination.
Fifty-two (7.8%) of the 667 persons for whom the information was available had a history of active TB. The year TB was diagnosed was available for 44 of the cases and ranged from 1955 to 2015. Six hundred and seven people had a record of a previous TST result in their file; 282 (46.5%) of these individuals were TST-positive and of those 235 (83.3%) had a result of at least 10 mm (Table 1).
| TST result (mm) |
Number | Percent (%) |
|---|---|---|
| 0 | 281 | 46.3 |
| 1 to 4 | 44 | 7.2 |
| 5 to 9 | 47 | 7.7 |
| ≥10 | 235 | 38.7 |
| Total | 607 | 100.0Table 1 footnote a |
The proportion of positive results was similar by sex but varied by age, with the maximum among individuals 50 years of age or older, followed by young adults and then adolescents (Figure 3).
Figure 3: Previous tuberculin skin test results: Number at least 5 mm or less than 5 mm and proportion at least 5 mm, by age group in Nunavik, QC (n=607)
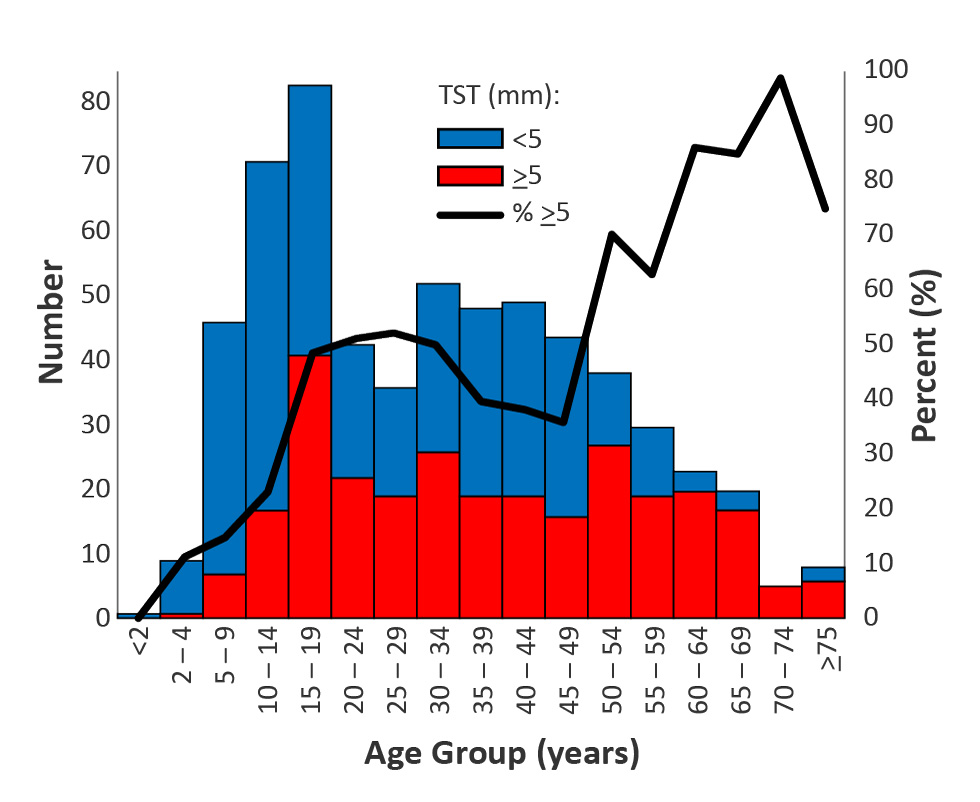
Text description: Figure 3
| Age group (years) | Tuberculin skin test | ||
|---|---|---|---|
| Superior or equal to 5 mm | Inferior to 5 mm | Percentage superior or equal to 5 mm | |
| <2 | 0 | 1 | 0.00 |
| 2 to 4 | 1 | 8 | 11.11 |
| 5 to 9 | 7 | 39 | 15.22 |
| 10 to 14 | 17 | 54 | 23.94 |
| 15 to 19 | 41 | 42 | 49.40 |
| 20 to 24 | 22 | 21 | 51.16 |
| 25 to 29 | 19 | 17 | 52.78 |
| 30 to 34 | 26 | 26 | 50.00 |
| 35 to 39 | 19 | 29 | 39.58 |
| 40 to 44 | 19 | 30 | 38.78 |
| 45 to 49 | 16 | 28 | 36.36 |
| 50 to 54 | 27 | 11 | 71.05 |
| 55 to 59 | 19 | 11 | 63.33 |
| 60 to 64 | 20 | 3 | 86.96 |
| 65 to 69 | 17 | 3 | 85.00 |
| 70 to 74 | 5 | 0 | 100.00 |
| ≥75 | 6 | 2 | 75.00 |
LTBI treatment was considered adequate in 191 (77.3%) of the 247 individuals who had an earlier positive TST and for whom information was available. Including active TB and positive TST (non-mutually exclusive values), 297 (29.6%) of the 1,004 participants had a history of TB infection.
In addition, 47 (4.7%) participants reported one or more symptoms or clinical signs suggestive of active TB, but none of them had been diagnosed with TB.
A screening TST was performed on 713 (71.0%) of the 1,004 participants, 10 of whom were mistakenly redone on individuals who had a positive prior TST; 85 (11.9%) people had a positive result. Of those, 60 (70.6%) had a result of at least 10 mm (Table 2).
| TST result (mm) | Number | Percent (%) |
|---|---|---|
| 0 | 562 | 78.8 |
| 1 to 4 | 66 | 9.3 |
| 5 to 9 | 25 | 3.5 |
| ≥10 | 60 | 8.4 |
| Total | 713 | 100.0 |
Although the proportion of positive results was similar for males and females, it varied by age, peaking among individuals in the 55 to 64-years age group (Figure 4).
Figure 4: Screening tuberculin skin test results: Number at least 5 mm and less than 5 mm and proportion at least 5 mm, by age group in Nunavik, QC (n=713)
Text description: Figure 4
| Age group (years) | Tuberculin skin test | ||
|---|---|---|---|
| Superior or equal to 5 mm | Inferior to 5 mm | Percentage superior or equal to 5 mm | |
| <2 | 0 | 5 | 0.00 |
| 2 to 4 | 2 | 37 | 5.13 |
| 5 to 9 | 3 | 133 | 2.21 |
| 10 to 14 | 11 | 122 | 8.27 |
| 15 to 19 | 8 | 51 | 13.56 |
| 20 to 24 | 10 | 54 | 15.63 |
| 25 to 29 | 7 | 52 | 11.86 |
| 30 to 34 | 11 | 46 | 19.30 |
| 35 to 39 | 5 | 29 | 14.71 |
| 40 to 44 | 7 | 32 | 17.95 |
| 45 to 49 | 7 | 28 | 20.00 |
| 50 to 54 | 2 | 21 | 8.70 |
| 55 to 59 | 10 | 7 | 58.82 |
| 60 to 64 | 2 | 5 | 28.57 |
| 65 to 69 | 0 | 3 | 0.00 |
| 70 to 74 | 0 | 0 | 0.00 |
| ≥75 | 0 | 2 | 0.00 |
The time interval between the administration of the TST and its reading was two days for 650 (91.3%) and three days for 62 (8.7%) of the 712 individuals for whom the dates were known, and were therefore in accordance with the recommended interval for all subjects.
A chest X-ray was performed on 385 (38.3%) participants. The results were reported as abnormal for 103 (26.7%). A detailed report was available for 96 people; one case with active pulmonary TB was diagnosed with a cavitary lesion. A medical assessment was carried out on 394 (39.2%) of participants.
The information was verified and recorded in the clinical records, as of November 12, 2016 (Table 3). There were 55 active TB cases, including 52 previously diagnosed cases and three new cases (two confirmed and one probable) detected by the screening. There were 316 individuals with LTBI, including 247 who had been previously diagnosed, of which 191 (77.3%) had received adequate treatment and 56 (22.7%) who had incomplete treatment, and 69 with de novo LTBI. In addition, 633 participants were found to have no TB infection.
| Status | Number of subjects |
|---|---|
| Active TB | 55 |
|
52 |
|
3 |
LTBI |
316 |
|
69Table 3 footnote a |
|
247 |
|
191 |
|
56Table 3 footnote a |
| No TB infection | 633 |
| Total | 1,004 |
Of the 125 participants who were offered LTBI treatment (including 62 de novo and 56 with a history of incomplete treatment) records were found for 120 (96.0%) (Table 4). Of those, 85 (70.8%) received adequate LTBI treatment; the majority of which (94%) was rifampin, self-administered daily for four months.
| LTBI treatment outcome | Number | Percent (%) |
|---|---|---|
| Completed (took at least 80% of prescribed doses) | 85 | 70.8 |
| Received but degree of completeness unknown | 2 | 1.7 |
| Started but lost during follow-up (moved from the village) | 1 | 0.8 |
| Refused or discontinued by the patient | 13 | 10.8 |
| Discontinued by nursing staff | 16 | 13.3 |
| Discontinued for an unknown reason | 3 | 2.5 |
| Total | 120 | 100.0Table 4 footnote a |
The epidemic curve (Figure 2) indicates that the last case of the 2015–2016 TB outbreak occurred in April 2016, for a total of 39 cases, none of whom died. One sporadic case was reported in January 2017 and two cases were reported in May 2018 (data not shown).
Discussion
Almost the entire population of this Inuit village in Nunavik was assessed for TB, either by contact tracing or by population-based screening. This large-scale intervention, which involved TB screening of over 1,000 individuals, was launched in response to the ongoing spread of the infection despite following the traditional approach to TB control, as outlined and advocated in the Canadian Tuberculosis Standards Footnote 3 and Quebec’s Guide d’intervention contre la tuberculose Footnote 14. As a result, three (8%) of the 39 new active TB cases that were identified during this outbreak were detected by population-based screening. Without this screening these three cases would not have been identified or would only have been identified later. These cases didn’t present symptoms suggestive of TB at the time of their clinical assessment.
A strength of this intervention was that 98% of eligible subjects were screened, which is a remarkable achievement. The high rate of participation was obtained thanks to village engagement, stakeholder involvement and the support of various partners and stakeholders.
This study had two main limitations. The first limitation involved uncertainties about the population data used to determine the subgroup to screen. When the population database was created, none of the available lists was complete. However, by comparing multiple lists it was possible to obtain reasonable approximations for this population. The second limitation involved the lack of consistency and completeness in data collection and entry. The screening questionnaires were not always complete as some information was recorded elsewhere, such as in the medical charts, and some questions and variables were ambiguous or poorly defined. There were many stakeholders involved, which made information sharing difficult. Fortunately, reviewing the information contained in the clinical records helped to improve the accuracy of the data.
Although some elements of the process were evaluated, the impact of the intervention in terms of TB cases avoided was not assessed, as this depends on many other factors. However, a pool of individuals with de novo or past LTBI inadequately treated was identified. These people were then offered prophylaxis to avoid developing the disease and, in turn, becoming infectious.
In terms of next steps, an integrated regional TB surveillance system is currently being developed, which will increase the ability to document TB outbreaks and support contact tracing and follow-up of TB treatment and prophylaxis Footnote 15.
Conclusion
Population-based screening to address an ongoing TB outbreak in a remote village in Nunavik, Quebec was able to reach 98% of the eligible population. It was able identify those individuals who needed treatment and the majority of those who needed it successfully completed their treatment. Such a widespread intervention was possible because of the ability of the villagers and the professional, municipal and village stakeholders to effectively support this village-based action.
This intensive effort identified new requirements for data collection, storage and access, and many of these will be resolved by the new integrated regional TB surveillance system. Such a surveillance system will facilitate the assessment of the impact of TB prevention and control programs in the future.
Authors' statement
RD – Conceptualization, methodology, software, validation, official analysis, data conservation, writing of the first draft, display
MB – Conceptualization, methodology, software, validation, official analysis, surveys, resources, data conservation, writing of the first draft, review and revision of the final version, supervision, project administration
JFP – Conceptualization, methodology, resources, writing – review and revision of the final version, supervision, project administration
HZ – Conceptualization, methodology, validation, surveys, writing – review and revision of the final version
Conflict of interest
None.
Acknowledgements
We would like to thank the following organizations for their contributions to the success of this intervention: Nunavik DPH; Nunavik RBHSS; Réseau universitaire intégré of McGill University; IHC; the village CLSC; HC FNIHB; the INSPQ Direction des risques biologiques et de la santé au travail and Laboratoire de santé publique du Québec; PHAC Canadian Field Epidemiology Program; volunteers, interpreters and village engagement workers; and the village Municipal Council. We would also like to thank Dr. Marie Rochette, Coordinator of Public Health Protection at the Nunavik DPH, for her comments on the draft article.
Funding
This project was made possible thanks to the support of the Institut national de santé publique du Québec and the Nunavik Department of Public Health.