
Archived - Use of satellite data to predict and detect infectious disease outbreaks

 Download this article as a PDF
Published by: The Public Health Agency of Canada
Issue: Volume 45-5: Climate change and infectious diseases: The solutions
Date published: May 2, 2019
ISSN: 1481-8531
Submit a manuscript
About CCDR
Browse
Volume 45-5, May 2, 2019: Climate change and infectious diseases: The solutions
Overview
Using Earth observation images to inform risk assessment and mapping of climate change-related infectious diseases
SO Kotchi1, C Bouchard1, A Ludwig1, EE Rees1, S Brazeau1
Affiliation
1 Public Health Risk Sciences Division, National Microbiology Laboratory, Public Health Agency of Canada, St. Hyacinthe, QC
Correspondence
Suggested citation
Kotchi SO, Bouchard C, Ludwig A, Rees EE, Brazeau S. Using Earth observation images to inform risk assessment and mapping of climate change-related infectious diseases. Can Commun Dis Rep 2019;45(5):133–42. https://doi.org/10.14745/ccdr.v45i05a04
Keywords: Earth observation images, climate change, risk mapping, infectious diseases, tick-borne diseases, mosquito-borne diseases, remote sensing, environmental determinants, climatic determinants, Canada
Abstract
The number of human cases of several climate-related infectious diseases, including tick- and mosquito-borne diseases, has increased in Canada and other parts of the world since the end of the last century. Predicting and mapping the risks associated with these diseases using environmental and climatic determinants derived from satellite images is an emerging method that can support research, surveillance, prevention and control activities and help to better assess the impacts of climate change in Canada. Earth observation images can be used to systematically monitor changes in the Earth’s surface and atmosphere at different scales of time and space. These images can inform estimation and monitoring of environmental and climatic determinants, and thus disease prediction and risk mapping. The current array of Earth observation satellites provides access to a large quantity and variety of data. These data have different characteristics in terms of spatial, temporal and thematic precision and resolution. The objectives of this overview are to describe how Earth observation images may inform risk assessment and mapping of tick-borne and mosquito-borne diseases in Canada, their potential benefits and limitations, the implications and next steps.
Introduction
Climate change has resulted in rising temperatures and ocean levels, increased climatic variability, and changes in the frequency and intensity of precipitationFootnote 1Footnote 2. Evidence of climate change started in Canada in the 1950sFootnote 3Footnote 4Footnote 5Footnote 6 and the average temperature has increased more than 1.5°C between 1950 and 2010—almost double the global averageFootnote 7. The extent of this change has varied by region, with the most significant changes occurring in northern Canada and especially in the ArcticFootnote 8. The average humidity levels in Canada have also increased, with an average increase in precipitation of about 12%Footnote 8. These trends are likely to continue, with an increase in the intensity and frequency in extreme weather events such as heat waves, droughts, floods and forest firesFootnote 5Footnote 6Footnote 8Footnote 9Footnote 10. Urbanization, and its creation of heat islands, has contributed to these climate changesFootnote 11.
Climate has a direct impact on the movements of human populations and infectious disease vectors, such as ticks and mosquitoes, and their host populationsFootnote 12Footnote 13. Increased temperature and climate variability are leading to an increase and geographic expansion of vector populations and the diseases that they transmitFootnote 1Footnote 7Footnote 11Footnote 14Footnote 15Footnote 16Footnote 17Footnote 18Footnote 19Footnote 20Footnote 21Footnote 22. The northern expansion of ticks, for example, has been demonstrated in numerous studies and has been associated with a steady increase in the number of human cases of Lyme diseaseFootnote 23Footnote 24Footnote 25. One study predicted that West Nile virus is likely to increase more than 17-fold by 2050Footnote 26. With the northward expansion of the Aedes albopictus mosquito in the United States (US)Footnote 27Footnote 28, North America may be at risk for exotic mosquito-borne diseases (MBDs) such as dengue, Zika, yellow fever and chikungunya viruses. Other tick-borne diseases (TBDs) and MBDs are likely to increase or emerge in Canada as global warming occursFootnote 26Footnote 27Footnote 29Footnote 30Footnote 31.
In light of the interplay between climate change and vector-borne diseases, it is increasingly important to be able to measure changes in temperature, precipitation and other variables related to habitat. Canada is a huge country, and current surveillance strategies are not designed to monitor the impact of climate change on the geographic spread of TBDs and MBDs. Earth observation tools are increasingly being used to increase our capacity to do so. Earth observation refers to the acquisition, processing, analysis, interpretation and dissemination of physical, chemical and biological information on land, oceans and the atmosphere by using satellite, airborne or in situ remote sensing sensors. Remote sensing technologies, which measure the properties of an object by means of electromagnetic waves, can be used in combination with many other terrestrial sensors, such as weather stations and balloon-probesFootnote 32.
This overview focuses on Earth observation images acquired by remote sensing satellites. Earth observation images and their derivatives provide data related to temperature, precipitation, humidity, forest, wetlands, agriculture, built environments and more. A number of studies have demonstrated the effectiveness of Earth observation images and their derivatives for risk assessment and mapping of TBDs and MBDs around the world. The Malaria Atlas Project (MAP)Footnote 33Footnote 34, the Epidemic Prognosis Incorporating Disease and Environmental Monitoring for Integrated Assessment (EPIDEMIA)Footnote 35 and the Mapping Malaria Risk in Africa (MARA)Footnote 36Footnote 37 are examples of monitoring programs based on the use of Earth observation images and their derivatives. In light of this, the use of Earth observation images to track TBDs and MBDs, and assess the geographic and climactic conditions for their spread, has been applied in Canada. The objectives of this overview are to describe how Earth observation image may inform risk assessment and mapping for the surveillance of TBD and MBD in Canada; summarize their potential benefits and limitations and identify the implications and next steps.
Earth observation images for risk assessment and mapping
Earth observation images are obviously not used to directly observe ticks and mosquitoes inside their habitats. Instead, Earth observation images are used to derive data on variables and indicators that serve to characterize the environmental and climatic determinants (ECD) that influence the presence and the development of ticks and mosquitoes. The ECD data is derived from Earth observation images through several processing and analyses methods, including geometric, radiometric and atmospheric corrections and image classification analyses. The resultant ECDs include surface temperature, air temperature, soil moisture, surface moisture, atmospheric water vapor, air humidity, amount of precipitation, topography, snow cover and thickness, soil type, vegetation type and density, vegetation indices, flooded areas, wetlands, water quality parameters (such as chlorophyll concentration, dissolved organic matter, suspended sediments, color, salinity), forests, urban and built-up areas and agricultural areasFootnote 33Footnote 38Footnote 39Footnote 40. Thus, many ECDs derived from Earth observation images are important determinants of TBDs and MBDs vectors survival and abundance. Table 1 lists some of the most commonly used Earth observation satellites, their sensors, and their derivatives.
| Satellite name | Sensor | Spatial Res | Temp Res | Derivative environmental and climatic determinants | ||||||||||
|---|---|---|---|---|---|---|---|---|---|---|---|---|---|---|
| Land cover | Soil type | Veg type | Veg quantity | Snow cover depth | Water quality | Surface humidity | Surface Temp° | Air Temp° | Water vapour | Prec | ||||
| Aqua | AIRS | 2.3–41 km | 0.5 day | - | - | - | - | - | - | - | Y | Y | - | - |
| DMSP | SSM/I | 13–69 km | 1 day | - | - | - | - | Y | - | - | - | - | Y | Y |
| GCOM-W1 | AMSR-2 | 3–62 km | 1 day | - | - | - | - | Y | Y | - | - | - | Y | Y |
| GPM | DPR | 5 km | 1–2 hours | - | - | - | - | - | - | - | - | - | - | Y |
| GPM | GMI | 4–32 km | 1–2 hours | - | - | - | - | - | - | - | Y | - | Y | Y |
| Landsat-5 | TM | 30–120 m | 16 days | Y | Y | Y | Y | Y | - | Y | Y | - | - | - |
| Landsat-7 | ETM+ | 15–60 m | 16 days | Y | Y | Y | Y | Y | - | Y | Y | - | - | - |
| Landsat-8 | OLI | 15–30 m | 16 days | Y | Y | Y | Y | Y | - | - | - | - | - | - |
| Landsat-8 | TIRS | 100 m | 8 days | - | - | - | - | - | - | - | Y | - | Y | - |
| MSG | SEVIRI | 1–4.8 km | 15 min | - | - | - | Y | - | - | Y | Y | - | Y | Y |
| NOAA 15-19 | AVHRR/3 | 1.1 km | 0.5 day | Y | - | - | Y | Y | - | Y | Y | - | Y | - |
| Sentinel-1 | C-SAR | 5–100 m | 12 days | Y | - | Y | Y | Y | - | - | - | - | - | - |
| Sentinel-2 | MSI | 10–60 m | 5 days | Y | Y | Y | Y | Y | - | - | - | - | - | - |
| Sentinel-3 | OLCI | 300 m | 2 days | Y | - | - | Y | - | Y | - | - | - | - | - |
| Sentinel-3 | SLSTR | 500–1000 m | 1–4 days | - | - | - | Y | Y | - | - | Y | - | - | - |
| SMAP | MWR | 40 km | 1.5 days | - | - | - | - | - | Y | Y | - | - | - | - |
| SNPP | ATMS | 16–75 km | 0.5 day | - | - | - | - | - | - | Y | - | Y | - | - |
| SNPP | VIIRS | 375–750 m | 6 min | - | - | - | Y | Y | - | Y | Y | - | Y | - |
| Terra | ASTER | 15–90 m | 5 days | Y | Y | - | Y | Y | - | - | Y | - | Y | - |
| Terra, Aqua | MODIS | 250–1000 m | 5 min | Y | Y | Y | Y | Y | Y | Y | Y | Y | Y | - |
Mosquito-borne diseases
Environmental and climatic determinants of MBDs include both anthropogenic environments (such as urban, peri-urban and rural areas) and natural environments (such as forests and wetlands)Footnote 7Footnote 17Footnote 49Footnote 50Footnote 51Footnote 52. The ECDs include climatic and microclimatic factors that are known to affect the spread of mosquito-borne disease, such as temperature, humidity and precipitationFootnote 17Footnote 20Footnote 52Footnote 53Footnote 54. There are also specific ECDs for specific mosquito species. Some species, such as Aedes albopictus (that spreads dengue, chikungunya and Zika viruses) or Culex pipiens (that spreads West Nile virus), are highly adapted to urban environments. Other species, such as Culiseta melanura (that spreads Eastern equine encephalitis), are specific to natural wetlands and are found only in rural areas.
Tick-borne diseases
The ECDs of tick-borne diseases also vary by species. The Lyme disease vector, Ixodes scapularis, has evolved within temperate forest biomes (mixed hardwood) in North America, while the Powassan virus vector, Ixodes cookei, lives primarily in burrows and more rarely on vegetation. Historically, changes in the distribution of various types of habitat and host species have been associated with changes in the distribution and abundance of ticksFootnote 55. Tick-borne disease ECD include the type and density of forest cover and degree of forest fragmentation, as well as the prevailing temperature and humidity conditions in the forest habitatsFootnote 12Footnote 13Footnote 17Footnote 56Footnote 57Footnote 58Footnote 59Footnote 60Footnote 61Footnote 62Footnote 63.
Risk assessment
The ECDs derived from Earth observation images have been used to assess the risks associated with different climate-related diseasesFootnote 49Footnote 50Footnote 52Footnote 64Footnote 65Footnote 66Footnote 67Footnote 68Footnote 69. The possibility of human infection depends on a series of risks: the risk that the relevant vectors are present in the environment; the risk that those vectors are infected with a pathogen; the risk that human populations are exposed to those infected vectors; and the risk of disease transmission. The ECDs, derived from Earth observation image, combined with surveillance data, are used to assess, model and map these different risk components. Earth observation images and their derivatives can be used to map risk on a regular basis once the risk model based on those data has been developed and validated.
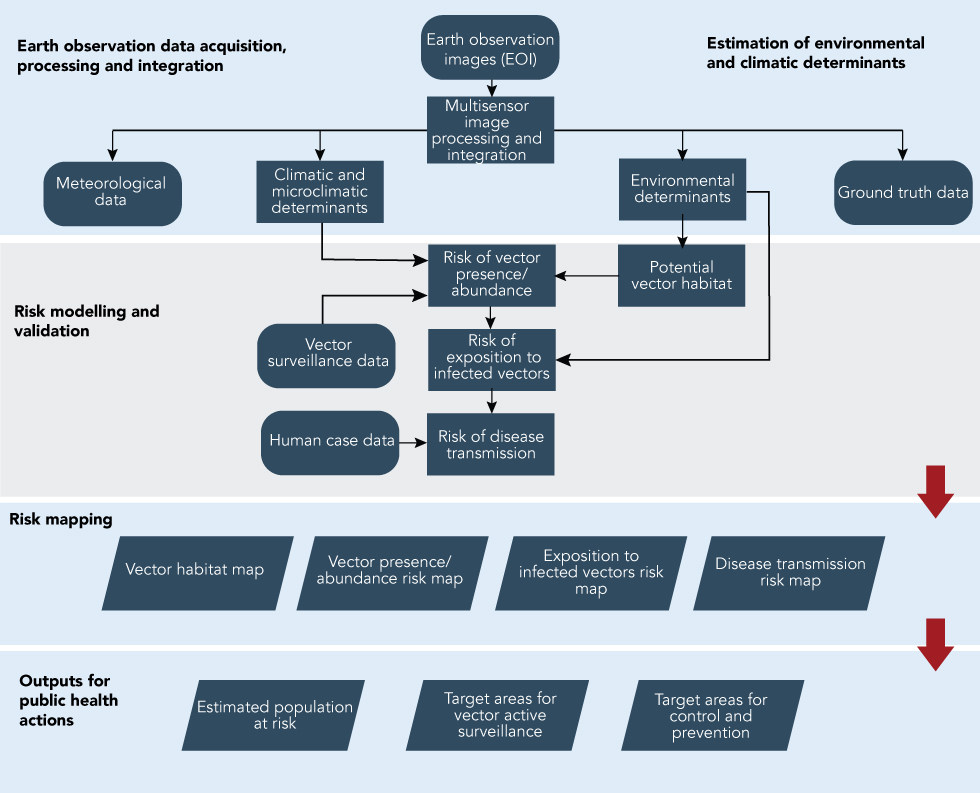
The most common use of Earth observation images for risk assessment and mapping is that of environmental risk associated with the presence or abundance of ticks and mosquitoes. The ECDs derived from Earth observation images can also be combined with human case data to directly assess and map the risk of disease transmission. Figure 1 presents an example of an Earth observation-informed operational framework that can be used for climate-related infectious diseases risk assessment and mapping.
Figure 1: Earth observation-informed operational framework for climate-related infectious diseases risk assessment and mapping
Text description: Figure 1
Figure 1: Earth observation-informed operational framework for climate-related infectious diseases risk assessment and mapping
This figure is a concept map diagram that shows the earth observation-informed operational framework for climate-related infectious diseases risk assessment and mapping.
The figure is divided into four row sections:
First Section: Earth observation data acquisition, processing and integration, and estimation of environmental and climatic determinants:
- Earth Observation Images (EOI) (Acquired by different satellites and sensors)
- Multisensor Image Processing and Integration (in order to have analysis ready data)
- Climatic and microclimatic determinants (derives from processed and integrated multisensor EOIs and Meteorological Data)
- Environmental determinants (derives from processed and integrated multisensor EOIs and Ground Truth Data)
- Multisensor Image Processing and Integration (in order to have analysis ready data)
Second Section: Risk modelling and validation:
- Potential Vector Habitat (derives from Environmental Determinants)
- Risk of Vector Presence / Abundance (derives from Climatic and Microclimatic Determinants and Vector Surveillance Data as well as Potential Vector Habitat)
- Risk of Exposition to Infected Vectors (derives from Environmental Determinants and Risk of Vector Presence / Abundance)
- Risk of Disease Transmission (drives from Human Case Data and Risk of Exposition to Infected Vectors)
- Risk of Exposition to Infected Vectors (derives from Environmental Determinants and Risk of Vector Presence / Abundance)
Third Section: Risk Mapping
- Vector Habitat Map
- Vector Presence / Abundance Risk map
- Exposition to Infected Vectors Risk map
- Disease transmission Risk map
Forth Section: Outputs for public health actions
- Estimated Population at Risk
- Target Areas for Vector Active Surveillance
- Target Areas for Control and Prevention
Benefits and limitations
The use of Earth observation images and their derivatives to estimate ECDs and to map the risk of transmission of climate-related infectious diseases combines numerous advantages that cannot be matched by any other types of dataFootnote 17Footnote 22Footnote 70Footnote 71. There are at least five potential benefits of using Earth observation images to inform public health risk assessment for vector-borne diseases in Canada.
First, Canada is a vast country that is not currently covered by field observation data use in traditional surveillance methods (e.g. trapping and analyzing density and type of mosquitoes or mapping out tick habitat by checking for ticks). These traditional surveillance data generally cover only a limited number of surveillance sites, which are unevenly distributed across provinces. In contrast, the Earth observation images cover continuous surfaces of the country, where each point of the observed territory is a “surveillance site”. In addition, these images can cover large geographic areas such as Canada in a timeframe (minutes, hours and days, depending on the satellite used) that cannot be achieved by traditional surveillance methods.
Second, Canada has many remote regions that are difficult to access. These regions are covered by Earth observation images in the same way as the rest of the country. This offers the unique advantage of being able to continuously monitor even the more remote regions. This is particularly important in Canada, as some of these remote regions, such as the Arctic, are being disproportionately affected by climate change.
Third, in a related benefit, the use of Earth observation images would address the high cost of active surveillance over a large geographical area. Earth observation images acquired by multiple satellites are freely accessible via open data platforms or are accessible at low-cost. In Canada, there is a large amount of ready-to-use Earth observation image derivative data. These data are produced by federal departments, such as Agriculture and Agri-Food Canada, Natural Resources Canada and Environment and Climate Change Canada. They are freely available via the open government web site (https://open.canada.ca/en/open-data).
Fourth, active surveillance methods and protocols vary according to projects, years, programs and jurisdictions. This variability renders it difficult to make comparisons by time and place. In contrast, the Earth observation images are acquired on a standardised and regular basis. This enables comparisons of signal detections (e.g. abnormal situations and alerts) in a more efficient manner across the country.
Fifth, Earth observation satellites can be mobilized quickly to support real-time emergency operations in the event of major disasters that pose public health risks. For example, in the case of flooding, Earth observation images can be used to delineate and monitor risk areas where mosquito-control activities may be needed. The International Charter on Space and Major DisastersFootnote 72 was established to facilitate the mobilization of Earth observation satellites from various space agencies to support emergency operations related to major disasters. This charter was first activated for an infectious disease event during the Ebola outbreak in West Africa in 2014Footnote 73. The benefits of using Earth observation images and their derivatives are summarized in Table 2.
| Advantage | Description |
|---|---|
| Accurate, regular measurements at different spatial and temporal resolutions | Compared with data acquired on the ground, the homogeneity and regularity of observations made using Earth observation images permit more accurate measurement of changes occurring over time, such as environmental and climatic changes. These measurements are made at different spatial and temporal resolutions which allow for the observation of phenomena (e.g. vector habitats, microclimatic conditions) and their changes according to a varied spectrum of measurement scales ranging from 0.31 m to over 75 km, and temporal observation frequencies ranging from 5 minutes to 16 days. This multi-scale observation capacity offered by Earth observation images is unique and makes it possible to estimate ECD and to map risk on local, regional and global scales according to the public health objectives. |
| High spatial density of observations, combined with coverage of vast territories, remote regions and areas difficult to access | The measurements made using Earth observation images are continuous data covering the entire geographic area covered by the sensor. ECDs can be estimated and low-risk or high-risk areas identified for any part of the territory. Earth observation image cover immense territories that cannot be sampled with ground data. Most Earth observation satellites can pick up images covering the entire planet, including remote regions and geographic areas difficult to access. This is very useful in supporting public health initiatives that target remote communities. |
| Recurrence of observations over a long period | Earth observation images have been acquired recurrently for nearly 40 years. The observation capacity for any given territory over long periods offers a great opportunity to study and predict the impact of climate change on the emergence and re-emergence of climate-related diseases. |
| Ready-to-use Earth observation image derivatives | Many ready-to-use products have been developed from Earth observation images to make these data accessible to a broader community of persons not expert in the processing and analysis of Earth observation images. These products relate to both environmental determinants and climatic determinants. |
| Low-cost access to vast amounts of data | There are over 1,700 Earth observation satellites in operationFootnote 74. Earth observation images from many of these satellites are accessible free of charge via open data platforms, as are the majority of Earth observation image derivatives. The majority of commercial Earth observation images involve data with very high spatial resolution (less than 2 m). Costs associated with these data are dropping quickly with the increase in Earth observation systems and the improvement of their performance. |
| Speed of mobilization of many satellites to support emergency operations | Under the International Charter on Space and Major DisastersFootnote 72, satellites and services can be rapidly mobilized by numerous space agencies to support the management of emergencies in major disaster zones. They offer the ability to quickly assess risks of epidemics in these zones in a context where the number of major disasters is rising with climate change. The Charter has been operational since the year 2000. It was activated to support responses related to the outbreak of the Ebola virus in West Africa in 2014Footnote 73. This marked the first time the Charter was activated for the management of an infectious disease. |
Limitations
There are a number of limitations to consider with the use of Earth observation images and their derivatives.
First, Earth observation image derivatives were originally developed for other fields of application, including agriculture, forestry, and nature conservation and these data quality indicators were primarily intended to respond to the application objectives for which they were created. This means there is a lack of specific Earth observation image derivatives developed for targeted infectious diseases like TBDs and MBDs. As a result, several data quality indicators (geographic coverage, spatial resolution, temporal resolution, temporal aggregation scale, update frequency, archiving period, composition of thematic classes, and data accuracy) of common Earth observation images and their derivatives do not meet data quality criteria needed for the estimation of ECDs associated to climate-related infectious diseases.
Second, the most used Earth observation images for the estimation of climatic and microclimatic determinants rarely have both high spatial and temporal resolution. For example, surface temperature and soil moisture can vary a good deal by place and over time. The Earth observation images that are used to calculate them do not allow for the combination of a high spatial resolution (less than 30 m) with a high temporal resolution (less than one day)Footnote 17Footnote 68Footnote 75; however, this combination is necessary to characterize the dynamics of the microclimatic conditions and vectors’ microhabitats. Thus, these data do not always allow for control and prevention activities at a local scale (e.g. for a municipality).
Third, the use of Earth observation images and their derivatives to estimate ECDs on a fine scale and to produce risk maps over long periods and over large geographic areas generates a huge amount of data. The classic methods and technologies used for processing, analyzing, storage and management of such big data are currently limited.
These and other limitations associated with the use of Earth observation images and their derivatives are summarized in Table 3.
| Limitation | Description |
|---|---|
| Coarse spatial resolution | The spatial resolution expresses the size of the smallest detail that can be observed in the image. A spatial resolution less than 30 m is generally recommended for mapping applications on a local scale. Earth observation images and their derivatives relating to climatic and microclimatic determinants have generally a coarse spatial resolution (more than 1000 m). |
| Low temporal resolution | Temporal resolution expresses the temporal frequency at which a satellite acquires Earth observation images for a same area. Bimonthly temporal resolution (16 days) is appropriate for Earth observation images used to estimate land cover environmental determinants. For Earth observation images that are used to estimate microclimatic determinants, a temporal resolution that can serve to establish daily averages would be more appropriate. However, commonly used free-access Earth observation images with a high spatial resolution (e.g. Landsat-8 images) do not have this temporal resolution. |
| Unknown or low accuracy | Climate change projections indicate temperature increases of 1°C to over 5°C in high latitudes, from the 1950sFootnote 76Footnote 77. An uncertainty below 1°C would be appropriate for Earth observation images and their derivatives related to temperature. Metadata of numerous Earth observational image derivatives do not indicate their accuracy, and the accuracy within any given Earth observation image derivatives can be highly variable and is generally not available. |
| Incomplete land cover classes composition | An Earth observation image derivative of environmental determinants must contain all the land cover classes representing environmental determinants of interest. However, the composition of land cover classes of a given Earth observation image derivative depends on its producer and the objectives of creating it. And, there is not a specifically-developed Earth observation image derivative to estimate all the ECDs of every climate-related infectious disease. |
| Inappropriate temporal aggregation scale | Temporal aggregation scale is the time step that is used to aggregate multi-temporal data. The aggregation scales that are mostly used for Earth observation image derivatives are daily, weekly, monthly and annual averages. The temporal aggregation scale to be used will depend on the vectors of the disease. The lifecycle of MBD vectors is very short (a few days to a few months), compared with that of TBD vectors (several years). A weekly scale is more appropriate in the first case and an annual scale in the second. However, for some ECDs, there are no Earth observation image derivatives with the target temporal aggregation scales (e.g. annual accumulation of surface degree-days, derived from land surface temperature images). |
| Long periods between updates | An annual update frequency is generally appropriate for Earth observation image derivatives used to estimate environmental determinants. However, several of these products are not updated annually. |
| Short archiving period | A relatively long archiving period—more than 15 or 30 years—may be necessary to study the evolution of infectious disease risks in the context of climate change. However, the archiving period of several Earth observation images and their derivatives is not long enough to study the impact of climate change on infectious diseases. |
| Incomplete geographic coverage | Risk assessment and risk mapping of infectious disease at borders often requires data covering several different administrative areas (e.g. Quebec/Ontario; Canada/United States). |
| Traditional methods and tools not adapted for massive Earth observation image data | An Earth observation image dataset covering a huge country like Canada, with a high spatial resolution, a high temporal resolution, frequent updates, and a long archiving period, will generate massive data for whose traditional methods and tools for Earth observation image data processing and management are not appropriate. |
Discussion
Climate change is facilitating the emergence and re-emergence of tick-borne and mosquito-borne diseases in Canada. The use of ECDs derived from Earth observation images makes it possible to map the geographic expansion of these vectors and assess their disease risks. Currently, Earth observation images can cover all the urban, rural and remote regions of Canada in a standardized way on a regular basis at various spatial and temporal resolutions. However, the accuracy of Earth observation image derivatives is often not well known.
The accuracy of a risk mapping depends largely on the quality of the data used to model the risk and to produce the risk map. Improvements are being developed to derive better quality Earth observation image derivatives. For example, Earth observation images with different characteristics (including spatial resolution and spectral bands) have been combined via image fusion or downscaling methods to produce value-added Earth observation image derivatives that can meet the quality criteria required to estimate ECDs. For example, when land surface temperature (LST) images from Landsat-8’s Thermal Infrared Sensor (100 m, 16 days) are combined with LST images from the Moderate Resolution Imaging Spectroradiometer (MODIS) (1000 m, 5 minutes), 8-day averages of LST images can be derived with a spatial resolution of 100 mFootnote 78. Using multisensor or multiproduct data combination, there are almost infinite possibilities for the estimation of ECDs and climate-related infectious diseases risk assessment and mapping in a context of rapid environmental change and increased climatic variability. Also, there is a need to apply artificial intelligence approaches to processing and analyzing the big data derived from combining data from multiple satellites. By doing so, it would be possible to create an Earth observation-informed operational framework for rapid risk assessment and mapping (EO-OFRAM) of climate-related infectious diseases. Such a platform would be fully automated and have an easy-to-use user interface that integrates monitoring data and other contextual data, and could be used to answer questions, visualize responses on maps, and produce status reports to inform public health action.
The authors are currently working with their academic and governmental partners to develop improved microclimatic indicators, vector microhabitat indicators and a data integration and fusion system. These innovative tools will improve the accuracy of ECDs estimation and support dynamic multi-scale risk assessment and risk mapping of climate-related infectious diseases via the EO-OFRAM. Under the Innovative Solutions Canada Program, the Public Health Agency of Canada has issued a challenge to industry regarding the processing and analysis of big dataFootnote 79. Better processing and analysis of big data, including the application of innovative machine learning techniques (a subset of artificial intelligence), will enable the better use of the large volume of data produced by Earth observation images. The application of an artificial intelligence-enabled EO-OFRAM in public health depends on its effectiveness in assessing risk in different environments and at different levels of decision-making (local, provincial/territorial and national). The creation of an EO-OFRAM aims to equip and optimize monitoring as well as control and prevention activities at these three levels of governance. The major challenges of such an initiative are funding, the participation of public health from different levels of government and the development of common standards.
Conclusion
The risks associated with emerging climate-related infectious diseases are highly variable for different geographic regions over time. Earth observation images and their derivatives offer numerous advantages for characterizing this heterogeneity through the estimation of the environmental and climatic determinants and the mapping of climate-related infectious disease risks. With the development and application of improved approaches to process and analyze big data derived from Earth observation images, including machine learning, as well as the development of vector microhabitat and microclimatic indicators, the determinants derived from these Earth observation images offer some innovative tools to advance our risk modelling and mapping capacity to better support public health action again vector-borne diseases.
Authors’ statement
- SOK — Conceptualization, investigation, writing-original draft, review and editing
- CB — Writing-original draft, review and editing
- AL — Writing-original draft, review and editing
- EER — Writing-original draft, review and editing
- SB — Writing-original draft, review and editing
Conflict of interest
None.
Funding
This work was supported by the Public Health Agency of Canada and the Canadian Space Agency.
