
Epidemiology of deceased cases of COVID-19

 Download this article as a PDF
Published by: The Public Health Agency of Canada
Issue: Volume 46–10: Laboratory Biosafety
Date published: October 1, 2020
ISSN: 1481-8531
Submit a manuscript
About CCDR
Browse
Volume 46–10, October 1, 2020: Laboratory Biosafety
Rapid communication
Descriptive epidemiology of deceased cases of COVID-19 reported during the initial wave of the epidemic in Canada, January 15 to July 9, 2020
Public Health Agency of Canada COVID-19 Surveillance and Epidemiology Team1
Affiliation
1 Public Health Agency of Canada, Ottawa, ON
Correspondence
Suggested citation
Public Health Agency of Canada COVID-19 Surveillance and Epidemiology Team. Descriptive epidemiology of deceased cases of COVID-19 reported during the initial wave of the epidemic in Canada, January 15 to July 9, 2020. Can Commun Dis Rep 2020;46(10):344–8. https://doi.org/10.14745/ccdr.v46i10a06
Keywords: COVID-19, Canada, mortality, epidemiology, case fatality rate
Abstract
This rapid communication describes deaths among cases of coronavirus disease 2019 (COVID-19) in Canada by province and territory and by case characteristics. Of the 106,804 cases of COVID-19 reported in Canada as of July 9, 2020, 8,749 resulted in death, which represents a mortality rate of 23.3 per 100,000 population, and a case fatality rate (CFR) of 8.2%. Within Canada, the CFR ranged from 0% to 10.0% by province and territory, with the differences likely reflecting differences in the extent of the epidemic within each jurisdiction, and where and among whom localized outbreaks occurred (e.g. outbreaks in long term care homes, affecting older individuals with multi-morbidities). The CFRs increased with age and with the number of pre-existing medical conditions, and among residents of long term care and seniors’ homes. Plans are underway to collect more detailed information on cases, including race and ethnicity, which will add to our understanding of the communities most impacted by COVID-19. Studies of excess mortality, a measure of the number of people who died from any cause as compared with the historical average, will help to clarify the full impact of COVID-19 within Canadian jurisdictions.
Introduction
By early July 2020, Canada had successfully flattened the initial wave of the coronavirus disease 2019 (COVID-19) pandemic, bringing the average number of reported daily cases down from a peak of 1,600 in the last week of April to 290 cases in the week leading up to July 9, 2020. Tragically, during this initial wave, Canada reported the 20th highest crude mortality rate in the world as of July 9, 2020Footnote 1. This rapid communication describes deaths among COVID-19 cases, using available data reported during this initial wave from January 1, 2020 to July 9, 2020, to inform action to minimise deaths due to COVID-19 moving forward.
Current situation
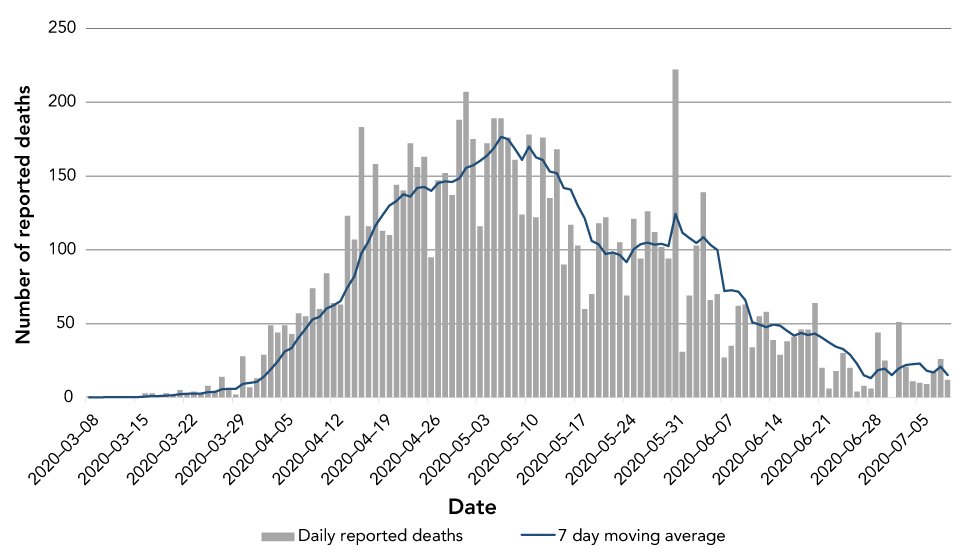
As of July 9, 2020, 106,804 cases of COVID-19 have been reported in Canada, and the number of reported deaths among these cases was 8,749. The number of deaths reported daily increased steadily from the end of March to a peak in early May; an average of 177 deaths was reported daily between April 30 and May 6. The daily number of reported deaths steadily declined thereafter and in the week leading up to July 9, 2020, an average of 15 deaths was reported daily (Figure 1). This parallels the trend in the number of cases reported daily that was observed two to three weeks earlier. This was expected, since COVID-19-related deaths represent infections that occurred several weeks priorFootnote 2Footnote 3Footnote 4.
Figure 1: Daily reported deaths among cases of COVID-19 in Canada and seven day moving-average, March 8 to July 9, 2020 (N=8,749)Figure 1 footnote a
Text description: Figure 1
Figure 1: Daily reported deaths among cases of COVID-19 in Canada and seven day moving-average, March 8 to July 9, 2020 (N=8,749)Figure 1 footnote a
| Date | Number of reported deaths | |
|---|---|---|
| Daily reported deaths | Seven day moving average | |
| 2020-03-08 | 1 | 0.1 |
| 2020-03-09 | 0 | 0.1 |
| 2020-03-11 | 1 | 0.3 |
| 2020-03-12 | 0 | 0.3 |
| 2020-03-13 | 0 | 0.3 |
| 2020-03-14 | 0 | 0.3 |
| 2020-03-15 | 0 | 0.3 |
| 2020-03-16 | 3 | 0.6 |
| 2020-03-17 | 3 | 1 |
| 2020-03-18 | 1 | 1 |
| 2020-03-19 | 3 | 1.4 |
| 2020-03-20 | 1 | 1.6 |
| 2020-03-21 | 5 | 2.3 |
| 2020-03-22 | 2 | 2.6 |
| 2020-03-23 | 4 | 2.7 |
| 2020-03-24 | 3 | 2.7 |
| 2020-03-25 | 8 | 3.7 |
| 2020-03-26 | 4 | 3.9 |
| 2020-03-27 | 14 | 5.7 |
| 2020-03-28 | 6 | 5.9 |
| 2020-03-29 | 2 | 5.9 |
| 2020-03-30 | 28 | 9.3 |
| 2020-03-31 | 7 | 9.9 |
| 2020-04-01 | 13 | 10.6 |
| 2020-04-02 | 29 | 14.1 |
| 2020-04-03 | 49 | 19.1 |
| 2020-04-04 | 44 | 24.6 |
| 2020-04-05 | 49 | 31.3 |
| 2020-04-06 | 43 | 33.4 |
| 2020-04-07 | 57 | 40.6 |
| 2020-04-08 | 55 | 46.6 |
| 2020-04-09 | 74 | 53 |
| 2020-04-10 | 60 | 54.6 |
| 2020-04-11 | 84 | 60.3 |
| 2020-04-12 | 64 | 62.4 |
| 2020-04-13 | 63 | 65.3 |
| 2020-04-14 | 123 | 74.7 |
| 2020-04-15 | 107 | 82.1 |
| 2020-04-16 | 183 | 97.7 |
| 2020-04-17 | 116 | 105.7 |
| 2020-04-18 | 158 | 116.3 |
| 2020-04-19 | 113 | 123.3 |
| 2020-04-20 | 110 | 130 |
| 2020-04-21 | 144 | 133 |
| 2020-04-22 | 140 | 137.7 |
| 2020-04-23 | 172 | 136.1 |
| 2020-04-24 | 156 | 141.9 |
| 2020-04-25 | 163 | 142.6 |
| 2020-04-26 | 95 | 140 |
| 2020-04-27 | 147 | 145.3 |
| 2020-04-28 | 152 | 146.4 |
| 2020-04-29 | 137 | 146 |
| 2020-04-30 | 188 | 148.3 |
| 2020-05-01 | 207 | 155.6 |
| 2020-05-02 | 175 | 157.3 |
| 2020-05-03 | 116 | 160.3 |
| 2020-05-04 | 172 | 163.9 |
| 2020-05-05 | 189 | 169.1 |
| 2020-05-06 | 189 | 176.6 |
| 2020-05-07 | 176 | 174.9 |
| 2020-05-08 | 161 | 168.3 |
| 2020-05-09 | 124 | 161 |
| 2020-05-10 | 178 | 169.9 |
| 2020-05-11 | 122 | 162.7 |
| 2020-05-12 | 176 | 160.9 |
| 2020-05-13 | 135 | 153.1 |
| 2020-05-14 | 168 | 152 |
| 2020-05-15 | 90 | 141.9 |
| 2020-05-16 | 117 | 140.9 |
| 2020-05-17 | 103 | 130.1 |
| 2020-05-18 | 60 | 121.3 |
| 2020-05-19 | 70 | 106.1 |
| 2020-05-20 | 118 | 103.7 |
| 2020-05-21 | 122 | 97.1 |
| 2020-05-22 | 98 | 98.3 |
| 2020-05-23 | 105 | 96.6 |
| 2020-05-24 | 69 | 91.7 |
| 2020-05-25 | 121 | 100.4 |
| 2020-05-26 | 94 | 103.9 |
| 2020-05-27 | 126 | 105 |
| 2020-05-28 | 112 | 103.6 |
| 2020-05-29 | 102 | 104.1 |
| 2020-05-30 | 94 | 102.6 |
| 2020-05-31 | 222 | 124.4 |
| 2020-06-01 | 31 | 111.6 |
| 2020-06-02 | 69 | 108 |
| 2020-06-03 | 103 | 104.7 |
| 2020-06-04 | 139 | 108.6 |
| 2020-06-05 | 66 | 103.4 |
| 2020-06-06 | 70 | 100 |
| 2020-06-07 | 27 | 72.1 |
| 2020-06-08 | 35 | 72.7 |
| 2020-06-09 | 62 | 71.7 |
| 2020-06-10 | 63 | 66 |
| 2020-06-11 | 34 | 51 |
| 2020-06-12 | 55 | 49.4 |
| 2020-06-13 | 58 | 47.7 |
| 2020-06-14 | 39 | 49.4 |
| 2020-06-15 | 29 | 48.6 |
| 2020-06-16 | 38 | 45.1 |
| 2020-06-17 | 41 | 42 |
| 2020-06-18 | 46 | 43.7 |
| 2020-06-19 | 46 | 42.4 |
| 2020-06-20 | 64 | 43.3 |
| 2020-06-21 | 20 | 40.6 |
| 2020-06-22 | 6 | 37.3 |
| 2020-06-23 | 18 | 34.4 |
| 2020-06-24 | 30 | 32.9 |
| 2020-06-25 | 20 | 29.1 |
| 2020-06-26 | 4 | 23.1 |
| 2020-06-27 | 8 | 15.1 |
| 2020-06-28 | 6 | 13.1 |
| 2020-06-29 | 44 | 18.6 |
| 2020-06-30 | 25 | 19.6 |
| 2020-07-01 | 0 | 15.3 |
| 2020-07-02 | 51 | 19.7 |
| 2020-07-03 | 21 | 22.1 |
| 2020-07-04 | 11 | 22.6 |
| 2020-07-05 | 10 | 23.1 |
| 2020-07-06 | 9 | 18.1 |
| 2020-07-07 | 18 | 17.1 |
| 2020-07-08 | 26 | 20.9 |
| 2020-07-09 | 12 | 15.3 |
Canada’s crude mortality rate as of July 9, 2020 was 23.3 COVID-19-related deaths per 100,000 population. Due to the time between the date of infection and the date of death, the final clinical outcome for more recently reported cases is not yet known and, therefore, this mortality rate likely underestimated the true rate. Canada’s COVID-19 mortality rate was the 20th highest worldwide, based on available data, though it was comparable or lower than several European and North American countriesFootnote 1. It is important to note, however, that the number of COVID-19-related deaths within a country is based on several interrelated factors, including the capacity of the healthcare system, how deaths are defined and captured, the stage of the epidemic and the health and age distribution of a country’s population. For these reasons, comparisons across countries should be interpreted with caution.
As of July 9, 2020, Canada’s case fatality rate (CFR), calculated by dividing the number of total deaths by the number of reported cases, was 8.2%. As with the crude mortality rate, this is likely a biased measure of the true CFR, since the outcome (i.e. recovered or deceased) is not yet known for recently reported cases.
Across Canada, CFR ranged from 0% to 10.0% by province/territory (Table 1), and the mortality rate per 100,000 Canadian population ranged from 0.3 to 66.1 (among provinces and territories where there were deaths). After age standardizing, which adjusted for differences in the age distribution across provinces, the mortality rate per 100,000 population ranged from 0.2 to 60.4. After age-standardization, differences in mortality rates by province were likely due to a number of factors, including, most prominently, the spread of COVID-19 within long term care and seniors’ homes. Ontario and Québec had the highest age-standardized mortality rates at 18.4 and 60.4, respectively, with over 70% of these deaths occurring in long term care homes and seniors’ residences (Table 1).
| Province/territory | Total cases | DeathsFootnote a of Table 1 | Deaths among residents of long term care and seniors’ homesFootnote b of Table 1 | Case fatality rate | Deaths per 100,000 populationFootnote c of Table 1Footnote d of Table 1 | Age standardized death rate per 100,000Footnote c of Table 1Footnote e of Table 1Footnote f of Table 1 |
|---|---|---|---|---|---|---|
| Québec | 56,216 | 5,609 | 4,765 | 10.0% | 66.1 | 60.4 |
| Ontario | 36,348 | 2,703 | 2,011 | 7.4% | 18.6 | 18.4 |
| Alberta | 8,519 | 161 | 117 | 1.9% | 3.7 | 4.8 |
| British Columbia | 3,028 | 186 | 131 | 6.1% | 3.7 | 3.5 |
| Nova Scotia | 1,066 | 63 | 57 | 5.9% | 6.5 | 5.8 |
| Saskatchewan | 813 | 15 | 2 | 1.8% | 1.3 | 1.3 |
| Manitoba | 325 | 7 | 1 | 2.2% | 0.5 | 0.6 |
| Newfoundland and Labrador | 261 | 3 | 0 | 1.2% | 0.6 | 0.5 |
| New Brunswick | 166 | 2 | 2 | 1.2% | 0.3 | 0.2 |
| Prince Edward Island | 33 | 0 | 0 | 0% | NDCFootnote g of Table 1 | NDCFootnote g of Table 1 |
| Yukon | 11 | 0 | 0 | 0% | NDCFootnote g of Table 1 | NDCFootnote g of Table 1 |
| Northwest Territories | 5 | 0 | 0 | 0% | NDCFootnote g of Table 1 | NDCFootnote g of Table 1 |
| Nunavut | 0 | 0 | 0 | 0% | NDCFootnote g of Table 1 | NDCFootnote g of Table 1 |
| CanadaFootnote h of Table 1 | 106,804 | 8,749 | 7,086 | 8.2% | 23.3 | 23.3Footnote i of Table 1 |
Indeed, the impact of the COVID-19 pandemic on residents of long term care and seniors’ homes has been severe. Approximately 81% of Canada’s COVID-19 deaths have occurred among residents, as of July 9, 2020 (Table 1), with Ontario and Québec particularly affected, with 2,011 and 4,765 deaths, respectively, among residents of long term care and seniors’ homes. This may have been due to the population size, density and the extent of community transmission within these particular provincesFootnote 6.
Of the 106,804 cases and 8,749 deaths reported in Canada on July 9, 2020, more detailed information was reported to the Public Health Agency of Canada for 106,321 (99.5%) cases and 8,711 (99.6%) deaths by that same date. An analysis of COVID-19 related deaths by age, gender, pre-existing medical conditions and long term care and seniors’ home resident status was conducted using this more detailed dataset provided by provinces and territories.
CFR was less than 1% in all age groups up until the age of 50 years, and then increased rapidly with age, with a CFR of 1.2% for those aged 50 to 59 years, increasing up to 34.4% for those aged 80 years and over (Table 2). Canadian females overall were more impacted, with a higher rate of deaths per 100,000 (24.9 among females compared with 21.3 among males). However, among cases, males had a higher CFR than females (8.5% compared with 7.9%). These latter findings echo a gender difference observed among cases of severe illness due to COVID-19 in other countriesFootnote 7Footnote 8, which may reflect gender differences in the prevalence of pre-existing medical conditions and in risk behaviours such as smokingFootnote 8.
| Case characteristics | Cases | Deaths | Case fatality rate | Deaths per 100,000 populationFootnote a of Table 2 |
|---|---|---|---|---|
| Age groupFootnote b of Table 2 | ||||
| 0–19 years | 7,791 | 1 | 0.01% | 0.01 |
| 20–29 years | 14,813 | 8 | 0.05% | 0.2 |
| 30–39 years | 14,854 | 15 | 0.1% | 0.3 |
| 40–49 years | 16,175 | 45 | 0.3% | 0.9 |
| 50–59 years | 16,140 | 200 | 1.2% | 3.8 |
| 60–69 years | 10,427 | 615 | 5.9% | 13.3 |
| 70–79 years | 7,832 | 1,570 | 20.1% | 54.7 |
| 80 and older | 18,166 | 6,257 | 34.4% | 385.1 |
| Total | 106,198 | 8,711 | 8.2% | 23.0 |
| Age group by genderFootnote b of Table 2Footnote c of Table 2 | ||||
| Female | ||||
| 0–39 years | 19,814 | 8 | 0.04% | 0.1 |
| 40–59 years | 17,827 | 94 | 0.5% | 1.9 |
| 60–79 years | 9,095 | 885 | 9.7% | 22.9 |
| 80 and older | 12,457 | 3,713 | 29.8% | 381.8 |
| Total | 59,193 | 4,700 | 7.9% | 24.9 |
| Male | ||||
| 0–39 years | 17,519 | 16 | 0.1% | 0.2 |
| 40–59 years | 14,412 | 151 | 1.1% | 3.0 |
| 60–79 years | 9,117 | 1,294 | 14.2% | 35.8 |
| 80 and older | 5,596 | 2,509 | 44.8% | 384.6 |
| Total | 46,644 | 3,970 | 8.5% | 21.3 |
Based on the limited information available on pre-existing medical conditions (n=6,350), CFR generally increased as the number of pre-existing medical conditions increased, overall and across all age groups (Table 3). This increase was marked among those aged 60 to 79 years, where the CFR was 3.1% among those without a pre-existing medical condition and 25.5% among those with three or more pre-existing medical conditions. Pre-existing medical conditions assessed in case reports provided to the Public Health Agency of Canada included cardiac disease, chronic neurological or neuromuscular disorder, diabetes, immunodeficiency disease/condition, liver disease, malignancy, renal disease and respiratory disease. Being a resident of a long term care or seniors’ home also resulted in a higher CFR overall (26.8%) and within each of the age groups. While the information on whether or not the case was a resident of a long term care or seniors’ home was limited (n=10,150), these findings were similar to those of other Canadian studies, in which the overall CFR among residents was estimated to be 36%Footnote 6, and was greater than that of older Canadians who were not living in such a setting (Personal communication, D. Fisman et al.). The higher CFR among this population likely reflects a degree of frailty and multi-morbidity among residents that increases the risk of severe outcomes, including deathFootnote 9.
| Case characteristics | Deaths/cases (case fatality rate) | |||||||
|---|---|---|---|---|---|---|---|---|
| Age (years) | ||||||||
| 0–59 | 60–79 | 80 and older | Total cases | |||||
| n/N | % | n/N | % | n/N | % | n/N | % | |
| Number of pre-existing medical conditionsFootnote a of Table 3Footnote b of Table 3 | ||||||||
| 0 | 4/4,150 | 0.1% | 32/1,028 | 3.1% | 67/224 | 29.9% | 103/5,402 | 1.9% |
| 1 | 2/135 | 1.5% | 6/157 | 3.8% | 12/55 | 21.8% | 20/347 | 5.8% |
| 2 | 0/66 | 0.0% | 18/141 | 12.8% | 39/129 | 30.2% | 57/336 | 17.0% |
| 3 and more | 1/39 | 2.6% | 26/102 | 25.5% | 47/124 | 37.9% | 74/265 | 27.9% |
| Long term care or seniors’ home residentFootnote c of Table 3 | ||||||||
| No | 6/8,122 | 0.1% | 34/1,098 | 3.1% | 35/171 | 20.5% | 75/9,391 | 0.8% |
| Yes | 3/33 | 9.1% | 45/213 | 21.1% | 155/512 | 30.3% | 203/758 | 26.8% |
There is increasing evidence that, similar to findings from the United States and the United KingdomFootnote 10, individuals from racial and ethnic minorities within Canada are at increased risk for acquiring COVID-19 and for severe outcomes, including deathFootnote 11Footnote 12. Nationally, plans are underway to begin the collection of more detailed case information in the fall 2020, including race, ethnicity and socio-economic status.
Conclusion
Public health authorities across the country will continue to monitor closely the number of deaths among COVID-19 cases to inform additional measures to prevent fatal outcomes. Although deaths provide a late indication of COVID-19 transmission, they provide a clear indication of the severity and impact of the disease and highlight the need to protect vulnerable populations, including those who are older and living with multiple pre-existing medical conditions. Most especially, Canadians living in long term care and seniors’ homes have been severely impacted, with higher case fatality rates compared with older Canadians who are not living in such settings. Accordingly, federal, provincial and territorial jurisdictions have implemented multiple measures to prevent transmission within such settings. These measures include updated guidelines on infection prevention and control, and specifically regarding care of residents in long term care homesFootnote 13, policy measures to ensure adequate staffing and to limit the movement of healthcare workers between facilities.
The infection fatality rate and excess mortality are other measures of mortality than can be used to describe the impact of COVID-19 in Canada. The infection fatality rate is defined as the number of deaths divided by the number of individuals infected. Unlike CFR, the infection fatality rate is not influenced by factors such as changes in laboratory testing strategies. Plans are currently underway to conduct rapid pan-Canadian and regional serologic surveys to determine the extent of severe acute respiratory syndrome coronavirus 2 (SARS-CoV-2) in the population and these results will permit the estimation of Canada’s infection fatality rateFootnote 14.
Estimating excess mortality will increase our understanding of the impact of the COVID-19 pandemic beyond the disease itself For example, an increase in deaths due to other causes may be expected as a result of individuals whose fear of infection prevents them from seeking timely health care. Excess mortality is the difference between the total number of people who died from any cause during a specified period, and the historical average for the same time of year in previous years. In June 2020, Statistics Canada released a provisional dataset on excess deaths for January to the week of May 2, 2020, as compared with the previous five yearsFootnote 15. These data were preliminary and, as more information becomes available for all Canadian jurisdictions, we will gain a better understanding of the true impact of the pandemic on Canadians.
Authors’ statement
- DP — Conceptualization, original draft, review and editing
- CB — Conceptualization, data curation, formal analysis, review and editing
- JM — Data curation, formal analysis, review and editing
- LW — Review and editing
- AC — Conceptualization, review and editing
- CA — Review and editing
- LS — Review and editing
- DT — Review and editing
- DM — Review and editing
- JP — Review and editing
Competing interests
None.
Acknowledgements
Authors wish to thank provincial and territorial surveillance partners, the National Microbiology Laboratory, provincial public health laboratory partners, and the Health Portfolio Operations Centre’s Surveillance Team, Public Health Agency of Canada.
Public Health Agency of Canada COVID-19 Surveillance and Epidemiology Team included D Paquette, C Bell, J Macri, L Whitmore, A Currie, C Archibald, L Shah, D Taylor, D MacDonald and J Pennock.
Funding
This work was supported by Public Health Agency of Canada.
