
Infectious syphilis, 2019

 Download this article as a PDF
Published by: The Public Health Agency of Canada
Issue: Volume 46–10: Laboratory Biosafety
Date published: October 1, 2020
ISSN: 1481-8531
Submit a manuscript
About CCDR
Browse
Volume 46–10, October 1, 2020: Laboratory Biosafety
Infographic
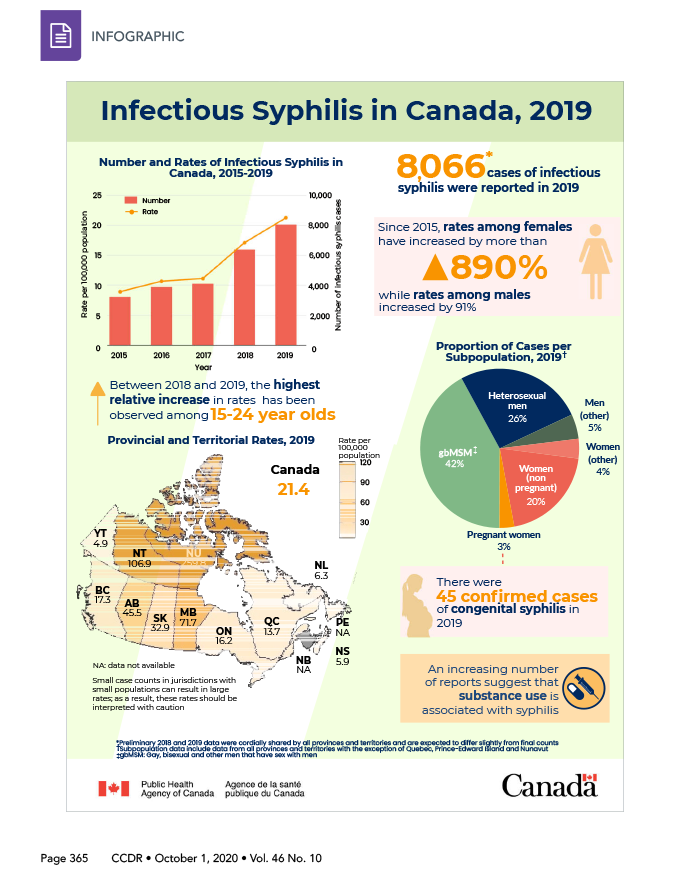
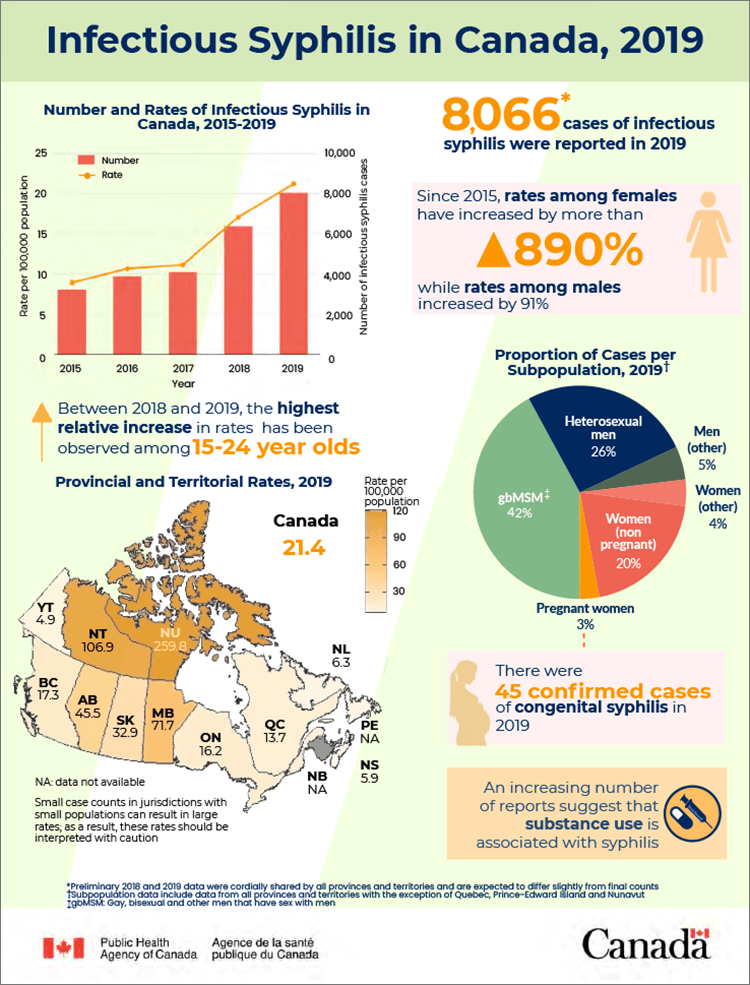
Infectious Syphilis in Canada, 2019
Text description: Infographic
Number and rates of infectious syphilis in Canada, 2015–2019
This graph displays the rate of infectious syphilis per 100,000 population on the left vertical axis and the number of infectious syphilis cases on the right vertical axis in Canada, for each year between 2015 and 2019 (calendar years are shown on the horizontal axis).
| Year | Rate per 100,000 population | Number of infectious syphilis cases |
|---|---|---|
| 2015 | 8.9 | 3,199 |
| 2016 | 10.7 | 3,870 |
| 2017 | 11.1 | 4,083 |
| 2018 | 17.1 | 6,371 |
| 2019 | 21.4 | 8,066 |
8,066Footnote * cases of infectious syphilis were reported in 2019
Since 2015, rates among females have increased by more than 890% while rates among males increased by 91%
Between 2018 and 2019, the highest relative increase in rates has been observed among 15–24 year olds
Provincial and territorial rates, 2019Footnote †
This map displays the rates of reported infectious syphilis per 100,000 population by province and territory in 2019.
| Province or territory | Rate per 100,000 population |
|---|---|
| British Columbia | 17.3 |
| Alberta | 45.5 |
| Saskatchewan | 32.9 |
| Manitoba | 71.7 |
| Ontario | 16.2 |
| Quebec | 13.7 |
| New Brunswick | No data available |
| Nova Scotia | 5.9 |
| Prince Edward Island | No data available |
| Newfoundland and Labrador | 6.3 |
| Yukon territories | 4.9 |
| Northern territories | 106.9 |
| Nunavut | 259.8 |
| Canada | 21.4 |
Small case counts in jurisdictions with small populations can result in large rates; as a result, these rates should be interpreted with caution.
Proportion of cases per subpopulation, 2019Footnote ‡
This pie chart shows the proportion of cases for each subpopulation reported; heterosexual men, gay, bisexual and other men that have sex with men (gbMSM), men (other), pregnant women, women (non pregnant) and women (other) in 2019.
| Subpopulation | Proportion (%) |
|---|---|
| gbMSM | 42 |
| Heterosexual men | 26 |
| Men (other) | 5 |
| Pregnant women | 3 |
| Women (other) | 20 |
| Other (women) | 4 |
There were 45 confirmed cases of congenital syphilis in 2019 (connection with the proportion of pregnant women in the pie chart above).
An increasing number of reports show that substance use is associated with syphilis.
