
Evaluating transmission risk of COVID-19 at gatherings

 Download this article as a PDF
 Published by: The Public Health Agency of Canada
Issue: Volume 47 No. 11, November 2021: Multisystem Inflammatory Syndrome in Children
Date published: November 2021
ISSN: 1481-8531
Submit a manuscript
About CCDR
Browse
Volume 47 No. 11, November 2021: Multisystem Inflammatory Syndrome in Children
Overview
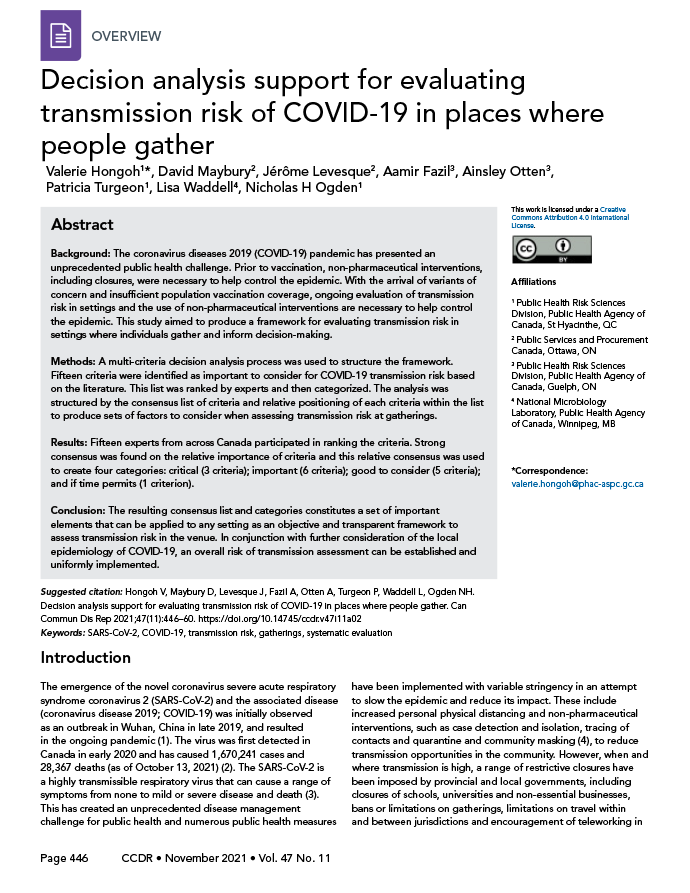
Decision analysis support for evaluating transmission risk of COVID-19 in places where people gather
Valerie Hongoh1, David Maybury2, Jérôme Levesque2, Aamir Fazil3, Ainsley Otten3, Patricia Turgeon1, Lisa Waddell4, Nicholas H Ogden1
Affiliations
1 Public Health Risk Sciences Division, Public Health Agency of Canada, St Hyacinthe, QC
2 Public Services and Procurement Canada, Ottawa, ON
3 Public Health Risk Sciences Division, Public Health Agency of Canada, Guelph, ON
4 National Microbiology Laboratory, Public Health Agency of Canada, Winnipeg, MB
Correspondence
Suggested citation
Hongoh V, Maybury D, Levesque J, Fazil A, Otten A, Turgeon P, Waddell L, Ogden NH. Decision analysis support for evaluating transmission risk of COVID-19 in places where people gather. Can Commun Dis Rep 2021;47(11):446–60. https://doi.org/10.14745/ccdr.v47i11a02
Keywords: SARS-CoV-2, COVID-19, transmission risk, gatherings, systematic evaluation
Abstract
Background: The coronavirus diseases 2019 (COVID-19) pandemic has presented an unprecedented public health challenge. Prior to vaccination, non-pharmaceutical interventions, including closures, were necessary to help control the epidemic. With the arrival of variants of concern and insufficient population vaccination coverage, ongoing evaluation of transmission risk in settings and the use of non-pharmaceutical interventions are necessary to help control the epidemic. This study aimed to produce a framework for evaluating transmission risk in settings where individuals gather and inform decision-making.
Methods: A multi-criteria decision analysis process was used to structure the framework. Fifteen criteria were identified as important to consider for COVID-19 transmission risk based on the literature. This list was ranked by experts and then categorized. The analysis was structured by the consensus list of criteria and relative positioning of each criteria within the list to produce sets of factors to consider when assessing transmission risk at gatherings.
Results: Fifteen experts from across Canada participated in ranking the criteria. Strong consensus was found on the relative importance of criteria and this relative consensus was used to create four categories: critical (3 criteria); important (6 criteria); good to consider (5 criteria); and if time permits (1 criterion).
Conclusion: The resulting consensus list and categories constitutes a set of important elements that can be applied to any setting as an objective and transparent framework to assess transmission risk in the venue. In conjunction with further consideration of the local epidemiology of COVID-19, an overall risk of transmission assessment can be established and uniformly implemented.
Introduction
The emergence of the novel coronavirus severe acute respiratory syndrome coronavirus 2 (SARS-CoV-2) and the associated disease (coronavirus disease 2019; COVID-19) was initially observed as an outbreak in Wuhan, China in late 2019, and resulted in the ongoing pandemicFootnote 1. The virus was first detected in Canada in early 2020 and has caused 1,670,241 cases and 28,367 deaths (as of October 13, 2021)Footnote 2. The SARS-CoV-2 is a highly transmissible respiratory virus that can cause a range of symptoms from none to mild or severe disease and deathFootnote 3. This has created an unprecedented disease management challenge for public health and numerous public health measures have been implemented with variable stringency in an attempt to slow the epidemic and reduce its impact. These include increased personal physical distancing and non-pharmaceutical interventions, such as case detection and isolation, tracing of contacts and quarantine and community maskingFootnote 4, to reduce transmission opportunities in the community. However, when and where transmission is high, a range of restrictive closures have been imposed by provincial and local governments, including closures of schools, universities and non-essential businesses, bans or limitations on gatherings, limitations on travel within and between jurisdictions and encouragement of teleworking in an attempt to limit transmission opportunities. Together these actions helped to minimize person-to-person contacts in Canada and resulted in the epidemic coming under control with low reported case incidence during summer 2020. However, the fall 2020 return to school and re-opening of businesses in many regions of Canada resulted in a resurgence of the epidemic and a second wave peaking higher in total cases, hospitalizations and deaths than the spring waveFootnote 2. As capacity for control of the epidemic by testing and tracing alone was surpassed, re-implementation of some levels of restrictive closures was deemed necessary to help reduce rates of contact between Canadians, regain previous levels of epidemic control and limit the risk of exceeding healthcare capacity. Closures of schools and businesses have important social and economic impacts on society. The challenge facing decision-makers is how to navigate the trade-off between preventing COVID-19 transmission and the negative potential health, social and economic impacts of restrictive measuresFootnote 5Footnote 6Footnote 7Footnote 8Footnote 9Footnote 10Footnote 11Footnote 12. A full assessment that includes negative impacts of closures is outside the scope of this work, as at this time the focus is restricted to informing assessment of transmission risk.
The arrival of vaccine doses in Canada in December 2020 raised hopes that restrictive measures could be eased. However, the recent emergence of new, more transmissible and in some cases more virulent variants of concern (VOC) meant that caution was and will be needed when lifting restrictive measures and re-opening businesses and places where people gather—particularly until sufficient vaccination coverage and natural immunity of the Canadian population has been achieved. Even then, the capacity to inform decisions on restrictive closures will remain relevant with the continuing threat of immune escape VOC and the potential of waning immunity.
This project began in late 2020, prior to vaccine arrival in Canada, with the aim to explore available evidence on COVID-19 transmission in different settings and contribute to informing decision-making around closures. Settings are meant to broadly encompass all locations presenting a transmission risk for COVID-19 that a decision-maker may wish to assess. These include transmission at private gatherings in people’s homes, as well as transmission in public places such as schools, grocery stores, retail stores, concerts and bars among others. The explicit consideration of high-risk populations can also be included in the assessment. While the potential cascading effects of closures are numerous and still being studied, characteristics of a setting contributing to transmission risk remains independently important to evaluate, even as vaccination is being rolled out since the presence of variants of concern continues to pose an important transmission risk. The objective of this project was to produce a framework to assist in ranking settings by the risk they pose for COVID-19 transmission, and potentially identify areas where mitigating measures can be targeted to help reduce transmission risk in these same settings in order to help inform decision-making.
Methods
Multi-criteria decision analysis (MCDA) is part of a family of decision aid tools from the field of operations research and used in numerous sectors to systematically evaluate alternatives over multiple criteriaFootnote 13. Multi-criteria decision analysis approaches help to structure reflection around a decision problem by allowing the integration of multiple types of evaluations and the highlighting of strengths and weaknesses of the alternatives under evaluation. Participatory MCDA processes generally consist of a multi-step problem structuring phase where the problem is defined, stakeholders identified, criteria defined and weighted, items to be ranked identified and evaluated over the criteria, followed by a decision analysis phase where the multi-criteria analysis is carried out along with a sensitivity analysis and interpretation of results (Table 1). In this article, a “rapid and light” version of a participatory MCDA process was used to structure a framework for the evaluation of settings at risk for COVID-19 transmission, while taking into account time constraints of stakeholders and considerable data gaps in the literature. The objective was to identify criteria and indicators that would be most informative for assessing transmission risk in settings and produce a consensus ranking of these criteria by experts. The results of this exercise are presented along with a discussion of how the results could be used to help assess settings for transmission risk.
| Phase | # | Steps included in the participatory process | Steps included in the "light" processTable 1 footnote a |
|---|---|---|---|
| Problem structuring | 1 | Definition of the problem of interest | x |
| 2 | Identification of stakeholders | x | |
| 3 | Identification of alternativesTable 1 footnote b | - | |
| 4 | Definition of criteria | x | |
| 5 | Weighting of criteria | x | |
| 6 | Evaluation of alternativesTable 1 footnote b based on criteria | - | |
| Decision analysis | 7 | Decision analysis | - |
| 8 | Sensitivity analysis | - | |
| 9 | Interpretation of results | - | |
Four steps from a participatory MCDA methodology were adapted to allow for the construction of an expert-ranked consensus list of criteria that could be used as a decision-aid. A quick scan of the literature was conducted to search for broad factors contributing to COVID-19 transmission risk and produce a preliminary list of key criteria. The scan was conducted in an evergreen database of COVID-19 literature maintained within the Public Health Agency of Canada that compiles citations daily from seven databases. The search was used to draft an initial list of twenty-three criteria, and indicators for their rapid evaluation. A limited number of studies were available and consisted primarily of rapid reviews of reports where clusters had occurred with many of the early outbreaks reported having occurred before widespread use of public health measures. Preliminary criteria related to common factors present in settings where outbreaks had occurred. Droplet and aerosol transmission was thought to account for most transmissions and pointed towards elements favoring close contact in closed and crowded spaces as primary drivers of transmission.
The preliminary list of criteria was presented to a group of 62 provincial public health experts for review and comment. The list was condensed to 15 criteria, including 10 site and event characteristics, one participant-level characteristic and four potential mitigation measures (Table 2). In order to keep the final number of criteria manageable, a number of criteria from the original list were combined (e.g. indoor/outdoor location and ventilation) and criteria to evaluate secondary activities at settings were not included (e.g. shared dining or break rooms). This list was then presented to a group of experts within the Pan-Canadian Public Health Network involved in the COVID-19 response, for ranking during December 2020 via an online tool created explicitly for this purpose. The individual expert-ranked lists were combined using general Mallows modelsFootnote 14 to produce a consensus ranking (see Appendix for more details on the general Mallows models). The R package PerMallowsFootnote 15 was used to analyze the rankings.
| Criteria | Level (from lower to higher risk) | Summary: What is known | Examples | References |
|---|---|---|---|---|
| Location and ventilation |
|
Risk of transmission generally thought to be lower outdoors depending on nature of setting, activity type, duration, circulation and providing physical distancing at or around 2 meter can be maintained. Weed et al. report limited evidence of outdoor transmission based on reviewed studies. Some outdoor transmission has occurred when physical distancing was breached or in high density conditions, low circulation, large size of gatherings over extended duration has taken place (e.g. outdoor concerts, festivals, some physical activities, sporting events). Risk of transmission in closed environments reported to be higher than in open-air environments (OR 18.7 (6.0–57.9)). Note: cases in study occurred when social interactions were unrestricted. ECDC concluded that well maintained HVAC systems adapted for use in COVID-19 pandemic may help to decrease airborne transmission. HVAC - contamination in air samples and HVAC system surfaces in healthcare settings indicate possible spread but virus viability not established. Some early case clusters were attributed to air conditioning units and air recirculation. Air jets from AC and recirculation of indoor air considered likely modes of transmission. Other coronavirus infections have been associated with poor ventilation (insufficient movement and clearance of contaminated indoor air). |
Indoor examples: Gyms, fitness class, recreational sports, workplaces. Nightclubs with poor ventilation, crowding and loud music leading to attendees potentially yelling and leaning very close together to communicate; Karaoke rooms Parties, restaurants, healthcare facilities Outdoor examples: Local festivals, events with tented eating spaces with poor ventilation |
Footnote 16Footnote 17Footnote 18Footnote 19Footnote 20Footnote 21Footnote 22Footnote 23 |
| Duration of event (time) |
|
In a review of outdoor transmission events, crowding was a common factor among outbreaks, but circulation (mixing) of participants, close range interactions with loud conversations, shouting or singing and duration were found to be important factors (Weed & Foad). A rapid synthesis by found that large clusters occurred in settings where individuals were confined for prolonged periods of time (e.g. shared accommodations, food processing plants, religious services). |
N/A | Footnote 21Footnote 24Footnote 25 |
| Contact between participants during activity |
|
Transmission of SARS-CoV-2 is primarily via prolonged close contact and exposure to respiratory secretions. Close proximity contacts between individuals increases the likelihood of transmission of virus with contact interactions ranging from face-to-face interactions to direct physical contact either. Transmission risk can be mitigated to some extent by use of masks, and other PPE. Workplace infections have been facilitated by close contact and duration of interaction. For example, grocery store employees with direct customer exposure, paramedics and firefighters with physical contact with potentially infected individuals at higher risk. |
N/A | Footnote 24Footnote 25 |
| Density of crowd |
|
Dalton et al. suggest an 8-fold increase in risk of viral dose excretion and inhalation from communicating at a distance of 30 cm vs 1 meter. Settings where physical distancing at or around 2 meter not possible linked with increased risk of transmission. |
Nightclubs with poor ventilation, crowding and loud music leading to attendees potentially yelling and leaning very close together to communicate; Karaoke rooms | Footnote 17Footnote 21 |
| Mixing of networks/bubbles at event (closed small groups vs random participants every time) |
|
From predictive modeling studies: - Small closed community networks where groups of people only interact with a chosen group of other people and there is limited interaction outside network have lower risk. Risk increases with bridges to other networks. - Random mixing events (e.g. public transport, bars and sporting events) are higher risk because of mixing from many small networks. - Could also include settings where exposed to multiple clients (for example transport workers, sales people, cleaners). A review of workplace related transmission risk found that drivers and transport workers, service and sales workers, food industry, personal care occupations, food production, preschool occupations, community and social services, construction and related trades occupations and public safety workers were most at risk of infection (these groups are highly exposed to random individuals/clients in their line of work). |
Ski resorts due to their attraction of global travellers | Footnote 26Footnote 27Footnote 28 |
| Mixing of participants (circulation and mixing of participants within the event) |
|
In a review of outdoor transmission events, crowding (number and density) was a common factor among outbreaks, but circulation (mixing) of participants, close range interactions with loud conversations, shouting or singing and duration were important factors. | N/A | Footnote 21 |
| Number of individuals (per gathering or event or venue) |
|
Large crowd size increases the probability that an infected individual is present, increases crowding, contact and thus transmission likelihood, even in outdoor settings. Of fifty-five studies reviewed in recent PHAC evidence brief, clear relationship found between increased gathering size and risk, but size threshold was inconsistent. When physical distancing breached, density is high, circulation of participants occurs and gathering takes place over extended duration of time, risk of transmission increases. An ecological study estimated a 36% reduction in Ro if the cut-off for gathering size was 10 people, compared to 21% if it was 100 people, and a 2% reduction in Ro if the cut-off for gathering size was 1,000 people. In an evaluation of NPIs at a global scale, Esra et al. estimated overall 10% reduction in infections associated with gathering size restrictions. In indoor environments in particular, larger numbers of individuals increases the potential concentration of airborne virus-carrying particles and number of individuals that can be exposed at any given time. |
Carnival outbreak in Germany with 1,700 cases Sporting events also associated with outbreaks Weddings, religious gatherings, bars linked to clusters in Hong Kong |
Footnote 21Footnote 22Footnote 24Footnote 29Footnote 30Footnote 31Footnote 32Footnote 33 |
| Related activity (e.g. shared/group travel to setting) |
|
Congregate work and living increase the risk of transmission. | N/A | Footnote 34 |
| Ease of contact tracing should an outbreak occur |
|
Timely test, trace and isolation have been shown to be important NPI strategies for working to contain transmission of COVID-19. Modelling studies show delays in tracing (three or more days) fail to bring Rt under 1. |
N/A | Footnote 21Footnote 35Footnote 36 |
| Cohorting and physical distancing to reduce contacts |
|
Successful prevention of transmission in the workplace linked to limited physical contact, including cohorting or staggering of employees. | N/A | Footnote 37Footnote 38 |
| Level of expelled air |
|
Dalton et al. suggest a 3 to 10-fold increase in risk of viral dose excretion due to louder vocalization (yelling or singing) in environments with loud music. Dalton et al. further suggest a 3-fold increase in risk of viral dose excretion due to light exercise (compared to talking). |
Example of transmission in singing group/choir Gyms |
Footnote 17Footnote 39Footnote 40Footnote 41Footnote 42Footnote 43Footnote 44Footnote 45 |
| Age structure of the participant population |
|
Analysis of data from Wuhan found greatest model fit for testing of hypothesis that children show more mild symptoms. Infection fatality rate estimates close to zero for children and younger adults and rise exponentially with age. |
N/A | Footnote 46Footnote 47Footnote 48Footnote 49 |
| Environmental cleaning/other transmission mitigation efforts |
|
Public health interventions most effective when combined. Modelling shows hand hygiene, use of masks, and limiting individual contacts help to reduce transmission in larger gatherings of random individuals. |
N/A | Footnote 26 |
| Use of masks or face coverings |
|
Much of the research on use of face masks was done prior to COVID-19 and the use of surgical masks. Observational studies on the use of protective effects of face masks against influenza like illness have been demonstrated. Studies on healthcare worker use of non-medical masks has demonstrated protection compared to no mask. Modelling shows hand hygiene, use of masks, and limiting individual contacts help to reduce transmission in larger gatherings of random individuals |
Shared transport by bus example in China where infected traveller wore no mask during first bus ride and infected five other travellers, but wore mask during second bus ride with no secondary cases arising from last trip (Liu & Zhang) | Footnote 26Footnote 50Footnote 51 |
| Shared equipment or surfaces |
|
Transmission of SARS-CoV-2 is primarily via prolonged close contact and exposure to respiratory secretions. However, SARS-CoV-2 can survive on various surfaces for limited amounts of time. Fomite transmission is known to occur with MERS-CoV and SARS. SARS-CoV-2 virus survival shown to be dependent on relative humidity and nature of contact surface (survival likelihood greater on plastic and stainless steel versus copper or cardboard surfaces). Transmission via contaminated surfaces appears possible. Environmental samples taken from an infected patient's room (door handle, toilet bowl, sink, air outlet fans) in Singapore found to be positive for SARS-CoV-2. Two other infected patient's room samples all negative. First patient had higher viral load than later two. Tests did not assess virus viability from samples. |
Religious gatherings can present opportunities to pass around offerings, sacramental objects or sharing of food and refreshments. Outbreaks reported in South Korea and Arkansas, United States. Note that singing, indoor facility and ventilation also described as having taken place in Arkansas outbreak | Footnote 17Footnote 52Footnote 53Footnote 54 |
Results
Fifteen characteristics (i.e. criteria) were presented to a set of experts for ranking from highest to lowest level of importance when evaluating transmission risk of COVID-19 in various settings. Fifteen experts returned rankings by the deadline, and while the number of respondents was low, the respondents represented the geographic regions in Canada most affected by COVID-19 at the time.
Consensus ranking by means of generalized Mallows models
A generally good consensus emerged among experts on the relative importance of the criteria with some individual variations in specific ranking positions (Figure 1). Table 3 shows the rankings created by each participant. The consensus ranking resulting from the generalized Mallows models with the Kendall and Hamming distance is shown in Table 4. While there was broad agreement between the two consensus rankings, differences emerged as a result of wider variation in respondent rankings for some criteria.
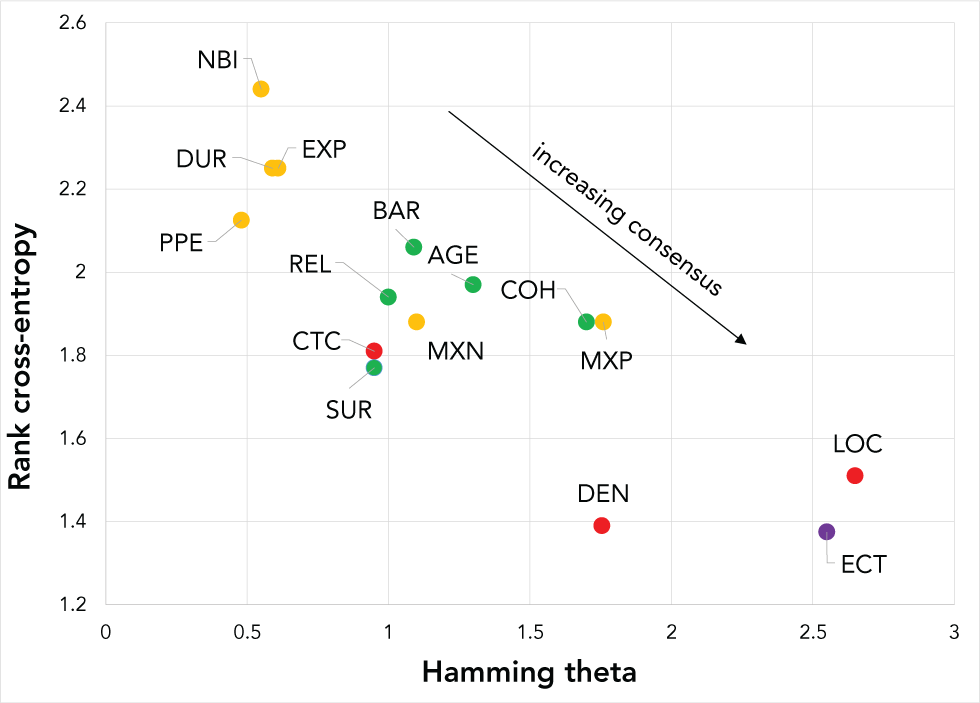
Figure 1: Rank cross-entropy and Hamming thetaFootnote a from the generalized Mallows modelFootnote b
Text description: Figure 1
The graph shows the consensus ranking of criteria resulting from the generalized Mallows models with the Hamming distance plotted on the x-axis and the cross-entropy of a criterion's rank plotted on the y-axis. Each dot on the graph represents one of the 15 criteria. Criteria are colored by category with "critical" criteria in red, "important" criteria in orange, "good to consider" criteria in green and "if time permits" criteria in purple. Criteria located near the bottom right corner of the graph indicate strong consensus among participants on the relative importance of the criterion, while items near the upper left corner of the graph indicate poor consensus among participants on exact rank order. Strong consensus was found among participants on the relative importance of the most and least important criteria LOC and ECT respectively. Moderate consensus was found for a majority of the green criteria ("good to consider") as indicated by their location near the middle of the graph. Poorer consensus was found among participants on the exact rank order for many of the "important" criteria (yellow) located near the upper left corner of the graph.
| Criteria | Hamming theta | Rank cross-entropy |
|---|---|---|
| PPE | 0.48 | 2.125 |
| NBI | 0.55 | 2.44 |
| DUR | 0.59 | 2.25 |
| EXP | 0.61 | 2.25 |
| CTC | 0.95 | 1.81 |
| SUR | 0.95 | 1.77 |
| REL | 1 | 1.94 |
| BAR | 1.09 | 2.06 |
| MXN | 1.1 | 1.88 |
| AGE | 1.3 | 1.97 |
| COH | 1.7 | 1.88 |
| DEN | 1.755 | 1.39 |
| MXP | 1.76 | 1.88 |
| ECT | 2.55 | 1.375 |
| LOC | 2.65 | 1.51 |
| Expert | Criteria ranking | ||||||||||||||
|---|---|---|---|---|---|---|---|---|---|---|---|---|---|---|---|
| 1 | 2 | 3 | 4 | 5 | 6 | 7 | 8 | 9 | 10 | 11 | 12 | 13 | 14 | 15 | |
| 1 | LOC | DUR | CTC | DEN | MXN | MXP | NBI | REL | ECT | COH | EXP | AGE | BAR | PPE | SUR |
| 2 | LOC | AGE | CTC | MXN | NBI | MXP | EXP | ECT | SUR | PPE | DUR | REL | BAR | DEN | COH |
| 3 | LOC | ECT | EXP | DUR | NBI | REL | CTC | SUR | AGE | COH | MXN | MXP | PPE | DEN | BAR |
| 4 | AGE | MXP | LOC | DUR | EXP | COH | CTC | ECT | SUR | BAR | NBI | REL | MXN | DEN | PPE |
| 5 | MXN | CTC | NBI | DUR | REL | DEN | LOC | AGE | SUR | BAR | ECT | PPE | COH | MXP | EXP |
| 6 | NBI | DEN | DUR | LOC | MXN | MXP | ECT | REL | PPE | BAR | COH | SUR | EXP | CTC | AGE |
| 7 | MXP | MXN | LOC | DUR | ECT | REL | DEN | SUR | EXP | COH | CTC | AGE | PPE | NBI | BAR |
| 8 | MXP | NBI | DUR | LOC | ECT | DEN | MXN | CTC | BAR | AGE | REL | EXP | PPE | SUR | COH |
| 9 | COH | DEN | LOC | DUR | MXP | MXN | REL | NBI | SUR | BAR | CTC | EXP | AGE | PPE | ECT |
| 10 | CTC | DUR | MXN | LOC | REL | NBI | MXP | ECT | SUR | BAR | DEN | PPE | AGE | COH | EXP |
| 11 | LOC | EXP | NBI | DEN | ECT | REL | COH | PPE | AGE | CTC | MXP | SUR | DUR | MXN | BAR |
| 12 | LOC | NBI | CTC | DEN | MXN | EXP | DUR | AGE | SUR | ECT | REL | PPE | MXP | COH | BAR |
| 13 | LOC | EXP | MXP | CTC | NBI | REL | DEN | AGE | SUR | MXN | COH | PPE | ECT | DUR | BAR |
| 14 | LOC | COH | DUR | CTC | BAR | REL | ECT | SUR | AGE | PPE | DEN | NBI | MXP | MXN | EXP |
| 15 | LOC | MXP | DUR | DEN | REL | ECT | BAR | EXP | SUR | NBI | MXN | COH | AGE | CTC | PPE |
| Category | Code | Criteria | Kendall | Hamming |
|---|---|---|---|---|
| Critical | DEN | Density of crowd | 1 | 2 |
| CTC | Contact between participants | 2 | 3 | |
| LOC | Location and ventilation | 3 | 1 | |
| Important | NBI | Number of households (or individuals) | 4 | 4 |
| EXP | Level of expelled air (of activity) | 5 | 10 | |
| DUR | Duration of event | 6 | 6 | |
| PPE | Personal protective equipment—use of masks or face coverings | 7 | 5 | |
| MXP | Mixing of participants | 8 | 8 | |
| MXN | Mixing of networks | 9 | 7 | |
| Good to consider | BAR | Engineering controls—use of physical barriers and environmental cleaning | 10 | 12 |
| REL | Related activity (e.g. shared group travel) | 11 | 9 | |
| COH | Administrative scheduling—use of cohorting to stagger participants and reduce contacts | 12 | 13 | |
| AGE | Age structure of participants in population | 13 | 14 | |
| SUR | Shared equipment or surfaces | 14 | 11 | |
| If time permits | ECT | Ease of contact tracing should an outbreak occur | 15 | 15 |
Location and ventilation and ease of contact tracing were the criteria on which experts most strongly agreed in terms of absolute rank ordering (i.e. most important and least important criteria). Location and ventilation appears exclusively in the first seven ranks and almost always (n=14/15 times) in the first four ranks. Criteria with stronger disagreement among experts regarding absolute rank position were number of households or individuals and level of expelled air.
Criteria categorization based on combined consensus rankings
Criteria were placed into categories based on their level of agreement between experts and combined Kendall and Hamming rank orderings (Table 4). Four categories were created as a result of these ranking agreements among experts: “critical”; “important”; “good to consider”; and “if time permits”.
Categories 1 and 2: Critical and important criteria
The first set of criteria (“critical”) consisted of three criteria that were consistently ranked within the first few positions by experts: 1) density of the crowd; 2) contact between participants; and 3) location and ventilation.
The second set of criteria (“important”) were almost consistently ranked within the top half of the ranking by experts (with the exception of level of expelled air), though some variability in specific rank positioning was observed among experts: 1) number of households; 2) level of expelled air (of activity); 3) duration of the event or activity; 4) use of personal protective equipment; 5) mixing of networks; and 6) mixing of participants. While level of expelled air showed wide variation in expert ranking (present in the top half for some experts and the bottom half for others); given available literature data on this criterion, it was placed in the “important” category.
Categories 3 and 4: Good to consider and if time permits criteria
The third set (“good to consider”) consisted of five criteria. Experts generally ranked these criteria in the lower half of their rankings, though relative importance attributed to each criteria varied between experts. This set included the following: 1) the use of engineering controls and environmental cleaning; 2) related activity; 3) administrative scheduling; 4) age structure of participants; and 5) shared equipment or surfaces. Finally, given very strong agreement for the rank positioning of the last criterion, ease of contact tracing, which was almost consistently ranked last among experts, this criterion was placed in the “if time permits” category.
Discussion
This project aimed to identify key factors (criteria) to consider when making decisions around COVID-19 transmission risk in various settings where people gather. The use of generalized Mallows models allowed for the analysis and quantification of the consensus among experts on the rank importance of different transmission risk factors (criteria). A lack of approximate consensus on a given criterion can lead to large differences between models with different metrics; however, using the Kendall and Hamming metrics, broad consensus was found among the most important and least important criteria.
The consensus-ranked list of transmission criteria and corresponding categories resulting from this exercise contribute to a framework for ranking settings for COVID-19 transmission risk based on criteria identified from both the literature and expert opinion. How a setting is evaluated or scored with respect to a specific criterion will depend on a range of factors specific to the local community where the evaluation is undertaken, including local transmission, public health measures in place, current adoption of those measures by the local population and setting-specific characteristics.
Although this framework is intended to assist in evaluating transmission risk, all risk assessments should be performed in the context of the local epidemiology and with consideration of the specific characteristics of the gathering/event/venue being evaluated. A ranking of transmission risk of settings produced in one geographical location will not necessarily be the same as that performed in another geographical location due to local epidemiological variation even if the same criteria are used.
Based on the formative research conducted, the consensus list captures elements that are most directly related to transmission risk. When evaluating settings and their risk for transmission, it is important to keep in mind the activities performed on site and their related contexts since related activities may affect transmission risk; e.g. shared transport to the setting or shared accommodations. These related activities may present additional opportunities for transmission that may be important to consider for inclusion in the risk assessment.
Many of the criteria presented are inter-related or synergistic and, as a result, may be difficult to evaluate individually (e.g. the number of participants at an event and the density of the crowd). The use of scenarios may help tease apart some of these factors. For example, a scenario could be defined to evaluate transmission risk when a certain percentage of the population is vaccinated, and a separate scenario defined to consider a different target vaccination percentage. Alternate scenarios could be defined to consider different levels of community transmission as local prevalence of COVID-19 will change the likelihood of encountering an infected individual. Expert review and discussion of the evaluations is also important as it will promote cross-examination and consideration of a broad set of local factors.
Operationalization of this list and resulting categories is left to the discretion of regional public health experts, though some suggestions are discussed. Assessment as part of a multi-step MCDA process would enable a systematic evaluation between settings; however, a full illustration of this approach is beyond the scope of this article.
Variant of concern considerations
Transmission risk evaluation will continue to be necessary until sufficient vaccination coverage can be reached to achieve herd immunity. With the emergence of VOCs across the country, additional waves of cases may continue to threaten healthcare capacity in Canada despite vaccine rollout. As such, our experts were consulted once again in March 2021 to see if their rankings of the criteria would change given the emergence of VOCs. Given a lack of evidence that VOCs affect transmission risk differently, the experts that responded (n=10/15) left their rankings unchanged. This should be monitored as further knowledge is gathered on the subject.
Using the criteria for evaluation of settings and gatherings and limitations
Although a full multi-criteria evaluation of settings is outside of the scope of the current paper, some guidelines on the use of the criteria for evaluating settings are suggested below. Software packages exist for MCDA analysis, including a recently developed free package for R (https://cran.r-project.org/web/packages/MCDA/MCDA.pdf) and other academic or paid software options. These software packages allow MCDA analysis without the need for statistical experts to carry out the evaluations.
Before undertaking an evaluation of settings, the scope and scale of the assessment should be clearly defined. For example, it is important to define whether the evaluation is being performed to assess the daily exposure of individuals to transmission at any given setting versus assessment of the daily exposure of individuals working all day at a setting since a setting may pose different risks to a casual visitor versus an employee who is exposed over several hours. It is important to consider whether specific subgroups are to be considered in the assessment; for example, are clinically-vulnerable individuals included in the scope or is a separate assessment required to properly assess this subgroup? As settings are considered for inclusion, creating a description of the setting in the context being assessed is useful (e.g. in a grocery store—where a typical visit generally lasts approximately 15 minutes—masks are currently mandatory). Additional variations of settings can be added to assess variations that may be relevant to consider (e.g. variations where mask use is not mandatory, etc.). A quick review of the criteria should be undertaken by the experts participating in the process to assess whether all proposed criteria remain relevant to the local context (e.g. a criterion for which all settings have the same score is not discriminating and may be omitted from the evaluation).
Depending on the data available to a decision-maker for assessing settings, and taking into account levels of uncertainty, variability and missing data, the essential and important criteria should be evaluated where possible as a first level of assessment of COVID-19 transmission risk between settings. Expert judgement and opinion can be used to fill in missing data. If sufficient information is available or can be appropriately assessed by experts, a more complete MCDA-style assessment of settings can be undertaken. A systematic evaluation process, such as offered by an MCDA evaluation, can be used to better understand the relative transmission risk between settings and, in particular, to highlight the strongest contributing factors as well as strongest protective factors for transmission risk between settings. This type of evaluation could help inform where mitigation measures should be considered to help reduce transmission risk. A setting that has criteria that score as poor or insufficient should be considered for mitigation and potential monitoring of transmission risk. As previously suggested, the use of scenarios can also be used to consider the changing epidemiology and its impact on transmission. For example, scenarios with different levels of vaccination, new levels of dominance of a VOC and levels of community transmission can be defined and used to evaluate how they may affect relative transmission risk of settings.
Depending on the data available and levels of uncertainty around these data, any resulting ranking will not represent a strict absolute assessment or ranking of settings, but rather a working local evaluation that reflects the information available and the relevant experts participating in the process.
As a reminder, the use of this framework is meant to help inform decision-making around transmission risk rather than make decisions, since other factors should be considered in a decision-making process around closures. To conduct a more complete assessment of closures/re-openings, additional dimensions beyond transmission risk factors alone such as social considerations, economic and other health factors could be considered for inclusion in a multi-step participatory MCDA process.
Conclusion
This project drew upon the latest evidence concerning transmission risk factors for COVID-19 in venues from which criteria for the evaluation of transmission risk was developed and then evaluated by experts. The resulting consensus list constitutes a set of important generic elements that can be applied to any setting as an objective and transparent framework to assess transmission risk in the venue. With further consideration of the local epidemiology of COVID-19, an overall risk of transmission assessment can be established. This work focused on the factors most directly related to COVID-19 transmission as a first level of concern in evaluating settings. Depending on the decision-making context (e.g. decisions around closures or re-openings) additional factors should be considered for inclusion in the decision-making process, including economic and social impacts. Additional layers of information could be added to the participatory MCDA process to include economic, social and health criteria so that trade-offs could be more fully examined, allowing for more informed decisions by decision-makers around closures and re-openings to reduce the transmission risk of COVID-19.
Authors’ statement
- VH — Conception and design, data acquisition and interpretation, writing–original draft, review and editing
- DM & JL — Data acquisition, data analysis, writing–review and editing
- AF, AO, PT and NHO — Conception and design, revising and editing of writing and critical review
- LW — Interpretation, revising and editing of writing and critical review
Competing interests
None.
Acknowledgements
The authors would like to thank members of the technical advisory group and the Canadian Pandemic Influenza Preparedness (CPIP) task force for their support and feedback in this project; as well as the Knowledge Synthesis team members within Public Health Risk Sciences Division of Public Health Agency of Canada for their invaluable knowledge synthesis products. The authors would also like to thank members of the Communicable and Infectious Disease Steering Committee and modelling secretariat for logistical support with this project.
Funding
None.
Appendix
A1: Rank orderings and generalized Mallows models
Imagine that we have a set of N rankings over n choices. In our case, N represents the number of experts and n denotes the criteria (items). The problem is to find the consensus ranking among the experts, which best agrees with the N rankings offered by the experts.
Consensus ranking finds application in social welfare analysis. In 1950, Kenneth Arrow showedFootnote 55 that if a decision-making body consists of at least two members with at least three options to decide among, then it is impossible to design a social welfare function that simultaneously satisfies all the reasonable requirements of a fair system:
- If every voter prefers alternative X over alternative Y, then the group prefers X over Y
- If every voter's preference between X and Y remains unchanged, then the group's preference between X and Y will also remain unchanged (even if voters' preferences between other pairs like X and Z, Y and Z, or Z and W change)
- There is no dictator: no single voter possesses the power to always determine the group's preference
Arrow's impossibility theorem has several technical conditions in its formal statement (see section A3) which defines the "fair" system. While the theorem tells us that no deterministic preferential voting system exists which satisfies the technical fairness requirements, in practice all systems do not work poorly at all times. The impossibility theorem finds application in the study of voting systems and important results can be found inFootnote 14Footnote 56.
Rankings consist of bijections of the set of integers {1,2,3,…, n} onto themselves. We will denote rankings with the symbols π and σ. For example, the ranking π = {2,4,1,3} means that item 1 is ranked second, which we denote as π(1) = 2; item two is ranked fourth, π(2) = 4. Every ranking has an inverse π-1 which gives the items in terms of the ranks: π x π-1 = e = {1,2,3,…, n}. Given a set of rankings, we would like to find the center or the consensus of the set over some distance measure between rankings. There are many distance metric for rankings, but in this article we will focus on two of the most popular: the Kendall distance and the Hamming distance. For any distance measure d(⋅,⋅) we have d(σ, π) = d(σ π-1, e). When the reference ranking is the identity ranking e we use the notion d(σ,e) = d(σ).
The Kendall distance between two ranking π and σ is defined by,
Equation 1:
dk(π,σ) = Σl< πj 1 [ j < σ l ]
The notation l <π j means that item l precedes j in ranking π. The Kendall distance counts the number of pairwise discrepancies between rankings. Withn items, the largest Kendall distance between any two rankings is n(n-1)/2. On the other hand, the Hamming distance dh(π,σ) counts the number of positions that disagree between two rankings,
Equation 2:
dk(π,σ) = Σnj=1(1 [ π (j) ≠ σ (j)]
Thus, the Hamming distance takes values between 2 and n inclusively. The Kendall and Hamming distance measures have the important property that they can be decomposed as a sum over n - 1 and n terms respectively,
Equation 3:
dk(π,σ) = Σnj=1 Vj (πσ-1),
dk(π,σ) = Σnj=1 Hj (πσ-1)
where,
Equation 4:
Vj(σ) = Σl>j 1[ l <σ j ],)
Equation 5:
Hj(σ)= { 0, iff σ(j) = j; 1, otherwise }
Given a metric for computing distances between rankings, we can build a probability measure over the space. Mallows modelFootnote 14 is an exponential location probability model over the rankings defined by a central ranking, σ0 and a dispersion parameter, θ namely,
Equation 6:
P(π) = ( e-θ dk,h(π,σ0) ) / ( ψ(θ) )
where ψ(θ) is a normalization constant. In a sense, the Mallows model is the extension of the Gaussian distribution to rankings. When θ > 0 the ranking σ0 is the mode of the distribution—the consensus—and as θ increases the distribution becomes more sharply peaked around σ0. If θ < 0, σ0 becomes the anti-mode.
We see that in the Mallows model, all rankings with the same distance from σ0 are degenerate in probability. With distance measures that decomposed as a sum like those in equation 3, we can break the degeneracy by attaching θj to each component of the sumFootnote 57. For the Kendall and Hamming distance, the Mallows model generalizes using discrepancy measures
Equation 7:
dk(π,π0; θ) = Σn-1j=1 θjVj (ππ0-1)
dh(π,π0; θ) = Σnj=1 θjHj (ππ0-1)
such that
Equation 8:
P(π) = (e dk,h(π,σ0;θ) ) / ( ψ(θ))
where θ = ( θ1, θ2, …). The central ranking σ0 and θ can be estimated by maximum likelihood or other approximate techniques.
The value of Vj (σ) in equation 3 gives the number of items in j + 1: n which are ranked before j in σ. Therefore, the parameters θj reflect the strength of a ranking around the consensus σ0 (j) = i in that the larger θj the larger the probability that π (j) ≤ i. That is, large θj in the generalized Mallows model with the Kendall distance implies that item j is ranking in the first i positions with high probability across all the rankings. Similarly, Hj (σ) of the Hamming distance counts the rank discrepancies. Thus, the parameter θj corresponds to the strength of consensus at rank j; large θj implies high agreement on the item at the j-th rank.
A2: Hamming parameters
To better see the strength of consensus in the rankings across items, the Hamming θj parameters against the cross-entropy of a criterion's rank is shown in Figure A1. The cross-entropy measures the amount of impurity in the ranks,ej = -Σ15i=1 pijlog (pij) ,
where j is the item label, i denotes the rank, and pij gives the probability of the i-th rank for item j. Criteria with large rank dispersion have high cross-entropy. The Hamming θj parameters also measure the strength of consensus at a given rank. Figure A1 shows criteria separating into three basic clusters with increasing consensus appearing towards the southeast corner of the plot. Under the Hamming model, the respondents have particularity strong agreement on the criteria at rank 1, 2 and 15.
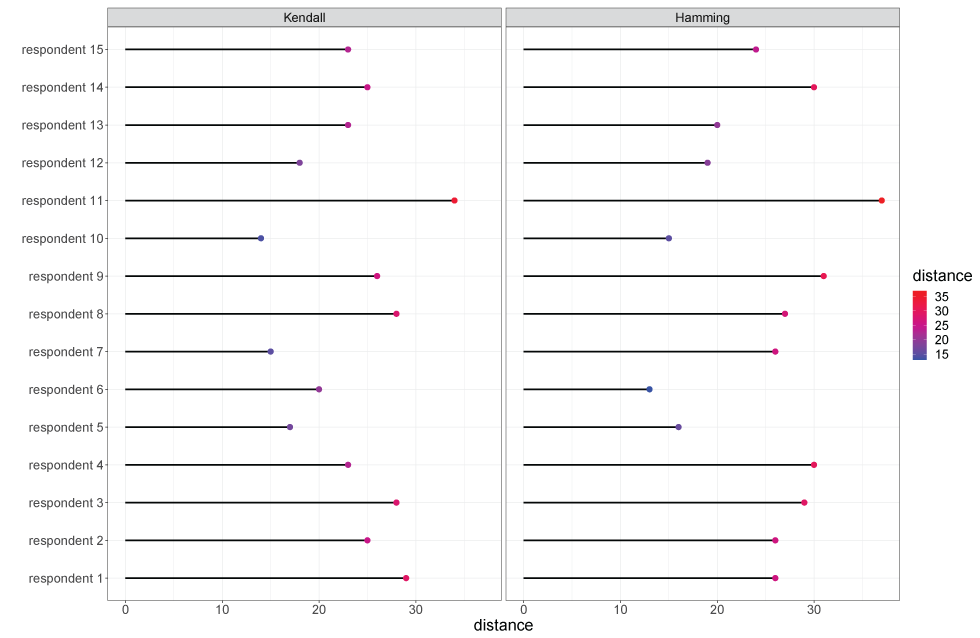
Figure A1: Kendall and Hamming distances of each respondent's ranking from the generalized Mallows model rankings
Text description: Figure 1
The graph shows each respondent's ranking distance from the consensus ranking under both the Kendall (on the left) and Hamming metrics (on the right). Distance is plotted on the x-axis and each line represents a respondent's distance from the consensus ranking. Shorter lines indicate closer distance and therefore more similarity to the consensus ranking. Respondent 10's ranking is closest to the consensus ranking under the Kendall metric while respondent 6's ranking is closest to the consensus ranking under the Hamming metric.
| Respondent | Kendall distance | Hamming distance |
|---|---|---|
| 1 | 29 | 26 |
| 2 | 25 | 26 |
| 3 | 28 | 29 |
| 4 | 23 | 30 |
| 5 | 17 | 16 |
| 6 | 20 | 13 |
| 7 | 15 | 26 |
| 8 | 28 | 27 |
| 9 | 26 | 31 |
| 10 | 14 | 15 |
| 11 | 34 | 37 |
| 12 | 18 | 19 |
| 13 | 23 | 20 |
| 14 | 25 | 30 |
| 15 | 23 | 24 |
A3: Formal conditions of Arrow's Impossibility Theorem
Suppose that we are asked to extract a preference order on a given set of options for society. Each individual provides a preference order on the set of outcomes. We desire a ranked voting electoral system, the preference aggregation rule or social welfare function, which transforms the set of preferences into a single global societal preference order. Arrow's theorem says that if there are at least two members in the society and at least three options to decide among, then it is impossible to design a preference aggregation rule that satisfies all of the conditions below at once (conditions assumed to define a "fair system"):
- Non-dictatorship: The social welfare function should account for the wishes of all voters
- Unrestricted domain, or universality: Each set of individual voter preferences should produce a unique and complete ranking of societal choices from the social welfare function. Thus:
- It must result in a complete ranking of preferences for society
- It must be deterministic; each time the preferences are presented in the same way, the welfare function generates the same societal preference order
- Independence of irrelevant alternatives (IIA): The social preference between two choices should depend only on the individual preferences between changes in rankings of irrelevant alternatives should have no impact on the societal ranking
- Monotonicity, or positive association of social and individual values: If any individual changes a preference order by promoting a choice, then the societal preference order should either promote that same choice in the new ranking or leave it at the same position. An individual should not be able to penalize a choice by increasing its preference
- Non-imposition, or citizen sovereignty: Every possible societal preference order should be achievable by some set of individual preferences
