
Salmonella enterica in Canada, 2006–2019

 Download this article as a PDF
Published by: The Public Health Agency of Canada
Issue: Volume 47-5/6: Responding to New Clusters of COVID-19
Date published: May/June 2021
ISSN: 1481-8531
Submit a manuscript
About CCDR
Browse
Volume 47-5/6: Responding to New Clusters of COVID-19
Surveillance
Salmonella enterica serovars associated with bacteremia in Canada, 2006–2019
Sandeep Tamber1, Brendan Dougherty2, Kimberly Nguy2
Affiliations
1 Food Directorate, Health Canada, Ottawa, ON
2 Centre for Foodborne, Environmental, and Zoonotic Infectious Diseases, Public Health Agency of Canada, Ottawa, ON
Correspondence
Suggested citation
Tamber S, Dougherty B, Nguy K. Salmonella enterica serovars associated with bacteremia in Canada, 2006–2019. Can Commun Dis Rep 2021;47(5/6):259-68. https://doi.org/10.14745/ccdr.v47i56a03
Keywords: typhoidal, nontyphoidal salmonellosis, National Enteric Surveillance Program, NESP
Abstract
Background: Members of the bacterial genus Salmonella cause salmonellosis, a disease with a spectrum of clinical presentations from a self-limiting gastroenteritis to more severe bacteremia, organ failure and sepsis. The genus consists of over 2,600 serological variants (serovars). Important differences in the pathogenesis of Salmonella serovars have been noted.
Objective: The purpose of this study was to determine which Salmonella serovars were more likely to be associated with bacteremia in Canada.
Methods: Information on the total number of Salmonella infections and blood isolations reported to the National Enteric Surveillance Program (NESP) from 2006 to 2019 was extracted for each serovar. The risk (proportion) and likelihood (odds) of bacteremia were calculated for all serovars.
Results: Of the 96,082 Salmonella cases reported to the NESP during the 14-year study period, 4.4% (95% CI: 4.3%–4.6%) were bacteremic. Twenty nontyphoidal Salmonella (NTS) serovars were associated with lower rates of bacteremia compared to all NTS serovars, and 19 NTS serovars were identified as having higher rates. Heidelberg, Oranienburg, Schwarzengrund, Virchow, Panama and Poona among the top 25 most commonly reported serovars in Canada during the study period.
Conclusion: The identification of serovars associated with Salmonella bacteremia in Canada is a first step towards understanding differences in pathogenesis and disease presentation.
Introduction
Salmonella bacteria are an important cause of human illness with a variety of clinical presentationsFootnote 1. The genus consists of two species, six subspecies and over 2,600 serological variants (serovars). Although all species and subspecies have been reported to cause illness, most human infections are caused by S. enterica spp. enterica (subspecies I)Footnote 2. Subspecies I include typhoidal and nontyphoidal serovars. Typhoidal serovars cause typhoid (enteric) fever, a serious invasive infection that can lead to multiorgan failure, bacteremia and sepsisFootnote 3. Nontyphoidal salmonellosis (NTS) mainly results in an acute self-limiting gastroenteritis, although more severe infection can occurFootnote 3. In Canada, the majority of reported salmonellosis cases—including about 925 hospitalizations and 17 deaths per year—are due to NTSFootnote 4.
One of the defining features of Salmonella is the presence of virulence genes encoded on sections of the genome called Salmonella pathogenicity islands (SPIs). All 2,659 Salmonella serovars possess SPIs and therefore encode the ability to cause infectionsFootnote 5. Nevertheless, only a small proportion of serovars are responsible for the majority of reported human infections, with over 80% of reported salmonellosis cases attributed to 20 serovars despite that over 200 serovars are reported annually in Canada Footnote 6. Although some frequently reported serovars are associated with greater exposure risks because they are more prevalent in the environment, the presence of several highly prevalent but rarely reported serovars suggests differences in virulence between serovars Footnote 7. This hypothesis is supported by studies on the pathogenesis of the typhoidal serovars and NTS serovars such as Choleraesuis, Dublin, Typhimurium and EnteritidisFootnote 1Footnote 7. The pathogenesis of most NTS serovars, however, is understudied and therefore poorly understood.
Examining the rates of Salmonella bacteremia in humans is one way to compare the relative virulence of serovars. Globally, about 2%–8% of reported NTS infections lead to bacteremia, and in some cases, bacteremia is not preceded by gastroenteritisFootnote 8Footnote 9Footnote 10Footnote 11. Patients with bacteremia are more likely to experience severe outcomes, including hospitalization and death, unless treated promptly with antibioticsFootnote 12Footnote 13. Therefore, the early identification of high-risk patients can improve the prognosis of Salmonella bacteremiaFootnote 9Footnote 14. Human risk factors for bacterial dissemination from the gut include compromised immunity, underlying medical conditions and extremes of age. Bacterial virulence factors involved in this process include adhesion proteins, immune evasion proteins and other secreted effectors Footnote 3Footnote 10Footnote 15Footnote 16.
The objective of this study was to compare bacteremia rates of different Salmonella subspecies and serovars to gain a better understanding of the differences in virulence. Identification of Salmonella serovars that are more or less likely to be associated with bacteremia is a key step towards the development of better predictors of Salmonella bacteremia and, eventually, better standards of care.
Methods
Data sources
The research team obtained data from the National Enteric Surveillance Program (NESP), which is administered by the Public Health Agency of CanadaFootnote 6. The data are a summary of laboratory data submitted weekly by provincial/territorial public health microbiology labs to the NESP. We extracted data from 2006 to 2019 for this analysis, including the number of Salmonella infections by subspecies, serovar and specimen source for extraintestinal isolations. Each reported isolation represents one clinical case. Blood isolates were recovered from blood and taken as a proxy for the number of bacteremia cases caused by Salmonella (Salmonella bacteremia). Total isolates were those recovered from all specimen sources.
Data analysis
Information on the reporting frequency and distribution of Salmonella subspecies and serovars was tabulated using Microsoft Excel 2016 and visualized using GraphPad Prism 8.0.2.
We calculated rates of Salmonella bacteremia over time by dividing the number of blood isolates reported every year by the number of total Salmonella reports for that year. The chi-square/Cochran–Armitage test for trend was used to determine if there was a linear trend in bacteremia rates over time. This temporal analysis was conducted at the genus level as well as at the level of individual NTS serovars.
Bacteremia proportions (BP) of individual Salmonella serovars or groups were calculated by dividing the number of blood isolates of a given serovar/group by the number of total isolates of the same serovar/group for all years combined. The 95% confidence intervals (CI) for BP were calculated using the following formula:
BP ±(1.96√(BP(1-BP) ))/n
For some analyses, we grouped serovars according to their subspecies designation (I–VI) and disease presentation (typhoidal or NTS). Significantly higher or lower rates of bacteremia in individual serovars or groups of Salmonella were assessed using Fisher exact test. To identify subspecies and serovars with higher rates of blood isolations, we compared the following groups: subspecies I versus all other subspecies (II, IIIa, IIIb, IV and II–VI); typhoidal serovars versus NTS serovars; and individual NTS serovar versus all NTS serovars.
Odds ratios were calculated by comparing the odds of a given serovar to infect the blood (a/b) to the odds of any NTS strain infecting the blood (c/d); where a and b are the respective number of blood and non-blood isolates for each serovar and c and d are the corresponding numbers for all NTS strains. We used the following formula to calculate the 95% CI for the odds ratio:
e^([ln(OR)±1.96√(1/a+1/b+1/c+1/d]))
We conducted all calculations and statistical tests using Microsoft Excel 2016 and GraphPad Prism 8.0.2. A p-value of less than 0.05 was considered significant for all statistical tests.
Results
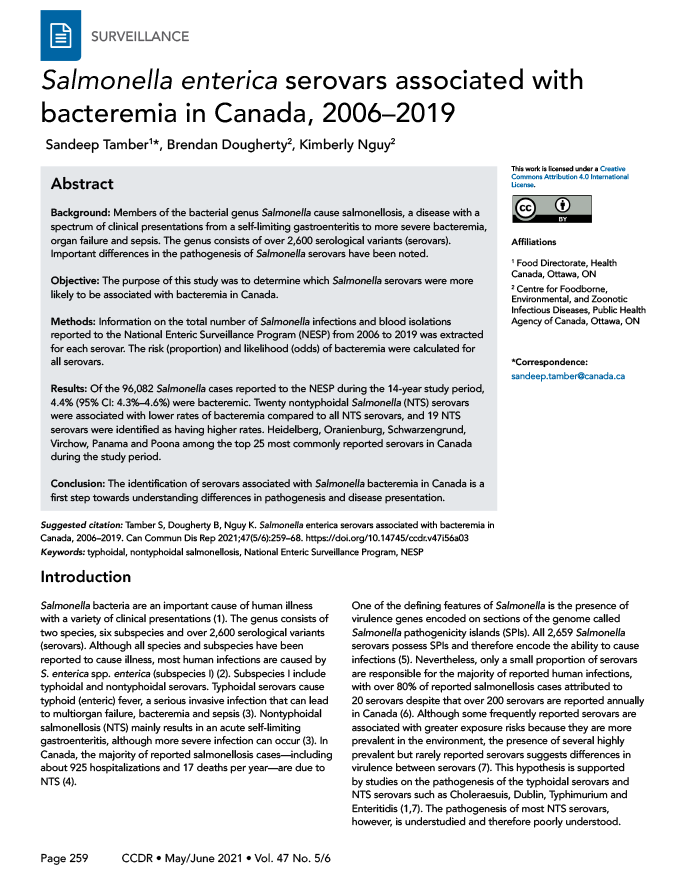
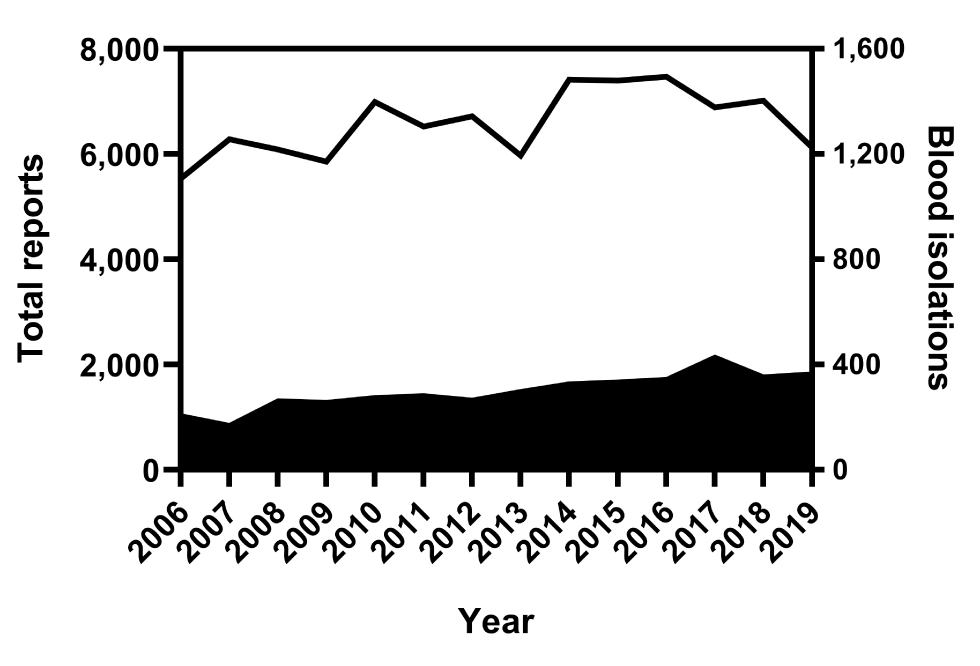
From 2006 to 2019, 96,082 Salmonella isolations were reported to the NESP. During this period, 4,252 bloodstream isolations were reported, that is, an overall bacteremia rate of 4.4% (95% CI: 4.3%–4.6%). Investigation of annual rates of bacteremia showed an increasing trend over the 14-year period, with an average annual rate of increase of 0.2% (95% CI: −0.4% to 0.7%) and a range of 2.7% in 2007 (95% CI: 2.4%–3.2%) to 5.9% (95% CI: 5.4%–6.5%) in 2017 (P<0.0001, Figure 1 and Figure 2).
Figure 1: Number of total reports and blood isolations of Salmonella bacteremia as reported to the NESP, 2006–2019Footnote a
Text description: Figure 1
| Year | Total reports | Blood isolations |
|---|---|---|
| 2006 | 5,745 | 211 |
| 2007 | 6,455 | 175 |
| 2008 | 6,358 | 269 |
| 2009 | 6,119 | 263 |
| 2010 | 7,268 | 280 |
| 2011 | 6,813 | 288 |
| 2012 | 6,991 | 271 |
| 2013 | 6,278 | 304 |
| 2014 | 7,748 | 333 |
| 2015 | 7,738 | 340 |
| 2016 | 7,820 | 350 |
| 2017 | 7,323 | 434 |
| 2018 | 7,375 | 359 |
| 2019 | 6,492 | 370 |
Figure 2: Change in Salmonella bacteremia proportions over time, based on reports to the NESP, 2006–2019Footnote a
Text description: Figure 2
| Year | Bacteremia proportion (%) | 95% confidence interval |
|---|---|---|
| 2006 | 3.7 | 3.2–4.2 |
| 2007 | 2.7 | 2.3–3.1 |
| 2008 | 4.2 | 3.8–4.8 |
| 2009 | 4.3 | 3.8–4.8 |
| 2010 | 3.9 | 3.4–4.3 |
| 2011 | 4.2 | 3.8–4.7 |
| 2012 | 3.9 | 3.4–4.4 |
| 2013 | 4.8 | 4.3–5.4 |
| 2014 | 4.3 | 3.9–4.8 |
| 2015 | 4.4 | 4.0–4.9 |
| 2016 | 4.5 | 4.0–5.0 |
| 2017 | 5.9 | 5.4–6.5 |
| 2018 | 4.9 | 4.4–5.4 |
| 2019 | 5.7 | 5.2–6.3 |
Of the 96,082 reported Salmonella isolates, 95,385 (99.3%) were typed to the serovar level, 258 (0.3%) to the subspecies level and 439 (0.5%) to the genus level. The genus group was excluded from further analysis. Of the 4,252 blood isolates, seven were excluded from further analysis because they were only typed to the genus level.
Table 1 lists the subspecies distribution of the reported typed isolates. There were only two reports of S. bongori during the reporting period; both were isolated from stool. The remaining isolates were S. enterica, with 99.3% of the total isolates and 99.5% of blood isolates typed as subspecies I.
| Species | Subspecies | Total reports | Blood reports | ||
|---|---|---|---|---|---|
| Number of serovars | Number of isolates | Number of serovars | Number of isolates | ||
| Salmonella enterica | enterica (I) | 574 | 94,972 | 139 | 4,218 |
| salamae (II) | 40 | 80 | 2 | 2 | |
| arizoniae (IIIa) | 19 | 104 | 4 | 5 | |
| diarizonae (IIIb) | 95 | 285 | 4 | 4 | |
| houtenae (IV) | 24 | 199 | 4 | 9 | |
| indica (VI) | 1 | 1 | 0 | 0 | |
| Salmonella bongori | NA | 1 | 1 | 0 | 0 |
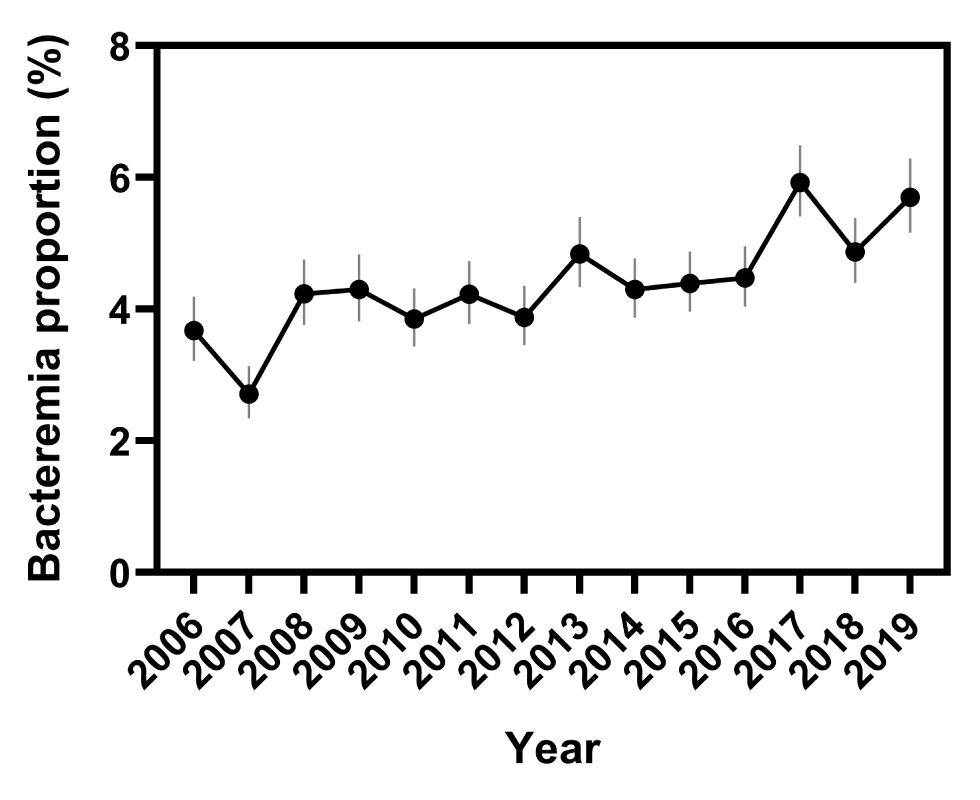
The bacteremia rate of subspecies I was 4.4% (95% CI: 4.3%–4.6%). With the exception of subspecies IIIb, this rate did not differ significantly from those of the other subspecies even when they were analyzed as an aggregate group to reduce the imprecision associated with low numbers of isolates (P=0.0728, Figure 3). The bacteremia rate of subspecies IIIb, 1.4% (95% CI: 0.5%–3.5%), was significantly lower than that of other subspecies I (P=0.0087).
Figure 3: Comparison of bacteremia proportions of Salmonella enterica subspecies, based on reports to the NESP, 2006–2019Footnote aFootnote bFootnote c
Text description: Figure 3
| Salmonella sub-species | Bacteremia proportion (%) | 95% confidence interval |
|---|---|---|
| Salmonella (all subspecies, I-VI) | 4.4 | 4.3–4.6 |
| Subspecies I | 4.4 | 4.3–4.6 |
| Subspecies II-VI | 3.0 | 1.9–4.6 |
| Subspecies II | 2.5 | 0.4–8.7 |
| Subspecies IIIa | 4.8 | 2.1–10.8 |
| Subspecies IIIb | 1.4 | 0.5–3.6 |
| Subspecies IV | 4.5 | 2.4–8.4 |
Of the isolates in subspecies I, there were 3,678 total isolations of typhoidal strains (2,350 Typhi, 1,198 Paratyphi A, 124 Paratyphi B and 6 Paratyphi C) and 1,295 blood isolations (794 Typhi, 485 Paratyphi A, 16 Paratyphi B and 0 Paratyphi C). The bacteremia rate of typhoidal strains was 35.2% (95% CI: 33.7%–36.8%), significantly higher than the rate calculated for nontyphoidal strains (3.2%, 95% CI: 3.1%–3.3%, P<0.0001, Figure 4).
Figure 4: Comparison of proportions of bacteremia of typhoidal and nontyphoidal strains of Salmonella enterica subspecies, based on reports to the NESP, 2006–2019Figure 4 footnote aFigure 4 footnote bFigure 4 footnote c
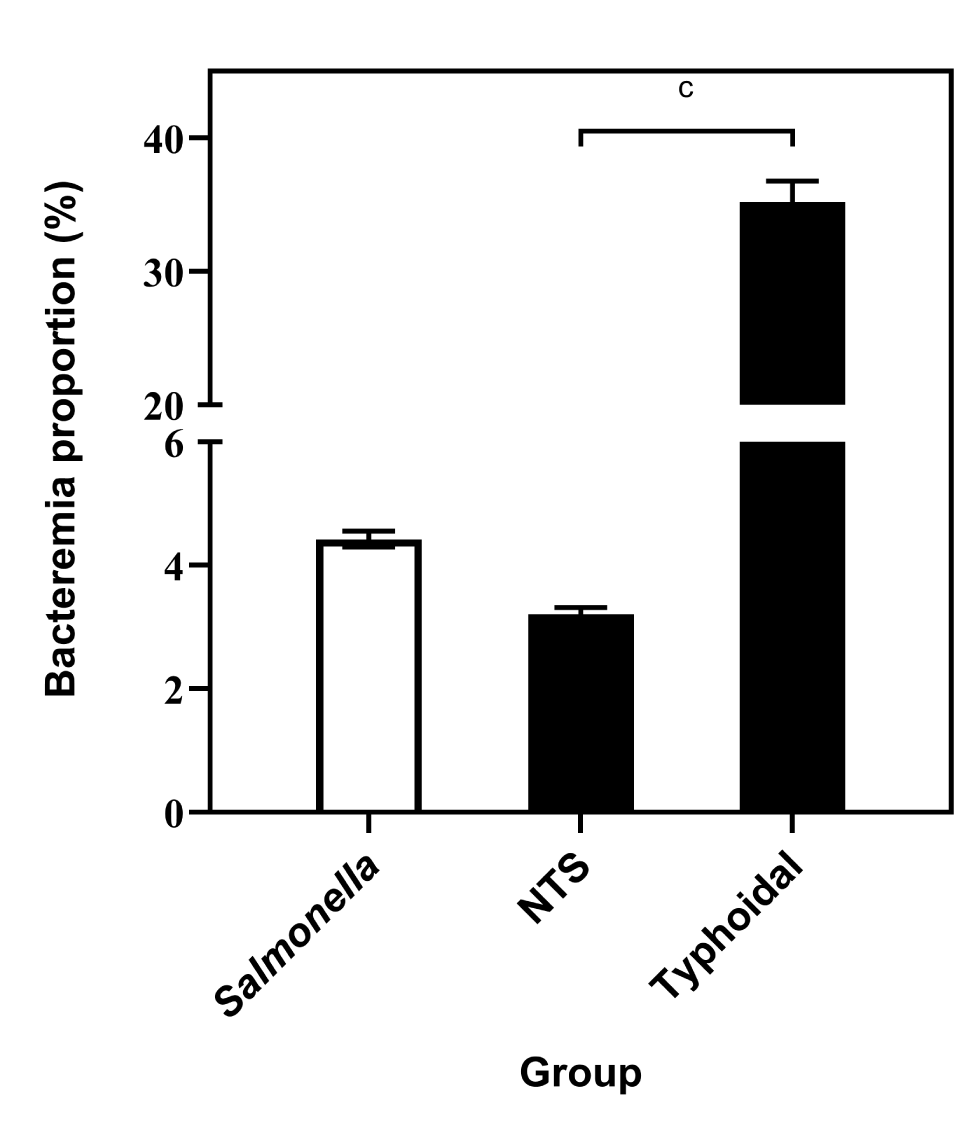
Text description: Figure 4
| Salmonella group | Bacteremia proportion (%) | 95% confidence interval |
|---|---|---|
| Salmonella (all groups) | 4.4 | 4.3–4.6 |
| Nontyphoidal (NTS) | 3.2 | 3.1–3.3 |
| Typhoidal | 35.2 | 33.7–36.8 |
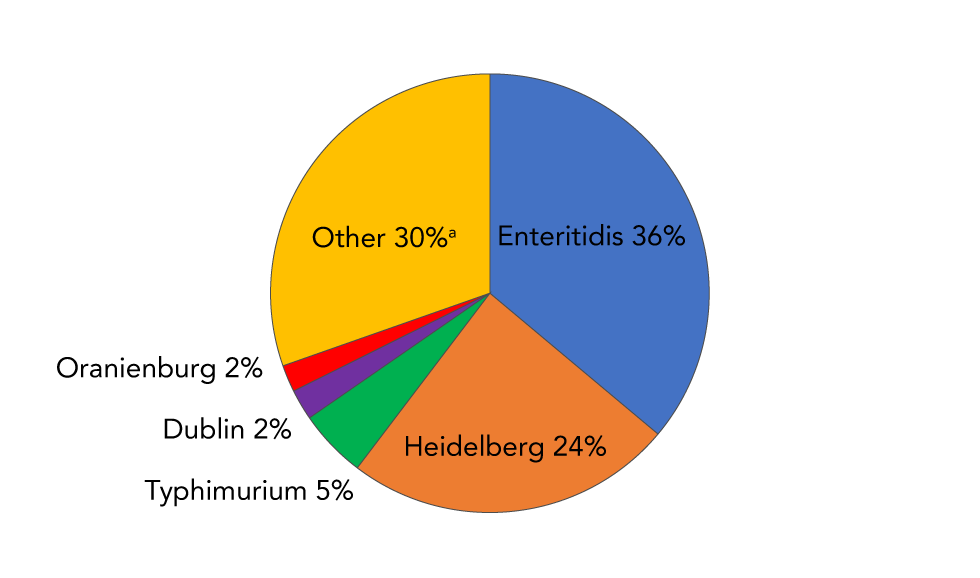
Of the 570 NTS serovars reported to the NESP from 2006 to 2019, 136 were associated with bacteremia. Enteritidis was the most frequently associated with bacteremia, with over 1,000 reports. With Heidelberg, these two serovars accounted for 60% of the blood reports (Figure 5). Typhimurium, Dublin and Oranienburg were, respectively, the third, fourth and fifth most frequently serovars reported in blood (Figure 5).
Figure 5: Frequency distribution of the top five Salmonella enterica nontyphoidal serovars isolated from blood as reported to the NESP, 2006–2019Figure 5 footnote a
Text description: Figure 5
| Salmonella serovar | Percentage of blood isolations |
|---|---|
| Enteritidis (blue) | 36.1 |
| Heidelberg (orange) | 24.2 |
| Typhimurium (green) | 5.0 |
| Dublin (purple) | 2.3 |
| Oranienburg (red) | 2.0 |
| All other serovars (n=131) (yellow) | 30.4 |
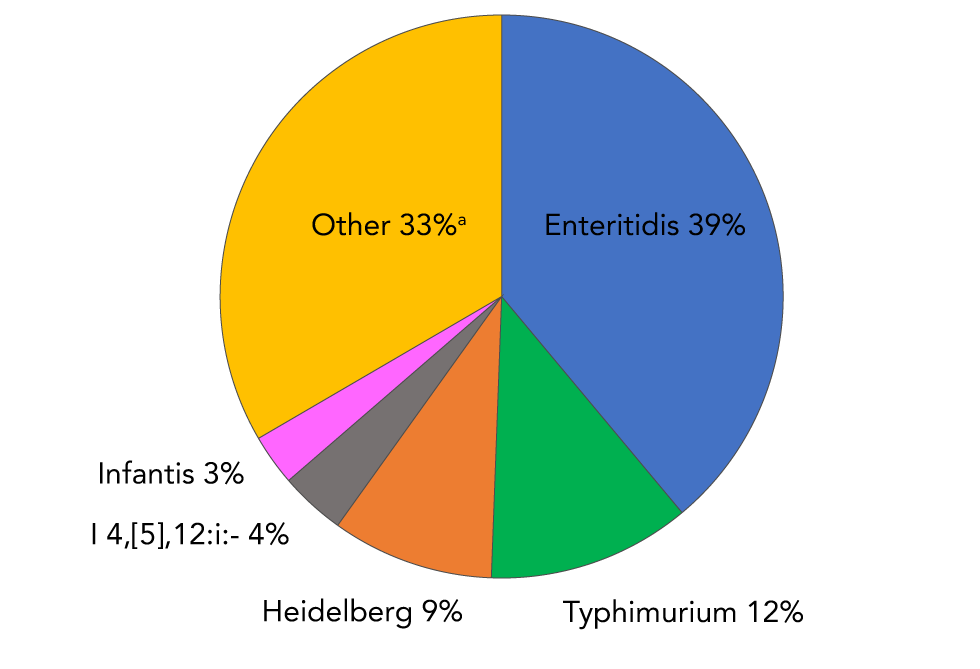
Sixty-three serovars were associated with only one blood report during the 14-year reporting period. As a comparison, the top two NTS serovars from all specimen sources were Enteritidis and Typhimurium, accounting for 50% of the total reports. Serovars Heidelberg, I 4,[5],12:i:- and Infantis rounded out the top 5 (Figure 6).
Figure 6: Frequency distribution of the top five Salmonella enterica nontyphoidal isolated from all specimen sources as reported to the NESP, 2006–2019Figure 6 footnote a
Text description: Figure 6
| Salmonella serovar | Percentage of total isolations |
|---|---|
| Enteritidis (blue) | 38.9 |
| Typhimurium (green) | 11.7 |
| Heidelberg (orange) | 9.3 |
| I 4,[5],12:i:- (grey) | 3.8 |
| Infantis (pink) | 2.9 |
| All other serovars (n=565) (yellow) | 33.4 |
Bacteremia proportions for individual NTS serovars associated with at least 10 infections are listed in Table 2 in descending order of frequency.
SerovarTable 2 footnote a |
Number of blood isolates | Total number of isolates | Bacteremia rate (%)Table 2 footnote b | 95% CI (%) | p-valueTable 2 footnote c | Odds ratioTable 2 footnote d | 95% CI |
|---|---|---|---|---|---|---|---|
| NTS | 2,917 | 91,088 | 3.2 | 3.1–3.3 | NA | NA | NA |
| EnteritidisFootnote e | 1,053Footnote e | 35,459Footnote e | 3.0Footnote e | 2.8–3.2Footnote e | 0.0326Footnote e | 0.9Footnote e | 0.9–1.0Footnote e |
| TyphimuriumFootnote e | 147Footnote e | 10,617Footnote e | 1.4Footnote e | 1.2–1.6Footnote e | <0.0001Footnote e | 0.4Footnote e | 0.4–0.5Footnote e |
| HeidelbergFootnote f | 707Footnote f | 8,482Footnote f | 8.3Footnote f | 7.8–8.9Footnote f | <0.0001Footnote f | 2.7Footnote f | 2.5–3.0Footnote f |
| I 4,[5],12:i:-Footnote e | 52Footnote e | 3,430Footnote e | 1.5Footnote e | 1.2–2.0Footnote e | <0.0001Footnote e | 0.5Footnote e | 0.4–0.6Footnote e |
| InfantisFootnote e | 28Footnote e | 2,672Footnote e | 1.0Footnote e | 0.7–1.5Footnote e | <0.0001Footnote e | 0.3Footnote e | 0.2–0.5Footnote e |
| ThompsonFootnote e | 46Footnote e | 2,582Footnote e | 1.8Footnote e | 1.3–2.4Footnote e | <0.0001Footnote e | 0.6Footnote e | 0.4–0.7Footnote e |
| NewportFootnote e | 38Footnote e | 2,474Footnote e | 1.5Footnote e | 1.1–2.1Footnote e | <0.0001Footnote e | 0.5Footnote e | 0.3–0.7Footnote e |
| Saintpaul | 47 | 1,466 | 3.2 | 2.4–4.2 | 0.9405 | 1.0 | 0.7–1.3 |
| Javiana | 45 | 1,384 | 3.3 | 2.4–4.3 | 0.8778 | 1.0 | 0.8–1.4 |
| AgonaFootnote e | 15Footnote e | 1,255Footnote e | 1.2Footnote e | 0.7–2.0Footnote e | <0.0001Footnote e | 0.4Footnote e | 0.2–0.6Footnote e |
| BraenderupFootnote e | 6Footnote e | 1,208Footnote e | 0.5Footnote e | 0.2–1.1Footnote e | <0.0001Footnote e | 0.2Footnote e | 0.1–0.3Footnote e |
| HadarFootnote e | 13Footnote e | 1,077Footnote e | 1.2Footnote e | 0.7–2.0Footnote e | <0.0001Footnote e | 0.4Footnote e | 0.2–0.6Footnote e |
| OranienburgFootnote f | 58Footnote f | 1,063Footnote f | 5.5Footnote f | 4.2–7.0Footnote f | 0.0002Footnote f | 1.7Footnote f | 1.3–2.3Footnote f |
| StanleyFootnote e | 19Footnote e | 981Footnote e | 1.9Footnote e | 1.2–3.0Footnote e | 0.0221Footnote e | 0.6Footnote e | 0.4–0.9Footnote e |
| MuenchenFootnote e | 11Footnote e | 884Footnote e | 1.2Footnote e | 0.7–2.2Footnote e | 0.0003Footnote e | 0.4Footnote e | 0.2–0.7Footnote e |
| I 4,[5],12:b:- | 24 | 880 | 2.7 | 1.8–4.0 | 0.4998 | 0.9 | 0.6–1.3 |
| Paratyphi B var. JavaFootnote f | 41Footnote f | 874Footnote f | 4.7Footnote f | 3.5–6.3Footnote f | 0.0201Footnote f | 1.5Footnote f | 1.1–2.0Footnote f |
| Montevideo | 12 | 544 | 2.2 | 1.3–3.8 | 0.2207 | 0.7 | 0.4–1.2 |
| MbandakaFootnote e | 6Footnote e | 474Footnote e | 1.3Footnote e | 0.6–2.7Footnote e | 0.0122Footnote e | 0.4Footnote e | 0.2–0.9Footnote e |
| VirchowFootnote f | 28Footnote f | 425Footnote f | 6.6Footnote f | 4.6–9.4Footnote f | 0.0004Footnote f | 2.1Footnote f | 1.5–3.1Footnote f |
| SchwarzengrundFootnote f | 30Footnote f | 422Footnote f | 7.1Footnote f | 5.0–10.0Footnote f | <0.0001Footnote f | 2.3Footnote f | 1.6–3.4Footnote f |
| PanamaFootnote f | 47Footnote f | 414Footnote f | 11.3Footnote f | 8.6–14.8Footnote f | <0.0001Footnote f | 3.9Footnote f | 2.8–5.3Footnote f |
| PoonaFootnote f | 35Footnote f | 396Footnote f | 8.8Footnote f | 6.4–12.0Footnote f | <0.0001Footnote f | 2.9Footnote f | 2.1–4.2Footnote f |
| KentuckyFootnote e | 1Footnote e | 395Footnote e | 0.3Footnote e | 0.01–1.4Footnote e | <0.0001Footnote e | 0.1Footnote e | 0.01–0.6Footnote e |
| AnatumFootnote e | 3Footnote e | 378Footnote e | 0.8Footnote e | 0.2–2.3Footnote e | 0.0046Footnote e | 0.2Footnote e | 0.1–0.8Footnote e |
| BrandenburgFootnote f | 27Footnote f | 346Footnote f | 7.8Footnote f | 5.4–11.1Footnote f | <0.0001Footnote f | 2.6Footnote f | 1.7–3.8Footnote f |
| Derby | 5 | 342 | 1.5 | 0.6–3.4 | 0.0868 | 0.5 | 0.2–1.1 |
| Uganda | 13 | 328 | 4.0 | 2.3–6.7 | 0.4292 | 1.2 | 0.7–2.2 |
| LitchfieldFootnote e | 2Footnote e | 317Footnote e | 0.6Footnote e | 0.1–2.2Footnote e | 0.0055Footnote e | 0.2Footnote e | 0.1–0.8Footnote e |
| BareillyFootnote e | 3Footnote e | 308Footnote e | 1.0Footnote e | 0.3–2.8Footnote e | 0.0216Footnote e | 0.3Footnote e | 0.1–0.9Footnote e |
| ReadingFootnote f | 28Footnote f | 304Footnote f | 9.2Footnote f | 6.4–13.0Footnote f | <0.0001Footnote f | 3.1Footnote f | 2.1–4.5Footnote f |
| Hartford | 6 | 297 | 2.0 | 0.9–4.3 | 0.3200 | 0.6 | 0.3–1.4 |
| SandiegoFootnote f | 32Footnote f | 290Footnote f | 11.0Footnote f | 7.9–15.2Footnote f | <0.0001Footnote f | 3.7Footnote f | 2.6–5.4Footnote f |
| Kiambu | 4 | 275 | 1.5 | 0.6–3.7 | 0.1197 | 0.5 | 0.2–1.2 |
| Bovismorbificans | 8 | 255 | 3.1 | 1.6–6.1 | >0.9999 | 1.0 | 0.5–2.0 |
| BertaFootnote e | 2Footnote e | 248Footnote e | 0.8Footnote e | 0.1–2.9Footnote e | 0.0278Footnote e | 0.3Footnote e | 0.1–1.0Footnote e |
| ChesterFootnote f | 14Footnote f | 198Footnote f | 7.1Footnote f | 4.3–11.5Footnote f | 0.0066Footnote f | 2.3Footnote f | 1.3–4.0Footnote f |
| DublinFootnote f | 66Footnote f | 187Footnote f | 35.3Footnote f | 28.8-42.4Footnote f | <0.0001Footnote f | 16.5Footnote f | 12.2–22.3Footnote f |
| Corvallis | 3 | 185 | 1.6 | 0.4–4.7 | 0.2948 | 0.5 | 0.2–1.6 |
| Manhattan | 3 | 182 | 1.6 | 0.4–4.7 | 0.2944 | 0.5 | 0.2–1.6 |
| Mississippi | 1 | 170 | 0.6 | 0.03–3.3 | 0.0478 | 0.2 | 0.02–1.3 |
| Tennessee | 2 | 160 | 1.3 | 0.2–4.4 | 0.2534 | 0.4 | 0.1–1.5 |
| Give | 4 | 150 | 2.7 | 1.0–6.7 | >0.9999 | 0.8 | 0.3–2.2 |
| Muenster | 8 | 149 | 5.4 | 2.7–10.2 | 0.1536 | 1.7 | 0.8–3.5 |
| Hvittingfoss | 1 | 137 | 0.7 | 0.04–4.0 | 0.1379 | 0.2 | 0.03–1.6 |
| Rissen | 2 | 134 | 1.5 | 0.3–5.3 | 0.4533 | 0.5 | 0.1–2.1 |
| Eastbourne | 6 | 129 | 4.7 | 2.1–9.8 | 0.3125 | 1.5 | 0.7–3.3 |
| Havana | 2 | 116 | 1.7 | 0.3–6.1 | 0.5927 | 0.5 | 0.1–2.1 |
| I Rough-O:-:- | 1 | 116 | 0.9 | 0.04–4.7 | 0.1905 | 0.3 | 0.04–1.9 |
| Oslo | 2 | 106 | 1.9 | 0.3–6.6 | 0.7781 | 0.6 | 0.1–2.4 |
| Haifa | 4 | 94 | 4.3 | 1.7–10.4 | 0.5478 | 1.3 | 0.5–3.7 |
| London | 3 | 91 | 3.3 | 0.9–9.2 | 0.7681 | 1.0 | 0.3–3.3 |
| Indiana | 2 | 91 | 2.2 | 0.4–7.7 | >0.9999 | 0.7 | 0.2–2.8 |
| I 9,12-:- | 3 | 88 | 3.4 | 0.9–9.6 | 0.7610 | 1.1 | 0.3–3.4 |
| Ohio | 2 | 85 | 2.4 | 0.4–8.2 | >0.9999 | 0.7 | 0.2–3.0 |
| DurbanFootnote f | 8Footnote f | 84Footnote f | 9.5Footnote f | 4.9–17.7Footnote f | 0.0056Footnote f | 3.2Footnote f | 1.5–6.6Footnote f |
| TelelkebirFootnote f | 6Footnote f | 75Footnote f | 8.0Footnote f | 3.7–16.4Footnote f | 0.0334Footnote f | 2.6Footnote f | 1.1–6.1Footnote f |
| Bredeney | 4 | 71 | 5.6 | 2.2–13.6 | 0.2921 | 1.8 | 0.7–4.9 |
| Pomona | 2 | 65 | 3.1 | 0.6–10.5 | >0.9999 | 1.0 | 0.2–3.9 |
| Minnesota | 1 | 57 | 1.8 | 0.09–9.3 | >0.9999 | 0.5 | 0.1–3.9 |
| Carrau | 3 | 54 | 5.6 | 1.5–15.1 | 0.2495 | 1.8 | 0.6–5.7 |
| Cubana | 1 | 53 | 1.9 | 0.1–9.9 | >0.9999 | 0.6 | 0.1–4.2 |
| Bonariensis | 4 | 52 | 7.7 | 3.0–18.2 | 0.0487 | 2.5 | 0.9-7.0 |
| Aberdeen | 2 | 51 | 3.9 | 0.7–13.2 | 0.6792 | 1.2 | 0.3–5.1 |
| Rubislaw | 2 | 51 | 3.9 | 0.7–13.2 | 0.6792 | 1.2 | 0.3–5.1 |
| Gaminara | 1 | 51 | 2.0 | 0.1–10.3 | >0.9999 | 0.6 | 0.1–4.4 |
| Cerro | 1 | 49 | 4.1 | 0.7–13.7 | 0.6710 | 1.2 | 0.3–5.3 |
| Gatuni | 1 | 46 | 2.2 | 0.1–11.3 | >0.9999 | 0.7 | 0.1–4.9 |
| Worthington | 1 | 45 | 2.2 | 0.1–11.6 | >0.9999 | 1.0 | 0.1–5.0 |
| UrbanaFootnote f | 4Footnote f | 42Footnote f | 9.5Footnote f | 3.8–22.1Footnote f | 0.0450Footnote f | 3.2Footnote f | 1.1–8.9Footnote f |
| I 6,7:r:- | 1 | 41 | 2.4 | 0.1–12.6 | >0.9999 | 0.8 | 0.1–5.5 |
| Arechavaleta | 2 | 39 | 5.1 | 0.9–16.9 | 0.3566 | 1.6 | 0.4–6.8 |
| Agbeni | 1 | 39 | 2.6 | 0.1–13.2 | >0.9999 | 0.8 | 0.1–5.8 |
| Nessziona | 2 | 38 | 5.3 | 0.9–17.3 | 0.3449 | 1.7 | 0.4–7.0 |
| LomalindaFootnote f | 5Footnote f | 35Footnote f | 14.3Footnote f | 6.3–29.4Footnote f | 0.0049Footnote f | 5.0Footnote f | 2.0–13.0Footnote f |
| Johannesburg | 3 | 34 | 8.8 | 3.0–23.0 | 0.0944 | 2.9 | 0.9–9.6 |
| CholeraesuisFootnote f | 12Footnote f | 33Footnote f | 36.4Footnote f | 22.2–53.3Footnote f | <0.0001Footnote f | 17.2Footnote f | 8.5–351Footnote f |
| StanleyvilleFootnote f | 7Footnote f | 33Footnote f | 21.2Footnote f | 10.7–37.8Footnote f | <0.0001Footnote f | 8.1Footnote f | 3.5–18.7Footnote f |
| Ebrie | 1 | 33 | 3.0 | 0.2–15.3 | >0.9999 | 1.0 | 0.1–6.9 |
| Kottbus | 1 | 32 | 3.1 | 0.2–15.7 | >0.9999 | 1.0 | 0.1–7.1 |
| LivingstonFootnote e | 1 | 32 | 3.1 | 0.2–15.7 | >0.9999 | 1.0 | 0.1–7.1 |
| I 6,7:c:-Footnote f | 9Footnote f | 30Footnote f | 30.0Footnote f | 16.7–47.9Footnote f | <0.0001Footnote f | 12.9Footnote f | 5.9–28.3Footnote f |
| Nima | 1 | 28 | 3.6 | 0.2–17.7 | 0.5981 | 1.1 | 0.2–8.2 |
| Chailey | 2 | 26 | 7.7 | 1.4–24.1 | 0.2021 | 2.5 | 0.6–10.6 |
| I 6,7:k:- | 1 | 26 | 3.8 | 0.2–18.9 | 0.5710 | 1.2 | 0.2–8.9 |
| Daytona | 1 | 25 | 4.0 | 0.2–19.5 | 0.5569 | 1.3 | 0.2–9.3 |
| Meleagridis | 1 | 25 | 4.0 | 0.2–19.5 | 0.5569 | 1.3 | 0.2–9.3 |
| Colindale | 1 | 24 | 4.2 | 0.2–20.2 | 0.5422 | 1.3 | 0.2–9.7 |
| I Rough-O:g,m:- | 2 | 23 | 8.7 | 1.6–27.8 | 0.1671 | 2.9 | 0.7–12.3 |
| Monschaui | 1 | 23 | 4.3 | 0.2–21.0 | 0.5270 | 1.4 | 0.2–10.2 |
| Baildon | 1 | 22 | 4.5 | 0.2–21.8 | 0.5114 | 1.4 | 0.2–10.7 |
| Coeln | 1 | 22 | 4.5 | 0.2–21.8 | 0.5114 | 1.4 | 0.2–10.7 |
| Emek | 1 | 22 | 4.5 | 0.2–21.8 | 0.5114 | 1.4 | 0.2–10.7 |
| Kintambo | 1 | 20 | 5.0 | 0.3–23.6 | 0.4785 | 1.6 | 0.2–11.9 |
| Praha | 1 | 17 | 5.9 | 0.3–27.0 | 0.4250 | 1.9 | 0.3–14.2 |
| Michigan | 1 | 16 | 6.3 | 0.3–28.3 | 0.4060 | 2.0 | 0.3–15.2 |
| Wandsworth | 1 | 16 | 6.3 | 0.3–28.3 | 0.4060 | 2.0 | 0.3–15.2 |
| I Rough-O:r:1,2 | 1 | 15 | 6.7 | 0.3–29.8 | 0.3864 | 2.2 | 0.3–16.4 |
| Glostrup | 1 | 14 | 7.1 | 0.4–31.5 | 0.3661 | 2.3 | 0.3–17.7 |
| I 4,[5],12:e,h:- | 1 | 14 | 7.1 | 0.4–31.5 | 0.3661 | 2.3 | 0.3–17.7 |
| Takoradi | 1 | 13 | 7.6 | 0.4–33.3 | 0.3451 | 2.5 | 0.3–19.3 |
| Napoli | 1 | 12 | 8.3 | 0.4–35.4 | 0.3234 | 2.7 | 0.4–21.3 |
| Nottingham | 1 | 10 | 10.0 | 0.5–40.4 | >0.9999 | 3.4 | 0.4–26.5 |
Nineteen serovars had bacteremia rates significantly higher than that of the NTS group. In terms of frequency, these serovars varied from the third most reported (Heidelberg) to the 85th (I 6.7:c:-). The serovars with the highest rates of bacteremia were Choleraesuis (33 reports, bacteremia rate 36.4%, 95% CI: 22.2%–53.3%); Dublin (187 reports, bacteremia rate 35.3%, 95% CI: 28.8%–42.4%); and I 6,7:c:- (30 reports, bacteremia rate 30.0%, 95% CI: 16.7%–47.9%).
Table 3 lists the NTS serovars with at least 10 reports and no reposted blood isolations. Of these, 20 had significantly lower rates of bacteremia compared to the group of all NTS serovars. Included in this group were Enteritidis and Typhimurium. In addition, 48 serovars reported at least 10 times between 2006 and 2019 were not associated with any blood isolations.
| Serovar | Total isolates | p-valueTable 3 footnote a |
|---|---|---|
| Weltevreden | 382 | <0.0001 |
| Senftenberg | 313 | <0.0001 |
| Mississippi | 170 | 0.0478 |
| Blockley | 117 | 0.0568 |
| Miami | 105 | 0.0847 |
| I 9,12:-:1,5 | 100 | 0.0804 |
| Adelaide | 86 | 0.1188 |
| Albany | 86 | 0.1188 |
| Alachua | 54 | 0.4216 |
| Concord | 53 | 0.4187 |
| Cotham | 46 | 0.4059 |
| Norwich | 46 | 0.4059 |
| Ealing | 45 | 0.4053 |
| Singapore | 44 | 0.4050 |
| Richmond | 38 | 0.6349 |
| I 4,[5],12:-:1,2 | 36 | 0.6309 |
| I 6,7:-:- | 31 | 0.6260 |
| Altona | 27 | >0.9999 |
| I 4,[5],12:d:- | 27 | >0.9999 |
| Potsdam | 25 | >0.9999 |
| I Rough-O:HNM | 25 | >0.9999 |
| Ago | 24 | >0.9999 |
| Bardo | 24 | >0.9999 |
| Irumu | 23 | >0.9999 |
| Liverpool | 23 | >0.9999 |
| Othmarschen | 23 | >0.9999 |
| Istanbul | 21 | >0.9999 |
| Fluntern | 20 | >0.9999 |
| Putten | 20 | >0.9999 |
| I 6,8:e,h:- | 20 | >0.9999 |
| Kedougou | 19 | >0.9999 |
| Larochelle | 19 | >0.9999 |
| I 6,7:e,h:- | 19 | >0.9999 |
| Isangi | 16 | >0.9999 |
| Goettingen | 15 | >0.9999 |
| Lexington | 15 | >0.9999 |
| Amsterdam | 14 | >0.9999 |
| Apapa | 14 | >0.9999 |
| Kingabwa | 13 | >0.9999 |
| I 13,23:b:- | 13 | >0.9999 |
| Abony | 12 | >0.9999 |
| I Rough-O:i:1,2 | 12 | >0.9999 |
| Kisarawe | 11 | >0.9999 |
| Saphra | 10 | >0.9999 |
| I 6,8:-:- | 10 | >0.9999 |
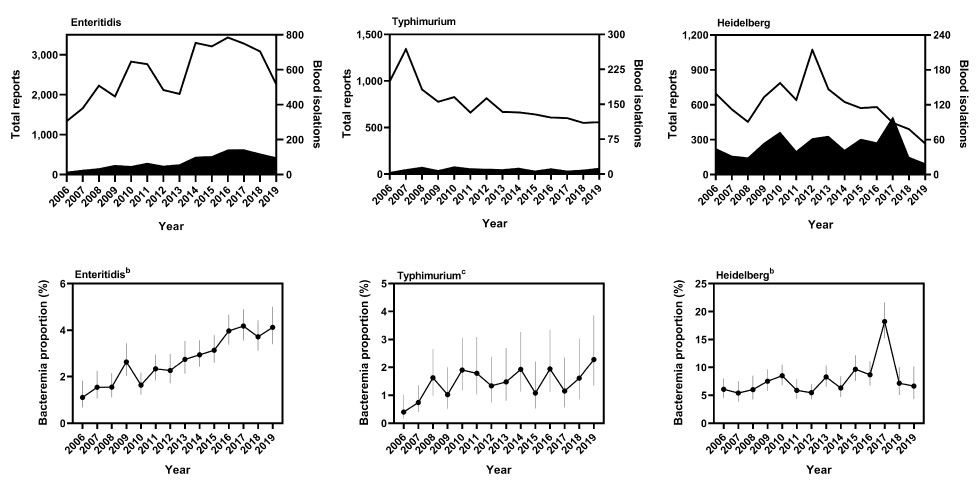
The reporting trends of the three most frequently reported serovars, Enteritidis, Typhimurium and Heidelberg, are shown in Figure 7. From 2006 to 2019, the number of blood reports for serovar Enteritidis increased from 15 to 97 and the number of total reports increased from 1,338 to 2,254, a bacteremia rate that increased from 1.1% (95% CI: 0.7%–1.8%) to 4.1% (95% CI: 3.4%–5.0%, P<0.0001). The bacteremia rate of Typhimurium also appeared to increase during the reporting period, from 0.4% (95% CI: 0.2%–1.0%) to 2.3% (95% CI: 1.3%–3.9%, P=0.0031). The number of blood reports remained relatively stable, with four in 2006 and 13 in 2019, but the number of total reports decreased from 998 in 2006 to 557 in 2019.
Figure 7: Bacteremia rates of individual nontyphoidal Salmonella serovars, 2006–2019Table 7 footnote aTable 7 footnote bTable 7 footnote c
Text description: Figure 7
| Salmonella serovar | Year | Total reports | Blood isolations | Bacteremia proportion (%) | 95% confidence interval |
|---|---|---|---|---|---|
| Enteritidis | 2006 | 1,338 | 15 | 1.1 | 0.7–1.8 |
| Enteritidis | 2007 | 1,661 | 26 | 1.6 | 1.1–2.2 |
| Enteritidis | 2008 | 2,225 | 35 | 1.6 | 1.1–2.1 |
| Enteritidis | 2009 | 1,955 | 53 | 2.7 | 2.0–3.4 |
| Enteritidis | 2010 | 2,828 | 47 | 1.7 | 1.2–2.2 |
| Enteritidis | 2011 | 2,763 | 66 | 2.4 | 1.8–3.0 |
| Enteritidis | 2012 | 2,117 | 49 | 2.3 | 1.7–3.0 |
| Enteritidis | 2013 | 2,019 | 57 | 2.8 | 2.1–3.5 |
| Enteritidis | 2014 | 3,296 | 100 | 3.0 | 2.4–3.6 |
| Enteritidis | 2015 | 3,209 | 104 | 3.2 | 2.6–3.8 |
| Enteritidis | 2016 | 3,433 | 142 | 4.1 | 3.4–4.7 |
| Enteritidis | 2017 | 3,278 | 143 | 4.4 | 3.6–4.9 |
| Enteritidis | 2018 | 3,083 | 119 | 3.9 | 3.1–4.4 |
| Enteritidis | 2019 | 2,254 | 97 | 4.3 | 3.4–5.0 |
The reporting frequencies of serovar Heidelberg fluctuated nonlinearly during the reporting period, from a low of 19 blood reports in 2019 to a high of 99 in 2017. The number of total reports varied from a low of 267 in 2019 to a high of 1,071 in 2012. The corresponding bacteremia rate also fluctuated from a low of 5.4% (95% CI: 3.9%–7.5%) in 2007 to a high of 18.2% (95% CI: 15.2%–21.7%) in 2017.
Discussion
Based on data submitted to the NESP, the overall rate of Salmonella bacteremia in Canada was 4.4% (95% CI: 4.3%–4.6%) from 2006 to 2019. Annual rates varied from 2.7% to 5.9% and increased on average by 0.2% per year during the reporting period. Analysis of the bacteremia rate for individual serovars showed that it shifted over time with the number of total and blood reports. The overall rate for the genus then, is expected to reflect changes in the reporting patterns of all Salmonella serovars in Canada. The underlying reasons for these changes warrant further study, but could reflect changes in exposure pathways, changes in serovar prevalence, demographic or other changes in the patient population, or a combination of these factorsFootnote 14Footnote 15.
The rate of bacteremia for typhoid isolates was 35.2% (95% CI: 33.7%–36.8%), over the 14-year reporting period. Bacteremia is often a consequence of typhoid fever and the rate reported here is in line with published valuesFootnote 17. The bacteremia rate of NTS isolates was 3.2% (95% CI: 3.1%–3.3%). This rate was slightly lower than estimates from the United States (US; 5%)Footnote 18Footnote 19 and higher than the 2.1% reported for EnglandFootnote 14.
These differences could be due to differences in the reporting periods of the three studies (US: 1996–2006, England: 2004–2015) and differences in serovar prevalenceFootnote 14Footnote 19. The top five serovars reported in the American study were Typhimurium, Enteritidis, Newport, Heidelberg and JavianaFootnote 19. In England, the top five serovars were Enteritidis, Typhimurium, Virchow, Newport and InfantisFootnote 14. There was considerable overlap in the serovars most commonly associated with bacteremia in Canada, the US and EnglandFootnote 14Footnote 19. Of the 19 serovars identified as having high bacteremia rates in this study, eight were also identified as having high bacteremia rates in England and the US: Heidelberg, Oranienburg, Virchow, Schwarzengrund, Panama, Poona, Brandenburg and Dublin. Canada shared four additional serovars with the US (Reading, Sandiego, Urbana and Choleraesuis) and two with England (Chester and Paratyphi B var. Java)Footnote 14Footnote 19.
Geographic variations in serovars were also noted between the three studies. Serovars Durban, Telelkebir, Lomalinda, Stanleyville and I 6,7:c:- were all identified in this study as having higher rates of bacteremia. Collectively, these five serovars are rare and accounted for 257 lab-confirmed cases from 2006 to 2019 (or 0.3% of all NTS reports). These serovars were not listed in the English and American reports, suggesting that exposures are travel related or unique to Canada.
Continued study on the pathogenesis of NTS serovars associated and not associated with bacteremia will provide knowledge on the relative risks of Salmonella serovars. Understanding these differences will inform methods to improve patient care through the early identification and treatment of salmonellosis cases that are at a high risk of developing bacteremia.
Strengths and limitations
The rates of bacteremia presented above are estimates of the true rate based on data submitted to the NESP. Data submission to the NESP is voluntary. The values in this report only represent the isolates submitted by provincial and territorial laboratories, and understate the number of salmonellosis cases in CanadaFootnote 20.
Data on the isolate source are captured by the NESP based on details collected by the submitting laboratories. As this information is not always available, data on extraintestinal Salmonella infections may also be underreported. Although every effort is made to prevent duplications, the limited source data precludes identification of duplicate isolations from different sources from the same patient. In addition, the data include travel-related cases, which does not reflect the true representation of strains endemic to Canada.
The strength of studies such as this rely on the quality and quantity of surveillance data available. Fewer reported isolates lead to greater degrees of imprecision. The numbers presented here are likely to be skewed higher towards bacteremia since patients with more severe symptoms are more likely to seek medical attention than those with a self-limiting form of the disease. With the absence of clinical data, it is assumed that the cases from which Salmonella blood isolates were recovered were more severe than those that had positive stool cultures.
Conclusion
Based on data submitted to the NESP, an estimated 4.4% of the cases of salmonellosis that occurred between 2006 and 2019 resulted in bacteremia. Specific Salmonella groups and serovars that were associated with higher and lower rates of bacteremia compared to the larger group of Salmonella strains were identified. The results of this study will inform future research aimed at predicting and improving the outcomes of Salmonella bacteremia in Canada.
Authors’ statement
- ST — Conceptualization, methodology, formal analysis, writing–original draft, writing–review and editing
- BD — Writing–review and editing
- KN — Data curation, writing–review and editing
Competing interests
None.
Acknowledgements
The authors would like to acknowledge the staff of the Public Health Agency of Canada, Enteric Diseases Program at the National Microbiology Laboratory and Centre for Foodborne, Environmental and Zoonotic Infectious Diseases who administer the National Enteric Surveillance Program. Thank you as well to A Catford, E Buenaventura, B Dixon, and J Austin for critical review of the manuscript.
Funding
This work was funded by Health Canada (A-base) to support Canada’s food safety programs.
References
- Footnote 1
-
Jajere SM. A review of Salmonella enterica with particular focus on the pathogenicity and virulence factors, host specificity and antimicrobial resistance including multidrug resistance. Vet World 2019;12(4):504-21. https://doi.org/10.14202/vetworld.2019.504-521
- Footnote 2
-
Lamas A, Miranda JM, Regal P, Vázquez B, Franco CM, Cepeda A. A comprehensive review of non-enterica subspecies of Salmonella enterica. Microbiol Res 2018;206:60-73. https://doi.org/10.1016/j.micres.2017.09.010
- Footnote 3
-
Gal-Mor O, Boyle EC, Grassl GA. Same species, different diseases: how and why typhoidal and non-typhoidal Salmonella enterica serovars differ. Front Microbiol 2014;5:391. https://doi.org/10.3389/fmicb.2014.00391
- Footnote 4
-
Thomas MK, Murray R, Flockhart L, Pintar K, Fazil A, Nesbitt A, Marshall B, Tataryn J, Pollari F. Estimates of foodborne illness-related hospitalizations and deaths in Canada for 30 specified pathogens and unspecified agents. Foodborne Pathog Dis 2015;12(10):820-7. https://doi.org/10.1089/fpd.2015.1966
- Footnote 5
-
Ilyas B, Tsai CN, Coombes BK. Evolution of Salmonella-host cell interactions through a dynamic bacterial genome. Front Cell Infect Microbiol 2017;7:428. https://doi.org/10.3389/fcimb.2017.00428
- Footnote 6
-
Public Health Agency of Canada. National Enteric Surveillance Program (NESP). 2018 (accessed 2020-12-04). https://www.canada.ca/en/public-health/programs/national-enteric-surveillance-program.html
- Footnote 7
-
Cheng RA, Eade CR, Wiedmann M. Embracing diversity: differences in virulence mechanisms, disease severity, and host adaptations contribute to the success of nontyphoidal Salmonella as a foodborne pathogen. Front Microbiol 2019;10:1368. https://doi.org/10.3389/fmicb.2019.01368
- Footnote 8
-
Gal-Mor O. Persistent infection and long-term carriage of typhoidal and nontyphoidal salmonellae. Clin Microbiol Rev 2018;32(1):e00088-18. https://doi.org/10.1128/CMR.00088-18
- Footnote 9
-
Hohmann EL. Nontyphoidal salmonellosis. Clin Infect Dis 2001;32(2):263-9. https://doi.org/10.1086/318457
- Footnote 10
-
Matheson N, Kingsley RA, Sturgess K, Aliyu SH, Wain J, Dougan G, Cooke FJ. Ten years experience of Salmonella infections in Cambridge, UK. J Infect 2010;60(1):21-5. https://doi.org/10.1016/j.jinf.2009.09.016
- Footnote 11
-
Robinson JL. Salmonella infections in Canadian children. Paediatr Child Health 2019;24(1):50-1. https://doi.org/10.1093/pch/pxy199
- Footnote 12
-
Galanakis E, Bitsori M, Maraki S, Giannakopoulou C, Samonis G, Tselentis Y. Invasive non-typhoidal salmonellosis in immunocompetent infants and children. Int J Infect Dis 2007;11(1):36-9. https://doi.org/10.1016/j.ijid.2005.09.004
- Footnote 13
-
Hsu RB, Tsay YG, Chen RJ, Chu SH. Risk factors for primary bacteremia and endovascular infection in patients without acquired immunodeficiency syndrome who have nontyphoid salmonellosis. Clin Infect Dis 2003;36(7):829-34. https://doi.org/10.1086/367932
- Footnote 14
-
Katiyo S, Muller-Pebody B, Minaji M, Powell D, Johnson AP, De Pinna E, Day M, Harris R, Godbole G. Epidemiology and outcomes of nontyphoidal Salmonella bacteremias from England, 2004 to 2015. J Clin Microbiol 2019;57(1):e01189-18. https://doi.org/10.1128/JCM.01189-18
- Footnote 15
-
GBD 2017 Non-Typhoidal Salmonella Invasive Disease Collaborators. The global burden of non-typhoidal salmonella invasive disease: a systematic analysis for the Global Burden of Disease Study 2017. Lancet Infect Dis 2019;19(12):1312-24. https://doi.org/10.1016/S1473-3099(19)30418-9
- Footnote 16
-
Mandal BK, Brennand J. Bacteraemia in salmonellosis: a 15 year retrospective study from a regional infectious diseases unit. BMJ 1988;297(6658):1242-3. https://doi.org/10.1136/bmj.297.6658.1242
- Footnote 17
-
Wain J, Diep TS, Ho VA, Walsh AM, Nguyen TT, Parry CM, White NJ. Quantitation of bacteria in blood of typhoid fever patients and relationship between counts and clinical features, transmissibility, and antibiotic resistance. J Clin Microbiol 1998 Jun;36(6):1683-7. https://doi.org/10.1128/JCM.36.6.1683-1687.1998
- Footnote 18
-
Arshad MM, Wilkins MJ, Downes FP, Rahbar MH, Erskine RJ, Boulton ML, Younus M, Saeed AM. Epidemiologic attributes of invasive non-typhoidal Salmonella infections in Michigan, 1995--2001. Int J Infect Dis 2008;12(2):176-82. https://doi.org/10.1016/j.ijid.2007.06.006
- Footnote 19
-
Jones TF, Ingram LA, Cieslak PR, Vugia DJ, Tobin-D'Angelo M, Hurd S, Medus C, Cronquist A, Angulo FJ. Salmonellosis outcomes differ substantially by serotype. J Infect Dis 2008;198(1):109-14. https://doi.org/10.1086/588823
- Footnote 20
-
Thomas MK, Murray R, Flockhart L, Pintar K, Pollari F, Fazil A, Nesbitt A, Marshall B. Estimates of the burden of foodborne illness in Canada for 30 specified pathogens and unspecified agents, circa 2006. Foodborne Pathog Dis 2013;10(7):639-48. https://doi.org/10.1089/fpd.2012.1389
