
Preventing the spread of COVID-19 variants

 Download this article as a PDF
Published by: The Public Health Agency of Canada
Issue: Volume 47-7/8: Infant Botulism in Canada, 1979–2019
Date published: July/August 2021
ISSN: 1481-8531
Submit a manuscript
About CCDR
Browse
Volume 47-7/8: Infant Botulism in Canada, 1979–2019
Implementation Science
A window of opportunity for intensifying testing and tracing efforts to prevent new COVID-19 outbreaks due to more transmissible variants
Jianhong Wu1,2, Francesca Scarabel1,2, Zachary McCarthy1,2, Yanyu Xiao3, Nicholas H Ogden4
Affiliations
1 Laboratory for Industrial and Applied Mathematics, Department of Mathematics and Statistics, York University, Toronto, ON
2 Fields-CQAM Laboratory of Mathematics for Public Health, York University, Toronto, ON
3 Department of Mathematical Sciences, University of Cincinnati, Cincinnati, OH, United States
4 Public Health Risk Sciences Division, National Microbiology Laboratory, Public Health Agency of Canada, St-Hyacinthe, QC
Correspondence
Suggested citation
Wu J, Scarabel F, McCarthy Z, Xiao Y, Ogden NH. A window of opportunity for intensifying testing and tracing efforts to prevent new COVID-19 outbreaks due to more transmissible variants. Can Commun Dis Rep 2021;47(7/8):329–38. https://doi.org/10.14745/ccdr.v47i78a06
Keywords: SARS-CoV-2, variants of concern, non-pharmaceutical interventions, relaxations
Abstract
Background: When public health interventions are being loosened after several days of decline in the number of coronavirus disease 2019 (COVID-19) cases, it is of critical importance to identify potential strategies to ease restrictions while mitigating a new wave of more transmissible variants of concern (VOCs). We estimated the necessary enhancements to public health interventions for a partial reopening of the economy while avoiding the worst consequences of a new outbreak, associated with more transmissible VOCs.
Methods: We used a transmission dynamics model to quantify conditions that combined public health interventions must meet to reopen the economy without a large outbreak. These conditions are those that maintain the control reproduction number below unity, while accounting for an increase in transmissibility due to VOC.
Results: We identified combinations of the proportion of individuals exposed to the virus who are traced and quarantined before becoming infectious, the proportion of symptomatic individuals confirmed and isolated, and individual daily contact rates needed to ensure the control reproduction number remains below unity.
Conclusion: Our analysis indicates that the success of restrictive measures including lockdown and stay-at-home orders, as reflected by a reduction in number of cases, provides a narrow window of opportunity to intensify case detection and contact tracing efforts to prevent a new wave associated with circulation of more transmissible VOCs.
Introduction
The coronavirus disease 2019 (COVID-19) pandemic extended to Canada early in 2020, and a spring wave of epidemic transmission was controlled by restrictive closures that reduced the daily rate of people contacting one another, which drove the control reproduction number below unityFootnote 1. As restrictive closures were lifted in early summer 2020 several modelling studies have identified the need for enhancement to detection and isolation of cases, and tracing and quarantine of contacts ("testing and tracing"), to maintain control of the epidemic (i.e. to either prevent the increase in case numbers, or to prevent exceeding healthcare capacity in the short and long term)Footnote 2Footnote 3Footnote 4Footnote 5. These enhancements to detection and isolation and tracing and quarantining may compensate for the increase in daily contact rates in the general population and resultant transmission associated with lifting restrictionsFootnote 2Footnote 3Footnote 4Footnote 5. As we know, the epidemic did resurge at the end of 2020, suggesting that capacity for testing and tracing was insufficient to control the epidemic, and further restrictive closures were required to bring the "second wave" under control. As provinces and territories contemplate lifting restrictive closures, a new threat emerged: new, more highly transmissible variants, also known as "variants of concern" (VOCs). Several of these variants, which were first identified elsewhere in the world, are now spreading in Canada, particularly the B.1.1.7 variant. The B.1.1.7 variant expanded rapidly in the United Kingdom during the fall 2020, likely assisted by the lifting of restrictive closures as well as the intrinsically higher transmission rate of the new variant compared with the previously circulating virus strains Footnote 6. Here we explore what testing and tracing capacity would be needed to maintain control of the COVID-19 epidemic using data in Ontario, given that more transmissible variants are becoming or have become dominant, while vaccinations are being rolled out to the Canadian population.
Intervention
We used a transmission dynamics modelFootnote 4 fitted to cumulative reported cases during the first and second wave of the COVID-19 epidemic in Ontario, Canada, to quantify conditions of combined public health interventions that could have allowed to partially reopen the economy without a large outbreak. These conditions are those that maintain the control reproduction number to remain below unity while accounting for the increased transmissibility of the VOC. These conditions must be checked before the province considers reopening again after mitigating the third wave. The approximate dates for each of the waves of COVID-19 experienced thus far in Ontario, Canada thus far are listed in Table 1.
| Description | Approximate dates |
|---|---|
| Wave one (the first wave) | February 2020–August 2020 |
| Wave two (the second wave) | September 2020–Mid–February 2021 |
| Wave three (the third wave) | Mid-February 2021–June 2021Table 1 footnote a |
In the model, the population is divided into susceptible (S), exposed (E), asymptomatic infectious (A), infectious with symptoms (I), and recovered (R) compartments according to the epidemiological status of individuals. The model also includes diagnosed cases that are isolated (D), quarantined susceptible (Sq), and quarantined exposed (Eq), compartments to model the impact of contact tracing (i.e. identifying and contacting people who have had physical contact with infected individuals) and quarantine of these traced contacts. Within the model framework, a proportion, q, of individuals exposed to the virus are traced and quarantined (the "quarantine proportion"). The resulting transmission dynamics model is a system of ordinary differential equations.
The control reproduction number was calculated as
RC =βρc(1-q)/(δI + α + γI) + βcθ(1-ρ)(1- q)/γA
In this formula, c is the average number of daily contacts of one individual in the population, β is the probability of transmission upon contact, ρ is the probability of having symptoms among infected individuals, q is the relative infectiousness of asymptomatic cases, δI is transition rate of symptomatic infected individuals to the diagnosed and isolated class, a is the mortality rate, and γI and γA are the recovery rates of symptomatic and asymptomatic infected individuals, respectively. Therefore, the measures of effectiveness of testing and tracing are δI (the rate at which symptomatic people are detected and isolated) and q (the proportion of contacts of cases that are traced and quarantined before they become infectious). The proportion of infectious individuals who have been missed from the contact tracing and quarantine before entering the infectious period and are tested, confirmed and then isolated during the infectious period is given by δI / (δI + a + γI). We here focus on finding conditions on q and δI / (δI + a + γI), which, under different daily contacts and increased transmissibility due to the VOC, ensure RC < 1.
We obtained values for model parameters that allow RC < 1 using model fitting and data integration from multiple sources. We fit the transmission dynamics model to the cumulative reported cases in Ontario until December 23, 2020 using an established techniqueFootnote 4 (see Appendix) and accounted for the different phases of physical distancing in the province. Through model fitting, key values for the model were estimated. These included the proportion of cases detected and isolated, the proportion of contacts traced and quarantined, the probability of transmission on contact, infectiousness of asymptomatic cases and rates of recovery from infection. To incorporate the effect of the VOC, we modelled an increase by 40% in the probability of transmission β compared with the values estimated before December 2020. This value of 40% is taken from the lower estimates of the increased transmissibility of the B.1.1.7 strain obtained in the United KingdomFootnote 6Footnote 7. We then investigated the case detection and contact tracing levels needed to prevent a new wave of COVID-19, assuming different increasing contact rates from three to 12 per day.
Outcomes
Quantification of the evolution of physical distancing measures
Since the beginning of the COVID-19 pandemic, like most Canadian provinces and territories, Ontario has gone through different phases of physical distancing escalation and enhanced testing for mitigating the first wave, followed by relaxation of closures to reopen the economy that led to the second wave and triggered a new second round of closures. It should be remarked that the second round of closures was also relaxed when the total cases declined but the more transmissible B.1.1.7 variant became dominant, leading to a third wave. While the quantification of the physical distancing measures in this research is based on data and analyses of the first two waves, the derived necessary conditions for reopening without a new large-scale outbreak that the Province of Ontario is experiencing clearly supports the call for urgent attention to enhancing the capacity for testing-to-tracing and tracing-to-quarantine/isolation in preparation for the new reopening.
The escalation of closures implemented in Ontario in 2020 for mitigating the first wave involved stages from March 2020 (Table 2). The reopening process was more region-specific, but in general had three main stages: Phase 1, 2 and 3 reopening. Subsequently, enhanced measures began to be re-implemented in the province following Stage 3 reopening in fall 2020. The specific timeline which captures the essence of key events and is considered in this modelling study is shown in Table 2. In this study, December 23 marked the end date of data fitting, taken as the last day of data preceding the province-wide lockdown and not heavily affected by the Christmas festivities. The data fitting procedure (detailed in Appendix) also captured the effects of additional key events in the timeline related to the probability of transmission, case detection and contact tracing. In several regions, a requirement for the usage of face masks or coverings in enclosed public spaces was effective on July 7, 2020. Also, the variations in testing volumes, contact tracing and case detection during October 8–22, 2020 were quantified.
| Description | Date | |
|---|---|---|
| School closure until emergency declaration | March 14–18, 2020 | |
| Emergency declaration until the closure of non-essential workplaces | March 18–24, 2020 | |
| Closure of non-essential workplaces until the first easing of restrictions | March 24–May 16, 2020 | |
| Selected businesses and recreation services to resume activity, followed by Stage 1 reopening | May 16–June 12, 2020 | |
| Stage 2 reopening | June 12–July 17, 2020 | |
| Stage 3 reopening including school resumption | July 17–October 10, 2020 | |
| Modified Stage 2 effective in selected regions | October 10–November 23, 2020 | |
| Lockdown of the Toronto and Peel health regions and further enhanced measures across Ontario | November 23–December 23Table 1 footnote a, 2020 | |
We estimated the effectiveness of interventions implemented in terms of the contact rate, the probability of transmission per contact, the symptomatic case detection rate and the proportion of contacts traced, quarantined or isolated. The transmission dynamics model was fitted to cumulative reported casesFootnote 4 using data until December 23, 2020 and accounted for different public health interventions (detailed below). We estimated daily individual contact rates between 2.66 and 12.17 contacts per day from March to December 2020. The estimated transmission probability per contact β varied between 0.11 and 0.14. The estimated quarantine proportion q remained close to 40% as of December 23. The rate of detection and isolation of symptomatic cases δI was estimated to be approximately 0.14/day. Further details on the parameter estimates and their time evolution are presented in Figure 1.
Figure 1: Parameters estimated by model fitting to cumulative reported cases in Ontario in 2020
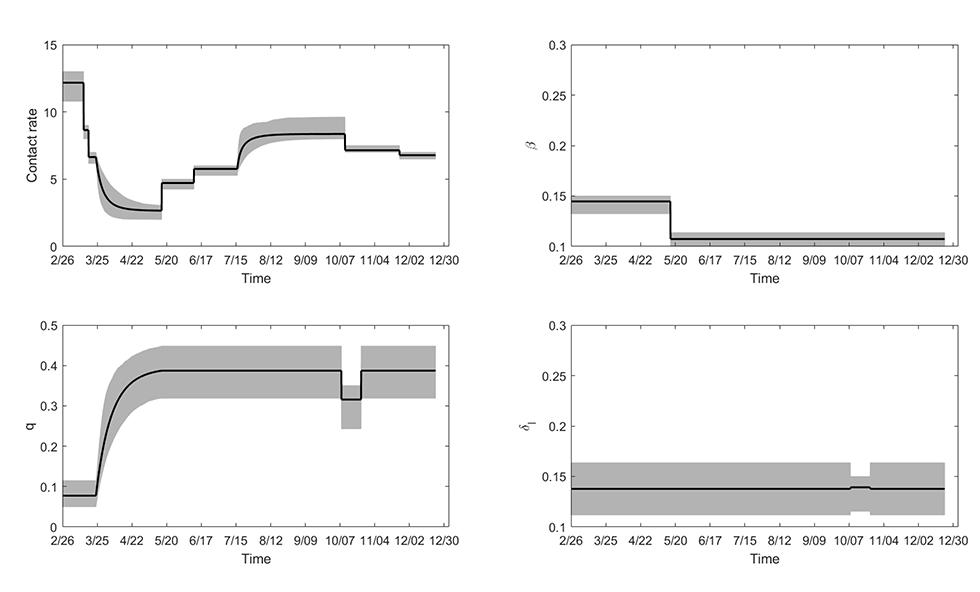
Text description: Figure 1
The top left panel shows the estimated daily average contact rates c in different phases of implementation/lifting of restrictive closures. The estimated contact rates were: prior to March 14: c=12.17; March 14–18: c=8.65; March 18–24: c=6.64; May 16 (end of phase 3): c=2.66; May 16–June 12 (Stage 1 reopening): c=4.72; June 12–July 17 (Stage 2 reopening): c=5.77; October 10 (end of Stage 3 reopening): c=8.36; October 10–November 23 (modified Stage 2, enhanced measures): c=7.14; November 23–December 23 (lockdown in Toronto and Peel regions, further enhanced measures): c=6.78. The top right panel displays the probability of transmission upon contact β, which varied between 0.11 and 0.14. The bottom left panel shows the estimated quarantine proportion q, which remained close to 40% after the first wave. The bottom right panel shows the estimate rate of detection and isolation of symptomatic cases δI. This parameter was estimated to remain at approximately 0.14/day for most of the timeline, corresponding to approximately 45% of symptomatic cases being detected and isolated.
Feasibility of preventing a new outbreak with variants of concern
We then investigated the influence of different parameter values on the control reproduction number RC, and assessed the necessary contact tracing and quarantine levels required for epidemic control when the VOC (B.1.1.7 strain) is the dominating strain. We considered, in particular, variations in the quarantine proportion, the proportion of symptomatic cases detected and isolated, and the different daily contact rates covering the values observed during the first and second waves.
A graph of the values for q (quarantine proportion) and β (transmission probability per contact) at which RC = 1 is shown in Figure 2. These graphs separate the regions of parameters that do or do not allow to control the epidemic for daily contact rates between three and 12 people. We included the parameter estimates obtained during the first and second waves, with transmission probability per contact (β) increased by 40% compared with the previously estimated values, to account for the increased transmissibility of the VOC. The full circle corresponds to β = 0.15 (the lower estimate for the originally circulating virus, 0.11, increased by 40%), and the empty circle corresponds to β = 0.2 (the highest estimate for the originally circulating virus, 0.14, increased by 40%). For the quarantine fraction, we considered the estimated value before December 23. Notably, in the case of a contact rate equal to eight (corresponding to the contact rate estimated in Stage 3 of reopening), increasing the quarantine proportion from 40% to 75% will allow the control reproduction number to remain below one even when VOC becomes dominant.
Figure 2: Boundary of values for the proportion of contacts traced and quarantined and the transmission probability
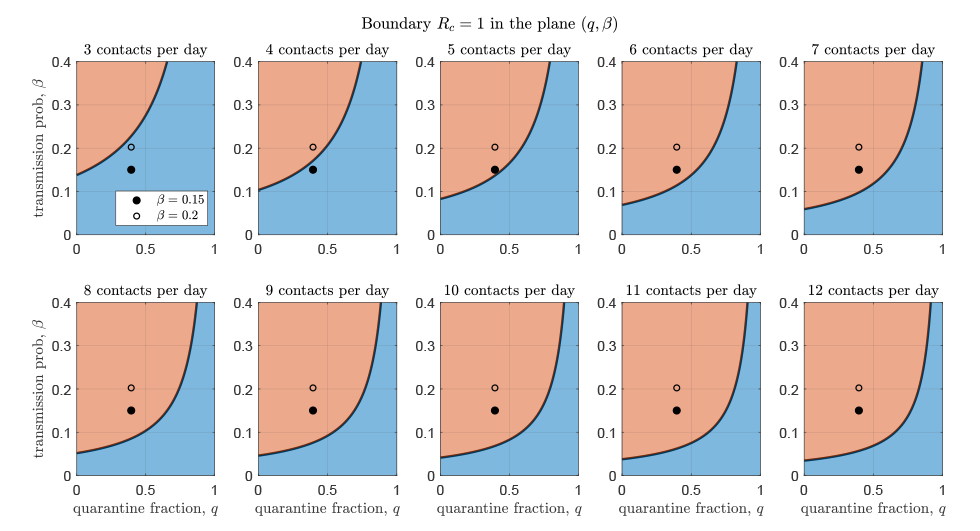
Text description: Figure 2
Each figure panel shows the boundary of values for the proportion of contacts traced and quarantined q and the transmission probability β that determine whether the epidemic is controlled. Each panel displays the boundary corresponding to different values of daily contact rate c, from three to 12. The circles represent the parameters estimated by model fitting (quarantine proportion as of December 23, 2020, and the two estimated values of transmission probability increased by 40% due to the variants of concern, resulting in β = 0.15 and β = 0.2. The blue shaded area represents the parameter region that allows control, whereas the red shaded represents the region of epidemic spread.
Similarly, we assessed the necessary contact tracing and quarantine, and case detection and isolation needed for epidemic control. A graph of the proportion of cases detected and isolated, and contacts traced and quarantined, at which is RC = 1 shown in Figure 3. These graphs separate combinations of values for case detection and contact tracing that do and do not allow control of the epidemic. We estimated that a combination of 60% quarantine fraction and detection and isolation of 65% of symptomatic individuals is sufficient to prevent an outbreak using the contact rate estimated in Stage 2 of reopening (c = 6 contacts per day), even considering the highest estimate for the transmission probability (dashed lines in Figure 3).
Figure 3: Boundary of values for the proportion of contacts traced and quarantined and the proportion of symptomatic cases detected and isolated
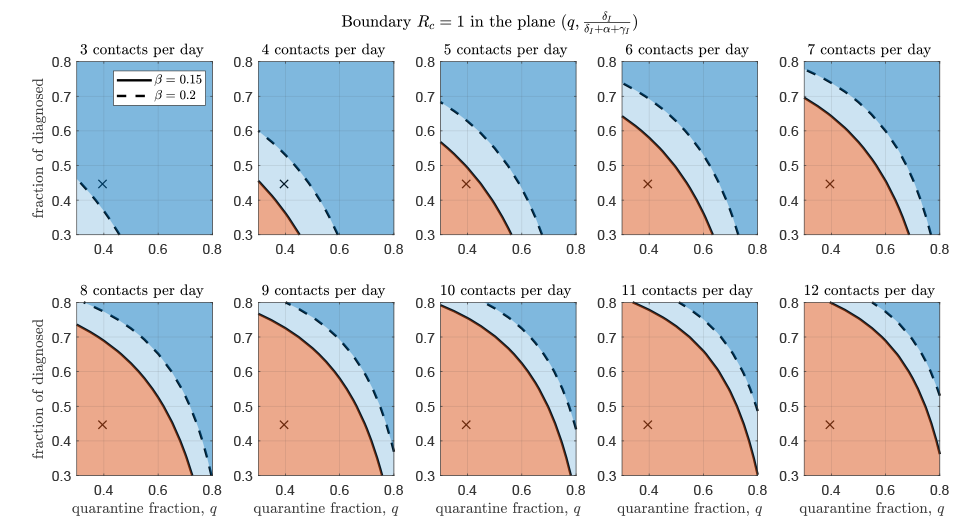
Text description: Figure 3
Each figure panel shows the boundary of values for the proportion of contacts traced and quarantined q and the proportion of symptomatic cases detected and isolated δI / (δI + α + γI ), that determine whether the epidemic is controlled. Each panel displays the boundary corresponding to different values of daily contact rate c, from three to 12. The crosses represent the parameters estimated by model fitting until December 23, 2020. The solid and dashed curves represent the controllability threshold when the transmission probability β is at the lower and higher estimated values, respectively. The blue shaded area represents the parameter region that allows control (light blue: control is possible only if transmissibility is at the lower value β = 0.15; dark blue: control possible also for high transmissibility β = 0.2), whereas the red shaded represents the region of epidemic spread.
Discussion
Using a transmission dynamics model fitted to cumulative reported COVID-19 cases in Ontario, we derived conditions under which a new wave could have been avoided despite the circulation of more transmissible VOCs. The fact that the province has experienced the third wave in the spring of 2021 shows that much could have been done in terms of testing-to-tracing and tracing-to-quarantine/isolation, along with physical distancing measures, to meet these conditions for reopening.
Our study shows that, if public health interventions can be sustained to ensure a declining trend in cases leading to a reduction of cases to a level such that testing capacity allows more complete detection of cases, and contact tracing is conducted effectively with a high proportion of exposed individuals quarantined (and both occur rapidly enough), prevention of a new outbreak is feasible even under the worst case scenario that VOC becomes dominant. However, based on our analysis, this requires substantial increase in the proportion of cases that are detected, and in the proportion of contacts that are traced and quarantined. Specifically, if the daily individual contact rate in Ontario returns to its estimated value in the Stage 2 reopening (approximately six contacts per day), then a new outbreak (the third wave) could have been prevented if, for each new 100 infections generated, 60 of the 100 individuals were traced and isolated before becoming infectious; and further, of those who are not traced and go on to develop symptoms, 65 out of 100 were tested, diagnosed and isolated. Alternatively, if the detection rates among symptomatic individuals remain at their current estimated levels (i.e. about 45 out of 100 symptomatic individuals who missed tracing are diagnosed), a contact rate estimated during Stage 3 reopening (between eight and nine contacts per day) would be sustainable if, out of 100 new infections generated, approximately 75 were traced and isolated before entering their infectious period.
These high quarantine and isolation proportions can be achieved only if case numbers are reduced to low levels, creating a narrow window of opportunity to prevent a new wave. This cascading effect was discussed previouslyFootnote 8. When focused and coherent mitigation interventions lead to an accelerated rate of case decline to a level that reopening can start with a very small number of new infections, effective public health mitigation interventions can and should be further mobilized for swift focused reaction to any new localized hotspot, avoiding a full-scale subsequent wave in the presence of VOC. These studies show that decision for reopening must take consideration of not only the decline rate of cases and case numbers, but the public health capacity for testing, tracing, quarantine and isolation. This is particularly relevant for any province that is implementing lockdown measures to mitigate an ongoing wave: creating the conditions for reopening must involve the enhancement of testing-to tracing and the follow-up quarantine and isolation logistics.
Strengths and limitations
Our study demonstrates that increased efforts in public health policies of symptomatic case detection and contact tracing could have allowed control of the epidemic even if a VOC with 40% increased transmissibility becomes dominant. One important advantage of our methodology is that it uses retrospective assessment and quantification of public health efforts (in terms of symptomatic diagnosis and quarantine of contacts) in the previous (first and second) COVID-19 epidemic waves, to estimate the necessary increase in effort to have prevented a third outbreak. However, our study is based on several assumptions, some of which could be easily relaxed, while others are specific to the chosen modelling framework. First, our estimates do not account for the decrease in the number of susceptible individuals due to infection-induced immunity or to the distribution of vaccines in the population; thus, they provide a somewhat conservative scenario. Moreover, we have here assumed a fixed increase (by 40%) in the VOC transmissibility, representing the lower values estimated for the B.1.1.7 variant. The methodology could be easily adapted to study different levels of increased transmissibility, which may be more descriptive of other existing and emerging VOCs. Another important aspect is that the transmission model is based on the assumption of homogeneous mixing of individuals, thus ignoring heterogeneity due to different age or risk groups, behaviors or settings. Some level of heterogeneity, for example between different age groups and social settings, could be incorporated in the model by using stratified compartments, although this comes at the cost of increased complexity in parameter estimationFootnote 9. Other levels of heterogeneity, for instance spatial heterogeneity or clusters of transmission, would require more complex modelling approaches. Another limitation is that we fitted the model to laboratory confirmed cases. While having the advantage of being widely accessible and timely, these data sets could be biased by several factors including temporal variations in daily tests or in testing protocols.
Conclusion
We have identified conditions under which a new wave (the third wave) could have been prevented in Ontario, considering the worst case that the more transmissible B.1.1.7 strain became dominant. Our analysis indicates that high levels of case isolation and quarantine would have been needed to maintain control to ensure a safe partial reopening. While this study focused on the prevention of the third wave in Ontario, the approach presented herein is amenable to be adapted to other geographic regions and circumstances. Several assumptions made in the mathematical model can be relaxed for a potentially more accurate assessment. The analysis of the control reproduction number RC, informed by model fitting and emerging evidence, may be used to identify estimates of conditions in terms of measures from the public health system and activity levels in the population needed for controllability. In this light, results obtained by utilizing this approach may be helpful for decision-makers posed with questions of reopening given the emergence of additional variants of the SARS-CoV-2 virus with increased transmissibility.
Authors’ statement
- JW and NHO — Conceived the original idea
- ZMC and YX — Performed the model fit
- ZMC and FS — Curated the mathematical analysis and visualization
All authors discussed the results and contributed to the final manuscript.
Competing interests
None.
Funding
This research of ZMC, FS and JW was funded by the Canadian Institute of Health Research (CIHR) 2019 Novel Coronavirus (COVID-19) rapid research program. JW is a member of the Ontario COVID-19 Modelling Consensus Table, sponsored by the Ontario Ministry of Health, Ontario Health, and Public Health Ontario.
References
- Footnote 1
-
Ogden NH, Fazil A, Arino J, Berthiaume P, Fisman DN, Greer AL, Ludwig A, Ng V, Tuite AR, Turgeon P, Waddell LA, Wu J. Modelling scenarios of the epidemic of COVID-19 in Canada. Can Commun Dis Rep 2020;46(8):198–204. https://doi.org/10.14745/ccdr.v46i06a08
- Footnote 2
-
Ng V, Fazil A, Waddell LA, Bancej C, Turgeon P, Otten A, Atchessi N, Ogden NH. Projected effects of nonpharmaceutical public health interventions to prevent resurgence of SARS-CoV-2 transmission in Canada. CMAJ 2020;192(37):E1053–64. https://doi.org/10.1503/cmaj.200990
- Footnote 3
-
Ludwig A, Berthiaume P, Orpana H, Nadeau C, Diasparra M, Barnes J, Hennessy D, Otten A, Ogden N. Assessing the impact of varying levels of case detection and contact tracing on COVID-19 transmission in Canada during lifting of restrictive closures using a dynamic compartmental model. Can Commun Dis Rep 2020;46(11-12):409–21. https://doi.org/10.14745/ccdr.v46i1112a08
- Footnote 4
-
Tang B, Scarabel F, Bragazzi NL, McCarthy Z, Glazer M, Xiao Y, Heffernan JM, Asgary A, Ogden NH, Wu J. De-Escalation by Reversing the Escalation with a Stronger Synergistic Package of Contact Tracing, Quarantine, Isolation and Personal Protection: Feasibility of Preventing a COVID-19 Rebound in Ontario, Canada, as a Case Study. Biology (Basel) 2020;9(5):100. https://doi.org/10.3390/biology9050100
- Footnote 5
-
Tuite AR, Fisman DN, Greer AL. Mathematical modelling of COVID-19 transmission and mitigation strategies in the population of Ontario, Canada. CMAJ 2020;192(19):E497–505. https://doi.org/10.1503/cmaj.200476
- Footnote 6
-
Volz E, Mishra S, Chand M, Barrett JC, Johnson R, Geidelberg L, Hinsley WR, Laydon DJ, Dabrera G, O’Toole A, Amato R, Ragonnet-Cronin M, Harrison I, Jackson B, Ariani C, Boyd O, Loman NJ, McCrone JT, Goncalves S, Jorgensen D, Myers R, Hill V, Jackson DK, Gaythorpe K, Groves N, Sillitoe J, Kwiatkowski DP; The COVID-19 Genomics UK (COG-UK) Consortium. Flaxman S, Ratmann O, Bhatt S, Hopkins S, Gandy A, Rambaut A, Ferguson NM. Transmission of SARS-CoV-2 Lineage B. 1.1. 7 in England: Insights from linking epidemiological and genetic data. Virological.org 2020. https://virological.org/t/transmission-of-sars-cov-2-lineage-b-1-1-7-in-england-insights-from-linking-epidemiological-and-genetic-data/576
- Footnote 7
-
Davies NG, Abbott S, Barnard RC, Jarvis CI, Kucharski AJ, Munday J, Pearson CAB, Russel TW, Tully DC, Abbott S, Gimma a, Waites W, Wong KLM, van Zandvoort, CMMID COVID-19 Working Group, Eggo RM, funk S, Jit M, Atkins KE, Edmunds WJ. Estimated transmissibility and severity of novel SARS-CoV-2 Variant of Concern 202012/01 in England. medRxiv 2020.12.24.20248822. https://doi.org/10.1101/2020.12.24.20248822
- Footnote 8
-
Wu J, Tang B, Xiao Y, Tang S, Ahmad A, Orbinski J. Swift mitigations and tipping point cascade effects: Rethinking COVID-19 control and prevention measures to prevent and limit future outbreaks. Health Management Policy and Innovation. 2020;5(1), Special issue on COVID-19. https://hmpi.org/2020/12/17/swift-mitigations-and-tipping-point-cascade-effects-rethinking-covid-19-control-and-prevention-measures-to-prevent-and-limit-future-outbreaks-york-xian-jiaotong-shaanxi-normal-12-7/?pdf=2987
- Footnote 9
-
McCarthy Z, Xiao Y, Scarabel F, Tang B, Bragazzi NL, Nah K, Heffernan JM, Asgary A, Murty VK, Ogden NH, Wu J. Quantifying the shift in social contact patterns in response to non-pharmaceutical interventions. J Math Ind 2020;10(1):28. https://doi.org/10.1186/s13362-020-00096-y
Appendix: Details of the transmission dynamics model
Background
A central component of the intervention used to quantify conditions that combined public health interventions must meet to reopen the economy without a large outbreak is a transmission dynamics model. Here we provide details of the application of the transmission dynamics model established in prior studyFootnote 10 to the present study, which enabled the calculations of the control reproduction number RC under the scenarios presented in the main text (Figure 2 and Figure 3 in the main text). The key step for the established model’s usage in the analysis of RC is the model parametrization (i.e. estimating the model parameters using Ontario-specific incidence data until December 23, 2020). In this Appendix, we present the complete methods used for the model parametrization and detailed results from the model fitting. This model parameterization allowed for the estimation of the needed enhancements to public health interventions in terms of tracing and quarantine, and detection and isolation for a reopening amid the circulation of variants of concern (VOCs).
Transmission model
We utilized the transmission dynamics model established in a prior studyFootnote 10, which captures essential epidemic features and key public health interventions including contact tracing, quarantining, testing and isolation. The model variables, key model parameters and their descriptions are presented in the main text of the article. In addition, we note that the quarantined individuals can either move to the compartment Eq or Sq, depending on whether transmission occurred (with transmission probability per contact β), while the other proportion, 1-q comprises individuals exposed to the virus who are missed by contact tracing and, therefore, move to the compartment for those exposed and infected but not quarantined (E) if transmission occurred, or stay in the compartment S otherwise.
Here, we present the mathematical model equations and details of its parameterization. The transmission dynamics model was formulated in terms of ordinary different equations:
S’ = -(βc+cq(1-β))S(I+θA)/N + λ Sq,
E’ = βc(1-q)S(I+θA)/N - σE,
I’ = σρE – (δI + α + γI)I,
A’ = σ(1 - ρ)E - γAA,
Sq’ = (1-β)cqS(I+θA)/N- λSq,
Eq'=βcqS(I+θA)/N-δqEq,
D’ = δII + δq Eq – (α + γD)D,
R’ = γII + γAA + γDD
where the prime symbol (‘) denotes the derivative with respect to time. The full list of model parameters and their descriptions is included in Table 1.
| Parameter | Definitions | Mean | Std | Source | |
|---|---|---|---|---|---|
| c(t) | c0 | Contact rate before March 14, 2020 | 12.17 | 0.6172 | Estimated |
| c1 | Contact rate between March 14 to March 18 2020 | 8.65 | 0.2696 | Estimated | |
| c2 | Constant contact rate on March 24, 2020 | 6.64 | 0.1922 | Estimated | |
| r1 | Exponential decreas e of contact rate between March 24 and May 16, 2020 | 0.1936 | 0.1086 | Estimated | |
| cb | Minimum contact rate after March 24, 2020 | 2.66 | 0.3314 | Estimated | |
| c3 | Contact rate between May 16 to June 12, 2020 | 4.72 | 0.2224 | Estimated | |
| c4 | Contact rate between June 12 to July 17, 2020 | 5.77 | 0.4068 | Estimated | |
| cm | Maximum contact rate between July 17 and October 10, 2020 | 8.36 | 0.2605 | Estimated | |
| r3 | Exponential increase of contact rate between July 17 and October 10, 2020 | 0.3117 | 0.0032 | Estimated | |
| c5 | Contact rate between October 10 to November 23, 2020 | 7.14 | 0.1299 | Estimated | |
| c6 | Contact rate between November 23 to December 23, 2020 | 6.78 | 0.1746 | Estimated | |
| β1 | Probability of transmission per contact before May 16, 2020 | 0.1446 | 0.0051 | Estimated | |
| β2 | Probability of transmission per contact after May 16, 2020 | 0.1073 | 0.0076 | Estimated | |
| q0 | Fraction of quarantined exposed individuals before March 24, 2020 | 0.0775 | 0.0177 | Estimated | |
| q(t) | r2 | Exponential increase of quarantine fraction | 0.0835 | 0.0314 | Estimated |
| qb | The maximum quarantine fraction before October 8, 2020 | 0.3949 | 0.0334 | Estimated | |
| q1 | The quarantine fraction between October 8 and October 22, 2020 | 0.3156 | 0.0368 | Estimated | |
| σ | Transition rate of exposed individuals to the infected class | 1/5 | 0 | Footnote 11 | |
| λ | Rate at which the quarantined uninfected contacts were released into the wider community | 1/14 | 0 | Footnote 12 | |
| ρ | Probability of developing symptoms among infected individuals | 0.7240 | 0.0278 | Estimated | |
| δI | Transition rate of symptomatic infected individuals to the quarantined infected class | 0.1378 | 0.0133 | Estimated | |
| δI1 | Transition rate of symptomatic infected individuals to the quarantined infected class between October 8 and October 22, 2020 | 0.1392 | 0.0100 | Estimated | |
| δq | Transition rate of quarantined exposed individuals to the quarantined infected class | 0.1217 | 0.0301 | Estimated | |
| γI | Recovery rate of symptomatic infectious individuals | 0.1627 | 0.0164 | Estimated | |
| γA | Recovery rate of asymptomatic infectious individuals | 0.139 | 0 | Footnote 12 | |
| γD | Recovery rate of quarantined diagnosed individuals | 0.2 | 0 | Footnote 13 | |
| α | Disease-induced death rate | 0.008 | 0 | Footnote 13 | |
| θ | Modification factor of asymptomatic infectiousness | 0.0342 | 0.0068 | Estimated | |
We obtained the control reproduction number RC of the above transmission model using the next generation methodFootnote 14. In the analysis of the control reproduction number RC in this study, we did not account for the decrease in the susceptible population due to infection-induced immunity or vaccination and assumed that S(t)/N(t) = 1. The resultant control reproduction number is:
RC =βρc (1-q)/(δI + α + γI) + βcθ(1-ρ)(1- q)/γA
To then estimate the model parameters from February 26, 2020 until December 23, 2020, we used the following process. We first considered the parameters θ, λ, σ, ρ, γA, γI, δq, γD, α as constant in time. On the other hand, we considered several model parameters as time-dependent based on the Ontario timeline of key events, intervention implementations and relaxations (detailed in the main text of the article): the contact rate c, the quarantine proportion q, the probability of transmission per contact β, and the symptomatic detection rate δI.
We allowed the contact rate c to change according to the timeline of public health interventions implemented in the Province. Specifically, we assumed the following piecewise form for the contact rate:| c(t) = |
|---|
| c0, Tinitial < t < T0, (February 26 – March 14), |
| c1, T0 < t < T1, (March 14 – March 18), |
| c2, T1 < t < Ts, (March 18 – March 24), |
| (c2-cb)exp(-r2(t-TS))+cb, Ts < t <T2, (March 24 – May 16) |
| c3, T2 < t <T3, (May 16 – June 12), |
| c4, T3< t <T4, (June 12 – July 17), |
| (c4-cm)exp(-r3(t-T4))+cm, T4 < t <T5, (July 17 – October 10), |
| c5, T5 < t <T6, (October 10 – November 23), |
| c6, T6< t <Tf, (November 23 – December 23). |
where Tinitial, T0, T1, Ts, T2, T3, T4, T5, T6, Tf correspond to times matching the dates February 26, 2020, March 14, 2020, March 18, 2020, March 24, 2020, May 16, 2020, June 12, 2020, July 17, 2020, October 10, 2020, November 23, 2020 and December 23, 2020, respectively. These dates correspond to key dates detailed in the main text of the article. An exponential function was used to capture society’s gradual adaptation to stricter or looser control measures during the non-essential workplace closure and Stage 3 reopening.
To estimate the resultant potential change in transmission risk per contact over time, we modelled the transmission probability per contact β using the following piecewise constant function:
| β(t) = |
|---|
| β1, Tinitial < t < TMay16, (February 26 – May 16), |
| β2, TMay16 < t < Tf, (May 16 – December 23), |
where TMay16 corresponds to the date May 16, 2020 which marked the first easing of restrictions in Ontario.
We also allowed for alteration in the symptomatic detection rate during the dates October 8, 2020–October 22, 2020 to capture variations in testing, contact tracing and case detection during this period. The symptomatic detection rate δI we modelled as piecewise constant, with the form:
| δI (t) = |
| δI, Tinitial < t < TOct8, (February 26 – October 8), |
| δI1, TOct8 < t < TOct22, (October 8 – October 22), |
| δI, TOct22 < t < Tf, (October 22 – December 23), |
where the dates Tinitial, Tf are defined above and TOct8, TOct22 correspond to the dates October 8, 2020 and October 22, 2020, respectively.
Finally, the quarantine proportion was also modelled as time-dependent. We captured here the escalation of tracing efforts from the public health system after the non-essential workplace closure on March 24, 2020 with a modelled exponential increase in q. Similar to the detection rate, we also allowed for variation in quarantine proportion between the dates October 8, 2020–October 22, 2020. The quarantine proportion was modelled as:
| q (t) = |
| q0, Tinitial < t < TOct8, (February 26 – March 24), |
| (q0 - qb)exp(-r2(t-Ts))+qb, Ts < t < TOct8, (March 24 – October 8), |
| q1, TOct8 < t < TOct22, (October 8 – October 22), |
| qb, TOct22 < t < Tf, (October 22 – December 23), |
With the model and its parameters now associated with a suitable form permitting us to capture key elements in the Ontario timeline, we next incorporated the coronavirus disease 2019 (COVID-19) data coupled with a model fitting procedure to quantify the model parameter values.
Data
To parameterize the transmission model, we utilized the confirmed positive cases of COVID-19 in Ontario and population demographic data for Ontario. The time series of the cumulative cases of COVID-19 in Ontario was generated using individual line listed data from the Ontario Ministry of Health, which was made available to us through the Ontario COVID-19 Modeling Consensus Table. Second, the demographic data specific to Ontario in terms of the population size is available publicly by Statistics CanadaFootnote 15. These were the main sources of data which enabled the fitting of mathematical model and the subsequent analyses.
Model fitting
To estimate the model parameters, we fit the transmission model the cumulative incidence of confirmed COVID-19 cases in Ontario. The fitting technique utilized has been outlined in prior studyFootnote 10 and is summarized as follows: we informed the model with estimated parameters α, γA from existing studies (Table 1), the necessary population size data from Statistics CanadaFootnote 15 and the initial conditions (Table 2). We then run the model forward from t = Tinitial to Tf (February 26, 2020 to December 23, 2020), and determined the parameters which minimized the least square error against the cumulative incidence. Confidence intervals for parameters were estimated by employing a bootstrap method to generate 1,000 cumulative incidence time seriesFootnote 10. It was assumed that the newly reported cases followed a Poisson distribution, and the model was fitted to each of the 1,000 realizations of the observed time series. The process yielded 1,000 sets of parameters values for q, γI, δI, δq, θ, c, β, ρ, and the estimated mean and standard deviation for each are reported in Table 1. For non-fitted parameters α, γA , the source is reported.
| Initial values | Definitions | Mean | Std | Source |
|---|---|---|---|---|
| S(0) | Initial susceptible population | 1.471 x 10⁷ | 0 | DataFootnote 15 |
| E(0) | Initial exposed population | 16.0081 | 4.9432 | Estimated |
| I(0) | Initial symptomatic infectious population | 12.2829 | 3.7544 | Estimated |
| A(0) | Initial asymptomatic infectious population | 14.2352 | 6.1958 | Estimated |
| Sq(0) | Initial quarantined susceptible population | 0 | 0 | Assumed |
| Eq(0) | Initial quarantined exposed population | 0 | 0 | Assumed |
| D(0) | Initial quarantined diagnosed population | 5 | 0 | Incidence data |
| R(0) | Initial recovered population | 0 | 0 | Assumed |
The model fit and quantified uncertainty against the true case data in Ontario is shown in Appendix Figure 1 in terms of the daily reported cases (top right) and cumulative reported cases (top left); the estimated number of active symptomatic infectious individuals I(t) (bottom left) and estimated number of active asymptomatic infectious individuals A(t) (bottom right) and their time evolution are also depicted. The values (including 95% CIs) and time evolution of the key parameters β, δI, q, c
are shown in Appendix Figure 1 in the main text.
Figure Appendix 1: Model fit results
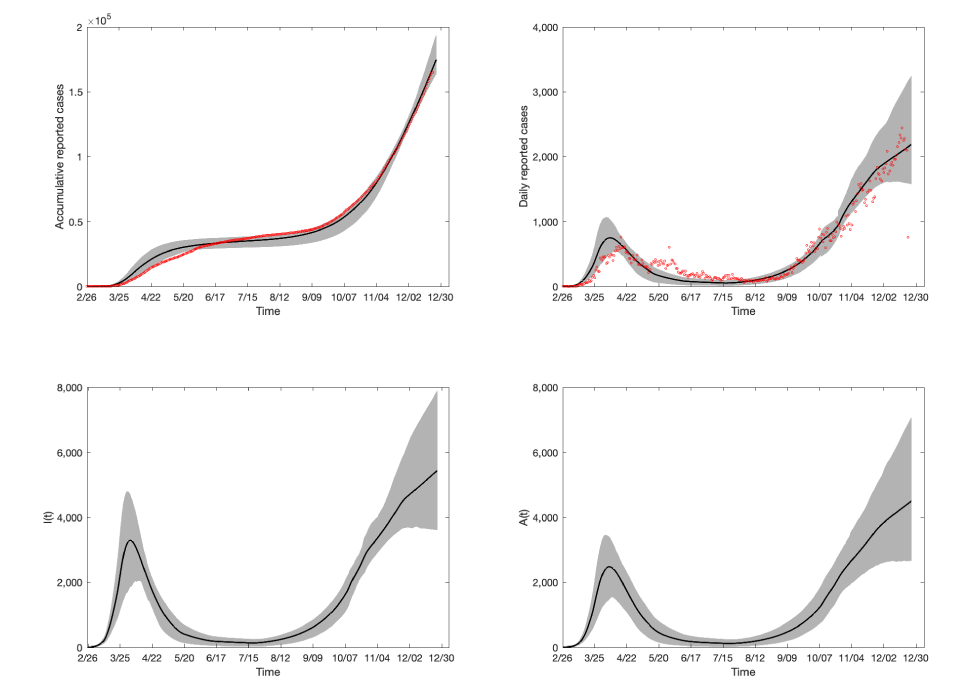
Text description: Appendix Figure 1
The top left figure panel displays the model fit against cumulative reported COVID-19 cases in Ontario, Canada as of December 23, 2020. The red dots represent the observed cumulative reported cases, whereas the black line denotes the mean of the 1,000 model runs and the grey shaded region representing the 95% confidence interval (CI). The top right panel shows the model fit against the daily reported cases in Ontario as of December 23, 2020. The red dots represent the daily number of reported cases in the province. The bottom left panel shows the estimated number of symptomatic infectious individuals as produced by the fitted model and the 95% CI. The bottom right panel displays the estimated number of active asymptomatic infectious individuals in Ontario as produced by the fitted model, as well as the corresponding 95% CI.
Application
We have estimated the transmission model parameters as of December 23, 2020, which completely informed the control reproduction number RC To incorporate the effects of VOCs in the analysis of RC, we integrated existing estimates of the increased transmissibility of the B.1.1.7 strain first identified in the United KingdomFootnote 16Footnote 17 and increased the estimated values for β by 40%, as detailed in the main text. We then assessed RC under different scenarios corresponding to the proportion of symptomatic individuals who are tested, confirmed and isolated during their infectious period δI / (δI + α + γI ), the proportion of contacts traced and quarantined (q), the transmission probability per contact (β) and contact rate (c) by altering the parameters δI, q, β, c accordingly. The main study outcomes in terms of conditions on the enhanced public health measures (Figure 2 and Figure 3 in the main text) needed to maintain RC < 1 were generated by effectively viewing RC as a function of β, δI, c, q. Thus, we identified the needed levels of (enhanced) controls to prevent a VOC wave while achieving contact rates that were estimated during different phases of public health interventions in Ontario.
References
- Footnote 10
-
Tang B, Scarabel F, Bragazzi NL, McCarthy Z, Glazer M, Xiao Y, Heffernan JM, Asgary A, Ogden NH, Wu J. De-Escalation by Reversing the Escalation with a Stronger Synergistic Package of Contact Tracing, Quarantine, Isolation and Personal Protection: Feasibility of Preventing a COVID-19 Rebound in Ontario, Canada, as a Case Study. Biology (Basel) 2020;9(5):100. https://doi.org/10.3390/biology9050100
- Footnote 11
-
Special Expert Group for Control of the Epidemic of Novel Coronavirus Pneumonia of the Chinese Preventive Medicine Association. [An update on the epidemiological characteristics of novel coronavirus pneumonia (COVID-19)]. Zhonghua Liu Xing Bing Xue Za Zhi 2020;41(2):139-44. https://doi.or.g/10.3760/cma.j.issn.0254-6450.2020.02.002
- Footnote 12
-
Tang B, Wang X, Li Q, Bragazzi NL, Tang S, Xiao Y, Wu J. Estimation of the transmission risk of the 2019-nCoV and its implication for public health interventions. J Clin Med 2020;9(2):462. https://doi.org/10.3390/jcm9020462
- Footnote 13
-
Tang B, Xia F, Tang S, Bragazzi NL, Li Q, Sun X, Liang J, Xiao Y, Wu J. The effectiveness of quarantine and isolation determine the trend of the COVID-19 epidemics in the final phase of the current outbreak in China. Int J Infect Dis 2020;95:288-93. https://doi.org/10.1016/j.ijid.2020.03.018
- Footnote 14
-
van den Driessche P. Reproduction numbers of infectious disease models. Infect Dis Model 2017;2(3):288-303. https://doi.org/10.1016/j.idm.2017.06.002
- Footnote 15
-
Statistics Canada. Table 17-10-0009-01 Population estimates, quarterly. 2020. https://www150.statcan.gc.ca/t1/tbl1/en/tv.action?pid=1710000901</eref>
- Footnote 16
-
Volz E, Mishra S, Chand M, Barrett JC, Johnson R, Geidelberg L, Hinsley WR, Laydon DJ, Dabrera G, O'Toole A, Amato R, Ragonnet-Cronin M, Harrison I, Jackson B, Ariani C, Boyd O, Loman NJ, McCrone JT, Goncalves S, Jorgensen D, Myers R, Hill V, Jackson DK, Gaythorpe K, Groves N, Sillitoe J, Kwiatkowski DP; The COVID-19 Genomics UK (COG-UK) Consortium. Flaxman S, Ratmann O, Bhatt S, Hopkins S, Gandy A, Rambaut A, Ferguson NM. Transmission of SARS-CoV-2 Lineage B. 1.1. 7 in England: Insights from linking epidemiological and genetic data. Virological.org 2020. https://virological.org/t/transmission-of-sars-cov-2-lineage-b-1-1-7-in-england-insights-from-linking-epidemiological-and-genetic-data/576</eref>
- Footnote 17
-
Davies NG, Abbott S, Barnard RC, Jarvis CI, Kucharski AJ, Munday J, Pearson CAB, Russel TW, Tully DC, Abbott S, Gimma A, Waites W, Wong KLM, van Zandvoort, CMMID COVID-19 Working Group, Eggo RM, funk S, Jit M, Atkins KE, Edmunds WJ. Estimated transmissibility and severity of novel SARS-CoV-2 Variant of Concern 202012/01 in England. medRxiv 2020.12.24.20248822. https://doi.org/10.1101/2020.12.24.20248822
