
Canada’s representation in the FluWatchers Disease Surveillance Program

 Download this article as a PDF
Published by: The Public Health Agency of Canada
Issue: Volume 47-9: FluWatchers: A Crowdsourcing Approach
Date published: September 2021
ISSN: 1481-8531
Submit a manuscript
About CCDR
Browse
Volume 47-9: FluWatchers: A Crowdsourcing Approach
Surveillance
Representativeness of the FluWatchers Participatory Disease Surveillance Program 2015–2016 to 2018–2019: How do participants compare with the Canadian population?
Mireille Desroches1, Liza Lee1, Shamir Mukhi2, Christina Bancej1
Affiliations
1 Centre for Immunization and Respiratory Infectious Diseases, Public Health Agency of Canada, Ottawa, ON
2 National Microbiology Laboratory, Public Health Agency of Canada, Winnipeg, MB
Correspondence
Suggested citation
Desroches M, Lee L, Bancej C, Mukhi S. Representativeness of the FluWatchers Participatory Disease Surveillance Program 2015–2016 to 2018–2019: How do participants compare with the Canadian population? Can Commun Dis Rep 2021;47(9):364–71. https://doi.org/10.14745/ccdr.v47i09a03
Keywords: influenza-like illness, syndromic surveillance, respiratory illness, Canada, online disease monitoring, digital epidemiology, crowdsourcing, participatory surveillance, public health
Abstract
Background: FluWatch is Canada's national surveillance system that monitors the spread of influenza. Its syndromic surveillance component monitors the spread of influenza-like illness (ILI) in near-real time for signals of unusual or increased activity. Syndromic surveillance data are collected from two main sources: the Sentinel Practitioner ILI Reporting System and FluWatchers.
We evaluated the representativeness of the most recent participant population to understand changes in representativeness since 2015, to identify demographic and geographic gaps and correlates/determinants of participation to characterize a typical participant.
Methods: In this serial cross-sectional study, characteristics of participants during four consecutive influenza seasons (2015–2016, 2016–2017, 2017–2018 and 2018–2019) were compared with the 2016 Canadian Census and the 2015–2016, 2016–2017, 2017–2018 and 2018–2019 National Seasonal Influenza Vaccination Coverage Surveys. Associations between demographic factors and the level of user participation were also analyzed among the 2018-2019 FluWatchers population.
Results: Infants (0–4 years) and older adults (65 years and older) were under-represented in FluWatchers across all four influenza seasons. Female and urban participants were significantly over-represented. Vaccination coverage remained significantly higher among the FluWatchers populations from the past four influenza seasons across all age groups. Level of participation among FluWatchers was associated with age and vaccination status, but not with sex or geography. Over its four years of implementation, the FluWatchers participant population became more representative of the Canadian population with respect to age and geography (urban/rural and provincial/territorial).
Conclusion: FluWatchers participants under-represent the tails of Canada's age distribution and over-represent those who engage in health promoting behaviours as indicated by high influenza vaccine coverage, consistent with typical volunteer-based survey response biases. Representativeness would likely improve with targeted recruitment of under-represented groups, such as males, older adults and Canadians living in rural areas.
Introduction
FluWatch is Canada's national surveillance system that monitors the spread of influenza. It is made up of seven components that, together, monitor the geographic spread of influenza and influenza-like illness (ILI), laboratory-confirmed detections, outbreaks, severe outcomes, strain characterization, antiviral resistance, and vaccine coverage and effectivenessFootnote 1. The FluWatch syndromic surveillance component relies on data from two main sources: the Sentinel Practitioner ILI Reporting system (SPIR), where primary care practitioners report the proportion of patients presenting with ILI each weekFootnote 2; and FluWatchers, a program where Canadian volunteers are prompted to report whether they have had a cough and/or fever each weekFootnote 1. Traditional, clinical-based syndromic surveillance data sources, such as SPIR, only capture cases of ILI among individuals who seek medical careFootnote 3. FluWatchers was developed as a complement to SPIR by aiming to track community ILI activity and to capture the spread of ILI among individuals who do not seek medical care.
The FluWatchers program, developed on the Canadian Network for Public Health Intelligence platform, was launched in 2015 as a pilot project. Recruitment focused primarily on the public health workforce where prospective participants were more amenable to participating in surveillance methods research. The number of participants has steadily increased each year, from 505 participants in the 2015–2016 influenza season, to 3,210 participants in the 2018–2019 influenza season. However, recruitment activities have been limited, resulting in a sample of Canadians that is both a convenience and purposive sample.
Like other online syndromic surveillance tools, FluWatchers has the potential to reach a very wide population by leveraging other data sources such as internet searches and social media Footnote 4. FluWatchers has shown to correlate well with influenza activity in CanadaFootnote 5. Additionally, the use of participatory data for syndromic surveillance has been validated and other similar online tools have been shown to correlate well with traditional, clinical—based ILI syndromic surveillance for example, InfluenzaNet (Europe), FluTracking (Australia), GrippeNet (France) and Flu Near You (United States and Canada)Footnote 6Footnote 7Footnote 8Footnote 9.
Crowdsourced online syndromic surveillance tools, such as FluWatchers, monitor disease indicators in near real-time to serve as "early detection—early warning" systems to detect outbreaks before formal diagnoses are madeFootnote 10. Reliable and timely indicator estimates of the spread of influenza are crucial for the early detection of unusual or increased influenza activity and for pandemic preparedness. To work effectively, it is imperative that FluWatchers participants be sufficient in quantity, diversity and geographical and population representativeness.
The objective of this study is to evaluate the representativeness of the most recent FluWatchers participant population against the Canadian population, to understand changes in representativeness since its pilot in 2015 and to characterize a typical FluWatcher to identify gaps and biases.
Methods
Sources of data and study populations
Any Canadian resident can sign up to participate in the FluWatchers program through the online FluWatchers registrationFootnote 11. At the time of registration with a valid email address, participants provide their year of birth, gender (male, female or gender diverse) and forward sortation area code (FSA; first three digits of the postal code), report whether they have regular contact with patients, and have the option to add any household members to report on their behalf. Each weekly questionnaire, sent in the form of an email notification, asks the participant if they have experienced cough and/or fever in the previous week, and whether they have received their annual influenza vaccination. When ILI symptoms are reported (cough and fever reported in the same week), participants are prompted to answer more questions enabling collection of additional information on absenteeism and health-seeking behaviours. All data are anonymous and are collected from epidemiological week 40 to 18 each season (October through May). National estimates on age, sex and geographical distribution were obtained from the 2016 Canadian CensusFootnote 12. National estimates on vaccination coverage were obtained from the 2015-2016, 2016-2017, 2017-2018 and 2018-2019 Seasonal Influenza Vaccination Coverage SurveysFootnote 13Footnote 14Footnote 15Footnote 16.
For this study, FluWatchers participants were defined as those who submitted at least one questionnaire over the respective influenza seasons (2015–2016, 2016–2017, 2017–2018 or 2018–2019), and who had complete year of birth, gender/sex (male or female) and FSA information. Participants who submitted reports with gender "gender diverse" (n<5) were excluded from this study as this information is not available from the 2016 Canadian Census Footnote 17, and thus could not be compared between the two populations. There were no other inclusion/exclusion criteria.
For most measures, data from the 2018–2019 influenza season were used, as they best represent the current participant population.
Measures
The characteristics and representativeness of FluWatchers participants' age, sex and geography were assessed against the Canadian Census estimates as follows:
- Age-distribution: infants (0–4 years), children (5–19 years), young adults (20–44 years), adults (45–64 years) and older adults (65 years and older)
- Sex distribution: male or female
- Geographic distribution: urban or rural, as determined using the second digit of the FSA (with second digit 0 indicated a wide-area rural region, and 1–9 indicated urban areas Footnote 18)
- Mean response rate per 100,000 population by province/territory: derived using the weekly average number of responses in a given province/territory as the numerator and Canadian Census estimates by province/territory as the denominator
The FluWatchers participants vaccination coverage were assessed against the Canadian 2015–2016, 2016–2017, 2017–2018 and 2018–2019 Seasonal Influenza Vaccination Coverage Surveys as follows:
- Age-specific influenza vaccination coverage: 18 years and older, 18–64 years, and 65 years and olderFootnote 13Footnote 14Footnote 15Footnote 16
Influenza vaccine coverage among children younger than 18 years could not be compared as no national survey estimates exist that provide coverage estimates in the pediatric population.
The levels of participation among the 2018–2019 FluWatchers population were defined as follows:
- Low level of participation: participants who completed fewer than 12 surveys over a whole influenza season
- Medium level of participation: participants who completed between 12 and 25 surveys over a whole influenza season
- High level of participation: participants who completed more than 25 surveys over a whole influenza season
Statistical analysis
For age, sex and urban/rural distributions, FluWatchers participants were compared to the 2016 Census population. For vaccination coverage, FluWatchers participants were compared to the Canadian 2015–2016, 2016–2017, 2017–2018 and 2018–2019 Seasonal Influenza Vaccination Coverage Survey populations, using Pearson chi-square tests. Similarly, the distribution of the FluWatchers population by province/territory was compared to Census estimates using a Fisher's exact test.
The sex-stratified age distribution of FluWatchers participants from the 2018–2019 influenza season was summarized and compared with the 2016 Canadian Census population, with male:female ratios and 95% confidence intervals.
Associations between demographic factors and the level of participation among participants from the 2018–2019 influenza season were analyzed using multiple logistic regression. Participants younger than 18 years of age were excluded from this analysis and could not be classified as high, medium or low-level participants as their participation likely depends on that of a household member submitting reports on their behalf. Age group, sex, geography and vaccination status were treated as independent variables in the model. Participants were classified into three categories of participation: high; medium; and low, according to the number of surveys completed over the influenza season. The cut off numbers used to define the level of participation were determined empirically by assessing a histogram of the number of surveys completed. The adult age group was used as the reference for odds ratio estimation as it comprised the largest number of participants. Females and the "not vaccinated" groups were used as the references for sex and vaccination status odds ratio estimates for the same reason.
All analyses were performed using SAS-EG 7.1.
Results
Representativeness of FluWatchers participants from the 2018–2019 influenza season
Over the 2018–2019 influenza season, a total of 3,210 FluWatchers participants met the inclusion criteria with a collective total of 66,808 questionnaires submitted.
The mean age of participants was 41.2 ± 18.6 years and the median age was 43 years (IQR=24) comparable to the 2016 Census population (mean [SD]: 41.0 ± 22.8 years) (Table 1). The adult age group had the highest proportion of participants (37.2%), and the infant age group had the smallest proportion of participants (2.2%). Each relevant age group was represented among the FluWatchers population; however, FluWatchers' age distribution significantly differed from that of the 2016 Census population (p<0.0001) (Table 1). Overall, adults were over-represented while infants and older adults were significantly under-represented (p<0.0001).
| Characteristic | FluWatchers | 2016 Canadian Census (n=35,151,730) |
|||
|---|---|---|---|---|---|
| 2015–2016 (n=505) |
2016–2017 (n=998) |
2017–2018 (n=2,114) |
2018–2019 (n=3,210) |
||
| Mean ± SD | 38.5 ± 18.1 | 38.8 ± 17.8 | 40.6 ± 17.5 | 41.2 ± 18.6 | 41.0 ± 22.8 |
| Median | 42 | 42 | 43 | 43.0 | 41.2 |
| IQR | 31 | 25 | 23 | 24 | 37 |
| Age, year (%) | |||||
| Infants (0–4) | 0.0 | 1.2 | 1.2 | 2.2 | 5.4 |
| Children (5–19) | 24.0 | 20.7 | 17.4 | 16.7 | 17.0 |
| Young adults (20–44) | 34.9 | 36.9 | 36.8 | 37.0 | 32.4 |
| Adults (45–64) | 36.6 | 37.7 | 39.5 | 37.2 | 28.3 |
| Older adults (65 and older) | 4.6 | 3.5 | 5.6 | 6.9 | 16.9 |
| Sex (%) | |||||
| Male | 42.2 | 40.1 | 37.0 | 35.5 | 49.1 |
| Female | 57.8 | 59.9 | 63.0 | 64.5 | 50.9 |
| Geography (%) | |||||
| Urban | 96.0 | 92.1 | 90.9 | 89.5 | 83.3 |
| Rural | 4.0 | 7.9 | 9.1 | 10.5 | 16.7 |
Of those 3,210 participants, 2,071 were female (64.5%) and 1,139 were male (35.5%). Females were significantly over-represented compared to the 2016 Census population (50.9%, p<0.0001). Similarly, FluWatchers participants' geographical distribution significantly differed from that of the 2016 Census population (p<0.0001). The majority (n=2,873; 89.5%), of FluWatchers participants had FSA codes for urban areas, while only 337 participants (10.5%) had FSA codes for rural regions. Thus, participants residing in urban areas were significantly over-represented relative to the Canadian population (p<0.0001).
The distribution of the FluWatchers participants was compared geographically to the 2016 Census population distribution (Figure 1). Ontario and Saskatchewan were the most over-represented, while Québec and Alberta were the most underrepresented provinces. The average weekly response rate per province/territory was highest in the Yukon Territory (31.1 weekly submissions per 100,000 population) followed by Prince Edward Island, Saskatchewan, Manitoba, Nova Scotia, Northwest Territories, Ontario, New Brunswick, Newfoundland, Québec, British Columbia, Alberta and Nunavut (17.9, 16.5, 13.7, 10.5, 8.6, 7.6, 5.7, 3.9, 3.8, 3.7, 2.3, 0.1 weekly submissions per 100,000 population, respectively). There was a difference between the geographical distribution of all registered FluWatchers compared with provincial/territorial average weekly response rates. For example, Ontario is one of the most over-represented provinces in terms of its proportion of registered participants but ranks among the lowest of the provinces and territories in terms of average weekly response rate per 100,000 population. Overall, the geographical distribution of the FluWatchers population is not representative of the 2016 Census population and significantly differed from the average weekly response rates (p <0.0001).
Figure 1: Comparison of the geographical distribution of the 2016 Canadian Census population and the geographical distribution of the FluWatchers population from the 2018–2019 influenza season
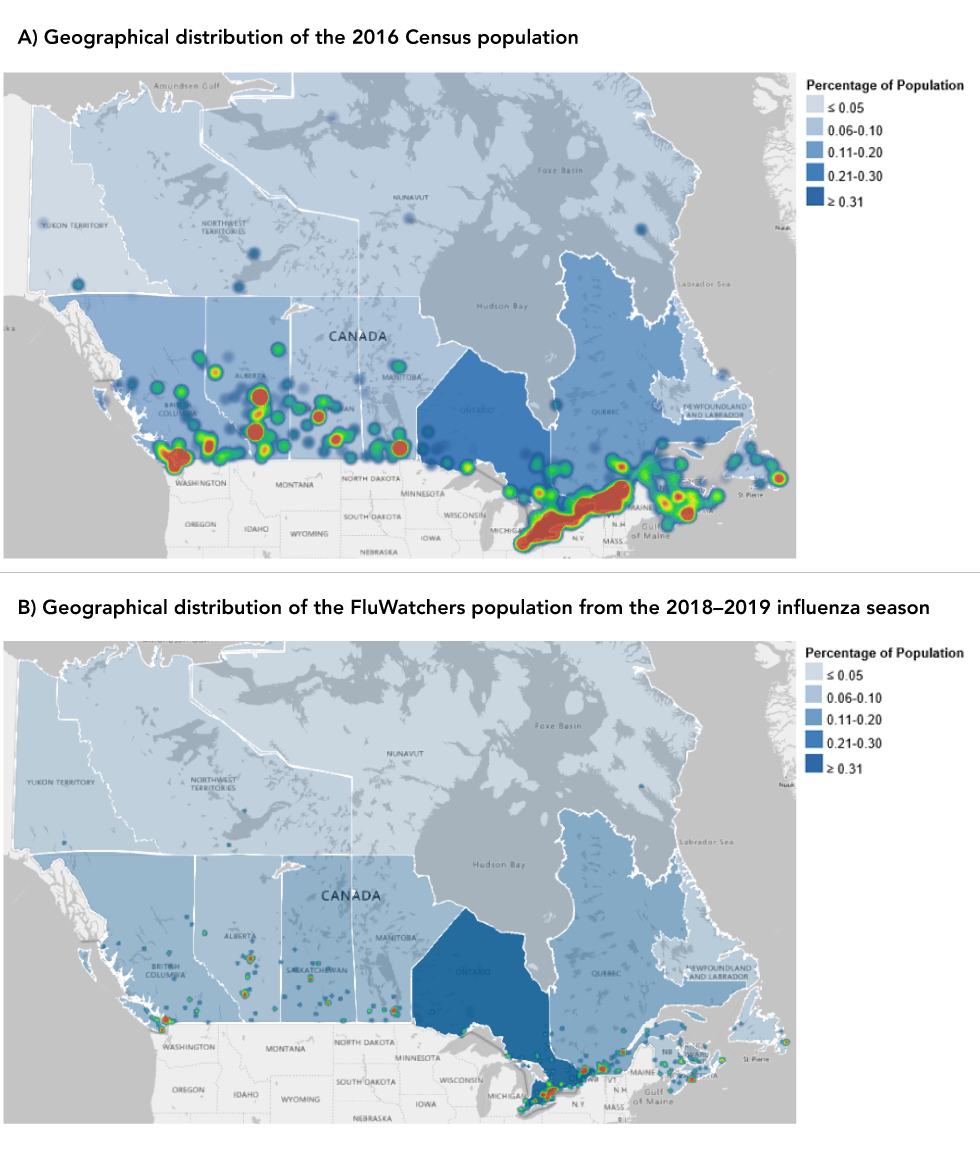
Text description: Figure A and B
Figure A
Population density by province/territory is displayed in blue, ranging from dark blue to light blue. Ontario has the highest population density of 38.3%, followed by Québec (23.2%), British Colombia (13.2%), Alberta (11.6%), Manitoba (3.6%), Saskatchewan (3.1%), Nova Scotia (2.6%), New Brunswick (2.1%), Newfoundland (1.5%), Prince Edward Island (0.4%), Northwest Territories (0.1%), Nunavut (0.1%) and Yukon (0.1%).
Heat map colors represent population distribution, ranging from green to red, where cool colors (green to yellow) represent lower density and warm colors (orange to red) represent higher density. The highest density is mostly concentrated in major cities and their associated outlining areas across Canada, with the highest population density in the Windsor to Québec City corridor.
Figure B
Population density by province/territory is displayed in blue, ranging from dark blue to light blue. Ontario has the highest population density of 47.2%, followed by Québec (13.8%), British Colombia (8.5%), Saskatchewan (8.3%), Manitoba (7.6%), Alberta (5.3%), Nova Scotia (4.5%), New Brunswick (2.2%), Newfoundland (0.9%), Prince Edward Island (0.9%), Yukon (0.5%), Northwest Territories (0.2%), and Nunavut (0.03%).
Heat map colors represent population distribution, ranging from green to red, where cool colors (green to yellow) represent lower density and warm colors (orange to red) represent higher density. The highest density is mostly concentrated in major cities across Canada.
When comparing the sex-stratified age distribution of the FluWatchers population compared with that of the 2016 Census population (Table 2), the male to female sex ratios were almost equal in the children and older adult categories. The young adults and adults sex ratios differed most from those of the 2016 Census population, as there were 71% and 67% more women than men, respectively.
| Characteristics | 2018–2019 FluWatchers population (n=3,210) |
2016 Census population (n=35,151,730) |
||||
|---|---|---|---|---|---|---|
| Males n=1,139 |
Females n=2,071 |
Sex ratio (M:F) |
Males n=17,264,200 |
Females n=17,887,540 |
Sex ratio (M:F) |
|
| Infants (0–4) | ||||||
| Number | n=31 | n=40 | 0.78 | n=973,030 | n=925,760 | 1.05 |
| % | 2.7 | 1.9 | 4.4 | 5.2 | ||
| 95% CI | 2.7–2.8 | 1.9–2.0 | 4.3–4.4 | 5.1–5.2 | ||
| Children (5–19) | ||||||
| Number | n=273 | n=264 | 1.03 | n=3,059,100 | n=2,907,830 | 1.05 |
| % | 23.9 | 12.7 | 13.7 | 16.3 | ||
| 95% CI | 23.9–24.0 | 12.7–12.8 | 13.6–13.7 | 16.2–16.3 | ||
| Young adults (20–44) | ||||||
| Number | n=341 | n=847 | 0.40 | n=5,660,330 | n=5,741,250 | 0.99 |
| % | 29.94 | 40.9 | 25.3 | 32.1 | ||
| 95% CI | 29.9–30.0 | 40.8–40.9 | 25.3–25.4 | 32.0–32.1 | ||
| Adults (45–64) | ||||||
| Number | n=394 | n=799 | 0.49 | n=4,876,590 | n=5,072,215 | 0.96 |
| % | 34.6 | 38.6 | 44.5 | 28.4 | ||
| 95% CI | 34.5–34.6 | 38.5–38.6 | 44.5–44.8 | 28.3–28.4 | ||
| Older adults (65 and older) | ||||||
| Number | n=100 | n=121 | 0.83 | n=2,695,150 | n=3,240,485 | 0.83 |
| % | 8.8 | 5.8 | 12.1 | 18.1 | ||
| 95% CI | 8.7–8.8 | 5.8–5.9 | 12.0–12.1 | 18.1–18.2 | ||
Among 2018–2019 FluWatchers participants, 65.9% of adult female participants received their seasonal influenza vaccination compared to 46.8% among adult female Canadians in the same year. Similarly, 59.4% of male FluWatchers received their seasonal influenza vaccination compared to only 36.6% among male Canadians in the same year. Vaccination coverage was significantly different between males and females from both populations, although they show a similar trend in that vaccination coverage is higher among females in both populations. Vaccination coverage across all three adult age groups (Table 3) was consistently higher among the FluWatchers population over the four influenza seasons.
Age group |
2015–2016 | 2016–2017 | 2017–2018 | 2018–2019 | ||||
|---|---|---|---|---|---|---|---|---|
| FluWatchers (n=505) |
SIVCS (n=2,000) |
FluWatchers (n=998) |
SIVCS (n=2,024) |
FluWatchers (n=2,114) |
SIVCS (n=2,850) |
FluWatchers (n=3,210) |
SIVCS (n=3,726) |
|
| All adultsFootnote b | 67.8 | 34.3 | 57.0 | 35.8 | 58.5 | 38.3 | 63.7 | 41.8 |
| 18–64 | 67.7 | 27.9 | 56.7 | 28.5 | 57.5 | 29.7 | 61.8 | 34.3 |
| 65 and older | 69.6 | 64.6 | 62.9 | 69.5 | 73.6 | 70.7 | 85.1 | 69.9 |
Comparisons of FluWatchers participants characteristics and representativeness from the 2015–2016 to 2018–2019 influenza seasons
All other descriptive statistics summarized in Table 1 were similar over the four influenza seasons.
Associations between demographic factors and the level of user participation
Table 4 presents a summary of the adjusted odds ratios of being a FluWatcher participant with a high level of participation. Of the 2,650 participants from the 2018–2019 influenza season aged 18 years or older, 1,288 (49%) were classified under the high level of participation, 767 (29%) under the medium level of participation and 595 (22%) under the low level of participation. Age group and vaccination status were statistically significant correlates of level of participation.
| Variable | Reference group | Percentage at high level of participation (%) | Adjusted odds ratio | 95% CI | p-value |
|---|---|---|---|---|---|
| Age group (years) | |||||
| 25 and younger | 45–64 | 0.5 | 0.79 | 0.57–1.09 | 0.0154 |
| 26–44 | 45–64 | 37.8 | 0.75 | 0.65–0.88 | 0.0003 |
| 45–64 | N/A | 50.8 | 1.0Footnote a | N/A | N/A |
| 65 and older | 45–64 | 10.9 | 1.34 | 1.01–1.78 | 0.0453 |
| Sex | |||||
| Sex: male | Female | 69.2 | 0.87 | 0.74–1.02 | 0.0710 |
| Vaccination status | |||||
| Vaccination status: not vaccinated | Vaccinated | 72.5 | 0.81 | 0.61–0.83 | 0.0003 |
The odds of a FluWatcher participating at the high level increased with increasing age category. Those who received their annual influenza vaccination were 1.35-fold more likely to be a high-participation FluWatchers participant. Sex was not correlated with high participation in the full model (p>0.05). A descriptive analysis of the level of participation variable by sex revealed the proportions of males and females among each level of participation were nearly the same, although actual counts significantly differed. A typical FluWatcher was a high level of participation user in the 45–64 years of age group, female, vaccinated and residing in an urban area.
Discussion
Since its inception in the 2015–2016 influenza season, FluWatchers has recruited participants from all provinces and territories and across all age groups, participants who identify as male, female and gender diverse, individuals residing in rural and urban settings and those who did/did not receive the seasonal influenza vaccine. Overall, the FluWatchers population has improved in its representativeness of the Canadian population along measures such as age, rural/urban and provincial/territorial participation. However, over-representativeness has increased among females and persons reporting receipt of annual influenza vaccination. Though FluWatchers has shown to correlate well with influenza activity in Canada thus far, overall, the FluWatchers population is not representative of the 2016 Census population by age, sex and geography.
The infant and older adult age groups remain under-represented; however, these groups have seen the most improvement in representativeness. The geographical representativeness has improved as well; however, Ontario and Saskatchewan are over-represented, and Québec and Alberta are underrepresented in the FluWatchers population. The provincial and territorial average weekly response rates per 100,000 population were not higher in provinces with more participants. As the influenza season in Canada often begins in the west and makes its way east, under-representation in the westernmost provinces limits FluWatchers as an early detection-early warning system. Additionally, there are gaps in participation particularly among the northern provinces/territories with too few participants from the territories to permit estimation of key surveillance parameters or statistical analysis. Overall, the geographic distribution of all registered FluWatchers and the geographic distribution using average weekly response rates lack in their representativeness of the 2016 Census population. The vast majority (90%) of FluWatchers participants are clustered around large urban areas (e.g. greater metropolitan areas in Ontario).
The FluWatchers population remains female-dominant (64.5%). Given the increase in reporting patterns among females over the past four influenza seasons, underlying factors like methods of recruitment, program advertising and high employment rates of women in the public health sector may be driving this participation bias. This trend is consistent with findings from other studies on similar participatory surveillance programs that show women are more interested in health-related topics and show more active online information-seeking behaviourFootnote 19. Participants of InfluenzaNet, FluTracking and Flu Near You surveillance systems were more likely to be female than in their respective target general populationsFootnote 6Footnote 20Footnote 21. These findings are also consistent with survey response and non-response studies that show women, affluent and younger individuals are more likely to participate in survey-based programs than men, less affluent and older individualsFootnote 22.
Level of vaccination coverage
The FluWatchers population vaccination coverage has remained steady over the years. A high proportion of FluWatchers participants report receiving their annual influenza vaccinations, which differs from influenza vaccination behaviours of the general Canadian population (63.7% among all adults aged 18 years or older in the 2018–2019 influenza season compared to only 41.8% in the 2016 Census population, p<0.0001).
Level of participation
A higher level of participation among FluWatchers participants was associated with age and vaccination status. Geography did not correlate with the level of participation. Sex was also not a useful predictor of the level of participation. While there is significant over-representation of females among the FluWatchers population, the distribution of males and females among the high, medium and low levels of participation were nearly the same. A similar study on Flu Near You participants found odds ratios comparing participation habits among males and females were also close to one and InfluenzaNet found that there were no significant differences between males and females on the level of participationFootnote 6Footnote 23. Approximately 25% (n=761) of FluWatchers participants submitted all 31 reports over the 2018–2019 influenza season, and over 1,200 classified as high-level users. The average FluWatcher participant is a high-level user.
Limitations
One of the limitations of this study is that data on socioeconomic status and chronic diseases are not collected by the FluWatchers program, and thus could not be analyzed or compared with the general Canadian population. Additionally, Canadians living in non-household dwellings (e.g. long-term care facilities, correctional facilities, etc.) likely face different barriers to participating in the FluWatchers program versus the Canadian Census, due to different data collection methodsFootnote 12. Similar studies on programs such as GrippeNet and Flu Near You, with similar participant population distributions (age, sex and vaccination status), showed that the majority of participants had at least a high school diploma, paid employment, access to their own car (did not rely on public transport), were not smokers and had a healthy body mass indexFootnote 6Footnote 8. There is a strong likelihood that FluWatchers participants will exhibit the same characteristics.
As the FluWatchers population is a convenience and purposive sample, the extent to which the results can be generalized to the general Canadian population is related to the extent to which FluWatchers participants reflect their respective group (a typical FluWatchers participant is a vaccinated female adult living in an urban area). Additionally, it is not currently possible to assess the magnitude of selection bias in the sample. More research is needed to better understand the bias among the FluWatchers population and how it affects the interpretation of the surveillance data and its future use of the data for non-surveillance purposes. Furthermore, by quantifying the bias, we will be able to make better recommendations for future recruitment goals.
Conclusion
With targeted recruitment of under-represented groups (males and older adults) and under-represented geographical areas (western and northern Canada), the FluWatchers population has the potential to become more representative of the Canadian population, as demonstrated by its improvements over the last four influenza seasons. With these strategic efforts, it has the potential to become a more robust and complementary surveillance system that will benefit the Canadian population and will improve the accuracy of the early detection—early warning system that influenza syndromic surveillance strives to achieve.
Authors' statement
- MD — Participated in data acquisition, analyzed and interpreted the data, and drafted the manuscript
- LL — Participated in data acquisition, reviewed and edited the manuscript
- CB — Reviewed and edited the manuscript
- SM — Reviewed and edited the manuscript
Competing interests
None.
Acknowledgements
The FluWatchers program would like to thank all their volunteer participants.
Fifteen seconds of your time each week can make a difference in public health. For more information on the program and sign-up information, visit the following site: https://www.canada.ca/en/public-health/services/diseases/flu-influenza/fluwatcher.html.
Funding
This work was supported by the Public Health Agency of Canada.
References
- Footnote 1
-
Public Health Agency of Canada. FluWatchers. Ottawa (ON): PHAC (accessed 2020-03-31). https://www.canada.ca/en/public-health/services/diseases/flu-influenza/fluwatcher.html
- Footnote 2
-
Public Health Agency of Canada. FluWatch Sentinel Practitioner ILI Surveillance Program. Ottawa (ON): PHAC (accessed 2020-08-22). https://www.canada.ca/en/public-health/services/diseases/flu-influenza/influenza-surveillance/influenza-sentinel-recruiters.html
- Footnote 3
-
Dalton C, Carlson S, Butler MT, Elvidge E, Durrheim DN. Building Influenza Surveillance Pyramids in Near Real Time, Australia. Emerg Inect Dis. 2013;19(11):1863-5. https://www.ncbi.nlm.nih.gov/pmc/articles/PMC3837640/
- Footnote 4
-
Santillana M, Nguyen AT, Dredze M, Paul MJ, Nsoesie EO, Brownstein JS. Combining Search, Social Media, and Traditional Data Sources to Improve Influenza Surveillance. PLOS Comput Biol 2015;11(10):e1004513. https://doi.org/10.1371/journal.pcbi.1004513
- Footnote 5
-
Lee L, Desroches ML, Bancej C, Mukhi S. FluWatchers: Evaluation of a crowdsourced influenza-like illness surveillance application for Canadian influenza seasons 2015–2016 to 2018–2019. Can Commun Dis Rep 2021;47(9):357–63. https://doi.org/10.14745/ccdr.v47i09a02
- Footnote 6
-
van Noort SP, Codeço CT, Koppeschaar CE, van Ranst M, Paolotti D, Gomes MG. Ten-year performance of Influenzanet: ILI time series, risks, vaccine effects, and care-seeking behaviour. Epidemics 2015;13:28–36. https://doi.org/10.1016/j.epidem.2015.05.001
- Footnote 7
-
Carlson SJ, Cassano D, Butler MT, Durrheim DN, Dalton CB. Flutracking weekly online community survey of influenza-like illness annual report, 2016. Commun Dis Intell (2018) 2019;43. https://doi.org/10.33321/cdi.2019.43.15
- Footnote 8
-
Debin M, Turbelin C, Blanchon T, Bonmarin I, Falchi A, Hanslik T, Levy-Bruhl D, Poletto C, Colizza V. Evaluating the feasibility and participants’ representativeness of an online nationwide surveillance system for influenza in France. PLoS One 2013;8(9):e73675. https://doi.org/10.1371/journal.pone.0073675
- Footnote 9
-
Baltrusaitis K, Santillana M, Crawley AW, Chunara R, Smolinski M, Brownstein JS. Determinants of Participants’ Follow-Up and Characterization of Representativeness in Flu Near You, A Participatory Disease Surveillance System. JMIR Public Health Surveill 2017;3(2):e18. https://doi.org/10.2196/publichealth.7304
- Footnote 10
-
Hope K, Durrheim DN, d’Espaignet ET, Dalton C. Syndromic Surveillance: is it a useful tool for local outbreak detection? J Epidemiol Community Health 2006;60(5):374–5. https://doi.org/10.1136/jech.2005.035337
- Footnote 11
-
Public Health Agency of Canada. Sign up to be a FluWatcher. Ottawa (ON): PHAC (accessed 2020-05-01). https://cnphi.canada.ca/fluWatcher/register
- Footnote 12
-
Statistics Canada. Data products, 2016 Census. Ottawa (ON): Statistics Canada (updated 2021; accessed 2020-05-01). https://www12.statcan.gc.ca/census-recensement/2016/dp-pd/index-eng.cfm
- Footnote 13
-
Public Health Agency of Canada. Influenza vaccine uptake: Results from the 2015/16 national influenza immunization coverage survey in Canada. Ottawa (ON): PHAC; (updated 2021; accessed 2020-05-01). https://www.canada.ca/en/public-health/services/publications/healthy-living/vaccine-uptake-results-2015-16-national-influenza-immunization-coverage-survey.html
- Footnote 14
-
Public Health Agency of Canada. 2016/2017 Seasonal Influenza (Flu) Vaccine Coverage Survey Results. Ottawa (ON): PHAC (updated 2019-03-21; accessed 2020-08-24). https://www.canada.ca/en/public-health/services/publications/healthy-living/2016-2017-seasonal-influenza-flu-vaccine-coverage-survey-results.html
- Footnote 15
-
Public Health Agency of Canada. Seasonal Influenza (Flu) Vaccination Coverage Survey Results, 2017-2018. Ottawa (ON): PHAC (updated 2019-03-21; accessed 2020-08-24). https://www.canada.ca/en/public-health/services/publications/healthy-living/2017-2018-seasonal-influenza-flu-vaccine-coverage-survey-results.html
- Footnote 16
-
Public Health Agency of Canada. Vaccine Uptake in Canadian Adults 2019. Ottawa (ON): PHAC (updated 2019-11-27; accessed 2020-08-24). https://www.canada.ca/en/public-health/services/publications/healthy-living/2018-2019-influenza-flu-vaccine-coverage-survey-results.html
- Footnote 17
-
Statistics Canada. Sex at birth and gender: Technical report on changes for the 2021 Census. Ottawa (ON): Statistics Canada (updated 2020-07-17; accessed 2020-08-23). https://www12.statcan.gc.ca/census-recensement/2021/ref/98-20-0002/982000022020002-eng.cfm
- Footnote 18
-
Canada Post. Addressing Guidelines. https://www.canadapost-postescanada.ca/cpc/en/support/articles/addressing-guidelines/overview.page
- Footnote 19
-
Nölke L, Mensing M, Krämer A, Hornberg C. Sociodemographic and health-(care-)related characteristics of online health information seekers: a cross-sectional German study. BMC Public Health 2015;15(31):31. https://doi.org/10.1186/s12889-015-1423-0
- Footnote 20
-
Cantarelli P, Debin M, Turbelin C, Poletto C, Blanchon T, Falchi A, Hanslik T, Bonmarin I, Levy-Bruhl D, Micheletti A, Paolotti D, Vespignani A, Edmunds J, Eames K, Smallenburg R, Koppeschaar C, Franco AO, Faustino V, Carnahan A, Rehn M, Colizza V. The representativeness of a European multi-center network for influenza-like-illness participatory surveillance. BMC Public Health 2014;14(984):984. https://doi.org/10.1186/1471-2458-14-984
- Footnote 21
-
Carlson SJ, Dalton CB, Butler MT, Fejsa J, Elvidge E, Durrheim DN. Flutracking weekly online community survey of influenza-like illness annual report 2011 and 2012. Commun Dis Intell Q Rep 2013;37(4):E398–406. https://.ncbi.nlm.nih.gov/24882237/
- Footnote 22
-
Smith W. Does Gender Influence Online Survey Participation?: A record-linkage analysis of University faculty online survey response behavior. San Jose, California: San Jose State University, Department of Elementary Education; 2008. https://files.eric.ed.gov/fulltext/ED501717.pdf
- Footnote 23
-
Bajardi P, Vespignani A, Funk S, Eames KT, Edmunds WJ, Turbelin C, Debin M, Colizza V, Smallenburg R, Koppeschaar CE, Franco AO, Faustino V, Carnahan A, Rehn M, Paolotti D. Determinants of follow-up participation in the Internet-based European influenza surveillance platform Influenzanet. J Med Internet Res 2014;16(3):e78. https://doi.org/10.2196/jmir.3010
