
FluWatchers - Canada’s surveillance of seasonal influenza-like-illness

 Download this article as a PDF
Published by: The Public Health Agency of Canada
Issue: Volume 47-9: FluWatchers: A Crowdsourcing Approach
Date published: September 2021
ISSN: 1481-8531
Submit a manuscript
About CCDR
Browse
Volume 47-9: FluWatchers: A Crowdsourcing Approach
Surveillance
FluWatchers: Evaluation of a crowdsourced influenza-like illness surveillance application for Canadian influenza seasons 2015–2016 to 2018–2019
Liza Lee1, Mireille Desroches1, Shamir Mukhi2, Christina Bancej1
Affiliations
1 Centre for Immunization and Respiratory Infectious Diseases, Public Health Agency of Canada, Ottawa, ON
2 National Microbiology Laboratory, Public Health Agency of Canada, Winnipeg, MB
Correspondence
Suggested citation
Lee L, Desroches M, Mukhi S, Bancej C. FluWatchers: Evaluation of a crowdsourced influenza-like illness surveillance application for Canadian influenza seasons 2015–2016 to 2018–2019. Can Commun Dis Rep 2021;47(9):357–63. https://doi.org/10.14745/ccdr.v47i09a02
Keywords: influenza, seasonal, digital participatory surveillance, crowdsourced, Canada, FluWatchers, syndromic, influenza-like illness (ILI)
Abstract
Background: Sentinel influenza-like illness (ILI) surveillance is an essential component of a comprehensive influenza surveillance program. Community-based ILI surveillance systems that rely solely on sentinel healthcare practices omit important segments of the population, including those who do not seek medical care. Participatory surveillance, which relies on community participation in surveillance, may address some limitations of traditional ILI systems.
Objective: We aimed to evaluate FluWatchers, a crowdsourced ILI application developed to complement and complete ILI surveillance in Canada.
Methods: Using established frameworks for surveillance evaluations, we assessed the acceptability, reliability, accuracy and usefulness of the FluWatchers system 2015–2016, through 2018–2019. Evaluation indicators were compared against national surveillance indicators of ILI and of laboratory confirmed respiratory virus infections.
Results: The acceptability of FluWatchers was demonstrated by growth of 50%–100% in season-over-season participation, and a consistent season-over-season retention of 80%. Reliability was greater for FluWatchers than for our traditional ILI system, although both systems had week-over-week fluctuations in the number of participants responding. FluWatchers' ILI rates had moderate correlation with weekly influenza laboratory detection rates and other winter seasonal respiratory virus detections including respiratory syncytial virus and seasonal coronaviruses. Finally, FluWatchers has demonstrated its usefulness as a source of core FluWatch surveillance information and has the potential to fill data gaps in current programs for influenza surveillance and control.
Conclusion: FluWatchers is an example of an innovative digital participatory surveillance program that was created to address limitations of traditional ILI surveillance in Canada. It fulfills the surveillance system evaluation criteria of acceptability, reliability, accuracy and usefulness.
Introduction
FluWatch is Canada's national seasonal influenza surveillance program and consists of a network of laboratories, hospitals, physician offices, provincial and territorial ministries of health and CanadiansFootnote 1. FluWatch consists of seven surveillance components (geographical spread, laboratory confirmed detections, syndromic influenza-like illness (ILI) surveillance, outbreak surveillance, severe outcome surveillance, strain characterization and antiviral resistance testing and vaccine monitoring) that work together to allow FluWatch to meet three main program objectives (detect, inform and enable).
The World Health Organization (WHO) defines the global standards for the collection, reporting and analysis of seasonal influenza surveillance data and provides a framework for influenza surveillance for member statesFootnote 2. While the WHO does not mandate the exact surveillance components that every surveillance system must contain, it does recommend the inclusion of community-based surveillance of ILI as part of a comprehensive influenza surveillance systemFootnote 2.
Developed in 1996, the Sentinel Practitioner ILI Reporting System (SPIR) is the primary source for ILI surveillance data for the Public Health Agency of Canada's (PHAC) FluWatch programFootnote 1. The SPIR consists of outpatient influenza data submitted by primary care practitioners or registered nurses. There are, however, three major limitations to SPIR: it is reliant on voluntary reporting from a convenience sample of volunteer sentinel physicians or registered nurses; only data from individuals who seek medical attention are captured; and data submission is highly manual and interrupts practitioner workflow.
A growing trend is the use of hybrid surveillance systems that use digital surveillance to complement traditional surveillanceFootnote 3. One popular digital surveillance trend is participatory surveillance or crowdsourced surveillance. Participatory surveillance systems rely on volunteer members of the community to regularly share and report health information via the internet for disease surveillanceFootnote 3Footnote 4. Relying on volunteers address various limitations of traditional ILI surveillance systems, such as reporting delays, low participation and exclusion of individuals who do not seek medical care.
The need to address the limitations of SPIR and the advantages presented by participatory surveillance prompted the FluWatch program to create FluWatchers, an online participatory syndromic surveillance platform to help improve and complement ILI surveillance in Canada.
The FluWatchers system was developed on the Canadian Network for Public Health Intelligence (CNPHI) platform, an established PHAC initiative developed and managed by the National Microbiology LaboratoryFootnote 5. The CNPHI is a purpose-built scientific public health informatics and biosurveillance platformFootnote 6. Its infrastructure provides a secure, reliable and robust technical environment to facilitate and promote multi-jurisdictional collaboration, supporting the cross-domain and cross-discipline exchange of information, ideas and intelligence. The CNPHI was a natural choice to help develop the FluWatchers program, administer the weekly questionnaire and manage the data.
FluWatchers' participants complete a brief, weekly symptom-based report via an anonymous online questionnaire that asks whether the participant, and/or registered household members, have had a cough and/or fever in the past week and their influenza immunization status. Data on other symptoms, absenteeism and healthcare utilization are also collected from individuals reporting cough and fever. The weekly questionnaire is typically administered from October through May.
The objective of the present study is to present a formal evaluation of the FluWatchers program against four surveillance metrics that were adapted from the Centers for Disease Control and Prevention's Framework for Evaluating Public Health Surveillance Systems for Early Detection of OutbreaksFootnote 7:
- Acceptability—Are Canadians willing to participate in FluWatchers?
- Reliability—Are participants providing data consistently?
- Accuracy—How well does the FluWatchers data track influenza patterns in Canada?
- Usefulness—Is FluWatchers adding value to the FluWatch program?
Methods
Data
FluWatch Sentinel Practitioner Influenza-like Illness Reporting System
The SPIR program consists of sentinel practitioners who report the total number of patient visits and the number of patient visits presenting with ILI on a weekly basis. Influenza-like illness is defined as a sudden onset of fever and cough and with one or more of the following: sore throat, joint pain, muscle aches, fatigue, which could be due to the influenza virusFootnote 1.
The weekly percentage of visits for ILI is defined as the number of patient visits to healthcare providers presenting with ILI symptoms in a given week divided by the total number of weekly patient visits to healthcare providers as a whole for that same week.
Respiratory Virus Detection Surveillance System
The Respiratory Virus Detection Surveillance System (RVDSS) is FluWatch's primary source for laboratory-based data on influenza and other seasonal respiratory viruses (adenovirus, coronavirus, enterovirus/rhinovirus, human metapneumovirus [hMPV], parainfluenza and respiratory syncytial virus [RSV])Footnote 8. The RVDSS collects weekly data from provincial, regional and some hospital labs across Canada. Laboratories report on the number of tests performed and the number of tests positive for influenza and other respiratory viruses.
The weekly percentage of tests positive for influenza and all other respiratory viruses were used for this analysis. The weekly percentage of tests positive is defined as the number of positive tests for a given virus in a given week divided by the number of tests performed for a given virus for that same week.
FluWatchers
FluWatchers data consist of self-reported weekly episodes of cough and/or fever. For any participant reporting cough and fever, data on other symptoms experienced, absenteeism and healthcare utilization are collected. For the FluWatchers program, ILI is defined as a report of fever and cough.
The weekly percentage of FluWatchers reporting ILI is defined as the number of reports of cough and fever in a given week divided by the total number reports received by participants for that same week.
Measures
The four evaluation components were assessed as outlined in Table 1.
| Evaluation component | Indicator | Estimation method/calculation |
|---|---|---|
| Acceptability | Participation rate | Median number of weekly participants for a given season Average weekly response rate |
| Retention rate | Number of baseline participants who participated in the subsequent season | |
| Reliability | Proportion of registrants who report in a given week | Percentage of weeks within ±5%, ±10% or ±15% of the median number of weekly participants |
| Accuracy | Association between FluWatchers data compared with ILI and laboratory data | Pearson correlation for FluWatchers data and the weekly percentage of tests for influenza, other respiratory viruses and the SPIR data |
| Usefulness | Contribution to detection of cases and the program's impact and value-added applications | Qualitative assessment of other applications and the additional data variables |
Analysis
Analyses used data from epidemiological weeks 44 to 18 in the pilot 2015–2016 season, weeks 41 to 18 in 2016–2017 and weeks 40 to 18 in 2017–2018 and 2018–2019 to correspond to the weeks when the FluWatchers surveillance program was active. Analyses were performed in SAS 9.4 and Excel 2016.
Results
Acceptability
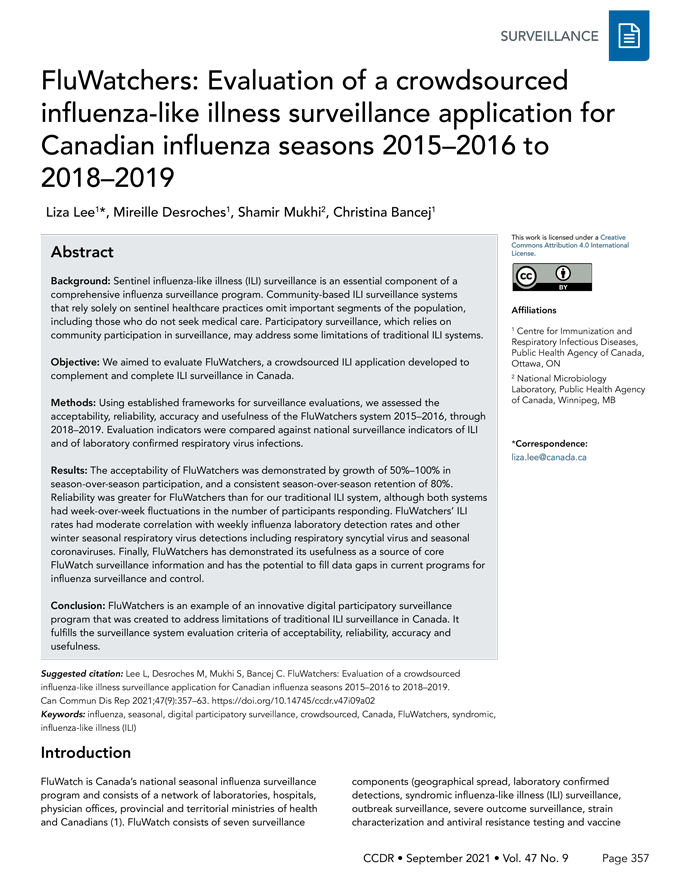
The number of FluWatchers participants increased from a weekly median of 500 participants in season 2015–2016 to just over 3,200 participants in season 2018–2019 (Figure 1). This represents a percent increase of 98% (from seasons 2015–2016 to 2016–2017), 112% (from 2016–2017 to 2017–2018) and 52% (from 2017–2018 to 2018–2019).
Figure 1: Number of FluWatcher participants and the median number of weekly participants by season, Canada, influenza seasons 2015–2016 to 2018–2019
Text description: Figure 1
| Measure | 2015–2016 | 2016–2017 | 2017–2018 | 2018–2019 |
|---|---|---|---|---|
| Participants by season | 505 | 998 | 2,115 | 3,211 |
| Median weekly participants | 398 | 749 | 1,422 | 2,188 |
| Retention rate | N/A | 79% | 80% | 79% |
There was a high retention rate among participants, with 79%–80% of participants continuing their participation to the following season: approximately 60% of participants who started in the 2015–2016 season were still participating in the 2018–2019 season.
The median number of participants also increased from 398 in 2015–2016 to 2,188 in 2018–2019. The average weekly response rate was 78% in 2015–2016, 78% in 2016–2017, 74% in 2017–2018 and 74% in 2018–2019.
Reliability
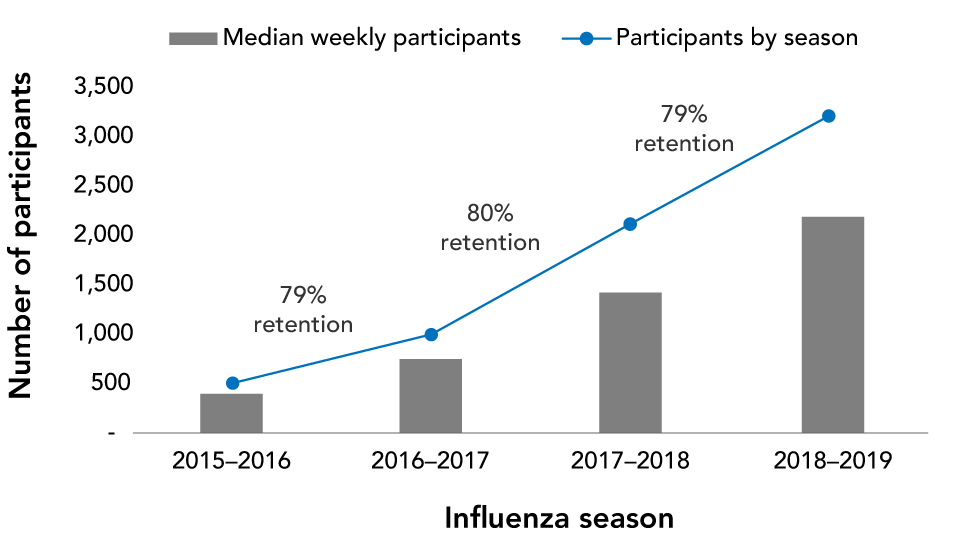
Across four seasons, FluWatchers was consistently more reliable than SPIR (i.e. the denominator was more consistent week to week). The percentage of weeks where the denominator (number of weekly FluWatcher participants) was found to be within ±5% of a season median ranged from 55%–64% (Table 2). This range is higher than the denominator (weekly number of patients seen) reported by SPIR sentinels, where only 26%–41% of reporting weeks were within ±5% of a respective season median. The percentage of weeks where the denominator was within ±10% or ±15% of a respective season median was always higher in the FluWatchers data. In the season 2018–2019 (Figure 2), the percentage of weeks where the denominator was found to be within ±5% of a season median was 65% in the FluWatchers data compared with 26% in the SPIR data. The percentage of weeks where the denominator was found to be within ±15% of the season median improved to 100% in the FluWatchers data and 65% in the SPIR data.
| Season | Program | Percentage of reporting weeks within given percentage of the median | ||
|---|---|---|---|---|
| ±5% | ±10% | ±15% | ||
| 2015–2016 | FluWatchers | 55.6% | 77.8% | 85.2% |
| SPIR | 40.7% | 59.3% | 77.8% | |
| 2016–2017 | FluWatchers | 60.0% | 86.7% | 93.3% |
| SPIR | 36.7% | 66.7% | 80.0% | |
| 2017–2018 | FluWatchers | 61.3% | 93.5% | 96.8% |
| SPIR | 29.0% | 64.5% | 83.9% | |
| 2018–2019 | FluWatchers | 64.5% | 93.5% | 100.0% |
| SPIR | 25.8% | 54.8% | 64.5% | |
Figure 2: Number of FluWatchers participantsFootnote a and the number of patients seen by sentinel practitioners in Sentinel Practitioner Influenza-like Illness Reporting system, Canada, season 2018–2019
Text description: Figure 2
| Week | Number of participants | Median | Plus 5% | Minus 5% | Plus 10% | Minus 10% | Plus 15% | Minus 15% | Number of patients seen | Median | Plus 5% | Minus 5% | Plus 10% | Minus 10% | Plus 15% | Minus 15% |
|---|---|---|---|---|---|---|---|---|---|---|---|---|---|---|---|---|
| 40 | 1,922 | 2,188 | 2,297.4 | 2,078.6 | 2,406.8 | 1,969.2 | 2,516.2 | 1,859.8 | 10,258 | 9,636 | 10,117.8 | 9,154.2 | 10,599.6 | 8,672.4 | 11,081.4 | 8,190.6 |
| 41 | 2,009 | 2,188 | 2,297.4 | 2,078.6 | 2,406.8 | 1,969.2 | 2,516.2 | 1,859.8 | 8,534 | 9,636 | 10,117.8 | 9,154.2 | 10,599.6 | 8,672.4 | 11,081.4 | 8,190.6 |
| 42 | 2,037 | 2,188 | 2,297.4 | 2,078.6 | 2,406.8 | 1,969.2 | 2,516.2 | 1,859.8 | 11,954 | 9,636 | 10,117.8 | 9,154.2 | 10,599.6 | 8,672.4 | 11,081.4 | 8,190.6 |
| 43 | 2,080 | 2,188 | 2,297.4 | 2,078.6 | 2,406.8 | 1,969.2 | 2,516.2 | 1,859.8 | 11,816 | 9,636 | 10,117.8 | 9,154.2 | 10,599.6 | 8,672.4 | 11,081.4 | 8,190.6 |
| 44 | 2,231 | 2,188 | 2,297.4 | 2,078.6 | 2,406.8 | 1,969.2 | 2,516.2 | 1,859.8 | 12,600 | 9,636 | 10,117.8 | 9,154.2 | 10,599.6 | 8,672.4 | 11,081.4 | 8,190.6 |
| 45 | 2,190 | 2,188 | 2,297.4 | 2,078.6 | 2,406.8 | 1,969.2 | 2,516.2 | 1,859.8 | 10,099 | 9,636 | 10,117.8 | 9,154.2 | 10,599.6 | 8,672.4 | 11,081.4 | 8,190.6 |
| 46 | 2,250 | 2,188 | 2,297.4 | 2,078.6 | 2,406.8 | 1,969.2 | 2,516.2 | 1,859.8 | 9,110 | 9,636 | 10,117.8 | 9,154.2 | 10,599.6 | 8,672.4 | 11,081.4 | 8,190.6 |
| 47 | 2,228 | 2,188 | 2,297.4 | 2,078.6 | 2,406.8 | 1,969.2 | 2,516.2 | 1,859.8 | 8,962 | 9,636 | 10,117.8 | 9,154.2 | 10,599.6 | 8,672.4 | 11,081.4 | 8,190.6 |
| 48 | 2,298 | 2,188 | 2,297.4 | 2,078.6 | 2,406.8 | 1,969.2 | 2,516.2 | 1,859.8 | 11,701 | 9,636 | 10,117.8 | 9,154.2 | 10,599.6 | 8,672.4 | 11,081.4 | 8,190.6 |
| 49 | 2,282 | 2,188 | 2,297.4 | 2,078.6 | 2,406.8 | 1,969.2 | 2,516.2 | 1,859.8 | 11,182 | 9,636 | 10,117.8 | 9,154.2 | 10,599.6 | 8,672.4 | 11,081.4 | 8,190.6 |
| 50 | 2,272 | 2,188 | 2,297.4 | 2,078.6 | 2,406.8 | 1,969.2 | 2,516.2 | 1,859.8 | 9,439 | 9,636 | 10,117.8 | 9,154.2 | 10,599.6 | 8,672.4 | 11,081.4 | 8,190.6 |
| 51 | 1,926 | 2,188 | 2,297.4 | 2,078.6 | 2,406.8 | 1,969.2 | 2,516.2 | 1,859.8 | 9,636 | 9,636 | 10,117.8 | 9,154.2 | 10,599.6 | 8,672.4 | 11,081.4 | 8,190.6 |
| 52 | 2,029 | 2,188 | 2,297.4 | 2,078.6 | 2,406.8 | 1,969.2 | 2,516.2 | 1,859.8 | 3,245 | 9,636 | 10,117.8 | 9,154.2 | 10,599.6 | 8,672.4 | 11,081.4 | 8,190.6 |
| 1 | 2,294 | 2,188 | 2,297.4 | 2,078.6 | 2,406.8 | 1,969.2 | 2,516.2 | 1,859.8 | 6,901 | 9,636 | 10,117.8 | 9,154.2 | 10,599.6 | 8,672.4 | 11,081.4 | 8,190.6 |
| 2 | 2,320 | 2,188 | 2,297.4 | 2,078.6 | 2,406.8 | 1,969.2 | 2,516.2 | 1,859.8 | 10,718 | 9,636 | 10,117.8 | 9,154.2 | 10,599.6 | 8,672.4 | 11,081.4 | 8,190.6 |
| 3 | 2,265 | 2,188 | 2,297.4 | 2,078.6 | 2,406.8 | 1,969.2 | 2,516.2 | 1,859.8 | 12,528 | 9,636 | 10,117.8 | 9,154.2 | 10,599.6 | 8,672.4 | 11,081.4 | 8,190.6 |
| 4 | 2,286 | 2,188 | 2,297.4 | 2,078.6 | 2,406.8 | 1,969.2 | 2,516.2 | 1,859.8 | 10,236 | 9,636 | 10,117.8 | 9,154.2 | 10,599.6 | 8,672.4 | 11,081.4 | 8,190.6 |
| 5 | 2,275 | 2,188 | 2,297.4 | 2,078.6 | 2,406.8 | 1,969.2 | 2,516.2 | 1,859.8 | 10,050 | 9,636 | 10,117.8 | 9,154.2 | 10,599.6 | 8,672.4 | 11,081.4 | 8,190.6 |
| 6 | 2,281 | 2,188 | 2,297.4 | 2,078.6 | 2,406.8 | 1,969.2 | 2,516.2 | 1,859.8 | 10,212 | 9,636 | 10,117.8 | 9,154.2 | 10,599.6 | 8,672.4 | 11,081.4 | 8,190.6 |
| 7 | 2,207 | 2,188 | 2,297.4 | 2,078.6 | 2,406.8 | 1,969.2 | 2,516.2 | 1,859.8 | 8,873 | 9,636 | 10,117.8 | 9,154.2 | 10,599.6 | 8,672.4 | 11,081.4 | 8,190.6 |
| 8 | 2,202 | 2,188 | 2,297.4 | 2,078.6 | 2,406.8 | 1,969.2 | 2,516.2 | 1,859.8 | 7,628 | 9,636 | 10,117.8 | 9,154.2 | 10,599.6 | 8,672.4 | 11,081.4 | 8,190.6 |
| 9 | 2,161 | 2,188 | 2,297.4 | 2,078.6 | 2,406.8 | 1,969.2 | 2,516.2 | 1,859.8 | 9,407 | 9,636 | 10,117.8 | 9,154.2 | 10,599.6 | 8,672.4 | 11,081.4 | 8,190.6 |
| 10 | 2,188 | 2,188 | 2,297.4 | 2,078.6 | 2,406.8 | 1,969.2 | 2,516.2 | 1,859.8 | 10,385 | 9,636 | 10,117.8 | 9,154.2 | 10,599.6 | 8,672.4 | 11,081.4 | 8,190.6 |
| 11 | 2,132 | 2,188 | 2,297.4 | 2,078.6 | 2,406.8 | 1,969.2 | 2,516.2 | 1,859.8 | 9,705 | 9,636 | 10,117.8 | 9,154.2 | 10,599.6 | 8,672.4 | 11,081.4 | 8,190.6 |
| 12 | 2,131 | 2,188 | 2,297.4 | 2,078.6 | 2,406.8 | 1,969.2 | 2,516.2 | 1,859.8 | 9,486 | 9,636 | 10,117.8 | 9,154.2 | 10,599.6 | 8,672.4 | 11,081.4 | 8,190.6 |
| 13 | 2,096 | 2,188 | 2,297.4 | 2,078.6 | 2,406.8 | 1,969.2 | 2,516.2 | 1,859.8 | 9,050 | 9,636 | 10,117.8 | 9,154.2 | 10,599.6 | 8,672.4 | 11,081.4 | 8,190.6 |
| 14 | 2,147 | 2,188 | 2,297.4 | 2,078.6 | 2,406.8 | 1,969.2 | 2,516.2 | 1,859.8 | 9,123 | 9,636 | 10,117.8 | 9,154.2 | 10,599.6 | 8,672.4 | 11,081.4 | 8,190.6 |
| 15 | 2,077 | 2,188 | 2,297.4 | 2,078.6 | 2,406.8 | 1,969.2 | 2,516.2 | 1,859.8 | 10,684 | 9,636 | 10,117.8 | 9,154.2 | 10,599.6 | 8,672.4 | 11,081.4 | 8,190.6 |
| 16 | 1,970 | 2,188 | 2,297.4 | 2,078.6 | 2,406.8 | 1,969.2 | 2,516.2 | 1,859.8 | 9,340 | 9,636 | 10,117.8 | 9,154.2 | 10,599.6 | 8,672.4 | 11,081.4 | 8,190.6 |
| 17 | 2,039 | 2,188 | 2,297.4 | 2,078.6 | 2,406.8 | 1,969.2 | 2,516.2 | 1,859.8 | 7,906 | 9,636 | 10,117.8 | 9,154.2 | 10,599.6 | 8,672.4 | 11,081.4 | 8,190.6 |
| 18 | 2,013 | 2,188 | 2,297.4 | 2,078.6 | 2,406.8 | 1,969.2 | 2,516.2 | 1,859.8 | 7,989 | 9,636 | 10,117.8 | 9,154.2 | 10,599.6 | 8,672.4 | 11,081.4 | 8,190.6 |
Accuracy
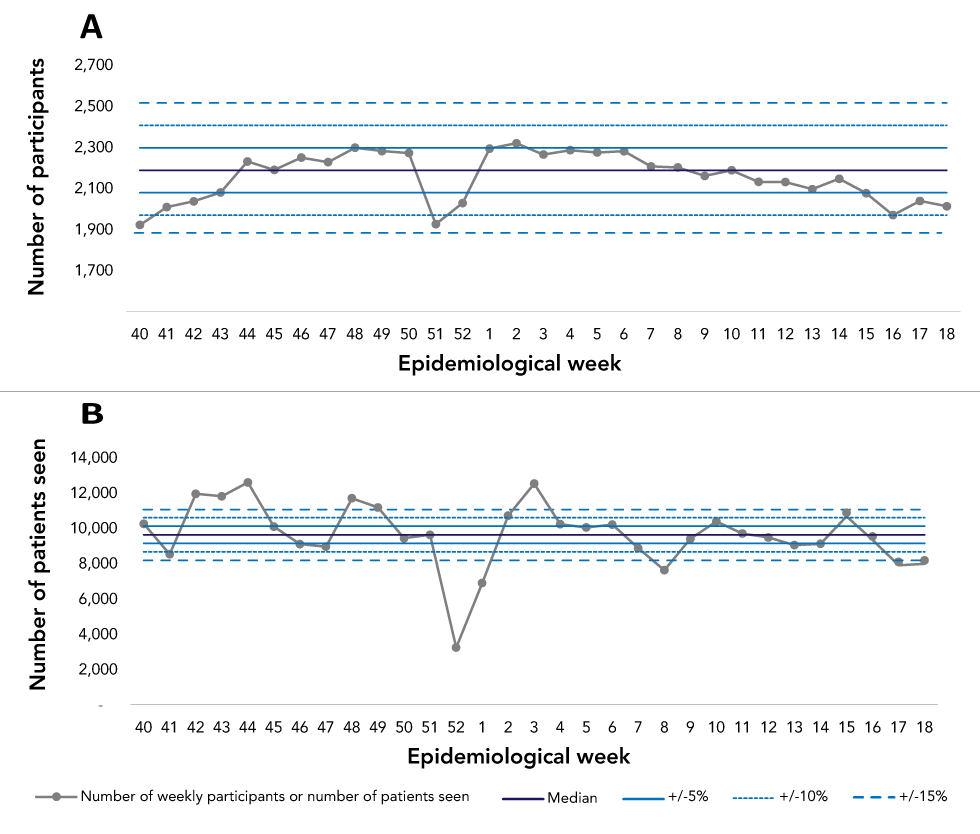
Across four seasons, when the weekly FluWatchers ILI rates were compared with the positivity rate of influenza from national surveillance system, there was a significant and strong correlation between the two datasets (Figure 3).
Figure 3: Percentage of FluWatchers reporting cough and fever and national influenza positivity rate, Canada, seasons 2015–2016 to 2018–2019
Text description: Figure 3
| Epidemiological week | FluWatchers | Percent positive influenza |
|---|---|---|
| 2015–2016 | ||
| 2015–44 | 2.04% | 1.20% |
| 2015–45 | 2.94% | 1.39% |
| 2015–46 | 1.53% | 1.51% |
| 2015–47 | 1.12% | 1.44% |
| 2015–48 | 1.22% | 0.84% |
| 2015–49 | 2.50% | 1.64% |
| 2015–50 | 1.94% | 2.36% |
| 2015–51 | 2.49% | 3.30% |
| 2015–52 | 1.16% | 4.28% |
| 2016–01 | 0.69% | 5.85% |
| 2016–02 | 1.68% | 7.06% |
| 2016–03 | 2.09% | 12.24% |
| 2016–04 | 2.07% | 15.89% |
| 2016–05 | 2.34% | 20.57% |
| 2016–06 | 4.60% | 24.83% |
| 2016–07 | 2.54% | 28.71% |
| 2016–08 | 1.86% | 32.87% |
| 2016–09 | 2.15% | 34.28% |
| 2016–10 | 4.06% | 35.99% |
| 2016–11 | 4.03% | 31.41% |
| 2016–12 | 3.14% | 30.03% |
| 2016–13 | 3.03% | 28.25% |
| 2016–14 | 1.75% | 23.16% |
| 2016–15 | 1.58% | 20.73% |
| 2016–16 | 2.26% | 18.52% |
| 2016–17 | 1.28% | 17.30% |
| 2016–18 | 2.03% | 13.03% |
| 2016–2017 | ||
| 2016–41 | 2.57% | 1.46% |
| 2016–42 | 1.61% | 2.05% |
| 2016–43 | 1.99% | 2.75% |
| 2016–44 | 1.78% | 3.57% |
| 2016–45 | 1.96% | 4.55% |
| 2016–46 | 2.05% | 4.37% |
| 2016–47 | 2.39% | 5.37% |
| 2016–48 | 2.14% | 6.72% |
| 2016–49 | 2.94% | 9.59% |
| 2016–50 | 2.89% | 11.42% |
| 2016–51 | 2.53% | 16.08% |
| 2016–52 | 2.81% | 23.07% |
| 2017–01 | 2.85% | 24.10% |
| 2017–02 | 1.90% | 27.09% |
| 2017–03 | 2.35% | 23.25% |
| 2017–04 | 2.13% | 22.89% |
| 2017–05 | 2.62% | 24.24% |
| 2017–06 | 3.80% | 24.14% |
| 2017–07 | 3.79% | 24.91% |
| 2017–08 | 3.65% | 24.03% |
| 2017–09 | 2.71% | 21.74% |
| 2017–10 | 2.42% | 20.45% |
| 2017–11 | 2.47% | 16.19% |
| 2017–12 | 2.46% | 15.03% |
| 2017–13 | 3.06% | 14.50% |
| 2017–14 | 1.35% | 12.66% |
| 2017–15 | 1.82% | 11.95% |
| 2017–16 | 2.09% | 11.64% |
| 2017–17 | 1.40% | 9.76% |
| 2017–18 | 1.19% | 9.59% |
| 2017–2018 | ||
| 2017–40 | 2.64% | 2.33% |
| 2017–41 | 1.86% | 3.02% |
| 2017–42 | 2.03% | 3.40% |
| 2017–43 | 1.81% | 4.59% |
| 2017–44 | 1.49% | 4.70% |
| 2017–45 | 2.32% | 5.72% |
| 2017–46 | 2.15% | 7.72% |
| 2017–47 | 2.39% | 10.55% |
| 2017–48 | 3.35% | 14.87% |
| 2017–49 | 3.16% | 18.50% |
| 2017–50 | 2.84% | 20.75% |
| 2017–51 | 3.70% | 24.94% |
| 2017–52 | 5.38% | 28.33% |
| 2018–01 | 4.76% | 29.29% |
| 2018–02 | 3.93% | 29.10% |
| 2018–03 | 4.84% | 30.07% |
| 2018–04 | 4.23% | 29.45% |
| 2018–05 | 3.59% | 30.62% |
| 2018–06 | 4.28% | 32.39% |
| 2018–07 | 3.71% | 32.51% |
| 2018–08 | 3.47% | 30.85% |
| 2018–09 | 3.53% | 29.06% |
| 2018–10 | 2.67% | 26.72% |
| 2018–11 | 1.89% | 23.75% |
| 2018–12 | 2.82% | 19.74% |
| 2018–13 | 1.99% | 18.60% |
| 2018–14 | 2.58% | 17.20% |
| 2018–15 | 1.60% | 14.52% |
| 2018–16 | 1.47% | 11.94% |
| 2018–17 | 1.47% | 10.27% |
| 2018–18 | 1.23% | 7.88% |
| 2018–2019 | ||
| 2018–40 | 2.71% | 1.63% |
| 2018–41 | 2.49% | 1.62% |
| 2018–42 | 1.87% | 2.89% |
| 2018–43 | 1.49% | 5.32% |
| 2018–44 | 1.39% | 8.55% |
| 2018–45 | 1.64% | 10.10% |
| 2018–46 | 1.91% | 14.11% |
| 2018–47 | 1.44% | 15.36% |
| 2018–48 | 2.57% | 18.20% |
| 2018–49 | 1.97% | 19.71% |
| 2018–50 | 3.79% | 23.72% |
| 2018–51 | 3.95% | 26.19% |
| 2018–52 | 3.60% | 28.90% |
| 2019–01 | 3.49% | 23.48% |
| 2019–02 | 2.80% | 23.67% |
| 2019–03 | 2.52% | 20.33% |
| 2019–04 | 3.06% | 19.48% |
| 2019–05 | 3.16% | 19.60% |
| 2019–06 | 2.76% | 17.89% |
| 2019–07 | 2.58% | 16.28% |
| 2019–08 | 2.54% | 17.45% |
| 2019–09 | 2.64% | 20.16% |
| 2019–10 | 3.11% | 19.96% |
| 2019–11 | 2.63% | 19.13% |
| 2019–12 | 2.53% | 18.67% |
| 2019–13 | 2.39% | 19.25% |
| 2019–14 | 2.47% | 19.94% |
| 2019–15 | 1.93% | 19.75% |
| 2019–16 | 2.44% | 16.23% |
| 2019–17 | 2.31% | 14.25% |
| 2019–18 | 2.09% | 10.67% |
| Measure | Season | |||
|---|---|---|---|---|
| 2015–2016 | 2016–2017 | 2017–2018 | 2018–2019 | |
| Pearson's r | 0.541 | 0.524 | 0.782 | 0.634 |
| p-value | 0.0036 | 0.0029 | <0.0001 | 0.0001 |
Furthermore, when comparing the FluWatchers data to the positivity rate of other respiratory viruses across four seasons, there was either a weak or a negative correlation with adenovirus, enterovirus/rhinovirus, hMPV and parainfluenza (Table 3). There was a moderate to strong correlation between the FluWatchers data and seasonal coronavirus and RSV in all seasons except the 2015–2016 season.
| Correlation with a given virus | Season | |||
|---|---|---|---|---|
| 2015–2016 | 2016–2017 | 2017–2018 | 2018–2019 | |
| RSV | 0.171 | 0.651Footnote * | 0.555Footnote * | 0.598Footnote * |
| Parainfluenza | -0.451Footnote * | -0.459Footnote * | -0.323 | -0.179 |
| Adenovirus | -0.515Footnote * | -0.252 | -0.666Footnote * | -0.374Footnote * |
| hMPV | 0.257 | -0.135 | -0.010 | 0.126 |
| Rhinovirus/enterovirus | -0.403Footnote * | -0.521Footnote * | -0.609Footnote * | -0.296 |
| Coronavirus | 0.278 | 0.501Footnote * | 0.738Footnote * | 0.499Footnote * |
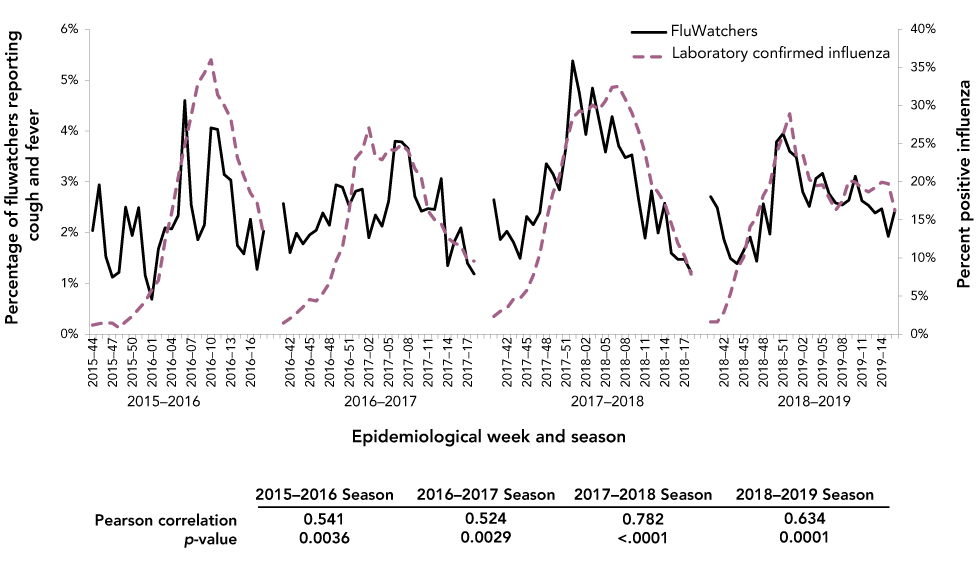
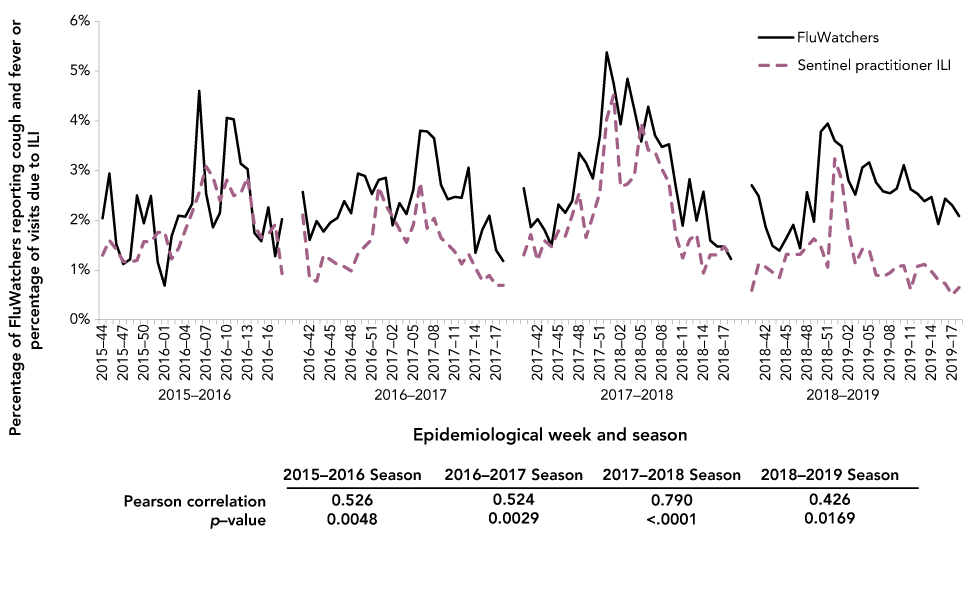
Weekly FluWatchers ILI rates were also compared to SPIR’s weekly percentage of visits for ILI. The Pearson correlation coefficient varied across the four seasons ranging from moderate to strong (Figure 4). As a validation measure, the weekly percentage of visits for ILI was compared with the percentage of tests positive for influenza. During the four seasons, the correlation was variable between SPIR ILI and laboratory data, with a Pearson correlation coefficient (r) of 0.858, 0.685, 0.738 and 0.501 in seasons 2015–2016, 2016–2017, 2017–2018 and 2018–2019, respectively, all with statistically significant p values.
Figure 4: Percentage of FluWatchers reporting cough and fever and percentage of visits due to influenza-like illnesses reported by sentinels, Canada, seasons 2015–2016 to 2018–2019
Text description: Figure 4
| Epidemiological week | FluWatchers | Percent positive influenza |
|---|---|---|
| 2015–2016 | ||
| 2015–44 | 2.04% | 1.30% |
| 2015–45 | 2.94% | 1.60% |
| 2015–46 | 1.53% | 1.42% |
| 2015–47 | 1.12% | 1.17% |
| 2015–48 | 1.22% | 1.16% |
| 2015–49 | 2.50% | 1.19% |
| 2015–50 | 1.94% | 1.57% |
| 2015–51 | 2.49% | 1.57% |
| 2015–52 | 1.16% | 1.76% |
| 2016–01 | 0.69% | 1.77% |
| 2016–02 | 1.68% | 1.22% |
| 2016–03 | 2.09% | 1.43% |
| 2016–04 | 2.07% | 1.81% |
| 2016–05 | 2.34% | 2.17% |
| 2016–06 | 4.60% | 2.56% |
| 2016–07 | 2.54% | 3.08% |
| 2016–08 | 1.86% | 2.87% |
| 2016–09 | 2.15% | 2.40% |
| 2016–10 | 4.06% | 2.81% |
| 2016–11 | 4.03% | 2.50% |
| 2016–12 | 3.14% | 2.54% |
| 2016–13 | 3.03% | 2.87% |
| 2016–14 | 1.75% | 1.90% |
| 2016–15 | 1.58% | 1.65% |
| 2016–16 | 2.26% | 1.72% |
| 2016–17 | 1.28% | 1.92% |
| 2016–18 | 2.03% | 0.93% |
| 2016–2017 | ||
| 2016–41 | 2.57% | 2.11% |
| 2016–42 | 1.61% | 0.82% |
| 2016–43 | 1.99% | 0.78% |
| 2016–44 | 1.78% | 1.30% |
| 2016–45 | 1.96% | 1.21% |
| 2016–46 | 2.05% | 1.11% |
| 2016–47 | 2.39% | 1.07% |
| 2016–48 | 2.14% | 0.98% |
| 2016–49 | 2.94% | 1.33% |
| 2016–50 | 2.89% | 1.48% |
| 2016–51 | 2.53% | 1.62% |
| 2016–52 | 2.81% | 2.67% |
| 2017–01 | 2.85% | 2.30% |
| 2017–02 | 1.90% | 2.08% |
| 2017–03 | 2.35% | 1.82% |
| 2017–04 | 2.13% | 1.56% |
| 2017–05 | 2.62% | 1.91% |
| 2017–06 | 3.80% | 2.76% |
| 2017–07 | 3.79% | 1.84% |
| 2017–08 | 3.65% | 2.04% |
| 2017–09 | 2.71% | 1.65% |
| 2017–10 | 2.42% | 1.52% |
| 2017–11 | 2.47% | 1.37% |
| 2017–12 | 2.46% | 1.12% |
| 2017–13 | 3.06% | 1.33% |
| 2017–14 | 1.35% | 1.04% |
| 2017–15 | 1.82% | 0.79% |
| 2017–16 | 2.09% | 0.89% |
| 2017–17 | 1.40% | 0.69% |
| 2017–18 | 1.19% | 0.70% |
| 2017–2018 | ||
| 2017–40 | 2.64% | 1.31% |
| 2017–41 | 1.86% | 1.71% |
| 2017–42 | 2.03% | 1.19% |
| 2017–43 | 1.81% | 1.59% |
| 2017–44 | 1.49% | 1.47% |
| 2017–45 | 2.32% | 1.79% |
| 2017–46 | 2.15% | 1.68% |
| 2017–47 | 2.39% | 2.11% |
| 2017–48 | 3.35% | 2.54% |
| 2017–49 | 3.16% | 1.66% |
| 2017–50 | 2.84% | 2.09% |
| 2017–51 | 3.70% | 2.56% |
| 2017–52 | 5.38% | 4.04% |
| 2018–01 | 4.76% | 4.51% |
| 2018–02 | 3.93% | 2.67% |
| 2018–03 | 4.84% | 2.73% |
| 2018–04 | 4.23% | 2.89% |
| 2018–05 | 3.59% | 3.96% |
| 2018–06 | 4.28% | 3.41% |
| 2018–07 | 3.71% | 3.37% |
| 2018–08 | 3.47% | 3.03% |
| 2018–09 | 3.53% | 2.76% |
| 2018–10 | 2.67% | 1.70% |
| 2018–11 | 1.89% | 1.24% |
| 2018–12 | 2.82% | 1.61% |
| 2018–13 | 1.99% | 1.72% |
| 2018–14 | 2.58% | 0.94% |
| 2018–15 | 1.60% | 1.31% |
| 2018–16 | 1.47% | 1.30% |
| 2018–17 | 1.47% | 1.47% |
| 2018–18 | 1.23% | 1.29% |
| 2018–2019 | ||
| 2018–40 | 2.71% | 0.59% |
| 2018–41 | 2.49% | 1.12% |
| 2018–42 | 1.87% | 1.06% |
| 2018–43 | 1.49% | 0.96% |
| 2018–44 | 1.39% | 0.85% |
| 2018–45 | 1.64% | 1.32% |
| 2018–46 | 1.91% | 1.32% |
| 2018–47 | 1.44% | 1.32% |
| 2018–48 | 2.57% | 1.47% |
| 2018–49 | 1.97% | 1.63% |
| 2018–50 | 3.79% | 1.47% |
| 2018–51 | 3.95% | 1.06% |
| 2018–52 | 3.60% | 3.24% |
| 2019–01 | 3.49% | 2.83% |
| 2019–02 | 2.80% | 1.79% |
| 2019–03 | 2.52% | 1.13% |
| 2019–04 | 3.06% | 1.42% |
| 2019–05 | 3.16% | 1.40% |
| 2019–06 | 2.76% | 0.90% |
| 2019–07 | 2.58% | 0.87% |
| 2019–08 | 2.54% | 0.94% |
| 2019–09 | 2.64% | 1.07% |
| 2019–10 | 3.11% | 1.09% |
| 2019–11 | 2.63% | 0.61% |
| 2019–12 | 2.53% | 1.08% |
| 2019–13 | 2.39% | 1.12% |
| 2019–14 | 2.47% | 0.98% |
| 2019–15 | 1.93% | 0.80% |
| 2019–16 | 2.44% | 0.73% |
| 2019–17 | 2.31% | 0.51% |
| 2019–18 | 2.09% | 0.65% |
| Measure | Season | |||
|---|---|---|---|---|
| 2015–2016 | 2016–2017 | 2017–2018 | 2018–2019 | |
| Pearson's r | 0.526 | 0.524 | 0.790 | 0.426 |
| p-value | 0.0048 | 0.0029 | <0.0001 | 0.0169 |
Usefulness
The FluWatchers program provided other data that had not previously been collected by PHAC or was not available weekly. These data include healthcare utilization, laboratory testing, vaccination status, absenteeism and demographic information such as age, gender, regular contact with patients and location (first three characters of a postal code—forward sortation area). Additionally, the FluWatchers program collected surveillance data from individuals who did not seek medical care or get tested.
A more detailed analysis on healthcare utilization, vaccination status and absenteeism within the FluWatchers population can be found in the publication by Desroches et al. in this issueFootnote 9.
Discussion
Our analyses show that the FluWatchers program fulfills the four surveillance evaluation areas assessed.
Acceptability—Canadians are willing to participate in FluWatchers, as reflected by an increase in uptake over the four seasons and a high retention rate. In its fourth year of surveillance, the number of participants was comparable to that seen in mature participatory ILI surveillance systems, some of which have been established as early as 2005 and in countries with populations larger than CanadaFootnote 10Footnote 11. Some programs from countries with smaller populations than Canada, such as the Flutracking in Australia and the De Grote Griepmeting system in Belgium and the Netherlands, have between 15,000 and 50,000 registered users. The United States’ Flu Near You has over 50,000 users from a national population of over 327 millionFootnote 10Footnote 11. FluWatchers is still a small and relatively new program and has the potential to attract and retain more participants.
Reliability—FluWatcher participants have been consistently providing data. The percentage of weeks where the number of FluWatcher participants (denominator) was within either ±5%, ±10% or ±15% from the season median was always higher than that of the SPIR system. Influenza season in Canada often peaks around Christmas and New Years (late December, early January), when data providers such as practitioners and laboratories may be at reduced capacities. This affects the timing and the quality of data around peak influenza season. FluWatchers participation consistently dropped in late December and early January; however, the drop was not as drastic as that seen for SPIR participants. Receiving consistent and reliable data is important in surveillance to interpret trends.
Accuracy—The FluWatchers data appeared to track influenza in Canada with a moderate to strong positive correlation to our main influenza activity indicator, the percentage of laboratory tests positive for influenza. The timing of the peaks suggest that FluWatchers ILI data peaks before the influenza laboratory data. This is not unexpected because one of the aims of syndromic surveillance is to identify an increase illness activity before formal diagnoses are confirmed and reported to public health agenciesFootnote 12. The observed moderate to strong positive correlation between the FluWatchers data and seasonal coronavirus and RSV in all seasons (except the 2015–2016 season) and the weak or negative correlation with adenovirus, enterovirus/rhinovirus, hMPV and parainfluenza is also not unexpected. Seasonal coronavirus and RSV often circulate at the same time as influenza in Canada, while viruses such as enterovirus/rhinovirus often circulate outside the FluWatchers surveillance seasonFootnote 8. The FluWatchers’ ILI case definition of cough and fever could identify activity of other respiratory viruses such as RSV and seasonal coronavirus. Since FluWatchers collects data on other symptoms, the FluWatchers case definition for ILI could be tailored to be more specific to influenza.
Usefulness—FluWatchers added value to the FluWatch surveillance program by filling gaps in data that is either not collected by PHAC or not available in a timely manner. Traditional surveillance programs within FluWatch typically capture the “tip of the iceberg” of influenza cases in Canada since only reports of positive laboratory confirmed cases are collected. FluWatchers may give us a better idea about the burden of influenza in Canada by capturing cases who did not seek medical attention or get tested for influenza, and by providing data on absenteeism and healthcare utilization. Additionally, the FluWatchers data can be used to inform work on initiatives such as the WHO’s Pandemic Influenza Severity Assessment (PISA)Footnote 13. For example, “impact” is one of PISA’s three main indicators, where school and work absenteeism due to influenza is recommended as a measurement of how an influenza epidemic affects society. Currently, data on the impact indicator is not currently available for Canada, and FluWatchers could potentially fill this gap with the weekly absenteeism data it collects.
Strengths and limitations
FluWatchers does have its limitations. The FluWatchers population differs from the Canadian population as seen in the 2016 Canadian Census: FluWatchers participants, while coming from all provinces and territories, from urban and rural settings, and all age groups, genders and influenza vaccine acceptance, under-represent the tails of Canada’s age distribution and over-represent females, urban-dwelling Canadians and those who engage in health promoting behaviors as indicated by high influenza vaccine coverageFootnote 9. This is not unique to Canada as other participatory surveillance systems around the world experience the same limitations but are still able demonstrate similar trends as traditional ILI sourcesFootnote 3Footnote 4Footnote 14Footnote 15. Despite this limitation, the FluWatchers data demonstrated positive attributes of other participatory surveillance systems, such as accuracy and sensitivity and being able to measure burden of illnessFootnote 4Footnote 15. While the data provided by FluWatchers was comprehensive, further exploration of the data must be done and biases need to be quantified before using the data for other purposes than that of surveillance for ILI. The FluWatchers program is still in its infancy and public health practitioners can work towards using these data for other purposes, such as estimating vaccination coverage and effectiveness, informing disease transmission models, and supplying information for cost-benefit analyses of public health measures such as vaccination, as has been done by similar programs in other countriesFootnote 4.
Conclusion
FluWatchers is an example of an effective and innovative surveillance program that was created to address limitations of traditional ILI surveillance in Canada. Currently, FluWatchers ILI rates are a formal indicator under syndromic surveillance and have been incorporated into Canada’s weekly FluWatch report.
Authors’ statement
- LL — Writing, review, editing
- MD — Review, editing
- SM — Review, editing
- CB — Review, editing
Competing interests
None.
Acknowledgements
The FluWatchers program would like to thank all their volunteer participants. Fifteen seconds of your time each week can make a difference in public health. For more information on the program and sign-up information, visit the following site: https://www.canada.ca/en/public-health/services/diseases/flu-influenza/fluwatcher.html.
Funding
This work was supported by the Public Health Agency of Canada.
References
- Footnote 1
-
Health Canada. Overview of influenza monitoring in Canada. Ottawa (ON): HC; 2020 (updated 2020-12-10, accessed 2020-01-29). https://www.canada.ca/en/public-health/services/diseases/flu-influenza/influenza-surveillance/about-fluwatch.html#a2.3
- Footnote 2
-
World Health Organization. WHO Global Epidemiological Surveillance Standards for Influenza. Geneva (Switzerland): WHO; 2013. https://www.who.int/influenza/resources/documents/WHO_Epidemiological_Influenza_Surveillance_Standards_2014.pdf
- Footnote 3
-
Ali ST, Cowling BJ. Influenza Virus: Tracking, Predicting, and Forecasting. Annu Rev Public Health 2021;42:43–57. https://doi.org/10.1146/annurev-publhealth-010720-021049
- Footnote 4
-
Wójcik OP, Brownstein JS, Chunara R, Johansson MA. Public health for the people: participatory infectious disease surveillance in the digital age. Emerg Themes Epidemiol 2014;11:7. https://doi.org/10.1186/1742-7622-11-7
- Footnote 5
-
Health Canada. (2020). FluWatchers. Ottawa (ON): HC; 2020 (updated 2020-09-25; accessed 2020-01-29). https://www.canada.ca/en/public-health/services/diseases/flu-influenza/fluwatcher.html
- Footnote 6
-
Mukhi S, Aramini J, Kabani A. Contributing to communicable diseases intelligence management in Canada: CACMID meeting, March 2007, Halifax, Nova Scotia. Can J Infect Dis Med Microbiol 2007;18(6):353–6. https://doi.org/10.1155/2007/386481
- Footnote 7
-
Buehler JW, Hopkins RS, Overhage JM, Sosin DM, Ton V. Framework for Evaluating Public Health Surveillance Systems for Early Detections of Outbreaks. Morb Mortal Wkly Rep (MMWR) 53(RR05):1-11. https://www.cdc.gov/mmwr/preview/mmwrhtml/rr5305a1.htm
- Footnote 8
-
Health Canada. Respiratory Virus Detections in Canada. Ottawa (ON): HC; 2020 (accessed 2020-01-29). https://www.canada.ca/en/public-health/services/surveillance/respiratory-virus-detections-canada.html
- Footnote 9
-
Desroches M, Lee L, Bancej C, Mukhi S. Representativeness of the FluWatchers Participatory Disease Surveillance Program 20152016 to 20182019: How do participants compare with the Canadian population? Can Commun Dis Rep 2021;47(9):36471. https://doi.org/10.14745/ccdr.v47i09a03
- Footnote 10
-
Smolinski MS, Crawley AW, Olsen JM, Jayaraman T, Libel M. Participatory Disease Surveillance: Engaging Communities Directly in Reporting, Monitoring, and Responding to Health Threats. JMIR Public Health Surveill 2017;3(4):e62. https://doi.org/10.2196/publichealth.7540
- Footnote 11
-
The World Bank. Population, total | Data. World Bank; 2020 (accessed 2020-01-29). https://data.worldbank.org/indicator/SP.POP.TOTL
- Footnote 12
-
Henning KJ. Overview of Syndromic Surveillance What is Syndromic Surveillance? Morb Mort Wkly Rep (MMWR). 2004;53(Suppl):5-11 (accessed 2020-01-29). https://www.cdc.gov/mmwr/preview/mmwrhtml/su5301a3.htm
- Footnote 13
-
World Health Organization. Pandemic Influenza Severity Assessment (PISA) – A WHO guide to assess the severity of influenza in seasonal epidemics and pandemics. Geneva (Switzerland): WHO; 2017. http://apps.who.int/iris/handle/10665/259392
- Footnote 14
-
Koppeschaar CE, Colizza V, Guerrisi C, Turbelin C, Duggan J, Edmunds WJ, Kjelsø C, Mexia R, Moreno Y, Meloni S, Paolotti D, Perrotta D, van Straten E, Franco AO. Influenzanet: Citizens Among 10 Countries Collaborating to Monitor Influenza in Europe. JMIR Public Health Surveill 2017;3(3):e66. https://doi.org/10.2196/publichealth.7429
- Footnote 15
-
Baltrusaitis K, Santillana M, Crawley AW, Chunara R, Smolinski M, Brownstein JS. Determinants of Participants’ Follow-Up and Characterization of Representativeness in Flu Near You, A Participatory Disease Surveillance System. JMIR Public Health Surveill. 2017;3(2):e.18. https://doi.org/10.2196/publichealth.7304
