
Differences of hepatitis C treatment across Ontario

 Download this article as a PDF
Published by: The Public Health Agency of Canada
Issue: Volume 48-4, April 2022: First Nations Health
Date published: April 2022
ISSN: 1481-8531
Submit a manuscript
About CCDR
Browse
Volume 48-4, April 2022: First Nations Health
Epidemiologic Study
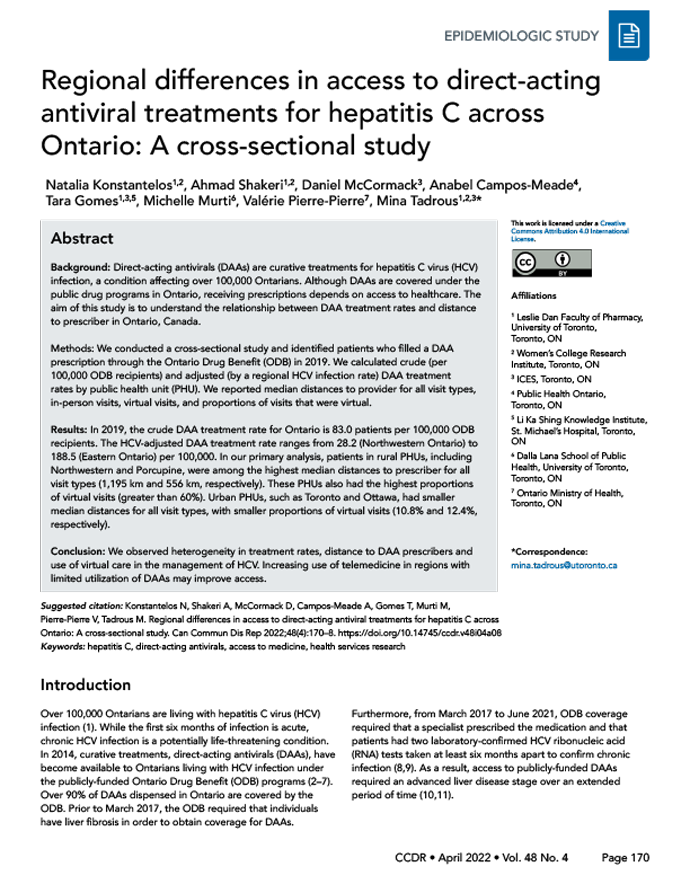
Regional differences in access to direct-acting antiviral treatments for hepatitis C across Ontario: A cross-sectional study
Natalia Konstantelos1,2, Ahmad Shakeri1,2, Daniel McCormack3, Anabel Campos-Meade4, Tara Gomes1,3,5, Michelle Murti6, Valérie Pierre-Pierre7, Mina Tadrous1,2,3
Affiliations
1 Leslie Dan Faculty of Pharmacy, University of Toronto, Toronto, ON
2 Women's College Research Institute, Toronto, ON
3 ICES, Toronto, ON
4 Public Health Ontario, Toronto, ON
5 Li Ka Shing Knowledge Institute, St. Michael's Hospital, Toronto, ON
6 Dalla Lana School of Public Health, University of Toronto, Toronto, ON
7 Ontario Ministry of Health, Toronto, ON
Correspondence
Suggested citation
Konstantelos N, Shakeri A, McCormack D, Campos-Meade A, Gomes T, Murti M, Pierre-Pierre V, Tadrous M. Regional differences in access to direct-acting antiviral treatments for hepatitis C across Ontario: A cross-sectional study. Can Commun Dis Rep 2022;48(4):170–8. https://doi.org/10.14745/ccdr.v48i04a08
Keywords: hepatitis C, direct-acting antivirals, access to medicine, health services research
Abstract
Background: Direct-acting antivirals (DAAs) are curative treatments for hepatitis C virus (HCV) infection, a condition affecting over 100,000 Ontarians. Although DAAs are covered under the public drug programs in Ontario, receiving prescriptions depends on access to healthcare. The aim of this study is to understand the relationship between DAA treatment rates and distance to prescriber in Ontario, Canada.
Methods: We conducted a cross-sectional study and identified patients who filled a DAA prescription through the Ontario Drug Benefit (ODB) in 2019. We calculated crude (per 100,000 ODB recipients) and adjusted (by a regional HCV infection rate) DAA treatment rates by public health unit (PHU). We reported median distances to provider for all visit types, in-person visits, virtual visits, and proportions of visits that were virtual.
Results: In 2019, the crude DAA treatment rate for Ontario is 83.0 patients per 100,000 ODB recipients. The HCV-adjusted DAA treatment rate ranges from 28.2 (Northwestern Ontario) to 188.5 (Eastern Ontario) per 100,000. In our primary analysis, patients in rural PHUs, including Northwestern and Porcupine, were among the highest median distances to prescriber for all visit types (1,195 km and 556 km, respectively). These PHUs also had the highest proportions of virtual visits (greater than 60%). Urban PHUs, such as Toronto and Ottawa, had smaller median distances for all visit types, with smaller proportions of virtual visits (10.8% and 12.4%, respectively).
Conclusion: We observed heterogeneity in treatment rates, distance to DAA prescribers and use of virtual care in the management of HCV. Increasing use of telemedicine in regions with limited utilization of DAAs may improve access.
Introduction
Over 100,000 Ontarians are living with hepatitis C virus (HCV) infectionFootnote 1. While the first six months of infection is acute, chronic HCV infection is a potentially life-threatening condition. In 2014, curative treatments, direct-acting antivirals (DAAs), have become available to Ontarians living with HCV infection under the publicly-funded Ontario Drug Benefit (ODB) programsFootnote 2Footnote 3Footnote 4Footnote 5Footnote 6Footnote 7. Over 90% of DAAs dispensed in Ontario are covered by the ODB. Prior to March 2017, the ODB required that individuals have liver fibrosis in order to obtain coverage for DAAs. Furthermore, from March 2017 to June 2021, ODB coverage required that a specialist prescribed the medication and that patients had two laboratory-confirmed HCV ribonucleic acid (RNA) tests taken at least six months apart to confirm chronic infection Footnote 8Footnote 9. As a result, access to publicly-funded DAAs required an advanced liver disease stage over an extended period of timeFootnote 10Footnote 11.
In general, prior to broad access to virtual care and telemedicine, healthcare access was inversely correlated with distance to healthcare services, with low access contributing to shorter life expectanciesFootnote 12Footnote 13. For example, those living in northern Ontario had shorter life expectancies and poorer health outcomes compared with people living in southern Ontario Footnote 14. In addition, the number of specialist physicians in rural and north Ontario was low and has decreased over timeFootnote 15. One barrier to accessing healthcare is the large distances between patients and their providersFootnote 14Footnote 16; thus, virtual care can play an important role in increasing access to physicians and servicesFootnote 17. This is especially important for Ontarians living in northern and remote small population centres where access to in-person healthcare is limitedFootnote 18.
Those living with HCV infection face many structural barriers to DAAsFootnote 11. Large distances to specialized healthcare may lead to delays in diagnosis and treatment. The DAAs cure over 95% of HCV infections and understanding which regions in Ontario have lower treatment rates can assist in the development of targeted initiatives to increase these treatment ratesFootnote 19Footnote 20. Targeted initiatives, including harm reduction, may benefit those living with HCV infection who are part of marginalized communities, including people who use or inject drugs, those who are homeless/underhoused and those in Indigenous communities Footnote 21Footnote 22. As such, we described the DAA treatment rates across Ontario, distance to prescriber and use of virtual care.
Methods
Study design
We conducted a cross-sectional study among patients who were dispensed at least one course of DAAs ("treatment") through the ODB from January 1, 2019, to December 31, 2019.
Data sources
We utilized January 1, 2019–March 31, 2019, healthcare administrative data through ICES, an organization that houses routinely collected healthcare administrative data. We used the ODB database to identify patients who received a publicly-funded course of DAAs, and the number of ODB-eligible Ontarians. Ontario Drug Benefit-eligible Ontarians included those 65 years of age or older, with financial needs (due to high drug costs and/or low income; individuals who spent at least 4% of their after-tax household income on medications), living in long-term care, who received home care or disability benefits and individuals 24 years of age or youngerFootnote 23. Beginning April 1, 2019, ODB coverage for those 24 years of age or younger was restricted to patients without private insurance. Notably, over 90% of DAAs dispensed in Ontario were reimbursed by the ODBFootnote 6. We determined prescriber location through the ICES Physician Database. These databases are securely linked using unique, encoded identifiers and are analyzed at ICES.
Analysis
We calculated three rates to describe HCV infections and DAA dispensing in Ontario by PHU (see Annex, Figure A1). First, we calculated the HCV infection rate per 100,000 population, using the average annual incidence of newly diagnosed HCV patients (including acute infections and previously undiagnosed chronic infections) from 2014 to 2018 on Public Health Ontario's toolFootnote 24. We utilized incidence as a measure of HCV in each PHU due to the relationship between incidence and prevalence. This measure was used as a proxy to indicate the level of HCV in each PHU because we do not anticipate the duration of disease greatly shifting from 2014–2018, with the first DAAs becoming accessible in Canada in 2014Footnote 25Footnote 26. Previous research has found a strong correlation between incidence rates and prevalenceFootnote 25Footnote 27Footnote 28. Second, we calculated the crude DAA treatment rate, adjusted by the number of ODB-eligible individuals in each PHU. Third, we calculated the HCV-adjusted DAA treatment rate by dividing the crude rate by an HCV prevalence adjustment factor.
We calculated the distance between each patient's home address and their DAA prescriber (at first prescription) using patient residence and prescriber's primary practice postal code, as a measure of treatment access. In our primary analysis, we reported median distance to prescriber of first prescription and the proportion of patients with distances greater than 50 km for all visit types. In our secondary analysis, we reported each distance in kilometers, stratified by visit type, and calculated the proportion of virtual visits by PHU. To define the type of physician visit (in-person or virtual) we identified the physician visit that occurred closest to the DAA ODB claim date (within the past year), where the physician matched the prescriber of the filled DAA prescription. Virtual visits were defined as those with an Ontario Hospitalization Insurance Plan billing code associated with telemedicine (codes: B099, B100 and B200). We excluded individuals who did not have a physician visit in the past year from distance analyses (n=847; 17.7%) since we were unable to determine their visit type, yet included them in the DAA treatment rate calculations.
Initial analyses at ICES were completed using SAS software, Version 9.3Footnote 29. We created maps showing treatment rates and median distances to a prescriber overall and stratified by visit typeFootnote 30. These maps are published online in the Ontario Drug Policy Research Network (ODPRN) website.
Results
Crude and hepatitis C virus-population adjusted treatment rates
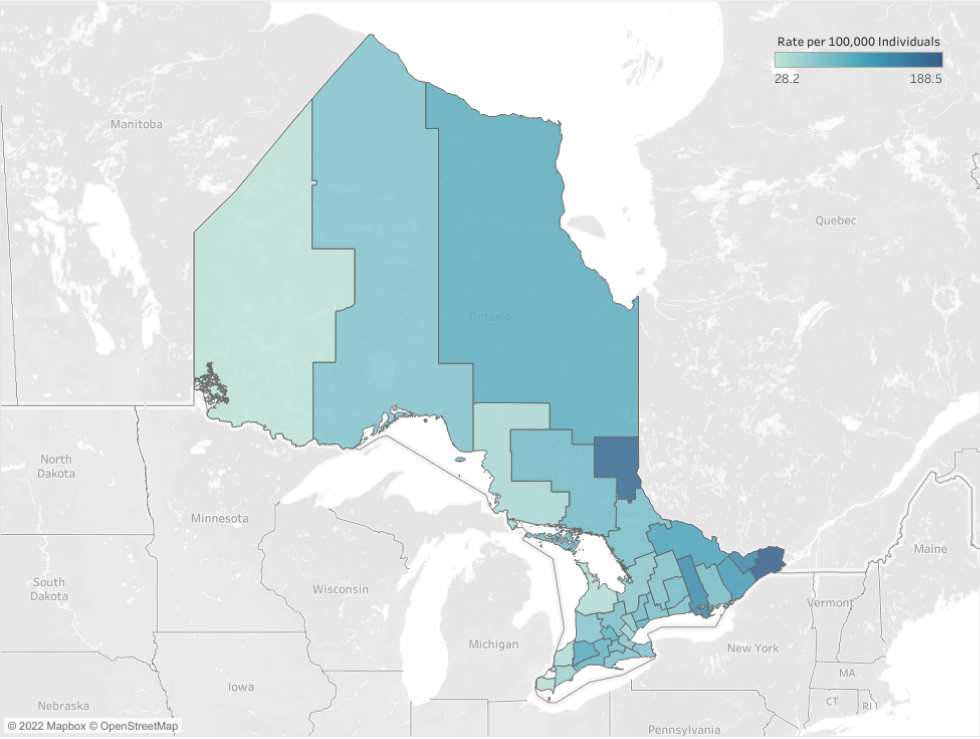
The crude provincial DAA treatment rate was 83.0 per 100,000 ODB-eligible Ontarians (Table 1). Eastern Ontario PHU had the highest HCV-adjusted treatment rate, with a rate of 188.5 per 100,000; before adjustment, this rate was 129.3 per 100,000. In contrast, Northwestern had the lowest HCV-adjusted treatment rate at 28.2 per 100,000. The treatment rate was 144.6 per 100,000 prior to adjustment but lowered after accounting for the high HCV prevalence in this PHU (169.4 per 100,000; Figure 1, Table 1).
| Public health unit | HCV rateTable 1 footnote a | Number treated and DAA treatment rateTable 1 footnote b | HCV-adjusted DAA treatment rateTable 1 footnote c | Distance to prescriber (all visit types) |
Distance to prescriber (in-person visits) |
Distance to prescriber (virtual visits) |
Proportion of virtual visits | |||||||||||
|---|---|---|---|---|---|---|---|---|---|---|---|---|---|---|---|---|---|---|
| Treatment | Median | >50 km | Median | >50 km | Median | >50 km | ||||||||||||
| N | Rate | km | IQR | N | %Table 1 footnote d | km | IQR | N | %Table 1 footnote d | km | IQR | N | %Table 1 footnote d | N | %Table 1 footnote e | |||
| Ontario | 33.1 | 3,937 | 83.0 | N/A | 20 | 5–87 | 1,359 | 34.5% | 13 | 4–49 | 801 | 24.6% | 133 | 69–339 | 558 | 81.9% | 681 | 17.3% |
| Eastern Ontario | 22.7 | 104 | 129.3 | 188.5 | 86 | 76–278 | 87 | 83.7% | 80 | 48–87 | 48 | 73.8% | 93 | 86–401 | 39 | 100% | 39 | 37.5% |
| Timiskaming | 29.6 | 21 | 157.9 | 176.6 | 501 | 209–502 | 21 | 100% | 489 | 209–501 | ≥5 | ≥5 | 501 | 209–502 | 16 | 100% | 16 | 76.2% |
| City of Ottawa | 25.5 | 348 | 110.0 | 142.4 | 13 | 5–120 | 125 | 35.9% | 10 | 4–118 | 89 | 29.2% | 355 | 342–444 | 36 | 83.7% | 43 | 12.4% |
| Perth District | 14.7 | 17 | 61.3 | 137.8 | 46 | 40–54 | ≥5Table 1 footnote f | ≥5Table 1 footnote f | 46 | 40–54 | ≥5 | ≥5 | 0 | 0 | 0 | 0 | 0 | 0.0% |
| Hastings and Prince Edward Counties | 37.8 | 109 | 156.5 | 137 | 59 | 16–167 | 57 | 52.3% | 27 | 13–86 | 33 | 38.8% | 171 | 161–192 | 24 | 100% | 24 | 22.0% |
| Leeds, Grenville and Lanark District | 39.5 | 100 | 142.6 | 119.4 | 75 | 47–300 | 69 | 69% | 56 | 30–83 | 38 | 56.7% | 302 | 280–392 | 31 | 93.9% | 33 | 33.0% |
| Renfrew County and District | 27.3 | 36 | 91.4 | 110.5 | 135 | 97–276 | 36 | 100% | 137 | 121–161 | 21 | 100% | 122 | 73–299 | 15 | 100% | 15 | 41.7% |
| Middlesex-London | 49.4 | 266 | 153.6 | 102.9 | 7 | 4–166 | 78 | 29.3% | 7 | 4–164 | 70 | 27.1% | 166 | 121–338 | 8 | 100% | 8 | 3.0% |
| Porcupine | 44.7 | 39 | 132.0 | 97.7 | 556 | 224–576 | 33 | 84.6% | 10 | 2–224 | ≥5 | ≥5 | 557 | 554–598 | 29 | 100% | 29 | 74.4% |
| City of Toronto | 25.1 | 629 | 72.2 | 95.2 | 7 | 3–12 | 34 | 5.4% | 7 | 4–12 | 33 | 5.9% | 5 | 2–9 | ≥5 | ≥5 | 68 | 10.8% |
| Waterloo | 23.7 | 121 | 68.0 | 94.7 | 18 | 3–82 | 38 | 31.4% | 6 | 3–32 | 19 | 19.8% | 93 | 81–95 | 19 | 76% | 25 | 20.7% |
| Southwestern (Oxford, Elgin and St. Thomas) | 38.4 | 80 | 106.4 | 91.7 | 44 | 31–48 | 19 | 23.8% | 43 | 30–46 | 13 | 17.6% | 140 | 139–140 | 6 | 100% | 6 | 7.5% |
| York Region | 15.6 | 139 | 39.1 | 82.7 | 20 | 11–37 | 21 | 15.1% | 18 | 10–30 | 10 | 8% | 64 | 60–120 | 11 | 78.6% | 14 | 10.1% |
| Peterborough County-City | 55.8 | 82 | 137.4 | 81.4 | 63 | 3–111 | 51 | 62.2% | 21 | 2–99 | 26 | 45.6% | 124 | 110–202 | 25 | 100% | 25 | 30.5% |
| Sudbury and District | 69.3 | 131 | 170.4 | 81.3 | 11 | 5–31 | 27 | 20.6% | 10 | 4–20 | 11 | 9.6% | 339 | 225–350 | 16 | 100% | 16 | 12.2% |
| Kingston, Frontenac and Lennox and Addington | 67.2 | 126 | 162.1 | 79.8 | 34 | 4–75 | 43 | 34.1% | 30 | 4–74 | 38 | 31.4% | ≥5 | ≥5 | ≥5 | ≥5 | ≥5 | ≥5 |
| Brant County | 46.8 | 63 | 111.3 | 78.7 | 4 | 2–41 | 15 | 23.8% | 4 | 2–30 | 8 | 15.4% | 87 | 2–92 | 7 | 63.6% | 11 | 17.5% |
| North Bay Parry Sound District | 60.5 | 74 | 143 | 78.1 | 60 | 6–254 | 40 | 54.1% | 22 | 3–96 | 18 | 35.3% | 274 | 195–296 | 22 | 95.7% | 23 | 31.1% |
| Durham Regional | 24.2 | 122 | 57.0 | 77.8 | 19 | 5–49 | 25 | 20.5% | 15 | 5–39 | 18 | 17.1% | 49 | 42–140 | 7 | 41.2% | 17 | 13.9% |
| Wellington-Dufferin-Guelph | 24.5 | 55 | 56.6 | 76.4 | 24 | 14–64 | 18 | 32.7% | 23 | 8–38 | 11 | 22.9% | 71 | 64–72 | 7 | 100% | 7 | 12.7% |
| Haldimand-Norfolk | 37.8 | 35 | 82.8 | 72.5 | 49 | 40–81 | 16 | 45.7% | 49 | 38–67 | 14 | 45.2% | ≥5 | ≥5 | ≥5 | ≥5 | ≥5 | ≥5 |
| Haliburton, Kawartha, Pine Ridge | 47.7 | 81 | 104.6 | 72.4 | 86 | 46–119 | 59 | 72.8% | 73 | 46–99 | 44 | 67.7% | 126 | 105–181 | 15 | 93.8% | 16 | 19.8% |
| Niagara Regional Area | 51.4 | 206 | 111.8 | 72.0 | 30 | 20–56 | 65 | 31.6% | 28 | 13–32 | 26 | 15.6% | 70 | 57–85 | 39 | 100% | 39 | 18.9% |
| Thunder Bay District | 118.8 | 135 | 250.6 | 69.8 | 10 | 4–911 | 54 | 40% | 6 | 3–11 | 12 | 13% | 924 | 907–926 | 42 | 97.7% | 43 | 31.9% |
| Huron County | 32.5 | 16 | 66.1 | 67.3 | 87 | 67–92 | 14 | 87.5% | 87 | 67–92 | 13 | 86.7% | ≥5 | ≥5 | ≥5 | ≥5 | ≥5 | ≥5 |
| City of Hamilton | 40.1 | 160 | 78.6 | 64.8 | 6 | 3–21 | 25 | 15.6% | 5 | 3–12 | 14 | 9.7% | ≥5 | ≥5 | ≥5 | ≥5 | ≥5 | ≥5 |
| Peel Region | 22.3 | 192 | 42.9 | 63.6 | 18 | 7–33 | 40 | 20.8% | 17 | 7–33 | 37 | 20.6% | 29 | 21–52 | ≥5 | ≥5 | 12 | 6.3% |
| Simcoe Muskoka District | 38.1 | 149 | 73.4 | 63.6 | 85 | 51–126 | 112 | 75.2% | 52 | 22–88 | 43 | 53.8% | 105 | 85–145 | 69 | 100% | 69 | 46.3% |
| Halton Region | 19.2 | 53 | 29.8 | 51.5 | 18 | 8–41 | ≥5 | ≥5 | 18 | 7–30 | ≥5 | ≥5 | 42 | 41–43 | 0 | 0.0% | ≥5 | ≥5 |
| Chatham-Kent | 58.8 | 39 | 90.0 | 50.6 | 91 | 16–107 | 24 | 61.5% | 89 | 16–103 | 23 | 60.5% | ≥5 | ≥5 | ≥5 | ≥5 | ≥5 | ≥5 |
| The District of Algoma | 70.1 | 43 | 87.9 | 41.5 | 5 | 2–128 | 14 | 32.6% | 5 | 2–126 | 12 | 29.3% | ≥5 | ≥5 | ≥5 | ≥5 | ≥5 | ≥5 |
| Lambton | 84.8 | 49 | 95.1 | 37.1 | 4 | 2–88 | 14 | 28.6% | 2 | 1–43 | 8 | 18.6% | 254 | 172–254 | ≥5 | ≥5 | 6 | 12.2% |
| Grey Bruce | 24 | 17 | 25.4 | 35 | 128 | 116–160 | 16 | 94.1% | 128 | 115–143 | 13 | 92.9% | ≥5 | ≥5 | ≥5 | ≥5 | ≥5 | ≥5 |
| Windsor-Essex County | 40.1 | 66 | 40.8 | 33.7 | 114 | 6–332 | 34 | 51.5% | 18 | 4–160 | 15 | 32.6% | 332 | 323–333 | 19 | 95% | 20 | 30.3% |
| Northwestern | 169.4 | 34 | 144.6 | 28.2 | 1,195 | 305–1,291 | 28 | 82.4% | 178 | 7–308 | 7 | 53.8% | 1,212 | 1,182–1,310 | 21 | 100% | 21 | 61.8% |
Figure 1: Map of Ontario by public health unit, showing hepatitis C virus-adjusted treatment rates of direct-acting antiviral usersFigure 1 footnote a
Text description: Figure 1
| Public health unit | HCV-adjusted DAA treatment rateTable 1 footnote a |
|---|---|
| Eastern Ontario | 188.5 |
| Timiskaming | 176.6 |
| City of Ottawa | 142.4 |
| Perth District | 137.8 |
| Hastings and Prince Edward Counties | 137 |
| Leeds, Grenville and Lanark District | 119.4 |
| Renfrew County and District | 110.5 |
| Middlesex-London | 102.9 |
| Porcupine | 97.7 |
| City of Toronto | 95.2 |
| Waterloo | 94.7 |
| Southwestern (Oxford, Elgin and St. Thomas) | 91.7 |
| York Region | 82.7 |
| Peterborough County-City | 81.4 |
| Sudbury and District | 81.3 |
| Kingston, Frontenac and Lennox and Addington | 79.8 |
| Brant County | 78.7 |
| North Bay Parry Sound District | 78.1 |
| Durham Regional | 77.8 |
| Wellington-Dufferin-Guelph | 76.4 |
| Haldimand-Norfolk | 72.5 |
| Haliburton, Kawartha, Pine Ridge | 72.4 |
| Niagara Regional Area | 72.0 |
| Thunder Bay District | 69.8 |
| Huron County | 67.3 |
| City of Hamilton | 64.8 |
| Peel Region | 63.6 |
| Simcoe Muskoka District | 63.6 |
| Halton Region | 51.5 |
| Chatham-Kent | 50.6 |
| The District of Algoma | 41.5 |
| Lambton | 37.1 |
| Grey Bruce | 35 |
| Windsor-Essex County | 33.7 |
| Northwestern | 28.2 |
Distance to prescriber
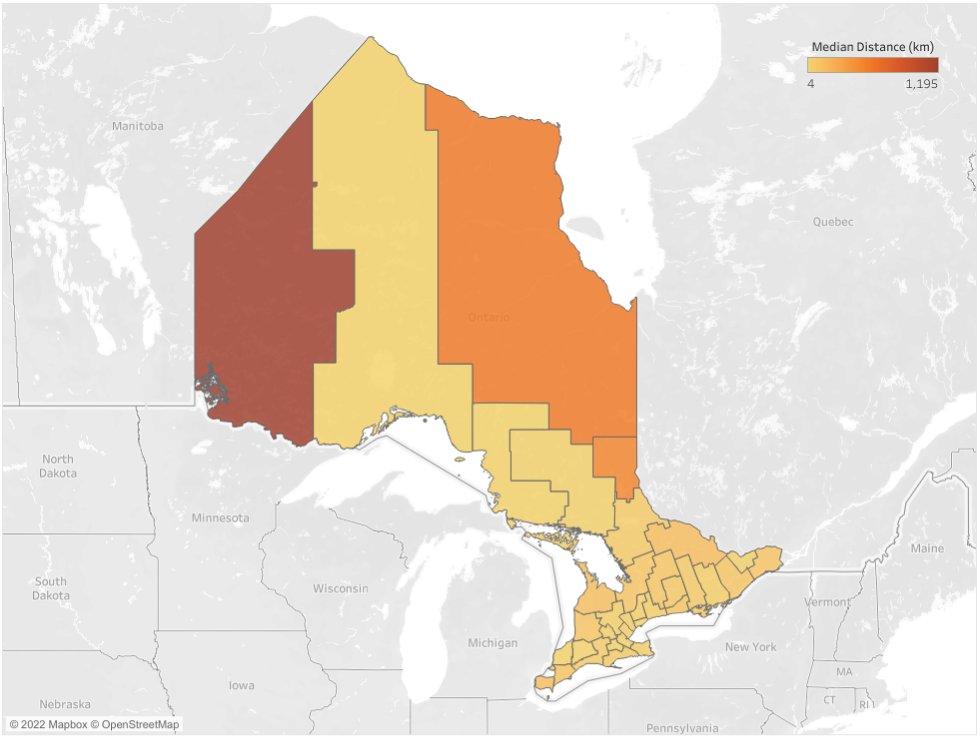
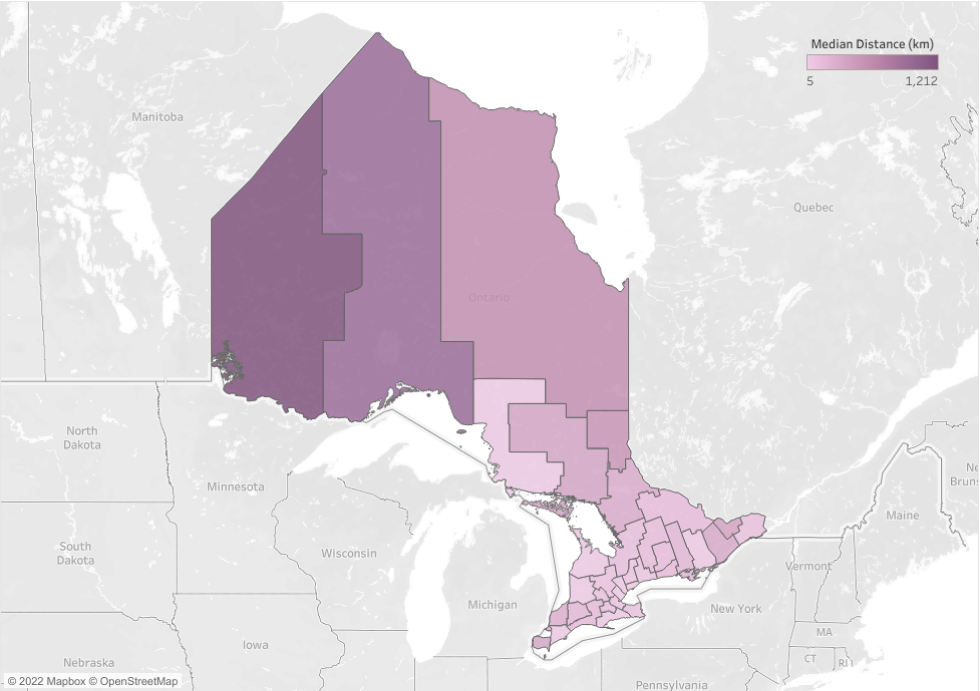
The median distance to prescriber in Ontario (all visits) was 20 km (interquartile range [IQR] 5–87 km) (Table 1). In our analysis of all visit types, patients in rural PHUs had the longest distances, with Northwestern (median of 1,195 km [IQR 305–1,291 km]), followed by Porcupine (median 556 km (IQR 224–576 km]) and Timiskaming (median 501 km [IQR 209–502 km]) (Figure 2). These three PHUs also had the highest proportions of patients receiving virtual care (61.8%, 74.4%, and 76.2%, respectively) yet had fewer than 100 patients in total (Table 1). Nonetheless, Timiskaming and Porcupine had high HCV-adjusted treatment rates (176.6 and 97.7 per 100,000, respectively), while Northwestern had the lowest rate. In contrast, those receiving DAAs in urban centres like Toronto and Ottawa generally had short median distances to their prescriber (Toronto: 7 km; Ottawa: 10 km) and smaller proportions of virtual visits (Toronto, 10.8%; Ottawa, 12.4%) (Table 1).
Figure 2: Map of Ontario by public health unit, showing median distance to prescriber (all visit types)figure 2 footnote a
Text description: Figure 2
| Public health unit | Median distance to prescriber, all visit types (km) |
|---|---|
| Eastern Ontario | 86 |
| Timiskaming | 501 |
| City of Ottawa | 13 |
| Perth District | 46 |
| Hastings and Prince Edward Counties | 59 |
| Leeds, Grenville and Lanark District | 75 |
| Renfrew County and District | 135 |
| Middlesex-London | 7 |
| Porcupine | 556 |
| City of Toronto | 7 |
| Waterloo | 18 |
| Southwestern (Oxford, Elgin and St. Thomas) | 44 |
| York Region | 20 |
| Peterborough County-City | 63 |
| Sudbury and District | 11 |
| Kingston, Frontenac and Lennox and Addington | 34 |
| Brant County | 4 |
| North Bay Parry Sound District | 60 |
| Durham Regional | 19 |
| Wellington-Dufferin-Guelph | 24 |
| Haldimand-Norfolk | 49 |
| Haliburton, Kawartha, Pine Ridge | 86 |
| Niagara Regional Area | 30 |
| Thunder Bay District | 10 |
| Huron County | 87 |
| City of Hamilton | 6 |
| Peel Region | 18 |
| Simcoe Muskoka District | 85 |
| Halton Region | 18 |
| Chatham-Kent | 91 |
| The District of Algoma | 5 |
| Lambton | 4 |
| Grey Bruce | 128 |
| Windsor-Essex County | 114 |
| Northwestern | 1,195 |
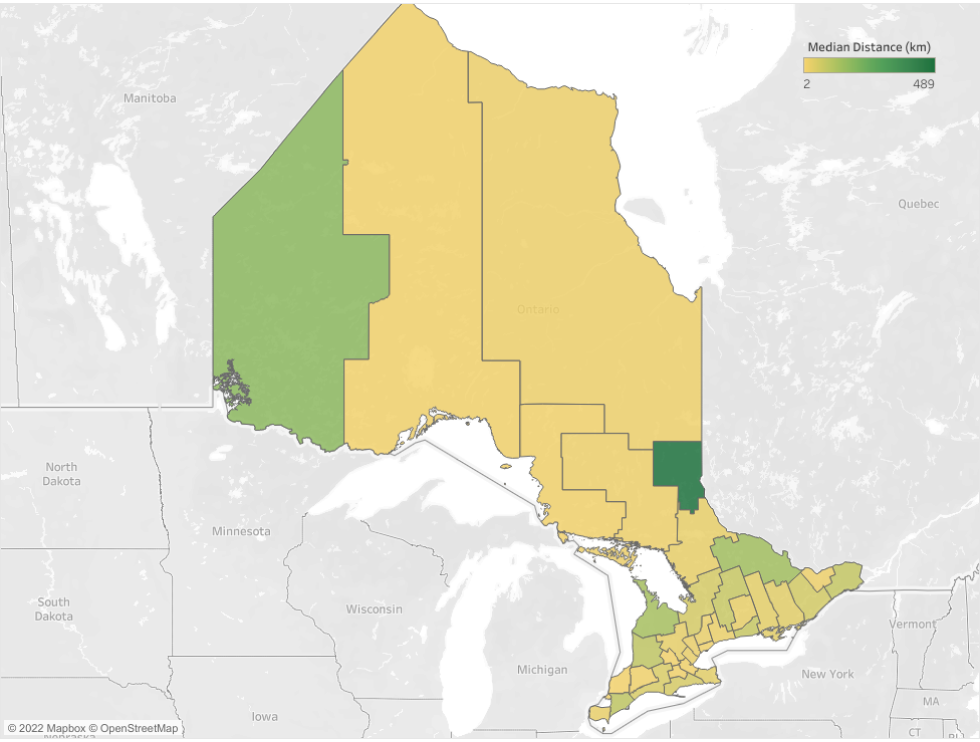
In our secondary analysis, distances between patients and their prescriber for in-person visits (median 13 km, IQR 4–49 km) were shorter than for virtual (median 133 km, IQR 69–339 km). Northern and rural PHUs (e.g. Northwestern, Thunder Bay) had the largest distances to prescribers for virtual visits. Within PHUs, there were large differences in the median distances to prescriber based on visit type: in the Northwestern PHU, in-person median distance was 178 km whereas virtual distance was 1,212 km. We also observed large IQR values within geographically large PHUs. Furthermore, there was considerable variation between PHUs in distance travelled for in-person visits, ranging from 178 km (IQR 7–308 km, 61.8% virtual) for Northwestern PHU to 6 km (median 6 km, IQR 3–11 km, 31.9% virtual) for Thunder Bay (Table 1, Figure 3 and Figure 4). Interestingly, Hamilton and Peel had small distances to in-person visits yet had relatively low treatment rates. This was in contrast to Ottawa, which also had a small distance to in-person visits yet a relatively high treatment rate.
Figure 3: Map of Ontario by public health unit, showing median distance to prescriber (in-person visits)Footnote a
Text description: Figure 3
| Public health unit | Median distance to prescriber, in-person visits (km) |
|---|---|
| Eastern Ontario | 80 |
| Timiskaming | 489 |
| City of Ottawa | 10 |
| Perth District | 46 |
| Hastings and Prince Edward Counties | 27 |
| Leeds, Grenville and Lanark District | 56 |
| Renfrew County and District | 137 |
| Middlesex-London | 7 |
| Porcupine | 10 |
| City of Toronto | 7 |
| Waterloo | 6 |
| Southwestern (Oxford, Elgin and St. Thomas) | 43 |
| York Region | 18 |
| Peterborough County-City | 21 |
| Sudbury and District | 10 |
| Kingston, Frontenac and Lennox and Addington | 30 |
| Brant County | 4 |
| North Bay Parry Sound District | 22 |
| Durham Regional | 15 |
| Wellington-Dufferin-Guelph | 23 |
| Haldimand-Norfolk | 49 |
| Haliburton, Kawartha, Pine Ridge | 73 |
| Niagara Regional Area | 28 |
| Thunder Bay District | 6 |
| Huron County | 87 |
| City of Hamilton | 5 |
| Peel Region | 17 |
| Simcoe Muskoka District | 52 |
| Halton Region | 18 |
| Chatham-Kent | 89 |
| The District of Algoma | 5 |
| Lambton | 2 |
| Grey Bruce | 128 |
| Windsor-Essex County | 18 |
| Northwestern | 178 |
Figure 4: Map of Ontario by public health unit, median distance to prescriber (virtual visits)Footnote a
Text description: Figure 4
| Public health unit | Median distance to prescriber, virtual visits (km) |
|---|---|
| Eastern Ontario | 93 |
| Timiskaming | 501 |
| City of Ottawa | 355 |
| Perth District | 0 |
| Hastings and Prince Edward Counties | 171 |
| Leeds, Grenville and Lanark District | 302 |
| Renfrew County and District | 122 |
| Middlesex-London | 166 |
| Porcupine | 557 |
| City of Toronto | 5 |
| Waterloo | 93 |
| Southwestern (Oxford, Elgin and St. Thomas) | 140 |
| York Region | 64 |
| Peterborough County-City | 124 |
| Sudbury and District | 339 |
| Kingston, Frontenac and Lennox and Addington | ≥5 |
| Brant County | 87 |
| North Bay Parry Sound District | 274 |
| Durham Regional | 49 |
| Wellington-Dufferin-Guelph | 71 |
| Haldimand-Norfolk | ≥5 |
| Haliburton, Kawartha, Pine Ridge | 126 |
| Niagara Regional Area | 70 |
| Thunder Bay District | 924 |
| Huron County | ≥5 |
| City of Hamilton | ≥5 |
| Peel Region | 29 |
| Simcoe Muskoka District | 105 |
| Halton Region | 42 |
| Chatham-Kent | ≥5 |
| The District of Algoma | ≥5 |
| Lambton | 254 |
| Grey Bruce | ≥5 |
| Windsor-Essex County | 332 |
| Northwestern | 1,212 |
Discussion
Our study illustrates almost a seven-fold difference in HCV-adjusted DAA treatment rates across Ontario. Patients in rural PHUs generally lived further from their prescribers and had high proportions of virtual visits yet had few patients treated overall. The HCV-adjusted treatment rates were the lowest among PHUs in some rural regions, suggesting that expanded access to virtual care in rural PHUs may improve treatment rates.
Regions with large in-person distances to prescriber had greater utilization of virtual care than PHUs with shorter distances. Most visits in Timiskaming and Porcupine were virtual, with these regions having relatively high HCV-adjusted DAA treatment rates. Increasing virtual care may assist in improving treatment rates in Northwestern PHU. In this rural PHU, almost 40% of visits were in-person with a median distance of 178 km; however, Northwestern's lower HCV-adjusted DAA treatment rate may be due, in part, to a high HCV infection rate. In contrast, in urban PHUs, like Toronto and Ottawa, patients travelled shorter distances to prescribers and had fewer virtual visits while still maintaining high treatment rates. These high treatment rates were likely due to greater availability of providers and services per capita in urban PHUs.
Differences in treatment rates may be attributed to the fact that in 2019, ODB coverage criteria required a specialist physician to prescribe the medication and two laboratory tests at least six months apartFootnote 8. Both specialist physicians and laboratory testing may be particularly difficult to access in rural communities. In general, rural and northern communities have been found to have lower access and greater in-person distances to healthcare providersFootnote 18. Our results are consistent with other studies examining the relationship between rurality and DAA dispensingFootnote 31. Generally, there is variation in DAA dispensing in rural settings based on region, rather than on urban/rural status alone, as rural communities have distinct characteristics. Solutions to increase use of services can include working with PHUs and provincial specialty networks to develop specific plans that would benefit each PHU (e.g. harm reduction).
Northwestern PHU has the highest HCV infection rate, which doubled from 2009 to 2013. This was driven by increased testing among First Nations communities; a priority population identified by the Blueprint to Inform Hepatitis C Elimination Efforts in Canada Footnote 1Footnote 32. Despite this high incidence, Northwestern PHU had the lowest adjusted treatment rate across Ontario. We acknowledge that many in Northwestern PHU access healthcare in Manitoba or do not rely on the ODB for drug coverage as they can access DAAs through the Non-Insured Health Benefits (NIHB), First Nations and Inuit Health Branch. Yet for those eligible, the ODB is the first payer for medicationsFootnote 6Footnote 33. Telehealth can increase access to DAAs and assist in overcoming distance.
As local interventions have an impact on access to diagnosis and therapy, these may play a role in closing this treatment gap in Ontario. A diagnosis is the first step to receiving treatment, but many of those living with HCV infection can be asymptomatic for yearsFootnote 1. Access to testing for HCV must especially be increased in regions with high HCV rates. Additionally, family physicians and nurse practitioners are more accessible in the community than specialist physiciansFootnote 34. Allowing non-specialists to prescribe DAAs, as was implemented in Ontario in March 2020, may enable more patients in underserved communities to obtain prescriptionsFootnote 1Footnote 18Footnote 35. Finally, increased utilization of telemedicine may assist in reaching patients who face traditional barriers to treatment, such as distance to healthcare provider. Regions with high utilization of virtual care may have reduced the need for travel long distances to an appointment, indicating the impact virtual care can have. While virtual care can be beneficial, access and comfort using devices and internet required to facilitate virtual care can be challenging in rural regionsFootnote 36. Thus, movement towards increasing virtual care should consider reducing the barriers to accessing these services by increasing infrastructure that can support internet and phone access.
Limitations
Our results have several limitations that warrant discussion. We calculated HCV rates in Ontario using an average annual incidence from 2014 to 2018. Thus, we do not know the true chronic HCV prevalence, which would provide an estimate of individuals who were untreated. Although we expect that the average incidence closely approximates prevalence of HCV Footnote 27Footnote 28Footnote 37, future studies are needed to determine the true prevalence of HCV by PHU. This calculation serves as an estimator of HCV infection rates, allowing us to control for the rates across PHUs. Second, we calculated distances based on each prescriber's primary office location. As a result, we were not able to account for prescribers who had multiple practices or who travelled to patients. We estimate that these would be a small proportion of visits. Lastly, we utilized the ODB database to identify DAA prescriptions; thus, prescriptions accessed through the NIHB or were paid for by private insurance or out-of-pocket were not included. Nonetheless, approximately 90% of all DAA prescriptions in Ontario are reimbursed by the ODB and would have been captured in our dataFootnote 6. Lastly, we report rates of prescribing per PHU, and no tests of association between distance and treatment rates were done.
Conclusion
Ontario is a Canadian province with a wide range of disparities in distance to prescriber and treatment rates. This research provides observations relevant for other regions that also struggle with these inequalities. Interventions to increase DAA dispensing include diversifying the pool of prescribers, working with communities to address their needs and increasing virtual care and the infrastructure to facilitate its use. Future research could examine Ontario's HCV prevalence and explore how access to DAAs has shifted post-coronavirus disease 2019, especially with the increased use of virtual care.
Authors' statement
All authors were involved in the design, interpretation of results, writing, or revision of the manuscript (NK, MT, AS, DM, VPP, ACM, TG, MM). DM is the guarantor of the data and analysis.
The content and view expressed in this article are those of the authors and do not necessarily reflect those of the Government of Canada.
Competing interests
No authors have any competing interests to declare.
Acknowledgements
This study was supported by ICES, which is funded by an annual grant from the Ontario Ministry of Health (MOH) and funding from the Canadian Institute for Health Research (CIHR). The opinions, results and conclusions reported in this paper are those of the authors and are independent from the funding sources. No endorsement by ICES or the Ontario MOH is intended or should be inferred. These datasets were linked using unique encoded identifiers and analyzed at ICES. We also want to thank IQVIA Solutions Canada Inc. for use of their Drug Information File.
Funding
This project was supported by funds from the Ontario Drug Policy Research Network and Canadian Institute for Health Research (CIHR).
Annex
Equations used to calculate hepatitis C virus (HCV) and direct-acting antivirals (DAA) treatment rates
1) Public Health Units (PHU) HCV infection rate (per 100,000) = [(HCV rate (2014) + HCV rate (2015) + HCV rate (2016) + HCV rate (2017) + HCV rate (2018))/5] * 100,000
2) Crude DAA Treatment rate (per 100,000) = (total treated per PHU/total eligible for Ontario Drug benefit (ODB)) * 100,000
3) HCV – adjusted DAA treatment rate (per 100,000) = (crude DAA treatment rate/adjustment factor) * 100,000
- Provincial HCV rate (per 100,000) = (total HCV cases in Ontario/total eligible for ODB in Ontario) * 100,000
- Adjustment factor = PHU HCV rate/provincial HCV rate
Relationship between incidence and prevalence:
Prevalence = incidence * duration of disease
Figure A1: Map of public health units in Ontario
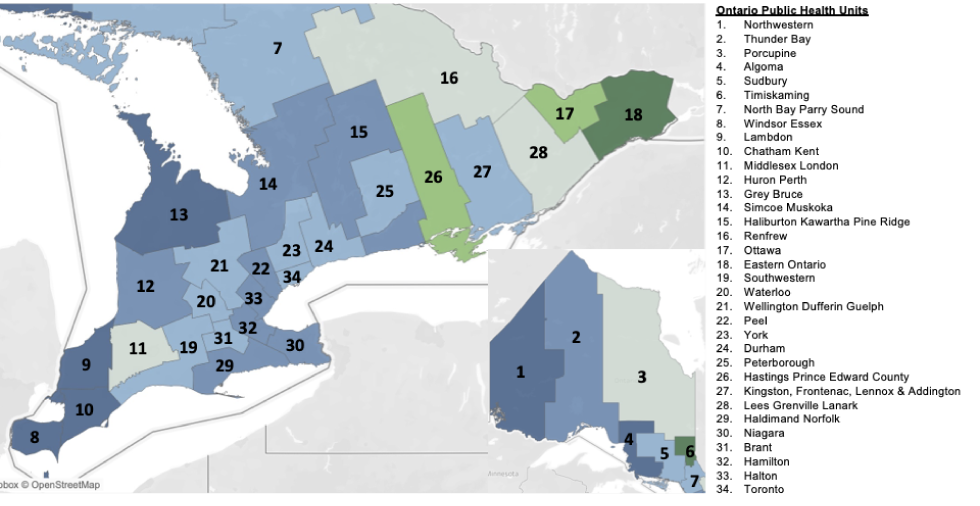
Text description: Figure A1
This figure is a map showing the locations of each Public Health Unit (PHU) in the province of Ontario. PHUs are labelled from 1–34 and include: 1) Northwestern, 2) Thunder Bay, 3) Porcupine, 4) Algoma, 5) Sudbury, 6) Timiskaming, 7) North Bay Parry Sound, 8) Windsor Essex, 9) Lambdon, 10) Chatham Kent, 11) Middlesex London, 12) Huron Perth, 13) Grey Bruce, 14) Simcoe Muskoka, 15) Haliburton Kawartha Pine Ridge, 16) Renfrew, 17) Ottawa, 18) Eastern Ontario, 19) Southwestern, 20) Waterloo, 21) Wellington Dufferin Guelph, 22) Peel, 23) York, 24) Durham, 25) Peterborough, 26) Hastings Prince Edward County, 27) Kingston, Frontenac, Lennox & Addington, 28) Lees Grenville Lanark, 29) Haldimand Norfolk, 30) Niagara, 31) Brant, 32) Hamilton, 33) Halton, and 34) Toronto.
