
A retrospective analysis of data to understand the language profile of COVID-19 cases

 Download this article as a PDF (226 KB)
Published by: The Public Health Agency of Canada
Issue: CCDR Volume 50-10, October 2024: COVID-19 after the pandemic
Date published: October 2024
ISSN: 1481-8531
Submit a manuscript
About CCDR
Browse
Volume 50-10, October 2024: COVID-19 after the pandemic
Epidemiologic Study
Opportunities and lessons learned from a retrospective analysis of administrative billing data to understand the language profile of high-risk close contacts of COVID-19 cases in Ontario
Andrea Chambers1, Mark A Cachia2, Jessica P Hopkins1,2
Affiliations
1 Public Health Ontario, Toronto, ON
2 Department of Health Research Methods, Evidence, and Impact, McMaster University, Hamilton, ON
Correspondence
Suggested citation
Chambers A, Cachia MA, Hopkins JP. Opportunities and lessons learned from a retrospective analysis of administrative billing data to understand the language profile of high-risk close contacts of COVID-19 cases in Ontario. Can Commun Dis Rep 2024;50(10):375–80. https://doi.org/10.14745/ccdr.v50i10a06
Keywords: contact tracing, COVID-19, SARS-CoV-2, language concordance, pandemic
Abstract
Background: During a public health emergency, it is vital to have access to data sources that can identify communities disproportionately affected and to ensure public health communications are meeting the needs of diverse populations.
Objective: To explore how administrative billing data for language interpretation services could be used as an additional source of information to understand the language profile of high-risk close contacts of COVID-19 cases.
Methods: A retrospective descriptive analysis was conducted using administrative billing data from Public Health Ontario's Contact Tracing Initiative from May 2020 to February 2022. Data from the Contact Tracing Initiative were utilized to identify drivers that could have influenced patterns in language interpretation requests. Trends were compared with community language profiles using 2021 Canadian Census data.
Results: Interpreters responded to 2,604 requests across 38,518 interpretation minutes and provided information in 50 different languages. The top five requested languages were French, Arabic, Spanish, Punjabi and Mandarin. Five distinct periods were identified of different language predominance including Spanish in spring/summer 2020, French in summer/fall 2020 and Arabic in spring 2021. Overall, these trends aligned with the language profile of health units contributing most submissions.
Conclusion: Public health agencies could benefit from using existing secondary data sources to understand the language interpretation needs of their communities. This study also demonstrated how existing data sources could be used to help assess how communities are being disproportionately affected by public health emergencies and how this might change over time.
Introduction
The use of case and contact management is a foundational public health approach to control the spread of infectious diseases. Conducting case and contact management was an important priority for many jurisdictions during the early phases of the COVID-19 pandemic Footnote 1. Forward contact tracing involves cases identifying people (“contacts”) who may have been exposed to the SARS-CoV-2 during their period of communicability. Public health agencies then communicate with high-risk contacts to advise them of the exposure and provide information on testing, isolation requirements and enabling supports. For the delivery of case and contact management to be effective and equitable, information and support needs to be delivered in a community's preferred language Footnote 2Footnote 3Footnote 4.
Socioeconomic data collected early during the COVID-19 pandemic in Ontario helped describe how some communities were disproportionately impacted and early results emphasized the importance of looking at language ability Footnote 5Footnote 6. In Ontario, approximately 16% of the population predominantly speaks a non-official language at home Footnote 7. An analysis of patterns of testing and test results early during the pandemic found that lack of English or French language ability was associated with lower testing but higher percent positivity among recent adult immigrants and refugees in Ontario Footnote 6.
Collection of individual-level socioeconomic data from COVID-19 cases in Ontario was not extended to collection of information from high-risk close contacts of COVID-19 cases. We see this as a gap as the disproportionate impacts of the pandemic extend to other outcomes and experiences, including the mental health and financial impacts of multiple and prolonged periods of isolation associated with being identified as a high-risk close contact Footnote 8. Moreover, primary data collection efforts were time-intensive and several factors impacted data completeness, accuracy and sustainability Footnote 9.
Given the gaps in understanding how language interpretation services have been utilized among high-risk contacts during the COVID-19 pandemic, this study aimed to 1) outline the steps used to leverage secondary data sources to understand the language profile of high-risk close contacts and 2) describe how this type of analysis can help investigate disproportionate impacts of the COVID-19 pandemic.
Methods
Setting
This study leveraged data from Public Health Ontario's COVID-19 Contact Tracing Initiative (CTI). Between April 2020 and February 2022, Ontario's 34 local public health units (PHUs) could use the CTI to help manage the volume of work associated with contact notification.
Provincial and federal government agencies provided support for initial and follow-up phone calls to high-risk close contacts of confirmed or probable cases of COVID-19 Footnote 10. If a contact required interpretation services or requested if services were available, the interviewer would dial the interpretation service provider to provide simultaneous interpretation in the contact's preferred language. How this program was developed and used by local PHUs in Ontario has been described in more detail in a separate publication Footnote 10.
Below, we have outlined the four-step process used to conduct a descriptive retrospective analysis of secondary data sources and a visual analysis of trends to describe the language profile of high-risk contacts.
Step 1: Analyze language interpretation services data
We obtained administrative billing data from the interpretation services vendor from May 4, 2020 (first billing date), to February 25, 2022 (last day of operations and possible billing date). The billing data included a line listing reflecting interpretation requests, the language requested and the call duration with no missing data across the variables of interest. We computed the frequency of encounters with language interpretation services, the cumulative total interpretation time in minutes and the median interpretation time and interquartile range (IQR) for each language and overall. A visual analysis of time trends was used to identify shifts in language predominance.
Step 2: Identify drivers that could be influencing patterns in language interpretation requests
Data from the CTI were utilized to examine trends over time in the volume of high-risk contacts, independent of translation requests, submitted to the program. We described changes over time in which health units were submitting the majority of contacts to the CTI.
Step 3: Compare trends with region-specific census data
For comparison purposes, data from the 2021 Canadian Census were extracted to summarize information about the primary languages spoken most often at home for Ontario and regions supported by Ontario's 34 PHUs Footnote 11. Specifically, we focused on the number of single responses (i.e., the number of people who gave only one language) for the language spoken most often at home.
Step 4: Identify patterns and discrepancies
After completing steps 1 to 3, comparisons were made across data sources. Two primary questions helped identify patterns:
- Do the top languages requested for interpretation align with the language profiles (according to the 2021 Census) for regions contributing the most submissions to the program?
- Do changes in the top languages requested over time align with changes in which local PHUs were submitting a high volume of contacts?
Results
There were 972,625 calls to high-risk contacts over 21 months (May 14, 2020, to February 7, 2022) with fewer than 1% of calls requiring language interpretation support. Interpreters responded to 2,604 requests, totaling 38,518 interpretation minutes (Table 1). Overall, there were 50 different languages requested (Table 1). For the entire observation period, the top five languages were French, Arabic, Spanish, Punjabi and Mandarin, accounting for 69.2% of all interpretation minutes. Among the top five languages requested, median interpretation time varied from 7.0 minutes (French) to 13.5 minutes (Arabic), with IQRs ranging from a low of 4.0 minutes (French) to a high of 25.0 minutes (Arabic).
| Language | Number of encounters | Cumulative minutes | Median (IQR) |
|---|---|---|---|
| Akan | 2 | 15 | 7.5 (6.8–8.3) |
| Albanian | 14 | 222 | 8.0 (4.3–16.8) |
| Amharic | 3 | 43 | 16.0 (9.5–20.0) |
| Arabic | 370 | 6,642 | 13.5 (7.0–25.0) |
| Bengali | 3 | 49 | 20.0 (10.5–24.0) |
| Cantonese | 73 | 1,166 | 13.0 (5.0–23.0) |
| Croatian | 4 | 78 | 22.0 (12.3–29.3) |
| Czech | 2 | 43 | 21.5 (20.8–22.3) |
| Dari | 11 | 213 | 19.0 (11.0–23.0) |
| Estonian | 1 | 5 | N/A |
| Farsi | 41 | 528 | 8.0 (5.0–17.0) |
| French | 803 | 9,203 | 7.0 (4.0–16.0) |
| German | 30 | 175 | 6.0 (4.0–7.8) |
| Greek | 4 | 80 | 20.5 (9.3–31.3) |
| Gujarati | 2 | 8 | N/A |
| Hindi | 53 | 768 | 10.0 (4.0–20.0) |
| Hungarian | 9 | 132 | 7.0 (5.0–15.0) |
| Indonesian | 2 | 54 | 27.0 (22.5–31.5) |
| Italian | 27 | 322 | 10.0 (6.0–15.5) |
| Japanese | 3 | 21 | 5.0 (5.0–8.0) |
| Karen | 2 | 53 | 26.5 (19.3–33.8) |
| Khmer | 1 | 18 | N/A |
| Korean | 24 | 456 | 15.5 (6.3–31.3) |
| Laotian | 2 | 13 | 6.5 (4.8–8.3) |
| Mandarin | 133 | 2,146 | 9.0 (5.0–20.0) |
| Nepali | 5 | 90 | 18.0 (15.0–21.0) |
| Pashto | 1 | 11 | N/A |
| Polish | 25 | 497 | 20.0 (10.0–24.0) |
| Portuguese | 51 | 968 | 16.0 (7.5–25.5) |
| Punjabi | 221 | 3,657 | 10.0 (5.0–22.0) |
| Rohingya | 3 | 15 | 2 (1.5–7.0) |
| Romanian | 1 | 69 | N/A |
| Russian | 10 | 167 | 14 (5.0–19.5) |
| Serbian | 12 | 221 | 15 (11.3–25.0) |
| Shanghainese | 1 | 10 | N/A |
| Somali | 27 | 379 | 9.0 (5.0–22.0) |
| Sorani | 3 | 14 | 5 (4.0–5.5) |
| Spanish | 316 | 5,009 | 13 (5.0–23.0) |
| Sudanese Arabic | 2 | 53 | 26.5 (18.3–34.8) |
| Swahili | 5 | 35 | 4.0 (4.0–12.0) |
| Tagalog | 11 | 165 | 6.0 (5.0–24.0) |
| Taiwanese | 1 | 5 | N/A |
| Tamil | 62 | 915 | 9.0 (5.0–23.0) |
| Telugu | 2 | 9 | 4.5 (4.3–4.8) |
| Thai | 16 | 409 | 17.0 (13.8–24.5) |
| Tigrigna/Tigrinya | 42 | 810 | 12.5 (7.0–25.8) |
| Turkish | 14 | 168 | 12.5 (5.3–14.8) |
| Ukrainian | 10 | 163 | 16.0 (11.8–18.3) |
| Urdu | 38 | 434 | 7.0 (4.0–14.8) |
| Vietnamese | 106 | 1792 | 12.5 (4.0–23.0) |
| Total | 2,604 | 38,518 | 10.0 (5.0–20.0) |
| Abbreviations: IQR, interquartile range; N/A, not applicable |
|||
We noted that overall time trends for language interpretation minutes aligned with trends in the volume of contacts submitted to the CTI, with some exceptions (Figure 1). For example, there were periods where the number of interpretation minutes was high relative to contacts submitted, including the period from January to July 2021.
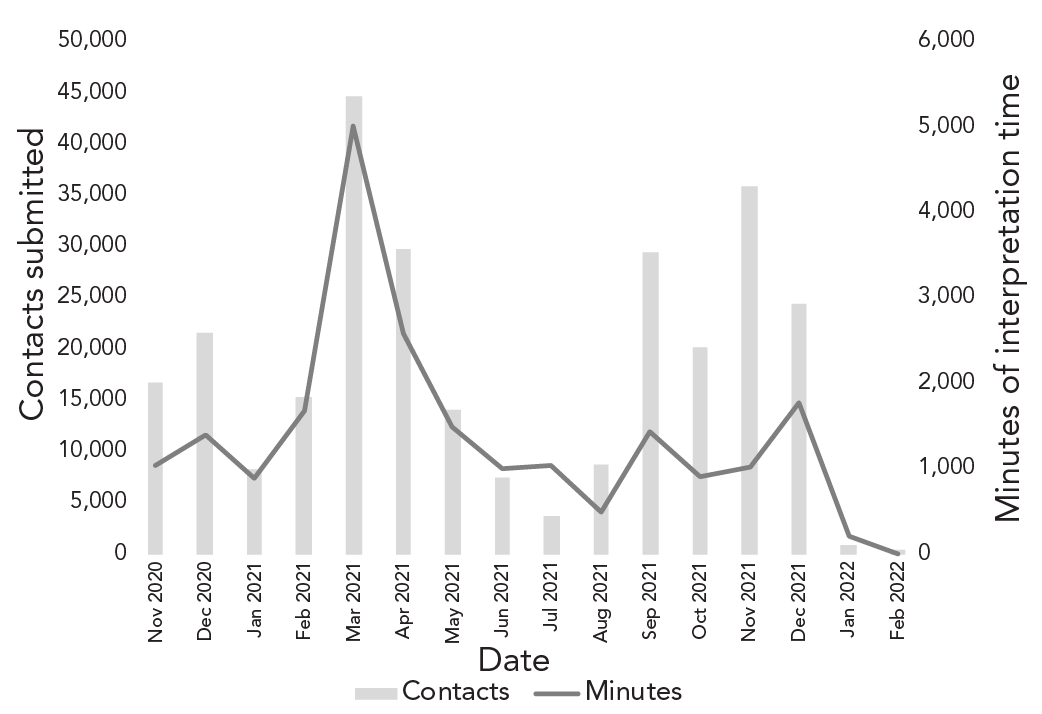
Figure 1: Descriptive text
The graph shows the number of high-risk close contacts submitted to Public Health Ontario's Contact Tracing Initiative, along with the number of minutes of interpretation services documented for the program, from November 2020 to February 2022. The number of contacts submitted to the program started at 16,722 in November 2020 and peaked at 44,465 in March 2021. There were 1,042 minutes of interpretation services recorded in November 2020, with a peak in March 2021 at 5,022. Overall, fluctuations in the volume of interpretation minutes align with changes in the number of contacts submitted to the program. Between January 2021 and July 2021, the volume of language interpretation requests (in minutes) was high relative to the volume of contacts submitted to the program.
We examined time trends to assess how the top requested languages for interpretation services changed over the observation period. Four periods of interest were identified to investigate further.
Observation 1: In September 2020, there was a rise in French language interpretation requests (Figure 2). The following local PHUs submitted approximately 94% of the contacts to the CTI during this month (number of contacts): Ottawa (n=1,204), Halton (n=710), Durham (n=666), York (n=509) and Niagara (n=346) (Table 1) (supplemental data available from the corresponding author). According to the 2021 Canadian Census, French was the most common non-English language spoken most often at home in Ottawa, accounting for approximately 40% of all non-English languages reported (supplemental data available from the corresponding author).
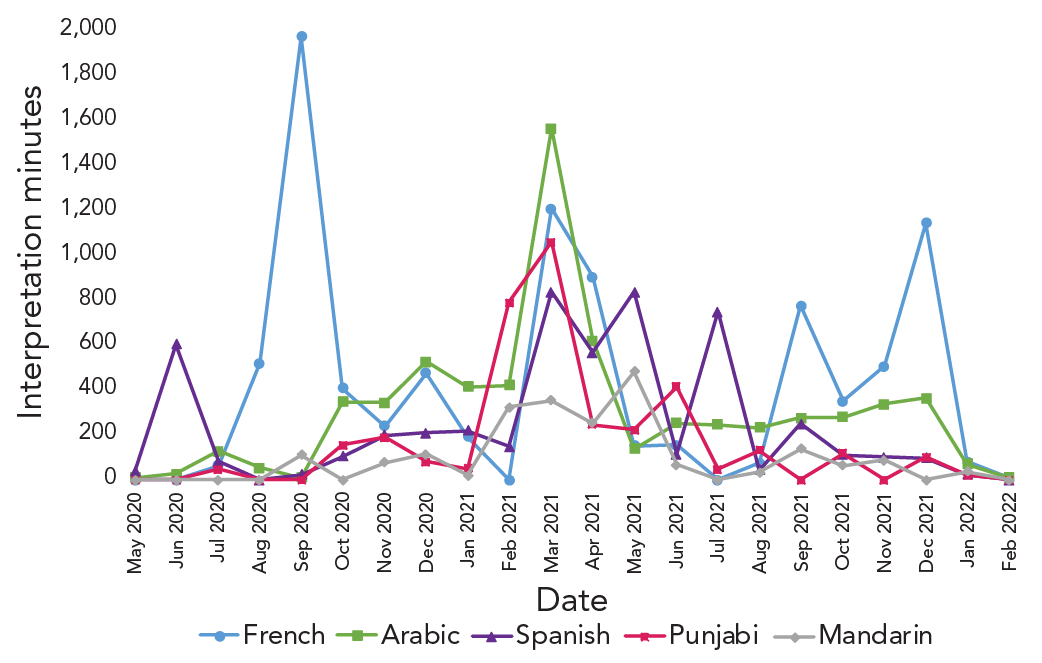
Figure 2: Descriptive text
The graph shows the number of interpretation minutes for the top five requested languages, including French, Arabic, Spanish, Punjabi and Mandarin. The number of interpretation minutes for French peaked in September 2020 at 2,111. The number of interpretation minutes for Mandarin peaked in May 2021 at 480. The number of interpretation minutes for the other languages peaked in March 2021, including 1,565 minutes for Arabic, 836 for Spanish and 1,059 for Punjabi. The graph also shows changes over time in what language was predominant in language interpretation requests, with French the most common between July 2020 and October 2020 and between September 2021 and January 2022. Arabic became the most requested language in March 2021. Spanish was the most common language requested in June 2020 and between May 2021 and July 2021.
Observation 2: Arabic was the most common language requested for interpretation between November 2020 and March 2021 (Figure 2). The following PHUs submitted approximately 60% of the contacts in March 2021 (number of contacts): Durham (n=6,325), Peel (n=5,804), Sudbury & Districts (n=4,890), Halton (n=4,059), Hamilton (n=2,657) and Niagara (n=2,452) (supplemental data available from the corresponding author). Peel had the highest percentage of individuals reporting a non-official language spoken at home (33%) according to the 2021 Census (supplemental data available from the corresponding author). Punjabi was the most common language spoken at home in this region (32%), with Arabic coming in third (5.3%) (supplemental data available from the corresponding author).
Observation 3: In the early spring of 2020 (May 2020) and between March and July 2021, there was a rise in language interpretation requests for Spanish (Figure 2), with this language becoming predominant in the spring-summer period when Waterloo, Peel, Halton and Grey Bruce PHUs continued to submit high volumes of contacts (supplemental data available from the corresponding author). Halton and Waterloo regions also submitted high volumes of contacts in May 2020 (supplemental data available from the corresponding author). We noted that Spanish was not among the top three non-official languages spoken most often at home in these regions according to the 2021 Census.
Observation 4: In the final months of the program (September 2021 to December 2021), French became the predominant language requested for interpretation (Figure 2). This could be attributed to the sudden rise in submissions from Eastern Ontario and Sudbury & Districts (supplemental data available from the corresponding author). These PHUs have a large proportion of the population that speaks French most often at home (supplemental data available from the corresponding author). Public health units that submitted a high volume of contacts during these four months included (number of contacts): Durham (n=18,146), Waterloo (n=15,150), Niagara (n=12,363), Sudbury & Districts (n=8,236), Peel (n=6,437) and Eastern Ontario (n=6,159) (supplemental data available from the corresponding author).
Discussion
Interpreters provided over 38,500 minutes of interpretation services in 50 languages for the CTI. Some of the shifts in language predominance could be explained by changes in which local PHUs were submitting a high volume of contacts to the CTI and the associated language profiles of those communities.
There were two periods when the patterns in language interpretation requests could not be explained by examining which health units were driving submissions and their community's language profiles. The predominance of Arabic interpretation requests is an interesting finding that could represent the disproportionate impact of COVID-19 pandemic on Arabic-speaking communities. This observation is consistent with the findings of an analysis of race-based data collected by Ontario PHUs, where Middle Eastern communities experienced disproportionality high crude per capita rates of COVID-19 infection Footnote 9.
The increase in Spanish interpretation requests is another interesting finding as Spanish is not among the top three non-official languages spoken most often at home for the health unit regions that were driving submissions. This observation is consistent with the findings of the analysis of race-based data collected by Ontario PHUs, where Latino communities in Ontario experienced the highest crude per capita rates of COVID-19 infection in Ontario Footnote 9. In the absence of systematic collection of race-based data, lack of concordance between language interpretation requests and a community's language profile could prompt further investigation to identify potential disproportionate impacts of disease that should be addressed.
Our work shows there is extreme variability between the average lengths of interpretation encounters. Interpretation is more than a direct translation. There is a need to incorporate cultural contexts and unique characteristics of the target language into scripts that were written in English. We believe this this is an important area for future study with opportunities to continue to build on work that aims to improve technology and training for effective communication that is mediated by an interpreter.
Strengths and limitations
Key strengths of this study were the novel use of administrative data for understanding public health communication needs and completeness of the data set spanning the full program duration. There are important limitations and caveats to the data available for this exploratory analysis that we made note of. Individual encounters could have involved calls to households with one or more persons or a proxy (e.g., parent for a child); therefore, we were unable to identify the number of unique contacts.
This was also an exploratory descriptive study with limitations in being able to control for potential confounding factors. The contacts supported by the CTI are a subset of high-risk contacts in Ontario that were submitted by PHUs based on program criteria, which changed over time in response to PHU needs and provincial policy directions. There will be a less accurate picture of interpretation needs during periods when there was a high volume of COVID-19 cases when some case and contact management activities were modified to prioritize other COVID-19 response activities.
The use of administrative billing data for requests for interpretation services from an external vendor may not fully capture all language interpretation needs. The need for interpretation services may not have always been requested by the contact or recognized by the interviewer. The effectiveness of training on accessing interpretation services and the consistency in which these services were recommended by interviewers was not assessed. It is important to further understand barriers to effective communication and other factors, including cultural preferences, to continue to improve language services and the overall delivery of public health information.
Conclusion
Public health agencies could benefit from using existing secondary data sources to understand the language interpretation needs of their communities. This study also demonstrated how existing data sources could be used to help assess how communities are being disproportionately affected by public health emergencies.
Authors' statement
- AC — Methodology, formal analysis, interpretation, writing–original draft, writing–review & editing
- MAC — Methodology, interpretation, writing–review & editing
- JPH — Conceptualization, methodology, interpretation, writing–review & editing
The content and view expressed in this article are those of the authors and do not necessarily reflect those of the Government of Canada.
Competing interests
None
Acknowledgements
The authors would like to thank Justin Thielman and Celina Degano for their support during the analysis and for providing information on the Contact Tracing Initiative.
Funding
This work was supported by Public Health Ontario.
References
- Footnote 1
-
World Health Organization. Contact tracing in the context of COVID-19: Interim guidance, 1 February 2021. Geneva, CH: WHO; 2021. [Accessed 2024 Aug 6]. https://apps.who.int/iris/handle/10665/339128
- Footnote 2
-
Maleki P, Al Mudaris M, Oo KK, Dawson-Hahn E. Training contact tracers for populations with limited English proficiency during the COVID-19 pandemic. Am J Public Health 2021;111(1):20–4. https://doi.org/10.2105/AJPH.2020.306029
- Footnote 3
-
Lu L, Anderson B, Ha R, D’Agostino A, Rudman SL, Ouyang D, Ho DE. A language-matching model to improve equity and efficiency of COVID-19 contact tracing. Proc Natl Acad Sci 2021;118(43):e2109443118. https://doi.org/10.1073/pnas.2109443118
- Footnote 4
-
Eliaz A, Blair AH, Chen YH, Fernandez A, Ernst A, Mirjahangir J, Celentano J, Sachdev D, Enanoria W, Reid MJA. Evaluating the impact of language concordance on coronavirus disease 2019 contact tracing outcomes among Spanish-speaking adults in San Francisco between June and November 2020. Open Forum Infect Dis 2022;9(1):ofab612. https://doi.org/10.1093/ofid/ofab612
- Footnote 5
-
Ariste R, di Matteo L. Non-Official Language Concordance in Urban Canadian Medical Practice: Implications for Care during the COVID-19 Pandemic. Healthc Policy 2021;16(4):84–96. https://doi.org/10.12927/hcpol.2021.26497
- Footnote 6
-
Guttmann A, Gandhi S, Wanigaratne S, Lu H, Ferriera-Legere LE, Paul J, Gozdyra P, Campbell T, Chung H, Fung K, Chen B, Kwong JC, Rosella L, Shah BR, Saunders N, Paterson JM, Bronskill SE, Azimaee M, Vermeulen MJ, Schull MJ. COVID-19 in Immigrants, Refugees and Other Newcomers in Ontario: Characteristics of Those Tested and Those Confirmed Positive, as of June 13, 2020. ICES; 2020. [Accessed 2024 Aug 6]. https://www.ices.on.ca/Publications/Atlases-and-Reports/2020/COVID-19-in-Immigrants-Refugees-and-Other-Newcomers-in-Ontario
- Footnote 7
-
Statistics Canada. While English and French are still the main languages spoken in Canada, the country’s linguistic diversity continues to grow. Ottawa, ON: StatCan; 2022. [Accessed 2024 Aug 6]. https://www150.statcan.gc.ca/n1/daily-quotidien/220817/dq220817a-eng.htm
- Footnote 8
-
Rajkumar E, Rajan AM, Daniel M, Lakshmi R, John R, George AJ, Abraham J, Varghese J. The psychological impact of quarantine due to COVID-19: A systematic review of risk, protective factors and interventions using socio-ecological model framework. Heliyon 2022;8(6):e09765. https://doi.org/10.1016/j.heliyon.2022.e09765
- Footnote 9
-
McKenzie K, Dube S, Petersen S. Tracking COVID-19 through race-based data. Toronto, ON: Wellesley Institute & Ontario Health; 2021. [Accessed 2024 Aug 6]. https://www.wellesleyinstitute.com/wp-content/uploads/2021/08/Tracking-COVID-19-Through-Race-Based-Data_eng.pdf
- Footnote 10
-
Chambers A, Quirk J, MacIntyre EA, Bodkin A, Hanson H. Lessons learned from implementing a surge capacity support program for COVID-19 contact management in Ontario. Can J Public Health 2023;114(4):555–62. https://doi.org/10.17269/s41997-023-00773-6
- Footnote 11
-
Statistics Canada. Census Profile, 2021 Census of Population. Ottawa, ON: StatCan; 2022. [Accessed 2024 Aug 6]. https://www12.statcan.gc.ca/census-recensement/2021/dp-pd/prof/index.cfm?Lang=E
