
At-a-glance – How Healthy are Canadians? A brief update
Health Promotion and Chronic Disease Prevention in Canada
CCDI Steering CommitteeAuthor reference 1
(Brenda Branchard, Paromita Deb-Rinker, Alejandra Dubois, Pam Lapointe, Siobhan O'Donnell, Louise Pelletier (chair), Gabriela Williams)
https://doi.org/10.24095/hpcdp.38.10.05
Author reference:
- Author reference 1
-
Public Health Agency of Canada, Ottawa, Ontario, Canada
Correspondence: Louise Pelletier, Public Health Agency of Canada, 785 Carling Avenue, AL 6806A, Ottawa, ON K1A 0K9; Tel: 613-960-5339; Email: louise.pelletier2@canada.ca
Introduction
The purpose of this At-a-glance is to provide an update on a number of the key findings from the 2016 Report, “How Healthy are Canadians?”Reference 1 using results from the most recent edition (2018) of the Canadian Chronic Disease Indicators (CCDI; Table 1). The 2016 Report examined trends for the four major chronic diseases (cardiovascular disease [CVD],Footnote † cancer, chronic respiratory disease [CRD]Footnote ‡ and diabetes) and four associated cross-cutting risk factors (tobacco smoking, physical inactivity, unhealthy eating and harmful use of alcohol) that formed the basis of the World Health Organization (WHO) Global Action Plan for the Prevention and Control of Noncommunicable Diseases (NCDs) 2013-2020.Reference 2 In addition, the 2016 Report included mood and/or anxiety disorders because of their major impact on the health of Canadians. Therefore, this update does not focus on all results from the 2018 CCDI in Table 1 but highlights specific aspects of interest, namely the mortality and morbidity experiences of Canadians living with these major chronic diseases, as well as the associated risk factors. The reported results are based on the following four data sources: Canadian Chronic Disease Surveillance System (CCDSS); Canadian Community Health Survey (CCHS); Canadian Health Measure Survey; and, Canadian Vital Statistics–Death Database.
Main findings
Mortality
While the mortality rate associated with the four major chronic diseases has decreased by a third over an 18-year period (from 663/100 000 in 1998 to 441/100 000 in 2015; age-standardized mortality rates), the most dramatic decline was observed for CVD (nearly 50%). Nonetheless, CVD is still the second leading cause of death in Canada (196/100 000; crude mortality rate) after cancer (215/100 000; crude mortality rate), representing 27% and 29% of all deaths in 2015, respectively. Furthermore, the probability of dying between the ages of 30 and 69 years (i.e., premature mortality) from one of the four major chronic diseases decreased by nearly a third over the same period (from 14.9% in 1998 to 10.2% in 2015). While this is a positive finding, more still needs to be done since deaths due to these diseases among Canadians of this age group are often preventable.
Morbidity
One in three Canadian adults (33.7%) lives with at least one of the following chronic diseases: CVD; cancer; CRD; diabetes; mood and/or anxiety disorders. Specifically, in 2015/16, an estimated 2.4 million Canadians had ischemic heart disease and about 800 000 were living with the effects of a stroke, both common forms of CVD. Approximately 2.2 million reported ever having been diagnosed with cancer. Furthermore, 2.1 million were living with chronic obstructive pulmonary disease (COPD); one of the most common types of CRD, and 3.1 million Canadians were living with diabetes. Finally, 3.9 million reported having been diagnosed with mood and/or anxiety disorders in 2016.Footnote § In contrast to most chronic diseases which increase with age, mood and/or anxiety disorders are particularly prevalent in the working-age population (20-64-year-olds).
The number of individuals living with these chronic diseases continues to increase due to the aging and growth of the Canadian population, and the fact that people are living longer with their disease due to advances in treatment and management (Figure 1). On the other hand, the rate of new cases every year for most diseases is decreasing slowly, except for diabetes where more variations in trends were observed.Footnote ** Most chronic diseases affect males and females somewhat differently, with some definitively more common in males (such as ischemic heart disease) and some more common in females (such as mood and/or anxiety disorders). Overall, women tend to adopt better health behaviours than men except for physical activity where levels are equally low for all Canadians. On the other hand, women live longer with age being a major, non-modifiable chronic disease risk factor.
Figure 1. Age-standardized prevalence (%) in major chronic diseases among Canadians aged 20+, Canada, 2000–2015
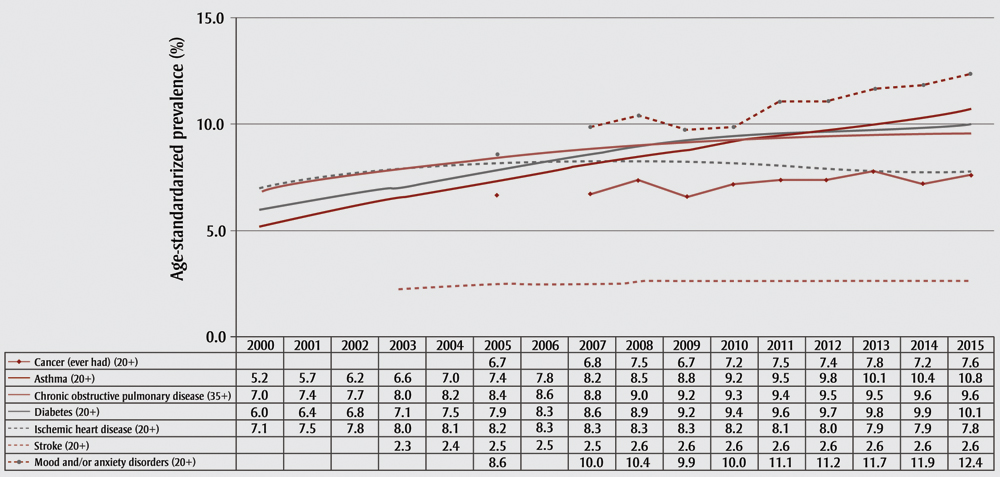
Sources: Canadian Community Health Survey - Annual Component, 2005 to 2015; Canadian Chronic Disease Surveillance System, 2000-01 to 2015-16.
Note: Cancer (ever had) and mood and/or anxiety disorders are based on self-reported data and presented by calendar year; all other diseases and conditions are based on administrative data and are presented by fiscal year.
Text Description
| Chronic disease | Age-standardized prevalence (%) | |||||||||||||||
|---|---|---|---|---|---|---|---|---|---|---|---|---|---|---|---|---|
| 2000 | 2001 | 2002 | 2003 | 2004 | 2005 | 2006 | 2007 | 2008 | 2009 | 2010 | 2011 | 2012 | 2013 | 2014 | 2015 | |
| Cancer (ever had) (20+) | N/A | N/A | N/A | N/A | N/A | 6.7 | N/A | 6.8 | 7.5 | 6.7 | 7.2 | 7.5 | 7.4 | 7.8 | 7.2 | 7.6 |
| Asthma (20+) | 5.2 | 5.7 | 6.2 | 6.6 | 7.0 | 7.4 | 7.8 | 8.2 | 8.5 | 8.8 | 9.2 | 9.5 | 9.8 | 10.1 | 10.4 | 10.8 |
| Chronic obstructive pulmonary disease (35+) | 7.0 | 7.4 | 7.7 | 8.0 | 8.2 | 8.4 | 8.6 | 8.8 | 9.0 | 9.2 | 9.3 | 9.4 | 9.5 | 9.5 | 9.6 | 9.6 |
| Diabetes (20+) | 6.0 | 6.4 | 6.8 | 7.1 | 7.5 | 7.9 | 8.3 | 8.6 | 8.9 | 9.2 | 9.4 | 9.6 | 9.7 | 9.8 | 9.9 | 10.1 |
| Ischemic heart disease (20+) | 7.1 | 7.5 | 7.8 | 8.0 | 8.1 | 8.2 | 8.3 | 8.3 | 8.3 | 8.3 | 8.2 | 8.1 | 8.0 | 7.9 | 7.9 | 7.8 |
| Stroke (20+) | N/A | N/A | N/A | 2.3 | 2.4 | 2.5 | 2.5 | 2.5 | 2.6 | 2.6 | 2.6 | 2.6 | 2.6 | 2.6 | 2.6 | 2.6 |
| Mood and/or anxiety disorders (20+) | N/A | N/A | N/A | N/A | N/A | 8.6 | N/A | 10.0 | 10.4 | 9.9 | 10.0 | 11.1 | 11.2 | 11.7 | 11.9 | 12.4 |
Behavioural risk factors
Similar to what the 2016 Report indicated, except for tobacco smoking, Canada continues to have high prevalence of modifiable risk factors associated with chronic diseases [physical inactivity (62.4% for children and youth and 82.5% for adults), unhealthy eating (70.0% for Canadians 12+ years) and harmful use of alcohol (15.2% of Canadians 15+ years)]. In 2016, 84.9% of Canadian adults reported having at least one of these behavioural risk factors.
Chronic diseases usually develop over many years or decades. Therefore, it is extremely important that Canadian children and youth adopt healthy behaviours from an early age. Unfortunately, only one in ten (9.5%) children aged 5 to 17 meet the recent 24-hour movement guidelines for children and youth for physical activity, sedentary behaviour and sleep.Reference 3 Furthermore, only one in three children and youth (37.6%) meet the physical activity guidelinesFootnote †† suggesting more work needs to be done to increase activity in and commitment to sports and recreation, active transportation and physical activity at school.
Conclusion
Since the publication of the 2016 Report, overall and premature mortality trends have continued to decrease at a variable rate for the four major chronic diseases. However, the number of Canadians living with one or more of these chronic diseases continues to increase imposing a major burden on the health of Canadians and on the health care system. The chronic diseases included in this update represent the leading causes of death and disease burden in Canada and could be largely prevented by tackling a few common risk factors. Healthy living, prevention and adequate management of chronic diseases are all necessary to ensure that Canadians live a long, healthy and disease-free life.
Conflicts of interest
The authors have no conflicts of interest to disclose.
Authors’ contributions and statement
LP chaired the Steering Committee and drafted the At-a-glance, BB managed the project and analyzed the data, PDR, PL, SO and GW analyzed and/or interpreted the data, and all co-authors reviewed and/or revised the At-a-glance.
The content and views expressed in this article are those of the authors and do not necessarily reflect those of the Government of Canada.
Canadian Chronic Disease Indicators
| Indicator Group | Indicator Measure(s) | Latest DataTable 1 Footnote a | Data Source (Year) |
|---|---|---|---|
| Social and Environmental Determinants | |||
| Education | % of population that reports having less than a high school education, population aged 20+ years | 12.2% | CCHS (2016) |
| Income | % of population living below low-income cut-offs, after tax, total population | 8.1% | CIS (2016) |
| Childhood poverty | % of children living below low-income cut-offs, after tax, population aged < 18 yearsTable 1 Footnote b | 7.3% | CIS (2016) |
| Employment | Average annual unemployment rate (% of labour force that was unemployed during reference period), population aged 15+ years | 6.3% | LFS (2017) |
| Community belonging | % of population that reports a “very strong” or “somewhat strong” sense of belonging to their local community, population aged 12+ years | 68.8% | CCHS (2016) |
| Maternal and Child Health Risk and Protective Factors | |||
| Diabetes during pregnancy | Rate of pregnant women with diagnosed diabetes (pre-existing and gestational diabetes) | 90.5 per 1000 total birthsTable 1 Footnote c | DAD (2016) |
| Hypertension during pregnancy | Rate of pregnant women with diagnosed hypertension (pre-existing and gestational hypertension) | 68.2 per 1000 total birthsTable 1 Footnote c | DAD (2016) |
| Maternal weight during pregnancy | % of women who report gestational weight gain above recommended Health Canada guidelines | 42.8%Table 1 Footnote d | CCHS (2016) |
| Preterm birth | % of live births with a gestational age at birth of less than 37 completed weeks | 8.2 per 100 live births | DAD (2016) |
| Breastfeeding | % of women who report exclusive breastfeeding of their child for at least the first 6 months of life, women aged 15+ years | 30.9% | CCHS (2016) |
| Exposure to second-hand smoke | % of households with children aged < 15 years that report regular child exposure to environmental tobacco smoke at home | 2.8% | CTADS (2015) |
| Family violence | % of population that reports experiencing at least once before the age of 15 any type of physical or sexual assault and/or exposure to violence by an adult (18+ years)Table 1 Footnote e, population aged 15+ years | 34.1%Table 1 Footnote e | GSS (2014) |
| Behavioural Risk and Protective Factors | |||
| 24-hour movement | % of children and youth who meet the Canadian 24-Hour Movement Guidelines for Children and Youth, population aged 5 to 17 years | 9.5% | CHMS (2014 to 2015) |
| Physical activity | % of children and youth who meet physical activity recommendations by accumulating at least 60 minutes of moderate to vigorous physical activity per day (measured data), population aged 5 to 17 years | 37.6%Table 1 Footnote d | CHMS (2014 to 2015) |
| % of adults who meet physical activity guidelines by accumulating at least 150 minutes of moderate to vigorous physical activity each week, in bouts of 10 minutes or more (measured data), population aged 18+ years | 17.5% | CHMS (2014 to 2015) | |
| Sedentary behaviour | % children and youth who report meeting sedentary behaviour recommendations by spending 2 hours or less per day watching television or using computers during leisure-time, population aged 5 to 17 years | 28.5%Table 1 Footnote d | CHMS (2014 to 2015) |
| Sleep | % of population that reports obtaining the recommended amount of daily sleep, population aged 5+ years | 65.5% | CHMS (2014 to 2015) |
| Nutrition | % of population that reports consuming fruit and vegetables at least 5 times/day, population aged 12+ years | 30.0% | CCHS (2016) |
| % of children and youth who report drinking sugar-sweetened beverages daily, population aged 5 to 17 years | 16.0% | CHMS (2014 to 2015) | |
| Chronic stress | % of population that reports life to be “quite a bit” or “extremely” stressful most days in the last 12 months, population aged 12+ years | 21.5% | CCHS (2016) |
| Alcohol use | % of population that reports exceeding low risk alcohol drinking guidelines for chronic drinking, population aged 15+ years | 15.2% | CTADS (2015) |
| Smoking | % of population that reports being current smokers (daily or occasional), population aged 15+ years | 13.0% | CTADS (2015) |
| Drug use | % of population that reported using cannabis at least once a week in the last 3 months, population aged 15+ years | 5.2% | CTADS (2015) |
| Main chronic disease risk factors prevalence | % of population that reports having at least one of four main chronic disease risk factors (tobacco smoking, physical inactivity, unhealthy eating and harmful use of alcohol), population aged 20+ years | 84.9% | CCHS (2016) |
| Risk Conditions | |||
| Obesity | % of children and youth that are obese (measured data), population aged 5 to 17 years | 13.1% | CHMS (2014 to 2015) |
| % of adults that are obese (measured data), population aged 18+ years | 28.1% | CHMS (2014 to 2015) | |
| Elevated blood glucose | % of population with elevatedTable 1 Footnote f blood glucose (measured data), population aged 18+ years | 4.1% | CHMS (2014 to 2015) |
| Elevated blood cholesterol | % of population with elevatedTable 1 Footnote f blood cholesterol [TC:HDL-C ratio] (measured data), population aged 18+ years | 18.7% | CHMS (2014 to 2015) |
| Hypertension | % of population with diagnosed hypertension, population aged 20+ years | 25.4% | CCDSS (2015–16)Table 1 Footnote g |
| Disease Prevention Practices | |||
| Contact with health care professional | % of population that reports having a regular healthcare provider, population aged 12+ years | 84.2% | CCHS (2016) |
| % of population that reported consulting a dentist, dental hygienist or orthodontist at least once in the past 12 months, population aged 12+ years | 69.3 % | CCHS (2016) | |
| Disease screening | % of women who report having had a mammogram at least once in the past 5 years, population aged 50 to 74 years | 83.5% | CCHS (2012) |
| % of women who report having had at least one Pap smear test in the past 3 years, population aged 25 to 69 years | 79.7% | CCHS (2012) | |
| % of population that reports having had at least one fecal occult blood test, colonoscopy and/or sigmoidoscopy in the recommended time period, population aged 50 to 74 years | 51.1% | CCHS (2012) | |
| Vaccination (influenza) | % of population living with a chronic diseaseTable 1 Footnote h that reported having a seasonal flu shot in the past 12 months, population aged 12+ years | 47.0% | CCHS (2016) |
| Health Outcomes/Status | |||
| General health | % of population that reports their health is “very good” or “excellent,” population aged 12+ years | 60.9% | CCHS (2016) |
| % of population that reports their mental health is “very good” or “excellent,” population aged 12+ years | 68.5% | CCHS (2016) | |
| Life expectancy at birth | 83.3 years | CCDSS (2013–14 to 2015–16) | |
| Life expectancy at age 65 | 21.8 years | CCDSS (2013–14 to 2015–16) | |
| Health-adjusted life expectancy at birth | 71.9 years | CCDSS (2013–14 to 2015–16) | |
| Health-adjusted life expectancy at age 65 | 16.6 years | CCDSS (2013–14 to 2015–16) | |
| Morbidity—prevalence | % of population with diagnosed diabetes, population aged 1+ years | 8.6% | CCDSS (2015–16) |
| % of population that reports having diagnosed cardiovascular diseases (heart disease or stroke), population aged 20+ years | 6.2% | CCHS (2016) | |
| % of population with diagnosed ischemic heart disease, population aged 20+ years | 8.5% | CCDSS (2015–16) | |
| % of population with diagnosed heart failure, population aged 40+ years | 3.7% | CCDSS (2015–16) | |
| % of population with diagnosed stroke, population aged 20+ years | 2.8% | CCDSS (2015–16) | |
| % of population with diagnosed asthma, population aged 1+ years | 11.4% | CCDSS (2015–16) | |
| % of population with diagnosed chronic obstructive pulmonary disease, population aged 35+ years | 10.2% | CCDSS (2015–16) | |
| % of population that reports ever being diagnosed with cancer, population aged 12+ years | 7.2% | CCHS (2016) | |
| % of population that reports ever having symptoms consistent with at least 1 of 6 mental or substance use disorders,Table 1 Footnote i population aged 15+ years | 33.3% | CCHS-MH (2012) | |
| % of population that reports having diagnosed mood and/or anxiety disorders, population aged 12+ years | 12.9% | CCHS (2016) | |
| % of population with diagnosed dementia, including Alzheimer’s disease, population aged 65+ years | 6.9% | CCDSS (2015–16) | |
| % of population with diagnosed osteoarthritis, population aged 20+ years | 13.7% | CCDSS (2015–16) | |
| % of population with diagnosed osteoporosis, population aged 40+ years | 11.9% | CCDSS (2015–16) | |
| % of population that reports having been diagnosed with at least 1 of the 5 major chronic diseases,Table 1 Footnote j population aged 20+ years | 33.7% | CCHS (2016) | |
| % of population that reports having been diagnosed with at least 1 of the 10 major chronic diseases,Table 1 Footnote k population aged 20+ years (NEW) | 44.2% | CCHS (2016) | |
| Multimorbidity | % of population that reports having been diagnosed with at least 2 of the 5 major chronic diseases,Table 1 Footnote j population aged 20+ years | 8.9% | CCHS (2016) |
| % of population that reports having been diagnosed with at least 2 of the 10 common chronic diseases,Table 1 Footnote k population aged 20+ years | 18.3% | CCHS (2016) | |
| Morbidity—incidence | Rate of newly diagnosed diabetes cases, population aged 1+ years | 595.4 per 100 000 | CCDSS (2015–16) |
| Rate of newly diagnosed ischemic heart disease cases, population aged 20+ years | 591.8 per 100 000 | CCDSS (2015–16) | |
| Rate of newly diagnosed acute myocardial infarction cases, population aged 20+ years | 216.8 per 100 000 | CCDSS (2015–16) | |
| Rate of newly diagnosed heart failure cases, population aged 40+ years | 541.0 per 100 000 | CCDSS (2015–16) | |
| Rate of newly diagnosed asthma cases, population aged 1+ years | 464.8 per 100 000 | CCDSS (2015–16) | |
| Rate of newly diagnosed chronic obstructive pulmonary disease cases, population aged 35+ years | 818.2 per 100 000 | CCDSS (2015–16) | |
| Rate of all newly diagnosed cancer cases, total population | 563.6 per 100 000Table 1 Footnote l | CCR/NCIRS (2017) | |
| Rate of newly diagnosed dementia cases, including Alzheimer’s disease, population aged 65+ years | 1372.6 per 100 000 | CCDSS (2015–16) | |
| Rate of newly diagnosed osteoarthritis cases, population aged 20+ years | 872.7 per 100 000 | CCDSS (2015–16) | |
| Rate of newly diagnosed hip fracture, population aged 40+ years | 146.6 per 100 000 | CCDSS (2015–16) | |
| Disability | % of population that reports being limited in their activities “sometimes” or “often” due to disease/illness, population aged 12+ years | 32.7% | CCHS (2014) |
| Mortality | Death rate due to a major chronic disease (diabetes, cancer, cardiovascular diseases, chronic respiratory diseases), total population | 478.0 per 100 000 | CVSD (2015) |
| Death rate due to diabetes, total population | 20.0 per 100 000 | CVSD (2015) | |
| Death rate due to cardiovascular diseases, total population | 196.4 per 100 000 | CVSD (2015) | |
| Death rate due to chronic respiratory diseases, total population | 46.5 per 100 000 | CVSD (2015) | |
| Death rate due to cancer, total population | 215.0 per 100 000 | CVSD (2015) | |
| Death rate due to suicide, total population | 12.3 per 100 000 | CVSD (2015) | |
| Death rate due to dementia, including Alzheimer’s disease, total population | 67.4 per 100 000 | CVSD (2015) | |
| Death rate within one year of hip fracture, population aged 40+ years that had a hip fracture | 227.5 per 1 000 | CCDSS (2014–15) | |
| Premature mortality | Probability of dying between ages 30 and 69 years from one of the major chronic diseases (cardiovascular diseases, cancer, chronic respiratory diseases, diabetes) | 10.2% | CVSD (2015) |
| Probability of dying between ages 30 and 69 years from cardiovascular disease | 3.0% | CVSD (2015) | |
| Probability of dying between ages 30 and 69 years from cancer | 6.1% | CVSD (2015) | |
| Probability of dying between ages 30 and 69 years from chronic respiratory disease | 0.7% | CVSD (2015) | |
| Probability of dying between ages 30 and 69 years from diabetes | 0.4% | CVSD (2015) | |
Abbreviations: CCDSS, Canadian Chronic Disease Surveillance System; CCHS, Canadian Community Health Survey; CCHS-MH, Canadian Community Health Survey – Mental Health; CCR, Canadian Cancer Registry; CHMS, Canadian Health Measures Survey; CIS, Canadian Income Survey; CTADS, Canadian Tobacco; Alcohol and Drugs Survey; CVSD, Canadian Vital Statistics–Death Database; DAD, Discharge Abstract Database; GSS, General Social Survey; HDL-C, high-density lipoprotein cholesterol; LFS, Labour Force Survey; NCIRS, National Cancer Incidence Reporting System; TC, total cholesterol Note: Indicators/measures identified as data gaps: Prenatal smoking, prenatal alcohol drinking, developmental disorders (including autism spectrum disorder [ASD] and fetal alcohol spectrum disorder [FASD]), social support, resilience, discrimination and stigma and built environment.
Suggested citation: Public Health Agency of Canada. Canadian Chronic Disease Indicators, Quick Stats, 2018 Edition. Ottawa (ON): Public Health Agency of Canada; 2018. #CCDI For questions or comments, please contact us at: phac.infobase.aspc@canada.ca Visit the Canadian Chronic Disease Indicators “online tool” to view additional data breakdowns (e.g. by sex, trends over time, etc.): https://health-infobase.canada.ca/ccdss/data-tool/ |
|||
References
- Reference a
-
Public Health Agency of Canada. How healthy are Canadians? A trend analysis of the health of Canadians from a healthy living and chronic disease perspective [Internet]. Ottawa (ON): Public Health Agency of Canada; 2016. Available from: https://www.canada.ca/en/public-health/services/publications/healthy-living/how-healthy-canadians.html
- Reference b
-
World Health Organization. Global action plan for the prevention and control of noncommunicable diseases 2013-2020 [Internet]. Geneva (CH): WHO; 2013. Available from: http://www.who.int/nmh/events/ncd_action_plan/en/
- Reference c
-
Canadian Society for Exercise Physiology. Canadian 24-hour movement guidelines for children and youth: an integration of physical activity, sedentary behaviour, and sleep [Internet]. Ottawa (ON): Canadian Society for Exercise Physiology; 2016. Available from: http://www.csep.ca/CMFiles/Guidelines/24hrGlines/Canadian24HourMovementGuidelines2016.pdf
Footnotes
- Footnote 1
-
CVD includes ischemic heart disease, heart failure and stroke.
- Footnote 2
-
CRD includes chronic obstructive pulmonary disease (COPD) and asthma.
- Footnote 3
-
This estimate differs from that in the Report “How Healthy are Canadians?” as the 2016 Report used CCDSS data (i.e., annual use of health services for mood and/or anxiety disorders) while the CCDI used CCHS data (i.e., self-reported, diagnosed mood and/or anxiety disorders).
- Footnote 4
-
The incidence rate (new cases over a year) based on the CCDSS data may indicate a true change in population health status, but may also reflect changes in data collection methods, coding/classification systems, clinical practices, billing methods, etc.
- Footnote 5
-
The new 2016 physical activity guidelines recommend that children and youth accumulate at least 60 minutes of moderate to vigorous physical activity (MVPA) per day on average per week (though not necessarily on each day), while the previous guidelines recommended 60 minutes of MVPA occur at least 6 days of the week. This modification to the guidelines resulted in a higher proportion of children and youth meeting the recommended level of physical activity (37.6% versus the previously reported 9.1%).