
Childhood cancer incidence in Canada: demographic and geographic variation of temporal trends (1992–2010)
Health Promotion and Chronic Disease Prevention in Canada
Lin Xie, MSc; Jay Onysko, MA; Howard Morrison, PhD
https://doi.org/10.24095/hpcdp.38.3.01
This original quantitative research article has been peer reviewed.
Author reference:
Public Health Agency of Canada, Ottawa, Ontario, Canada
Correspondence: Lin Xie, Centre for Surveillance and Applied Research, Public Health Agency of Canada, 785 Carling Avenue, AL 6807A, Ottawa, ON K1A 0K9; Tel: 613-513-6357; Fax: 613-960-0944; Email: lin.xie@canada.ca
Abstract
Introduction: Surveillance of childhood cancer incidence trends can inform etiologic research, policy and programs. This study presents the first population-based report on demographic and geographic variations in incidence trends of detailed pediatric diagnostic groups in Canada.
Methods: The Canadian Cancer Registry data were used to calculate annual age-standardized incidence rates (ASIRs) from 1992 to 2010 among children less than 15 years of age by sex, age and region for the 12 main diagnostic groups and selected subgroups of the International Classification of Childhood Cancer (ICCC), 3rd edition. Temporal trends were examined by annual percent changes (APCs) using Joinpoint regression.
Results: The ASIRs of childhood cancer among males increased by 0.5% (95% confidence interval (CI) = 0.2–0.9) annually from 1992 to 2010, whereas incidence among females increased by 3.2% (CI = 0.4–6.2) annually since 2004 after an initial stabilization. The largest overall increase was observed in children aged 1–4 years (APC = 0.9%, CI = 0.4–1.3). By region, the overall rates increased the most in Ontario from 2006 to 2010 (APC = 5.9%, CI = 1.9–10.1), and increased non-significantly in the other regions from 1992 to 2010. Average annual ASIRs for all cancers combined from 2006 to 2010 were lower in the Prairies (149.4 per million) and higher in Ontario (170.1 per million). The ASIRs increased for leukemias, melanoma, carcinoma, thyroid cancer, ependymomas and hepatoblastoma for all ages, and neuroblastoma in 1–4 year olds. Astrocytoma decreased in 10–14 year olds (APC = −2.1%, CI = −3.7 to −0.5), and among males (APC = −2.4%, CI = −4.6 to −0.2) and females (APC = −3.7%, CI = −5.8 to −1.6) in Ontario over the study period.
Conclusion: Increasing incidence trends for all cancers and selected malignancies are consistent with those reported in other developed countries, and may reflect the changes in demographics and etiological exposures, and artefacts of changes in cancer coding, diagnosis and reporting. Significant decreasing trend for astrocytoma in late childhood was observed for the first time.
Keywords: childhood cancer, ICCC, age-standardized incidence rate, annual percent change
Highlights
- Childhood cancer incidence increased by 0.5% annually from 1992 to 2010 among males, and increased by 3.2% from 2004 to 2010 among females.
- The overall increase was observed in the most recent decade, and among children aged 1–4.
- The overall incidence tended to increase in each region from 1992 to 2010. The rates were lower in the Prairies and higher in Ontario from 2006 to 2010.
- Significant increases were observed for leukemias, melanoma, carcinoma, thyroid cancer, ependymomas and hepatoblastoma for all ages combined, and neuroblastoma in children aged 1–4.
- Astrocytoma incidence decreased among children aged 10–14 years.
- The findings can help inform etiologic research, public health policy and programs.
Introduction
While cancer in children is rare and represents less than 1% of all new cancer cases in Canada, it is the most common cause of death (following accidents) among children >1 year of age in Canada.Footnote 1,Footnote 2 Although treatment advances have increased the overall five-year survival rate from 71% to 83% over the last three decades, childhood cancer has a lifelong health, psychosocial, and financial impact on children and their families.Footnote 1,Footnote 3 Patients who survive five years remain at risk of recurrence or progression of their primary cancer and are at an increased risk of developing subsequent malignancies, chronic diseases, and functional impairments as a result of treatment.
A Statistics Canada report has documented a statistically significant increase of 0.4% per year in overall incidence of pediatric cancers from 1992 to 2010 at the national level.Footnote 4 In recent years, the possibility that the incidence rates of certain pediatric malignancies are increasing has become a topic of public and scientific concern.Footnote 5,Footnote 6,Footnote 7,Footnote 8 Reasons for such changes are not yet understood. Surveillance of cancer incidence trends may provide insight to develop new hypotheses for future etiologic studies, and may inform the need for health services in particular populations. However, the recent temporal trends in incidence have not been examined in detail by pediatric diagnostic groups or in regional contexts. This study presents detailed recent population-based data on demographic and geographic variations in childhood cancer incidence trends in Canada.
Methods
Data sources
The cancer incidence data were extracted from the Canadian Cancer Registry (CCR),Footnote 9 except for Quebec where, from 2008 to 2010, data were obtained in a summary format from the province directly. The incidence data are collected by the provincial and territorial cancer registries, which report data annually to the CCR at Statistics Canada. The CCR is a dynamic, person-oriented, population-based database with cases newly diagnosed from 1992 onward.
Cancer diagnoses were coded according to topography, morphology and behaviour using the International Classification of Diseases for Oncology, Third Edition (ICD-O-3)Footnote 10 and were converted to the International Classification of Childhood Cancer, Third Edition (ICCC-3).Footnote 11,Footnote 12 All primary malignancies diagnosed during the period 1992 through 2010 among those aged 0–14 years were included. The ICCC-3 includes non-malignant intracranial and intraspinal tumours in categories III and X. In accordance with this classification, non-malignant central nervous system (CNS) tumours were also included as a separate analysis.
Population estimates for Canada and the provinces/territories used in the calculation of incidence rates were based on quinquennial censuses conducted from 1991 to 2011. We used intercensal estimates prepared by Statistics Canada for the years between these censuses.Footnote 13
Statistical analysis
Cancer incidence counts and population estimates were summarized by age group (<1 [infants], 1–4, 5–9, and 10–14 [late childhood] years), year of diagnosis, sex, and geographical region at diagnosis (British Columbia, the Prairie provinces [Alberta, Saskatchewan and Manitoba], Ontario, Quebec, the Atlantic provinces [New Brunswick, Prince Edward Island, Nova Scotia, and Newfoundland and Labrador], and the Territories [Yukon, Northwest Territories and Nunavut]). Given that the number of cancer cases was too small to provide stable estimates for some cancers for each of the Prairie provinces, the Atlantic provinces or the Territories, aggregated regions were created for analysis. Rates for each category were calculated by dividing the number of cases in each category by the corresponding population figure. These age-specific rates were standardized to the 2011 Canadian population, using the direct method, to obtain age-standardized incidence rates (ASIRs) per million children.
Joinpoint Regression Program, which is a statistical software for the analysis of trends, was used to identify changes in the trends of annual age-standardized incidence rates of selected cancers over the period from 1992 to 2010.Footnote 14 The response variable was the natural logarithm of the ASIR, and the independent variable was the year of cancer diagnosis. Separate analyses were run by cancer type, sex, age and region. The annual percent change (APC) in cancer incidence rates was calculated by fitting a piecewise linear regression model, assuming a constant rate of change in the logarithm of the annual ASIR in each segment.Footnote 15 The estimated slope from this model was then transformed back to represent an annual percentage increase or decrease in the rate. The test of APC is based on asymptotic t-test. The APC was considered statistically significant if its 95% confidence interval (CI) did not include zero (p < 0.05). The connecting points of the linear segments are referred to as changepoints or joinpoints. The models incorporated estimated standard errors of the ASIRs. To reduce the likelihood of reporting spurious changes in trends, we used a minimum of five observations from a joinpoint to either end of the data and a minimum of four observations between joinpoints. Statistical significance in changes of the trends (joinpoints) was determined using Monte Carlo permutation tests with the Bonferroni adjustment to control the over-fitting probability of the multiple tests (the overall significance level was 0.05).
To ensure confidentiality and limit the possibility of residual disclosure, in keeping with CCR reporting requirements, incidence counts presented in the tables and Figure 1 have been randomly rounded either up or down to a multiple of 5. As a result, when these data are grouped, the totals may not equal the sums of individual values. ASIRs were derived using the actual counts. The ASIRs and APCs are not reported when the corresponding rounded counts are less than 30. In addition, the extended classifications of lymphoid leukemias, except for precursor cell lymphoblastic leukemia, are not presented, as the cases in these subgroups originally coded in ICD-O-2 do not have the required information to be converted to ICD-O-3.Footnote 10 Also, the results by region are only reported for the 12 major diagnostic categories and the subtypes with significant APCs.
Data sources: Canadian Cancer Registry (CCR) database at Statistics Canada and Quebec Cancer Registry (2008-2010).
Note: The rates were standardized to the 2011 Canadian population for all ages combined.
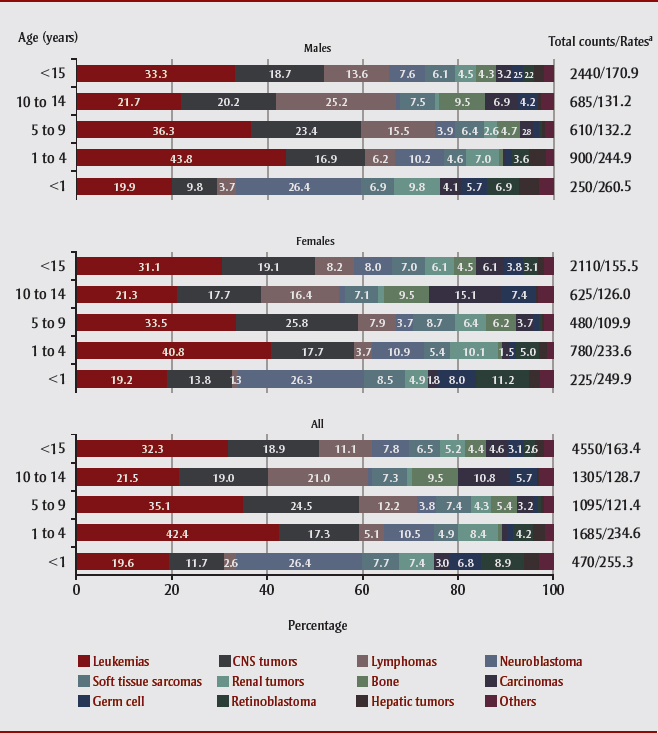
Figure 1 - Text Description
This figure summarizes the distribution of primary cancers for Canada from 2006 to 2010 by age groups for males and females combined and separately. During this period, an average of 910 new diagnoses each year; i.e., a total of 4550 new cases, were reported among children 14 years and under in Canada: 2440 (53.6%) in males and 2110 (46.4%) in females, which amounts to a male:female ratio of 1.2:1.
Overall, the most common childhood cancers diagnosed from 2006 to 2010 were leukemias (32.3%), CNS tumors (18.9%), and lymphomas (11.1%). Next most common were neuroblastoma (7.8%), soft tissue sarcoma (6.5%), and renal tumors (5.2%). The distribution of the most frequent childhood cancers was generally the same for males and females, except lymphomas were more common in males (13.6% compared to 8.2% ), and carcinomas (especially thyroid carcinoma) were more common in females (6.1% vs. 3.2%).
Around half of children’s cancer cases (47.4%) were diagnosed among those under the age of five years. The age-specific incidence rates in children aged less than 5 years were around twice those of their older counterparts. The highest incidence was observed in infants under the age of one year and generally declined with age. Patterns of diagnoses varied considerably by age group. In infants, neuroblastoma formed the most commonly diagnosed cancers and accounted for nearly a third of all cases (26.4%), followed by leukemias (19.6%) and CNS tumours (11.7%). The embryonal tumors of neuroblastoma, retinoblastoma, and nephroblastoma jointly accounted for 42.6% of all diagnoses in infants. Leukemias prevailed among 1–4 year olds, accounting for 42.4% of all diagnoses, while in 5–9 year olds and 10–14 year olds, lymphomas and bone tumours became increasingly common (lymphomas: 12.2% and 21.0%; bone cancers: 5.4 % and 9.5%, respectively). Also in children aged 10–14 years, leukemias (21.5%) and CNS tumours (19.0%) predominated.
Results
Since the completeness of non-malignant CNS tumor data collection varied by province (data not shown), which may have an impact on comparisons across region and time (see Discussion), the results addressed in this section for all cancers combined and CNS tumors are based on malignancies only, whereas results of the best fit joinpoint regression models for these two categories including non-malignant CNS tumors are also provided in Tables 1–5.
| Total cases | % (including non-malignancies) |
% (malignancies only) |
Average annual cases |
Average ASIR |
APC | Year | 95% CI | p-value | |
|---|---|---|---|---|---|---|---|---|---|
| Both sexes combined | |||||||||
| All childhood cancers (malignancies only) | 16955 | 97.54 | 100.00 | 890 | 155.71 | 0.45 | 1992–2010 | 0.08 to 0.81 | 0.02 |
| All childhood cancers including non-malignancies brain | 17380 | 100.00 | 102.52 | 915 | 159.55 | 0.40 | 1992–2010 | 0.08 to 0.73 | 0.02 |
| Leukemias, myeloproliferative diseases, and myelodysplastic diseases | 5485 | 31.57 | 32.36 | 285 | 50.74 | 0.64 | 1992–2010 | 0.08 to 1.20 | 0.03 |
I(A) Lymphoid leukemias |
4305 | 24.78 | 25.41 | 225 | 39.86 | 0.61 | 1992–2010 | 0.09 to 1.13 | 0.02 |
Lymphoid leukemias, precursor cell leukemias |
4075 | 23.45 | 24.04 | 215 | 37.68 | 0.02 | 1992–2010 | -0.78 to 0.83 | 0.95 |
I(B) Acute myeloid leukemias |
755 | 4.36 | 4.47 | 40 | 6.98 | -0.49 | 1992–2010 | -2.20 to 1.25 | 0.56 |
I(C) Chronic myeloproliferative diseases |
140 | 0.81 | 0.83 | 10 | 1.29 | 0.01 | 1992–2010 | -2.63 to 2.71 | 1.00 |
I(D) Myelodysplastic syndrome and other myeloproliferative diseases |
85 | 0.48 | 0.49 | 5 | 0.78 | 4.06 | 1992–2010 | -0.08 to 8.36 | 0.05 |
I(E) Unspecified and other specified leukemias |
200 | 1.13 | 1.16 | 10 | 1.84 | 17.13 | 1992–2001 | 6.18 to 29.21 | < 0.01 |
| -31.47 | 2001–2004 | Table 1 - Footnote – | 0.45 | ||||||
| 18.36 | 2004–2010 | 0.99 to 38.72 | 0.04 | ||||||
| Lymphomas and reticuloendothelial neoplasms | 1905 | 10.94 | 11.22 | 100 | 17.01 | 0.48 | 1992–2010 | -0.35 to 1.32 | 0.24 |
II(A) Hodgkin lymphomas |
715 | 4.10 | 4.21 | 35 | 6.28 | 0.34 | 1992–2010 | -1.00 to 1.70 | 0.60 |
II(B) Non-Hodgkin lymphomas (except Burkitt lymphoma) |
600 | 3.45 | 3.53 | 35 | 5.39 | 0.14 | 1992–2010 | -1.58 to 1.89 | 0.86 |
II(C) Burkitt lymphoma |
270 | 1.55 | 1.59 | 15 | 2.41 | -2.54 | 1992–2010 | -5.82 to 0.85 | 0.13 |
II(D) Miscellaneous lymphoreticular neoplasms |
130 | 0.75 | 0.77 | 5 | 1.22 | -0.40 | 1992–2006 | -5.98 to 5.52 | 0.88 |
| 38.05 | 2006–2010 | 7.48 to 77.31 | 0.02 | ||||||
II(E) Unspecified lymphomas |
190 | 1.09 | 1.12 | 10 | 1.71 | 3.41 | 1992–2010 | 0.72 to 6.18 | 0.02 |
| CNS and miscellaneous intracranial and intraspinal neoplasms | 3345 | 19.22 | 19.71 | 175 | 30.41 | 0.13 | 1992–2010 | -0.46 to 0.71 | 0.65 |
III(A) Ependymomas and choroid plexus tumor |
325 | 1.86 | 1.91 | 15 | 3.02 | 2.25 | 1992–2010 | 0.23 to 4.31 | 0.03 |
III(B) Astrocytomas |
1505 | 8.64 | 8.86 | 80 | 13.59 | -0.97 | 1992–2010 | -2.10 to 0.16 | 0.09 |
III(C) Intracranial and intraspinal embryonal tumors |
805 | 4.61 | 4.73 | 45 | 7.33 | -0.45 | 1992–2010 | -1.77 to 0.89 | 0.49 |
III(D) Other gliomas |
475 | 2.72 | 2.79 | 25 | 4.29 | 1.27 | 1992–2010 | -0.82 to 3.41 | 0.22 |
III(E) Other specified intracranial and intraspinal neoplasms |
45 | 0.25 | 0.26 | 5 | 0.40 | 11.39 | 1992–2010 | 7.70 to 15.20 | < 0.01 |
III(F) Unspecified intracranial and intraspinal neoplasms |
195 | 1.13 | 1.16 | 10 | 1.79 | 2.37 | 1992–2010 | -2.96 to 7.98 | 0.37 |
| CNS and miscellaneous intracranial and intraspinal neoplasms including non-malignancies | 3770 | 21.69 | 22.23 | 195 | 34.25 | -0.03 | 1992–2010 | -0.51 to 0.45 | 0.89 |
III(A) Ependymomas and choroid plexus tumor including non-malignancies |
360 | 2.07 | 2.12 | 15 | 3.34 | 1.58 | 1992–2010 | -0.22 to 3.42 | 0.08 |
III(B) Astrocytomas including non-malignancies |
1545 | 8.90 | 9.12 | 85 | 13.98 | -0.98 | 1992–2010 | -2.04 to 0.09 | 0.07 |
III(C) Intracranial and intraspinal embryonal tumors including non-malignancies |
805 | 4.61 | 4.73 | 40 | 7.33 | -0.45 | 1992–2010 | -1.77 to 0.89 | 0.49 |
III(D) Other gliomas including non-malignancies |
475 | 2.73 | 2.80 | 25 | 4.29 | 1.29 | 1992–2010 | -0.80 to 3.43 | 0.21 |
III(E) Other specified intracranial and intraspinal neoplasms including non-malignancies |
320 | 1.85 | 1.90 | 20 | 2.89 | 1.88 | 1992–2010 | -1.08 to 4.93 | 0.20 |
III(F) Unspecified intracranial and intraspinal neoplasms including non-malignancies |
265 | 1.52 | 1.56 | 15 | 2.42 | 0.25 | 1992–2010 | -4.24 to 4.95 | 0.91 |
| Neuroblastoma and other peripheral nervous cell tumors | 1260 | 7.26 | 7.44 | 65 | 12.03 | 0.74 | 1992–2010 | -0.45 to 1.95 | 0.21 |
IV(A) Neuroblastoma and ganglioneuroblastoma |
1245 | 7.15 | 7.33 | 65 | 11.86 | 0.83 | 1992–2010 | -0.30 to 1.98 | 0.14 |
| Retinoblastoma | 430 | 2.47 | 2.54 | 25 | 4.13 | 0.30 | 1992–2010 | -1.66 to 2.30 | 0.75 |
| Renal tumours | 950 | 5.47 | 5.60 | 50 | 8.90 | -0.68 | 1992–2010 | -2.07 to 0.73 | 0.32 |
VI(A) Nephroblastoma and other nonepithelial renal tumors |
895 | 5.16 | 5.29 | 50 | 8.42 | -0.71 | 1992–2010 | -2.16 to 0.77 | 0.33 |
VI(B) Renal carcinomas |
30 | 0.18 | 0.19 | 5 | 0.28 | -5.27 | 1992–2010 | -9.53 to -0.81 | 0.02 |
| Hepatic tumours | 260 | 1.49 | 1.53 | 15 | 2.47 | 1.35 | 1992–2010 | -0.13 to 2.86 | 0.07 |
VII(A) Hepatoblastoma |
210 | 1.23 | 1.26 | 10 | 2.07 | 2.42 | 1992–2010 | 0.44 to 4.42 | 0.02 |
VII(B) Hepatic carcinomas |
35 | 0.21 | 0.22 | 5 | 0.33 | -3.00 | 1992–2010 | -7.92 to 2.18 | 0.23 |
| Malignant bone tumours | 760 | 4.39 | 4.50 | 40 | 6.76 | -0.50 | 1992–2010 | -1.66 to 0.66 | 0.37 |
VIII(A) Osteosarcomas |
380 | 2.19 | 2.24 | 20 | 3.35 | -0.89 | 1992–2010 | -2.61 to 0.85 | 0.29 |
VIII(C) Ewing tumor and related sarcomas of bone |
300 | 1.73 | 1.77 | 15 | 2.66 | 0.63 | 1992–2010 | -1.27 to 2.57 | 0.49 |
VIII(D) Other specified malignant bone tumors |
30 | 0.17 | 0.18 | 0 | 0.27 | -3.39 | 1992–2010 | -7.70 to 1.12 | 0.13 |
VIII(E) Unspecified malignant bone tumors |
35 | 0.22 | 0.22 | 5 | 0.34 | -0.89 | 1992–2010 | -5.83 to 4.31 | 0.72 |
| Soft tissue and other extraosseous sarcomas | 1060 | 6.08 | 6.23 | 55 | 9.60 | -0.08 | 1992–2010 | -1.46 to 1.31 | 0.90 |
IX(A) Rhabdomyosarcomas |
530 | 3.04 | 3.12 | 30 | 4.83 | -0.52 | 1992–2010 | -2.37 to 1.36 | 0.56 |
IX(B) Fibrosarcomas, peripheral nerve sheath tumors, and other fibrous neoplasms |
100 | 0.57 | 0.58 | 5 | 0.91 | 0.41 | 1992–2010 | -3.51 to 4.49 | 0.83 |
IX(D) Other specified soft tissue sarcomas |
305 | 1.75 | 1.79 | 15 | 2.73 | 0.25 | 1992–2010 | -2.18 to 2.74 | 0.83 |
IX(E) Unspecified soft tissue sarcomas |
125 | 0.71 | 0.73 | 5 | 1.13 | 0.40 | 1992–2010 | -3.38 to 4.33 | 0.83 |
| Germ cell tumors, trophoblastic tumors, and neoplasms of gonads | 555 | 3.19 | 3.27 | 30 | 5.05 | -0.38 | 1992–2010 | -1.64 to 0.90 | 0.54 |
X(A) Intracranial and intraspinal germ cell tumors |
155 | 0.91 | 0.94 | 10 | 1.42 | 1.91 | 1992–2010 | -0.88 to 4.79 | 0.17 |
X(B) Malignant extracranial and extragonadal germ cell tumors |
130 | 0.76 | 0.78 | 10 | 1.26 | 1.20 | 1992–2010 | -1.12 to 3.57 | 0.29 |
X(C) Malignant gonadal germ cell tumors |
230 | 1.33 | 1.36 | 10 | 2.07 | -2.25 | 1992–2010 | -4.42 to -0.03 | 0.05 |
| Other malignant epithelial neoplasms and malignant melanomas | 670 | 3.86 | 3.95 | 35 | 5.99 | 2.45 | 1992–2010 | 0.23 to 4.72 | 0.03 |
XI(A) Adrenocortical carcinomas |
35 | 0.20 | 0.20 | 5 | 0.32 | 4.22 | 1992–2010 | -0.95 to 9.66 | 0.10 |
XI(B) Thyroid carcinomas |
260 | 1.49 | 1.53 | 10 | 2.29 | 4.20 | 1992–2010 | 1.37 to 7.11 | 0.01 |
XI(D) Malignant melanomas |
155 | 0.87 | 0.89 | 5 | 1.36 | 2.68 | 1992–2010 | 0.08 to 5.35 | 0.04 |
XI(F) Other and unspecified carcinomas |
205 | 1.19 | 1.22 | 10 | 1.85 | -0.84 | 1992–2010 | -3.73 to 2.13 | 0.56 |
| Other and unspecified malignant neoplasms | 280 | 1.61 | 1.65 | 15 | 2.61 | 2.78 | 1992–2010 | -0.02 to 5.65 | 0.05 |
XII(A) Other specified malignant tumors |
35 | 0.21 | 0.22 | 5 | 0.35 | 15.83 | 1992–1999 | 5.45 to 27.22 | 0.01 |
| -10.31 | 1999–2006 | -33.63 to 21.19 | 0.44 | ||||||
| 32.16 | 2006–2010 | 12.48 to 55.27 | < 0.01 | ||||||
XII(B) Other unspecified malignant tumors |
245 | 1.40 | 1.43 | 10 | 2.26 | 1.68 | 1992–2010 | -1.42 to 4.88 | 0.27 |
| Males | |||||||||
| All childhood cancers (malignancies only) | 9135 | 97.36 | 100.00 | 480 | 163.68 | 0.52 | 1992–2010 | 0.16 to 0.88 | 0.01 |
| All childhood cancers including non-malignancies brain | 9380 | 100.00 | 102.72 | 495 | 168.01 | 0.45 | 1992–2010 | 0.09 to 0.81 | 0.02 |
| Leukemias, myeloproliferative diseases, and myelodysplastic diseases | 3000 | 32.03 | 32.90 | 160 | 54.26 | 0.82 | 1992–2010 | 0.03 to 1.62 | 0.04 |
I(A) Lymphoid leukemias |
2420 | 25.80 | 26.50 | 125 | 43.73 | 0.82 | 1992–2010 | 0.05 to 1.60 | 0.04 |
Lymphoid leukemias, precursor cell leukemias |
2280 | 24.31 | 24.97 | 120 | 41.14 | 0.19 | 1992–2010 | -0.76 to 1.16 | 0.68 |
I(B) Acute myeloid leukemias |
375 | 3.99 | 4.10 | 20 | 6.74 | -0.50 | 1992–2010 | -2.71 to 1.75 | 0.64 |
I(C) Chronic myeloproliferative diseases |
75 | 0.80 | 0.82 | 5 | 1.35 | -0.43 | 1992–2010 | -4.02 to 3.28 | 0.80 |
I(D) Myelodysplastic syndrome and other myeloproliferative diseases |
45 | 0.50 | 0.51 | 0 | 0.86 | 7.68 | 1992–2010 | 2.51 to 13.11 | 0.01 |
I(E) Unspecified and other specified leukemias |
90 | 0.94 | 0.96 | 5 | 1.58 | 0.97 | 1992–2010 | -4.92 to 7.24 | 0.74 |
| Lymphomas and reticuloendothelial neoplasms | 1260 | 13.46 | 13.82 | 70 | 22.04 | 0.51 | 1992–2010 | -0.50 to 1.53 | 0.30 |
II(A) Hodgkin lymphomas |
415 | 4.45 | 4.57 | 25 | 7.18 | 0.61 | 1992–2010 | -1.39 to 2.66 | 0.53 |
II(B) Non-Hodgkin lymphomas (except Burkitt lymphoma) |
400 | 4.28 | 4.39 | 20 | 7.03 | 0.47 | 1992–2010 | -1.32 to 2.30 | 0.59 |
II(C) Burkitt lymphoma |
230 | 2.42 | 2.49 | 15 | 3.94 | -2.72 | 1992–2010 | -6.22 to 0.90 | 0.13 |
II(D) Miscellaneous lymphoreticular neoplasms |
90 | 0.95 | 0.97 | 5 | 1.63 | 6.82 | 1992–2010 | 2.15 to 11.71 | 0.01 |
II(E) Unspecified lymphomas |
130 | 1.36 | 1.40 | 10 | 2.25 | 3.29 | 1992–2010 | 0.50 to 6.15 | 0.02 |
| CNS and miscellaneous intracranial and intraspinal neoplasms | 1795 | 19.13 | 19.65 | 95 | 31.86 | 0.12 | 1992–2010 | -0.85 to 1.11 | 0.79 |
III(A) Ependymomas and choroid plexus tumor |
185 | 1.96 | 2.02 | 10 | 3.32 | 1.71 | 1992–2010 | -0.81 to 4.29 | 0.17 |
III(B) Astrocytomas |
770 | 8.18 | 8.40 | 40 | 13.56 | -0.83 | 1992–2010 | -2.71 to 1.09 | 0.37 |
III(C) Intracranial and intraspinal embryonal tumors |
480 | 5.16 | 5.30 | 25 | 8.62 | -0.38 | 1992–2010 | -1.96 to 1.23 | 0.62 |
III(D) Other gliomas |
240 | 2.55 | 2.62 | 10 | 4.23 | 0.99 | 1992–2010 | -1.77 to 3.82 | 0.46 |
III(F) Unspecified intracranial and intraspinal neoplasms |
100 | 1.07 | 1.10 | 5 | 1.78 | 1.95 | 1992–2010 | -2.46 to 6.56 | 0.37 |
| CNS and miscellaneous intracranial and intraspinal neoplasms including non-malignancies | 2040 | 21.77 | 22.36 | 105 | 36.19 | -0.12 | 1992–2010 | -0.93 to 0.69 | 0.75 |
III(A) Ependymomas and choroid plexus tumor including non-malignancies |
205 | 2.20 | 2.26 | 10 | 3.70 | 0.94 | 1992–2010 | -1.62 to 3.56 | 0.45 |
III(B) Astrocytomas including non-malignancies |
795 | 8.48 | 8.71 | 45 | 14.05 | -0.83 | 1992–2010 | -2.61 to 0.98 | 0.34 |
III(C) Intracranial and intraspinal embryonal tumors including non-malignancies |
485 | 5.16 | 5.30 | 25 | 8.62 | -0.38 | 1992–2010 | -1.96 to 1.23 | 0.62 |
III(D) Other gliomas including non-malignancies |
240 | 2.56 | 2.63 | 10 | 4.25 | 1.02 | 1992–2010 | -1.70 to 3.81 | 0.44 |
III(E) Other specified intracranial and intraspinal neoplasms including non-malignancies |
170 | 1.86 | 1.91 | 10 | 3.04 | -0.17 | 1992–2010 | -3.67 to 3.45 | 0.92 |
III(F) Unspecified intracranial and intraspinal neoplasms including non-malignancies |
145 | 1.52 | 1.57 | 10 | 2.53 | -1.41 | 1992–2010 | -4.66 to 1.94 | 0.38 |
| Neuroblastoma and other peripheral nervous cell tumors | 650 | 6.94 | 7.13 | 35 | 12.15 | 1.37 | 1992–2010 | 0.15 to 2.60 | 0.03 |
IV(A) Neuroblastoma and ganglioneuroblastoma |
645 | 6.86 | 7.04 | 35 | 12.01 | 1.36 | 1992–2010 | 0.14 to 2.60 | 0.03 |
| Retinoblastoma | 215 | 2.30 | 2.37 | 10 | 4.04 | -1.30 | 1992–2010 | -3.76 to 1.23 | 0.29 |
| Renal tumours | 425 | 4.53 | 4.65 | 25 | 7.80 | -0.25 | 1992–2010 | -2.38 to 1.93 | 0.81 |
VI(A) Nephroblastoma and other nonepithelial renal tumors |
400 | 4.24 | 4.36 | 20 | 7.33 | -0.36 | 1992–2010 | -2.60 to 1.94 | 0.74 |
| Hepatic tumours | 160 | 1.73 | 1.77 | 5 | 3.00 | 2.18 | 1992–2010 | 0.01 to 4.40 | 0.05 |
VII(A) Hepatoblastoma |
130 | 1.41 | 1.45 | 10 | 2.47 | 3.22 | 1992–2010 | 0.60 to 5.91 | 0.02 |
| Malignant bone tumours | 390 | 4.16 | 4.27 | 20 | 6.74 | 0.11 | 1992–2010 | -1.86 to 2.12 | 0.91 |
VIII(A) Osteosarcomas |
195 | 2.04 | 2.09 | 10 | 3.29 | -1.52 | 1992–2010 | -4.19 to 1.22 | 0.25 |
VIII(C) Ewing tumor and related sarcomas of bone |
160 | 1.70 | 1.74 | 10 | 2.76 | 2.28 | 1992–2010 | -0.81 to 5.47 | 0.14 |
| Soft tissue and other extraosseous sarcomas | 565 | 6.05 | 6.21 | 25 | 10.02 | -0.84 | 1992–2010 | -2.46 to 0.82 | 0.30 |
IX(A) Rhabdomyosarcomas |
290 | 3.13 | 3.22 | 15 | 5.22 | -0.87 | 1992–2010 | -2.96 to 1.26 | 0.40 |
IX(B) Fibrosarcomas, peripheral nerve sheath tumors, and other fibrous neoplasms |
50 | 0.53 | 0.55 | 5 | 0.90 | 0.12 | 1992–2010 | -4.22 to 4.65 | 0.96 |
IX(D) Other specified soft tissue sarcomas |
155 | 1.66 | 1.71 | 5 | 2.72 | -1.02 | 1992–2010 | -4.58 to 2.66 | 0.56 |
IX(E) Unspecified soft tissue sarcomas |
70 | 0.71 | 0.73 | 5 | 1.18 | 0.16 | 1992–2010 | -3.19 to 3.62 | 0.92 |
| Germ cell tumors, trophoblastic tumors, and neoplasms of gonads | 255 | 2.72 | 2.79 | 10 | 4.58 | -0.49 | 1992–2010 | -2.41 to 1.46 | 0.60 |
X(A) Intracranial and intraspinal germ cell tumors |
110 | 1.17 | 1.20 | 5 | 1.92 | 1.89 | 1992–2010 | -1.80 to 5.72 | 0.30 |
X(B) Malignant extracranial and extragonadal germ cell tumors |
45 | 0.50 | 0.51 | 0 | 0.88 | 1.15 | 1992–2010 | -4.30 to 6.91 | 0.67 |
X(C) Malignant gonadal germ cell tumors |
90 | 0.93 | 0.95 | 5 | 1.57 | -4.02 | 1992–2010 | -6.71 to -1.24 | 0.01 |
| Other malignant epithelial neoplasms and malignant melanomas | 270 | 2.87 | 2.95 | 15 | 4.70 | 1.61 | 1992–2010 | -1.37 to 4.69 | 0.27 |
XI(B) Thyroid carcinomas |
75 | 0.77 | 0.79 | 5 | 1.24 | 2.88 | 1992–2010 | -1.05 to 6.98 | 0.14 |
XI(D) Malignant melanomas |
75 | 0.84 | 0.87 | 5 | 1.38 | 3.19 | 1992–2010 | -0.89 to 7.44 | 0.12 |
XI(F) Other and unspecified carcinomas |
95 | 1.03 | 1.06 | 5 | 1.71 | -0.22 | 1992–2010 | -4.22 to 3.94 | 0.91 |
| Other and unspecified malignant neoplasms | 135 | 1.45 | 1.49 | 10 | 2.49 | 3.86 | 1992–2010 | -0.55 to 8.46 | 0.08 |
XII(B) Other unspecified malignant tumors |
120 | 1.28 | 1.31 | 5 | 2.19 | 2.31 | 1992–2010 | -2.24 to 7.08 | 0.30 |
| Females | |||||||||
| All childhood cancers (malignancies only) | 7820 | 97.75 | 100.00 | 415 | 147.32 | -0.72 | 1992–2004 | -1.71 to 0.29 | 0.15 |
| 3.23 | 2004–2010 | 0.35 to 6.20 | 0.03 | ||||||
| All childhood cancers including non-malignancies brain | 8000 | 100.00 | 102.30 | 420 | 150.65 | 0.35 | 1992–2010 | -0.22 to 0.92 | 0.22 |
| Leukemias, myeloproliferative diseases, and myelodysplastic diseases | 2480 | 31.02 | 31.74 | 130 | 47.04 | 0.43 | 1992–2010 | -0.32 to 1.19 | 0.24 |
I(A) Lymphoid leukemias |
1885 | 23.58 | 24.13 | 100 | 35.79 | 0.36 | 1992–2010 | -0.57 to 1.30 | 0.43 |
Lymphoid leukemias, precursor cell leukemias |
1795 | 22.45 | 22.96 | 95 | 34.04 | -0.18 | 1992–2010 | -1.31 to 0.96 | 0.74 |
I(B) Acute myeloid leukemias |
380 | 4.80 | 4.91 | 25 | 7.22 | -0.50 | 1992–2010 | -2.55 to 1.60 | 0.62 |
I(C) Chronic myeloproliferative diseases |
70 | 0.82 | 0.84 | 5 | 1.22 | 0.71 | 1992–2010 | -3.90 to 5.55 | 0.75 |
I(D) Myelodysplastic syndrome and other myeloproliferative diseases |
40 | 0.45 | 0.46 | 0 | 0.70 | 1.65 | 1992–2010 | -3.05 to 6.59 | 0.48 |
I(E) Unspecified and other specified leukemias |
105 | 1.36 | 1.39 | 5 | 2.10 | 16.69 | 1992–2001 | 2.75 to 32.52 | 0.02 |
| -34.96 | 2001–2004 | Table 1 - Footnote – | 0.45 | ||||||
| 27.43 | 2004–2010 | 4.88 to 54.84 | 0.02 | ||||||
| Lymphomas and reticuloendothelial neoplasms | 640 | 8.00 | 8.18 | 35 | 11.72 | 0.31 | 1992–2010 | -1.08 to 1.72 | 0.64 |
II(A) Hodgkin lymphomas |
295 | 3.70 | 3.78 | 15 | 5.34 | -0.25 | 1992–2010 | -1.88 to 1.41 | 0.75 |
II(B) Non-Hodgkin lymphomas (except Burkitt lymphoma) |
200 | 2.47 | 2.53 | 10 | 3.66 | -0.61 | 1992–2010 | -3.66 to 2.53 | 0.68 |
II(C) Burkitt lymphoma |
40 | 0.54 | 0.55 | 0 | 0.79 | -1.13 | 1992–2010 | -5.41 to 3.34 | 0.59 |
II(D) Miscellaneous lymphoreticular neoplasms |
40 | 0.51 | 0.52 | 5 | 0.79 | 4.57 | 1992–2010 | 0.72 to 8.57 | 0.02 |
II(E) Unspecified lymphomas |
65 | 0.77 | 0.79 | 0 | 1.14 | 3.29 | 1992–2010 | -1.97 to 8.83 | 0.21 |
| CNS and miscellaneous intracranial and intraspinal neoplasms | 1545 | 19.34 | 19.78 | 80 | 28.89 | 0.07 | 1992–2010 | -0.96 to 1.10 | 0.89 |
III(A) Ependymomas and choroid plexus tumor |
140 | 1.75 | 1.79 | 5 | 2.70 | 2.99 | 1992–2010 | 0.60 to 5.43 | 0.02 |
III(B) Astrocytomas |
735 | 9.19 | 9.40 | 40 | 13.62 | -1.19 | 1992–2010 | -2.76 to 0.39 | 0.13 |
III(C) Intracranial and intraspinal embryonal tumors |
315 | 3.97 | 4.07 | 15 | 5.97 | -0.57 | 1992–2010 | -2.84 to 1.76 | 0.61 |
III(D) Other gliomas |
235 | 2.92 | 2.99 | 15 | 4.34 | 0.88 | 1992–2010 | -1.98 to 3.81 | 0.53 |
III(E) Other specified intracranial and intraspinal neoplasms |
25 | 0.30 | 0.31 | 0 | 0.45 | 11.38 | 1992–2010 | 5.49 to 17.60 | < 0.01 |
III(F) Unspecified intracranial and intraspinal neoplasms |
95 | 1.20 | 1.23 | 5 | 1.80 | 58.43 | 1992–1996 | Table 1 - Footnote – | 0.03 |
| -16.38 | 1996–2001 | -40.10 to 16.75 | 0.25 | ||||||
| 65.74 | 2001–2004 | Table 1 - Footnote – | 0.28 | ||||||
| -28.95 | 2004–2010 | -40.97 to -14.47 | < 0.01 | ||||||
| CNS and miscellaneous intracranial and intraspinal neoplasms including non-malignancies | 1730 | 21.58 | 22.08 | 90 | 32.22 | 0.03 | 1992–2010 | -0.96 to 1.04 | 0.95 |
III(A) Ependymomas and choroid plexus tumor including non-malignancies |
155 | 1.92 | 1.97 | 10 | 2.96 | 2.37 | 1992–2010 | 0.27 to 4.51 | 0.03 |
III(B) Astrocytomas including non-malignancies |
750 | 9.39 | 9.60 | 40 | 13.91 | -1.21 | 1992–2010 | -2.71 to 0.32 | 0.11 |
III(C) Intracranial and intraspinal embryonal tumors including non-malignancies |
315 | 3.97 | 4.07 | 20 | 5.97 | -0.57 | 1992–2010 | -2.84 to 1.76 | 0.61 |
III(D) Other gliomas including non-malignancies |
235 | 2.92 | 2.99 | 15 | 4.34 | 0.88 | 1992–2010 | -1.98 to 3.81 | 0.53 |
III(E) Other specified intracranial and intraspinal neoplasms including non-malignancies |
150 | 1.85 | 1.89 | 10 | 2.74 | 4.03 | 1992–2010 | 0.08 to 8.14 | 0.05 |
III(F) Unspecified intracranial and intraspinal neoplasms including non-malignancies |
120 | 1.52 | 1.56 | 5 | 2.29 | 8.90 | 1992–2005 | 1.10 to 17.31 | 0.03 |
| -31.76 | 2005–2010 | -57.68 to 10.04 | 0.11 | ||||||
| Neuroblastoma and other peripheral nervous cell tumors | 610 | 7.62 | 7.80 | 35 | 11.91 | 0.04 | 1992–2010 | -1.62 to 1.74 | 0.96 |
IV(A) Neuroblastoma and ganglioneuroblastoma |
595 | 7.49 | 7.66 | 30 | 11.71 | 0.22 | 1992–2010 | -1.38 to 1.85 | 0.77 |
| Retinoblastoma | 215 | 2.67 | 2.74 | 10 | 4.23 | 2.23 | 1992–2010 | -0.63 to 5.16 | 0.12 |
| Renal tumours | 525 | 6.56 | 6.71 | 30 | 10.05 | -0.85 | 1992–2010 | -2.43 to 0.75 | 0.28 |
VI(A) Nephroblastoma and other nonepithelial renal tumors |
500 | 6.24 | 6.38 | 25 | 9.56 | -0.76 | 1992–2010 | -2.48 to 0.99 | 0.37 |
| Hepatic tumours | 100 | 1.21 | 1.24 | 5 | 1.92 | 0.29 | 1992–2010 | -3.04 to 3.75 | 0.86 |
VII(A) Hepatoblastoma |
85 | 1.02 | 1.05 | 5 | 1.64 | 1.58 | 1992–2010 | -2.13 to 5.44 | 0.39 |
| Malignant bone tumours | 375 | 4.66 | 4.77 | 15 | 6.77 | -1.21 | 1992–2010 | -2.76 to 0.37 | 0.13 |
VIII(A) Osteosarcomas |
190 | 2.36 | 2.42 | 10 | 3.42 | -0.43 | 1992–2010 | -2.60 to 1.79 | 0.68 |
VIII(C) Ewing tumor and related sarcomas of bone |
140 | 1.76 | 1.80 | 5 | 2.55 | -0.63 | 1992–2010 | -2.96 to 1.77 | 0.59 |
| Soft tissue and other extraosseous sarcomas | 490 | 6.11 | 6.25 | 25 | 9.17 | 0.82 | 1992–2010 | -0.66 to 2.33 | 0.26 |
IX(A) Rhabdomyosarcomas |
235 | 2.94 | 3.00 | 10 | 4.42 | -0.12 | 1992–2010 | -2.14 to 1.94 | 0.90 |
IX(B) Fibrosarcomas, peripheral nerve sheath tumors, and other fibrous neoplasms |
50 | 0.61 | 0.63 | 5 | 0.92 | 0.58 | 1992–2010 | -3.10 to 4.39 | 0.75 |
IX(D) Other specified soft tissue sarcomas |
150 | 1.85 | 1.89 | 10 | 2.75 | 2.07 | 1992–2010 | -0.45 to 4.65 | 0.10 |
IX(E) Unspecified soft tissue sarcomas |
60 | 0.71 | 0.73 | 0 | 1.07 | 0.86 | 1992–2010 | -4.36 to 6.37 | 0.74 |
| Germ cell tumors, trophoblastic tumors, and neoplasms of gonads | 300 | 3.74 | 3.82 | 20 | 5.55 | -0.35 | 1992–2010 | -2.58 to 1.93 | 0.75 |
X(A) Intracranial and intraspinal germ cell tumors |
50 | 0.61 | 0.63 | 0 | 0.89 | 3.43 | 1992–2010 | -0.58 to 7.59 | 0.09 |
X(B) Malignant extracranial and extragonadal germ cell tumors |
85 | 1.06 | 1.09 | 5 | 1.67 | 1.10 | 1992–2010 | -1.49 to 3.75 | 0.39 |
X(C) Malignant gonadal germ cell tumors |
145 | 1.80 | 1.84 | 10 | 2.60 | -1.39 | 1992–2010 | -4.72 to 2.06 | 0.40 |
| Other malignant epithelial neoplasms and malignant melanomas | 405 | 5.01 | 5.13 | 20 | 7.34 | 2.93 | 1992–2010 | 0.56 to 5.36 | 0.02 |
XI(B) Thyroid carcinomas |
185 | 2.34 | 2.39 | 10 | 3.40 | 4.85 | 1992–2010 | 1.80 to 7.99 | < 0.01 |
XI(D) Malignant melanomas |
75 | 0.90 | 0.92 | 5 | 1.34 | 1.27 | 1992–2010 | -2.84 to 5.57 | 0.53 |
XI(F) Other and unspecified carcinomas |
110 | 1.36 | 1.39 | 5 | 1.99 | -0.80 | 1992–2010 | -4.17 to 2.68 | 0.63 |
| Other and unspecified malignant neoplasms | 145 | 1.80 | 1.84 | 5 | 2.73 | 1.46 | 1992–2010 | -1.48 to 4.50 | 0.31 |
XII(B) Other unspecified malignant tumors |
125 | 1.54 | 1.57 | 5 | 2.34 | 1.00 | 1992–2010 | -2.56 to 4.69 | 0.57 |
| Data sources: Canadian Cancer Registry (CCR) database at Statistics Canada and Quebec Cancer Registry (2008-2010). | |||||||||
| Total cases | % (including non-malignancies) |
% (malignancies only) |
Average annual cases |
Average ASIR |
APC | Year | 95% CI | p-value | |
|---|---|---|---|---|---|---|---|---|---|
| Age <1 year | |||||||||
| All childhood cancers (malignancies only) | 1705 | 98.10 | 100.00 | 85 | 248.64 | -0.16 | 1992–2010 | -1.21 to 0.90 | 0.75 |
| All childhood cancers including non-malignancies brain | 1735 | 100.00 | 101.94 | 95 | 253.47 | -0.20 | 1992–2010 | -1.23 to 0.84 | 0.69 |
| Leukemias, myeloproliferative diseases, and myelodysplastic diseases | 340 | 19.38 | 19.75 | 20 | 49.23 | -0.27 | 1992–2010 | -1.95 to 1.44 | 0.74 |
I(A) Lymphoid leukemias |
125 | 7.15 | 7.29 | 5 | 18.22 | -1.83 | 1992–2010 | -4.62 to 1.04 | 0.19 |
Lymphoid leukemias, precursor cell leukemias |
120 | 6.81 | 6.94 | 5 | 17.30 | -2.54 | 1992–2010 | -5.45 to 0.46 | 0.09 |
I(B) Acute myeloid leukemias |
110 | 6.40 | 6.53 | 5 | 16.19 | -2.06 | 1992–2010 | -4.49 to 0.43 | 0.10 |
I(C) Chronic myeloproliferative diseases |
35 | 2.13 | 2.18 | 0 | 5.37 | -0.10 | 1992–2010 | -4.01 to 3.97 | 0.96 |
I(E) Unspecified and other specified leukemias |
45 | 2.60 | 2.65 | 5 | 6.67 | 0.97 | 1992–2010 | -4.41 to 6.66 | 0.71 |
| Lymphomas and reticuloendothelial neoplasms | 55 | 3.17 | 3.23 | 5 | 8.05 | -2.81 | 1992–2010 | -6.55 to 1.08 | 0.14 |
II(D) Miscellaneous lymphoreticular neoplasms |
35 | 1.90 | 1.94 | 0 | 4.78 | -4.43 | 1992–2010 | -8.14 to -0.58 | 0.03 |
| CNS and miscellaneous intracranial and intraspinal neoplasms | 185 | 10.78 | 10.99 | 10 | 27.33 | 0.41 | 1992–2010 | -2.29 to 3.18 | 0.75 |
III(A) Ependymomas and choroid plexus tumor |
35 | 2.02 | 2.06 | 0 | 5.15 | 5.60 | 1992–2010 | 1.94 to 9.38 | < 0.01 |
III(B) Astrocytomas |
60 | 3.69 | 3.76 | 5 | 9.26 | -0.24 | 1992–2010 | -4.22 to 3.91 | 0.90 |
III(C) Intracranial and intraspinal embryonal tumors |
50 | 2.88 | 2.94 | 0 | 7.40 | -1.01 | 1992–2010 | -5.92 to 4.15 | 0.68 |
| CNS and miscellaneous intracranial and intraspinal neoplasms including non-malignancies | 220 | 12.69 | 12.93 | 10 | 32.16 | 0.19 | 1992–2010 | -1.64 to 2.06 | 0.83 |
III(A) Ependymomas and choroid plexus tumor including non-malignancies |
40 | 2.25 | 2.29 | 5 | 5.73 | 5.04 | 1992–2010 | 1.20 to 9.03 | 0.01 |
III(B) Astrocytomas including non-malignancies |
65 | 3.81 | 3.88 | 5 | 9.57 | -0.16 | 1992–2010 | -4.06 to 3.90 | 0.94 |
III(C) Intracranial and intraspinal embryonal tumors including non-malignancies |
50 | 2.88 | 2.94 | 5 | 7.40 | -1.01 | 1992–2010 | -5.92 to 4.15 | 0.68 |
III(F) Unspecified intracranial and intraspinal neoplasms including non-malignancies |
30 | 1.90 | 1.94 | 0 | 4.78 | -5.87 | 1992–2010 | -8.37 to -3.30 | < 0.01 |
| Neuroblastoma and other peripheral nervous cell tumors | 445 | 25.61 | 26.10 | 25 | 64.56 | -14.00 | 1992–1996 | -28.97 to 4.13 | 0.11 |
| 2.78 | 1996–2010 | -0.50 to 6.17 | 0.09 | ||||||
IV(A) Neuroblastoma and ganglioneuroblastoma |
440 | 25.55 | 26.04 | 25 | 64.41 | -14.22 | 1992–1996 | -29.13 to 3.83 | 0.11 |
| 2.86 | 1996–2010 | -0.43 to 6.25 | 0.08 | ||||||
| Retinoblastoma | 150 | 8.59 | 8.76 | 5 | 21.70 | -0.60 | 1992–2010 | -4.08 to 3.02 | 0.73 |
| Renal tumours | 130 | 7.38 | 7.52 | 5 | 18.89 | 0.38 | 1992–2010 | -2.72 to 3.58 | 0.80 |
VI(A) Nephroblastoma and other nonepithelial renal tumors |
120 | 6.98 | 7.11 | 5 | 17.86 | 0.65 | 1992–2010 | -2.34 to 3.74 | 0.65 |
| Hepatic tumours | 60 | 3.58 | 3.64 | 5 | 9.16 | 1.95 | 1992–2010 | -3.15 to 7.31 | 0.44 |
VII(A) Hepatoblastoma |
60 | 3.46 | 3.53 | 0 | 8.85 | 1.93 | 1992–2010 | -3.02 to 7.12 | 0.43 |
| Soft tissue and other extraosseous sarcomas | 110 | 6.29 | 6.41 | 5 | 15.93 | 0.40 | 1992–2010 | -2.95 to 3.87 | 0.81 |
IX(A) Rhabdomyosarcomas |
30 | 1.79 | 1.82 | 5 | 4.53 | -4.82 | 1992–2010 | -9.23 to -0.19 | 0.04 |
IX(B) Fibrosarcomas, peripheral nerve sheath tumors, and other fibrous neoplasms |
30 | 1.85 | 1.88 | 0 | 4.70 | 0.73 | 1992–2010 | -4.53 to 6.27 | 0.78 |
| Germ cell tumors, trophoblastic tumors, and neoplasms of gonads | 105 | 6.00 | 6.11 | 5 | 15.20 | 1.86 | 1992–2010 | -1.38 to 5.21 | 0.25 |
X(B) Malignant extracranial and extragonadal germ cell tumors |
65 | 3.81 | 3.88 | 5 | 9.71 | 3.44 | 1992–2010 | 0.17 to 6.82 | 0.04 |
X(C) Malignant gonadal germ cell tumors |
30 | 1.56 | 1.59 | 5 | 3.87 | -0.28 | 1992–2010 | -5.42 to 5.15 | 0.91 |
| Other malignant epithelial neoplasms and malignant melanomas | 50 | 2.88 | 2.94 | 5 | 7.34 | 1.03 | 1992–2010 | -3.63 to 5.92 | 0.65 |
XI(F) Other and unspecified carcinomas |
30 | 1.73 | 1.76 | 5 | 4.36 | -2.09 | 1992–2010 | -6.45 to 2.47 | 0.34 |
| Other and unspecified malignant neoplasms | 70 | 4.15 | 4.23 | 0 | 10.52 | -5.42 | 1992–2010 | -10.35 to -0.21 | 0.04 |
XII(B) Other unspecified malignant tumors |
65 | 3.81 | 3.88 | 5 | 9.63 | -6.47 | 1992–2010 | -11.68 to -0.96 | 0.02 |
| Age 1 to 4 years | |||||||||
| All childhood cancers (malignancies only) | 6165 | 98.69 | 100.00 | 325 | 219.32 | 0.89 | 1992–2010 | 0.44 to 1.34 | < 0.01 |
| All childhood cancers including non-malignancies brain | 6245 | 100.00 | 101.33 | 325 | 222.24 | 0.87 | 1992–2010 | 0.42 to 1.32 | < 0.01 |
| Leukemias, myeloproliferative diseases, and myelodysplastic diseases | 2640 | 42.27 | 42.83 | 135 | 93.95 | 0.82 | 1992–2010 | -0.10 to 1.74 | 0.08 |
I(A) Lymphoid leukemias |
2265 | 36.25 | 36.73 | 120 | 80.59 | 0.92 | 1992–2010 | 0.09 to 1.76 | 0.03 |
Lymphoid leukemias, precursor cell leukemias |
2160 | 34.63 | 35.09 | 115 | 76.82 | 0.43 | 1992–2010 | -0.61 to 1.49 | 0.39 |
I(B) Acute myeloid leukemias |
260 | 4.13 | 4.19 | 15 | 9.15 | -0.11 | 1992–2010 | -2.80 to 2.65 | 0.93 |
I(D) Myelodysplastic syndrome and other myeloproliferative diseases |
30 | 0.43 | 0.44 | 0 | 0.98 | 17.66 | 1992–2002 | 8.49 to 27.61 | < 0.01 |
| -7.10 | 2002–2010 | -20.03 to 7.91 | 0.31 | ||||||
I(E) Unspecified and other specified leukemias |
65 | 1.04 | 1.05 | 0 | 2.32 | 2.60 | 1992–2010 | -2.41 to 7.86 | 0.29 |
| Lymphomas and reticuloendothelial neoplasms | 300 | 4.77 | 4.83 | 15 | 10.63 | 2.22 | 1992–2010 | -0.03 to 4.52 | 0.05 |
II(B) Non-Hodgkin lymphomas (except Burkitt lymphoma) |
130 | 2.05 | 2.08 | 5 | 4.59 | 3.03 | 1992–2010 | -0.39 to 6.56 | 0.08 |
II(C) Burkitt lymphoma |
60 | 0.94 | 0.96 | 5 | 2.08 | -2.82 | 1992–2010 | -5.91 to 0.36 | 0.08 |
II(D) Miscellaneous lymphoreticular neoplasms |
50 | 0.82 | 0.83 | 5 | 1.82 | 6.91 | 1992–2010 | 2.31 to 11.73 | 0.01 |
II(E) Unspecified lymphomas |
35 | 0.54 | 0.55 | 0 | 1.23 | 2.09 | 1992–2010 | -2.89 to 7.34 | 0.40 |
| CNS and miscellaneous intracranial and intraspinal neoplasms | 1070 | 17.11 | 17.34 | 55 | 38.10 | 1.20 | 1992–2010 | -0.09 to 2.51 | 0.07 |
III(A) Ependymomas and choroid plexus tumor |
170 | 2.69 | 2.73 | 10 | 5.97 | 1.59 | 1992–2010 | -0.70 to 3.94 | 0.16 |
III(B) Astrocytomas |
415 | 6.61 | 6.70 | 20 | 14.70 | 0.52 | 1992–2010 | -1.59 to 2.67 | 0.61 |
III(C) Intracranial and intraspinal embryonal tumors |
290 | 4.64 | 4.70 | 15 | 10.32 | 1.20 | 1992–2010 | -1.22 to 3.68 | 0.31 |
III(D) Other gliomas |
135 | 2.15 | 2.17 | 5 | 4.80 | 1.46 | 1992–2010 | -1.37 to 4.38 | 0.29 |
III(F) Unspecified intracranial and intraspinal neoplasms |
55 | 0.88 | 0.89 | 5 | 1.98 | 1.15 | 1992–2010 | -4.95 to 7.65 | 0.70 |
| CNS and miscellaneous intracranial and intraspinal neoplasms including non-malignancies | 1155 | 18.43 | 18.67 | 65 | 41.02 | 1.06 | 1992–2010 | -0.22 to 2.35 | 0.10 |
III(A) Ependymomas and choroid plexus tumor including non-malignancies |
170 | 2.79 | 2.82 | 10 | 6.18 | 1.77 | 1992–2010 | -0.57 to 4.16 | 0.13 |
III(B) Astrocytomas including non-malignancies |
425 | 6.76 | 6.85 | 20 | 15.03 | 0.50 | 1992–2010 | -1.53 to 2.57 | 0.61 |
III(C) Intracranial and intraspinal embryonal tumors including non-malignancies |
290 | 4.64 | 4.70 | 15 | 10.32 | 1.20 | 1992–2010 | -1.22 to 3.68 | 0.31 |
III(D) Other gliomas including non-malignancies |
135 | 2.15 | 2.17 | 10 | 4.80 | 1.46 | 1992–2010 | -1.37 to 4.38 | 0.29 |
III(E) Other specified intracranial and intraspinal neoplasms including non-malignancies |
55 | 0.90 | 0.91 | 0 | 2.02 | 1.12 | 1992–2010 | -2.63 to 5.02 | 0.54 |
III(F) Unspecified intracranial and intraspinal neoplasms including non-malignancies |
75 | 1.20 | 1.22 | 5 | 2.68 | -0.52 | 1992–2010 | -5.58 to 4.81 | 0.84 |
| Neuroblastoma and other peripheral nervous cell tumors | 620 | 9.97 | 10.11 | 35 | 22.22 | 1.62 | 1992–2010 | 0.20 to 3.05 | 0.03 |
IV(A) Neuroblastoma and ganglioneuroblastoma |
620 | 9.88 | 10.01 | 30 | 22.01 | 1.66 | 1992–2010 | 0.28 to 3.07 | 0.02 |
| Retinoblastoma | 260 | 4.18 | 4.23 | 10 | 9.26 | 0.85 | 1992–2010 | -1.56 to 3.32 | 0.47 |
| Renal tumours | 555 | 8.84 | 8.96 | 25 | 19.53 | -0.86 | 1992–2010 | -2.50 to 0.80 | 0.29 |
VI(A) Nephroblastoma and other nonepithelial renal tumors |
540 | 8.61 | 8.73 | 30 | 19.04 | -0.88 | 1992–2010 | -2.62 to 0.89 | 0.31 |
| Hepatic tumours | 145 | 2.34 | 2.37 | 5 | 5.21 | 2.83 | 1992–2010 | 0.04 to 5.70 | 0.05 |
VII(A) Hepatoblastoma |
135 | 2.18 | 2.21 | 5 | 4.87 | 3.73 | 1992–2010 | 1.10 to 6.43 | 0.01 |
| Malignant bone tumours | 60 | 1.02 | 1.04 | 5 | 2.27 | -0.89 | 1992–2010 | -4.79 to 3.18 | 0.65 |
VIII(C) Ewing tumor and related sarcomas of bone |
35 | 0.61 | 0.62 | 5 | 1.35 | 1.67 | 1992–2010 | -3.41 to 7.03 | 0.50 |
| Soft tissue and other extraosseous sarcomas | 280 | 4.48 | 4.54 | 15 | 9.90 | -4.09 | 1992–2003 | -8.31 to 0.33 | 0.07 |
| 8.78 | 2003–2010 | -0.57 to 19.01 | 0.06 | ||||||
IX(A) Rhabdomyosarcomas |
215 | 3.41 | 3.46 | 10 | 7.51 | -5.42 | 1992–2004 | -10.76 to 0.24 | 0.06 |
| 15.86 | 2004–2010 | -1.97 to 36.94 | 0.08 | ||||||
IX(D) Other specified soft tissue sarcomas |
40 | 0.64 | 0.65 | 5 | 1.44 | -1.06 | 1992–2010 | -5.28 to 3.34 | 0.61 |
| Germ cell tumors, trophoblastic tumors, and neoplasms of gonads | 110 | 1.71 | 1.74 | 10 | 3.78 | -1.74 | 1992–2010 | -4.81 to 1.43 | 0.26 |
X(B) Malignant extracranial and extragonadal germ cell tumors |
45 | 0.75 | 0.76 | 0 | 1.66 | -1.78 | 1992–2010 | -4.77 to 1.30 | 0.24 |
X(C) Malignant gonadal germ cell tumors |
35 | 0.61 | 0.62 | 0 | 1.33 | -4.20 | 1992–2010 | -10.68 to 2.75 | 0.21 |
| Other malignant epithelial neoplasms and malignant melanomas | 50 | 0.77 | 0.78 | 0 | 1.71 | 6.00 | 1992–2010 | 0.61 to 11.69 | 0.03 |
| Other and unspecified malignant neoplasms | 75 | 1.22 | 1.23 | 5 | 2.75 | 3.90 | 1992–2010 | -0.81 to 8.83 | 0.10 |
XII(B) Other unspecified malignant tumors |
60 | 1.01 | 1.02 | 5 | 2.28 | 2.71 | 1992–2010 | -3.05 to 8.81 | 0.34 |
| Age 5 to 9 years | |||||||||
| All childhood cancers (malignancies only) | 4335 | 97.31 | 100.00 | 225 | 118.00 | 0.37 | 1992–2010 | -0.01 to 0.76 | 0.05 |
| All childhood cancers including non-malignancies brain | 4460 | 100.00 | 102.77 | 235 | 121.22 | 0.36 | 1992–2010 | 0.00 to 0.73 | 0.05 |
| Leukemias, myeloproliferative diseases, and myelodysplastic diseases | 1485 | 33.30 | 34.22 | 80 | 40.42 | 0.85 | 1992–2010 | -0.14 to 1.86 | 0.09 |
I(A) Lymphoid leukemias |
1235 | 27.70 | 28.46 | 65 | 33.62 | 0.60 | 1992–2010 | -0.45 to 1.66 | 0.25 |
Lymphoid leukemias, precursor cell leukemias |
1165 | 26.06 | 26.78 | 60 | 31.57 | -0.14 | 1992–2010 | -1.27 to 1.01 | 0.80 |
I(B) Acute myeloid leukemias |
160 | 3.57 | 3.66 | 10 | 4.33 | 0.50 | 1992–2010 | -2.89 to 4.01 | 0.76 |
I(E) Unspecified and other specified leukemias |
45 | 1.08 | 1.11 | 0 | 1.31 | 31.75 | 1992–1999 | -2.28 to 77.63 | 0.07 |
| -2.34 | 1999–2010 | -10.19 to 6.20 | 0.55 | ||||||
| Lymphomas and reticuloendothelial neoplasms | 540 | 12.13 | 12.47 | 30 | 14.71 | 0.10 | 1992–2010 | -1.40 to 1.62 | 0.89 |
II(A) Hodgkin lymphomas |
135 | 2.96 | 3.04 | 5 | 3.59 | -1.62 | 1992–2010 | -4.65 to 1.50 | 0.29 |
II(B) Non-Hodgkin lymphomas (except Burkitt lymphoma) |
210 | 4.69 | 4.82 | 15 | 5.66 | -0.59 | 1992–2010 | -3.02 to 1.90 | 0.62 |
II(C) Burkitt lymphoma |
110 | 2.44 | 2.51 | 5 | 2.95 | -0.41 | 1992–2010 | -3.84 to 3.14 | 0.81 |
II(E) Unspecified lymphomas |
65 | 1.46 | 1.50 | 5 | 1.77 | 2.78 | 1992–2010 | -1.89 to 7.67 | 0.23 |
| CNS and miscellaneous intracranial and intraspinal neoplasms | 1140 | 25.57 | 26.27 | 60 | 30.95 | -0.24 | 1992–2010 | -1.38 to 0.92 | 0.67 |
III(A) Ependymomas and choroid plexus tumor |
60 | 1.35 | 1.38 | 5 | 1.62 | -1.11 | 1992–2010 | -5.38 to 3.36 | 0.60 |
III(B) Astrocytomas |
530 | 11.89 | 12.21 | 30 | 14.39 | -0.85 | 1992–2010 | -2.44 to 0.77 | 0.28 |
III(C) Intracranial and intraspinal embryonal tumors |
290 | 6.53 | 6.71 | 15 | 7.87 | -0.67 | 1992–2010 | -3.01 to 1.73 | 0.56 |
III(D) Other gliomas |
190 | 4.19 | 4.31 | 10 | 5.09 | 0.93 | 1992–2010 | -2.26 to 4.23 | 0.55 |
III(F) Unspecified intracranial and intraspinal neoplasms |
55 | 1.28 | 1.31 | 5 | 1.56 | 14.98 | 1992–2005 | 5.25 to 25.61 | < 0.01 |
| -32.87 | 2005–2010 | -55.39 to 1.03 | 0.06 | ||||||
| CNS and miscellaneous intracranial and intraspinal neoplasms including non-malignancies | 1260 | 28.26 | 29.04 | 65 | 34.18 | -0.24 | 1992–2010 | -1.34 to 0.88 | 0.66 |
III(A) Ependymomas and choroid plexus tumor including non-malignancies |
70 | 1.53 | 1.57 | 5 | 1.84 | -2.04 | 1992–2010 | -6.20 to 2.30 | 0.33 |
III(B) Astrocytomas including non-malignancies |
550 | 12.27 | 12.61 | 25 | 14.84 | -0.81 | 1992–2010 | -2.38 to 0.78 | 0.30 |
III(C) Intracranial and intraspinal embryonal tumors including non-malignancies |
290 | 6.53 | 6.71 | 15 | 7.87 | -0.67 | 1992–2010 | -3.01 to 1.73 | 0.56 |
III(D) Other gliomas including non-malignancies |
185 | 4.19 | 4.31 | 10 | 5.09 | 0.93 | 1992–2010 | -2.26 to 4.23 | 0.55 |
III(E) Other specified intracranial and intraspinal neoplasms including non-malignancies |
100 | 2.15 | 2.21 | 5 | 2.60 | 17.06 | 1992–2001 | 4.32 to 31.35 | 0.01 |
| -4.60 | 2001–2010 | -13.20 to 4.85 | 0.30 | ||||||
III(F) Unspecified intracranial and intraspinal neoplasms including non-malignancies |
70 | 1.59 | 1.64 | 5 | 1.94 | 11.58 | 1992–2005 | 2.22 to 21.81 | 0.02 |
| -34.00 | 2005–2010 | -60.57 to 10.46 | 0.11 | ||||||
| Neuroblastoma and other peripheral nervous cell tumors | 150 | 3.41 | 3.50 | 10 | 4.14 | -0.32 | 1992–2010 | -2.89 to 2.31 | 0.80 |
IV(A) Neuroblastoma and ganglioneuroblastoma |
150 | 3.34 | 3.43 | 5 | 4.06 | -0.01 | 1992–2010 | -2.61 to 2.67 | 1.00 |
| Renal tumours | 220 | 4.84 | 4.98 | 15 | 5.83 | -0.83 | 1992–2010 | -3.55 to 1.97 | 0.54 |
VI(A) Nephroblastoma and other nonepithelial renal tumors |
205 | 4.60 | 4.72 | 10 | 5.54 | -0.97 | 1992–2010 | -3.77 to 1.91 | 0.48 |
| Malignant bone tumours | 225 | 4.98 | 5.12 | 10 | 6.03 | -0.95 | 1992–2010 | -4.17 to 2.38 | 0.55 |
VIII(A) Osteosarcomas |
105 | 2.33 | 2.40 | 5 | 2.84 | -0.75 | 1992–2010 | -4.41 to 3.04 | 0.68 |
VIII(C) Ewing tumor and related sarcomas of bone |
95 | 2.20 | 2.26 | 5 | 2.66 | -1.26 | 1992–2010 | -6.25 to 3.99 | 0.61 |
| Soft tissue and other extraosseous sarcomas | 295 | 6.71 | 6.89 | 15 | 8.15 | 0.15 | 1992–2010 | -1.72 to 2.05 | 0.87 |
IX(A) Rhabdomyosarcomas |
170 | 3.79 | 3.89 | 10 | 4.59 | 0.00 | 1992–2010 | -1.82 to 1.85 | 1.00 |
IX(D) Other specified soft tissue sarcomas |
85 | 1.86 | 1.91 | 5 | 2.26 | -0.16 | 1992–2010 | -4.18 to 4.03 | 0.94 |
| Germ cell tumors, trophoblastic tumors, and neoplasms of gonads | 70 | 1.59 | 1.64 | 5 | 1.93 | 1.65 | 1992–2010 | -2.95 to 6.47 | 0.47 |
X(A) Intracranial and intraspinal germ cell tumors |
35 | 0.76 | 0.78 | 0 | 0.93 | 16.29 | 1992–1999 | 2.48 to 31.96 | 0.02 |
| -10.62 | 1999–2006 | -23.06 to 3.83 | 0.13 | ||||||
| 18.51 | 2006–2010 | -7.47 to 51.80 | 0.16 | ||||||
X(C) Malignant gonadal germ cell tumors |
35 | 0.76 | 0.78 | 0 | 0.91 | -1.20 | 1992–2010 | -6.37 to 4.26 | 0.64 |
| Other malignant epithelial neoplasms and malignant melanomas | 120 | 2.69 | 2.77 | 5 | 3.28 | 3.24 | 1992–2010 | -0.06 to 6.65 | 0.05 |
XI(B) Thyroid carcinomas |
55 | 1.23 | 1.27 | 0 | 1.51 | 3.19 | 1992–2010 | -0.33 to 6.84 | 0.07 |
XI(D) Malignant melanomas |
35 | 0.74 | 0.76 | 0 | 0.92 | 6.13 | 1992–2010 | 3.16 to 9.19 | < 0.01 |
| Other and unspecified malignant neoplasms | 55 | 1.19 | 1.22 | 0 | 1.46 | 2.07 | 1992–2010 | -1.70 to 5.98 | 0.27 |
XII(B) Other unspecified malignant tumors |
45 | 1.03 | 1.06 | 0 | 1.26 | 0.63 | 1992–2010 | -3.58 to 5.03 | 0.76 |
| Age 10 to 14 years | |||||||||
| All childhood cancers (malignancies only) | 4750 | 96.09 | 100.00 | 250 | 122.57 | 0.17 | 1992–2010 | -0.54 to 0.88 | 0.62 |
| All childhood cancers including non-malignancies brain | 4945 | 100.00 | 104.06 | 260 | 127.53 | 0.08 | 1992–2010 | -0.57 to 0.72 | 0.80 |
| Leukemias, myeloproliferative diseases, and myelodysplastic diseases | 1025 | 20.74 | 21.59 | 50 | 26.47 | 0.36 | 1992–2010 | -0.85 to 1.57 | 0.54 |
I(A) Lymphoid leukemias |
685 | 13.84 | 14.41 | 35 | 17.67 | 0.09 | 1992–2010 | -1.06 to 1.25 | 0.87 |
Lymphoid leukemias, precursor cell leukemias |
630 | 12.81 | 13.33 | 30 | 16.38 | -0.54 | 1992–2010 | -2.10 to 1.04 | 0.48 |
I(B) Acute myeloid leukemias |
230 | 4.65 | 4.84 | 10 | 5.95 | -0.34 | 1992–2010 | -2.87 to 2.26 | 0.78 |
I(C) Chronic myeloproliferative diseases |
50 | 1.03 | 1.07 | 0 | 1.31 | 3.27 | 1992–2010 | -1.35 to 8.11 | 0.16 |
I(E) Unspecified and other specified leukemias |
40 | 0.79 | 0.82 | 5 | 1.01 | 4.39 | 1992–2010 | -1.28 to 10.38 | 0.12 |
| Lymphomas and reticuloendothelial neoplasms | 1010 | 20.40 | 21.23 | 55 | 26.00 | 0.36 | 1992–2010 | -0.94 to 1.68 | 0.56 |
II(A) Hodgkin lymphomas |
555 | 11.21 | 11.67 | 30 | 14.29 | 0.82 | 1992–2010 | -0.87 to 2.53 | 0.32 |
II(B) Non-Hodgkin lymphomas (except Burkitt lymphoma) |
250 | 5.02 | 5.22 | 15 | 6.41 | -1.06 | 1992–2010 | -4.20 to 2.17 | 0.49 |
II(C) Burkitt lymphoma |
100 | 2.06 | 2.15 | 5 | 2.63 | -4.35 | 1992–2010 | -9.35 to 0.94 | 0.10 |
II(E) Unspecified lymphomas |
85 | 1.70 | 1.77 | 5 | 2.16 | 5.25 | 1992–2010 | 2.30 to 8.28 | < 0.01 |
| CNS and miscellaneous intracranial and intraspinal neoplasms | 945 | 19.13 | 19.90 | 50 | 24.40 | -0.77 | 1992–2010 | -1.98 to 0.45 | 0.20 |
III(A) Ependymomas and choroid plexus tumor |
60 | 1.23 | 1.28 | 0 | 1.56 | 5.11 | 1992–2010 | 1.45 to 8.91 | 0.01 |
III(B) Astrocytomas |
495 | 10.02 | 10.43 | 25 | 12.80 | -2.07 | 1992–2010 | -3.67 to -0.45 | 0.02 |
III(C) Intracranial and intraspinal embryonal tumors |
170 | 3.46 | 3.60 | 10 | 4.43 | -2.34 | 1992–2010 | -4.64 to 0.02 | 0.05 |
III(D) Other gliomas |
140 | 2.83 | 2.95 | 5 | 3.62 | 0.69 | 1992–2010 | -2.82 to 4.34 | 0.69 |
III(F) Unspecified intracranial and intraspinal neoplasms |
65 | 1.30 | 1.35 | 5 | 1.63 | 4.34 | 1992–2010 | 0.19 to 8.67 | 0.04 |
| CNS and miscellaneous intracranial and intraspinal neoplasms including non-malignancies | 1135 | 23.03 | 23.97 | 60 | 29.36 | -1.02 | 1992–2010 | -2.31 to 0.28 | 0.12 |
III(A) Ependymomas and choroid plexus tumor including non-malignancies |
80 | 1.60 | 1.66 | 5 | 2.02 | 3.82 | 1992–2010 | 0.37 to 7.38 | 0.03 |
III(B) Astrocytomas including non-malignancies |
510 | 10.34 | 10.76 | 25 | 13.22 | -2.11 | 1992–2010 | -3.69 to -0.50 | 0.01 |
III(C) Intracranial and intraspinal embryonal tumors including non-malignancies |
170 | 3.46 | 3.60 | 10 | 4.43 | -2.34 | 1992–2010 | -4.64 to 0.02 | 0.05 |
III(D) Other gliomas including non-malignancies |
145 | 2.85 | 2.97 | 10 | 3.64 | 0.73 | 1992–2010 | -2.70 to 4.28 | 0.66 |
III(E) Other specified intracranial and intraspinal neoplasms including non-malignancies |
150 | 3.04 | 3.16 | 10 | 3.86 | -0.30 | 1992–2010 | -3.85 to 3.38 | 0.86 |
III(F) Unspecified intracranial and intraspinal neoplasms including non-malignancies |
85 | 1.74 | 1.81 | 5 | 2.20 | 1.79 | 1992–2010 | -1.93 to 5.65 | 0.33 |
| Neuroblastoma and other peripheral nervous cell tumors | 40 | 0.85 | 0.88 | 5 | 1.08 | -1.01 | 1992–2010 | -4.58 to 2.68 | 0.56 |
IV(A) Neuroblastoma and ganglioneuroblastoma |
35 | 0.67 | 0.70 | 0 | 0.85 | -0.01 | 1992–2010 | -4.72 to 4.92 | 0.99 |
| Renal tumours | 55 | 1.09 | 1.14 | 0 | 1.39 | -1.32 | 1992–2010 | -5.91 to 3.50 | 0.56 |
VI(A) Nephroblastoma and other nonepithelial renal tumors |
35 | 0.67 | 0.70 | 0 | 0.85 | -0.32 | 1992–2010 | -5.27 to 4.89 | 0.90 |
| Hepatic tumours | 30 | 0.55 | 0.57 | 5 | 0.70 | -5.02 | 1992–2010 | -8.68 to -1.21 | 0.01 |
| Malignant bone tumours | 475 | 9.55 | 9.94 | 25 | 12.18 | -0.30 | 1992–2010 | -1.59 to 1.01 | 0.64 |
VIII(A) Osteosarcomas |
260 | 5.32 | 5.54 | 15 | 6.79 | -0.56 | 1992–2010 | -2.90 to 1.85 | 0.63 |
VIII(C) Ewing tumor and related sarcomas of bone |
160 | 3.30 | 3.43 | 10 | 4.19 | 1.39 | 1992–2010 | -0.94 to 3.78 | 0.23 |
| Soft tissue and other extraosseous sarcomas | 370 | 7.45 | 7.75 | 15 | 9.49 | -0.54 | 1992–2010 | -3.05 to 2.04 | 0.66 |
IX(A) Rhabdomyosarcomas |
115 | 2.35 | 2.44 | 5 | 3.00 | -1.54 | 1992–2010 | -5.18 to 2.23 | 0.40 |
IX(B) Fibrosarcomas, peripheral nerve sheath tumors, and other fibrous neoplasms |
35 | 0.73 | 0.76 | 0 | 0.93 | -0.81 | 1992–2010 | -4.85 to 3.41 | 0.69 |
IX(D) Other specified soft tissue sarcomas |
155 | 3.20 | 3.33 | 10 | 4.07 | -1.03 | 1992–2010 | -4.40 to 2.45 | 0.54 |
IX(E) Unspecified soft tissue sarcomas |
55 | 1.17 | 1.22 | 0 | 1.50 | 1.80 | 1992–2010 | -2.11 to 5.86 | 0.35 |
| Germ cell tumors, trophoblastic tumors, and neoplasms of gonads | 270 | 5.50 | 5.73 | 15 | 7.03 | -0.80 | 1992–2010 | -3.31 to 1.78 | 0.52 |
X(A) Intracranial and intraspinal germ cell tumors |
100 | 2.04 | 2.13 | 5 | 2.62 | -0.16 | 1992–2010 | -3.37 to 3.15 | 0.92 |
X(C) Malignant gonadal germ cell tumors |
130 | 2.67 | 2.78 | 10 | 3.41 | -0.61 | 1992–2010 | -3.81 to 2.71 | 0.70 |
| Other malignant epithelial neoplasms and malignant melanomas | 455 | 9.15 | 9.52 | 25 | 11.67 | 1.72 | 1992–2010 | -0.77 to 4.27 | 0.16 |
XI(B) Thyroid carcinomas |
190 | 3.93 | 4.09 | 15 | 5.01 | 3.47 | 1992–2010 | -0.37 to 7.47 | 0.07 |
XI(D) Malignant melanomas |
95 | 1.92 | 2.00 | 5 | 2.45 | -1.34 | 1992–2010 | -4.01 to 1.41 | 0.32 |
XI(F) Other and unspecified carcinomas |
135 | 2.73 | 2.84 | 10 | 3.49 | -0.28 | 1992–2010 | -3.78 to 3.34 | 0.87 |
| Other and unspecified malignant neoplasms | 80 | 1.60 | 1.66 | 5 | 2.03 | 7.20 | 1992–2010 | 3.71 to 10.80 | < 0.01 |
XII(B) Other unspecified malignant tumors |
70 | 1.38 | 1.43 | 5 | 1.75 | 7.52 | 1992–2010 | 3.84 to 11.32 | < 0.01 |
| Data sources: Canadian Cancer Registry (CCR) database at Statistics Canada and Quebec Cancer Registry (2008-2010). | |||||||||
| Total cases | % (including non-malignancies) |
% (malignancies only) |
Average annual cases |
Average ASIR |
APC | Year | 95% CI | p-value | |
|---|---|---|---|---|---|---|---|---|---|
| British Columbia | |||||||||
| All childhood cancers (malignancies only) | 2030 | 96.26 | 100.00 | 105 | 152.22 | 0.23 | 1992–2010 | -0.80 to 1.27 | 0.65 |
| All childhood cancers including non-malignancies brain | 2110 | 100.00 | 103.89 | 110 | 158.01 | 0.32 | 1992–2010 | -0.67 to 1.31 | 0.51 |
| Leukemias, myeloproliferative diseases, and myelodysplastic diseases | 695 | 32.92 | 34.20 | 40 | 52.82 | 0.33 | 1992–2010 | -1.14 to 1.83 | 0.64 |
| Lymphomas and reticuloendothelial neoplasms | 220 | 10.37 | 10.78 | 10 | 15.81 | 1.03 | 1992–2010 | -1.92 to 4.06 | 0.48 |
| CNS and miscellaneous intracranial and intraspinal neoplasms | 380 | 18.00 | 18.70 | 20 | 28.30 | 0.43 | 1992–2010 | -1.29 to 2.18 | 0.61 |
| CNS and miscellaneous intracranial and intraspinal neoplasms including non-malignancies | 460 | 21.74 | 22.59 | 25 | 34.09 | 0.79 | 1992–2010 | -0.87 to 2.47 | 0.33 |
| Neuroblastoma and other peripheral nervous cell tumors | 155 | 7.34 | 7.63 | 5 | 12.19 | 2.44 | 1992–2010 | -0.11 to 5.06 | 0.06 |
| Retinoblastoma | 50 | 2.32 | 2.41 | 5 | 3.87 | -1.54 | 1992–2010 | -4.88 to 1.92 | 0.36 |
| Renal tumours | 110 | 5.07 | 5.27 | 5 | 8.15 | -1.32 | 1992–2010 | -3.89 to 1.32 | 0.30 |
| Hepatic tumours | 35 | 1.61 | 1.67 | 0 | 2.61 | 9.86 | 1992–1999 | -0.72 to 21.56 | 0.06 |
| -32.48 | 1999–2002 | -71.72 to 61.22 | 0.33 | ||||||
| 43.69 | 2002–2005 | Table 3 - Footnote – | 0.37 | ||||||
| -14.53 | 2005–2010 | -29.37 to 3.43 | 0.09 | ||||||
| Malignant bone tumours | 115 | 5.45 | 5.66 | 5 | 8.18 | -1.12 | 1992–2010 | -4.46 to 2.34 | 0.50 |
| Soft tissue and other extraosseous sarcomas | 135 | 6.30 | 6.55 | 5 | 9.74 | -0.69 | 1992–2010 | -3.58 to 2.29 | 0.63 |
| Germ cell tumors, trophoblastic tumors, and neoplasms of gonads | 75 | 3.55 | 3.69 | 5 | 5.44 | -2.11 | 1992–2010 | -6.51 to 2.49 | 0.34 |
| Other malignant epithelial neoplasms and malignant melanomas | 60 | 2.98 | 3.10 | 5 | 4.56 | 0.49 | 1992–2010 | -3.65 to 4.79 | 0.81 |
| Prairies | |||||||||
| All childhood cancers (malignancies only) | 2885 | 94.97 | 100.00 | 155 | 141.12 | 0.35 | 1992–2010 | -0.39 to 1.10 | 0.33 |
| All childhood cancers including non-malignancies brain | 3040 | 100.00 | 105.30 | 160 | 148.50 | 0.26 | 1992–2010 | -0.47 to 1.00 | 0.47 |
| Leukemias, myeloproliferative diseases, and myelodysplastic diseases | 945 | 31.16 | 32.81 | 50 | 46.71 | 0.84 | 1992–2010 | -0.55 to 2.25 | 0.22 |
| Lymphomas and reticuloendothelial neoplasms | 325 | 10.73 | 11.30 | 15 | 15.64 | 1.86 | 1992–2010 | -0.17 to 3.94 | 0.07 |
II(B) Non-Hodgkin lymphomas (except Burkitt lymphoma) |
115 | 3.82 | 4.02 | 5 | 5.60 | 4.81 | 1992–2010 | 1.58 to 8.14 | 0.01 |
| CNS and miscellaneous intracranial and intraspinal neoplasms | 610 | 20.04 | 21.10 | 30 | 29.47 | -0.09 | 1992–2010 | -1.49 to 1.33 | 0.90 |
| CNS and miscellaneous intracranial and intraspinal neoplasms including non-malignancies | 760 | 25.07 | 26.40 | 40 | 36.85 | -0.39 | 1992–2010 | -1.69 to 0.92 | 0.53 |
| Neuroblastoma and other peripheral nervous cell tumors | 205 | 6.68 | 7.03 | 10 | 10.22 | 0.17 | 1992–2010 | -1.43 to 1.79 | 0.83 |
| Retinoblastoma | 75 | 2.44 | 2.56 | 5 | 3.71 | -0.31 | 1992–2010 | -4.14 to 3.68 | 0.87 |
| Renal tumours | 185 | 6.02 | 6.34 | 10 | 9.10 | -1.65 | 1992–2010 | -4.29 to 1.07 | 0.22 |
| Hepatic tumours | 55 | 1.68 | 1.77 | 0 | 2.57 | 3.48 | 1992–2010 | -1.25 to 8.44 | 0.14 |
| Malignant bone tumours | 125 | 4.15 | 4.37 | 10 | 5.98 | 1.25 | 1992–2010 | -1.90 to 4.50 | 0.42 |
VIII(C) Ewing tumor and related sarcomas of bone |
45 | 1.55 | 1.63 | 0 | 2.23 | 4.14 | 1992–2010 | 0.72 to 7.68 | 0.02 |
| Soft tissue and other extraosseous sarcomas | 175 | 5.69 | 5.99 | 5 | 8.40 | -0.12 | 1992–2010 | -2.68 to 2.52 | 0.92 |
| Germ cell tumors, trophoblastic tumors, and neoplasms of gonads | 105 | 3.49 | 3.67 | 5 | 5.12 | -0.68 | 1992–2010 | -3.56 to 2.28 | 0.63 |
X(C) Malignant gonadal germ cell tumors |
40 | 1.32 | 1.39 | 0 | 1.93 | -5.85 | 1992–2010 | -9.49 to -2.06 | 0.01 |
| Other malignant epithelial neoplasms and malignant melanomas | 80 | 2.67 | 2.81 | 0 | 3.87 | -1.39 | 1992–2010 | -5.45 to 2.85 | 0.49 |
| OntarioTable 3 - Footnote b | |||||||||
| All childhood cancers (malignancies only) | 6655 | 100.00 | 100.00 | 350 | 157.62 | -0.05 | 1992–2006 | -0.67 to 0.56 | 0.85 |
| 5.91 | 2006–2010 | 1.90 to 10.08 | 0.01 | ||||||
| Leukemias, myeloproliferative diseases, and myelodysplastic diseases | 2110 | 31.69 | 31.69 | 110 | 50.12 | 0.78 | 1992–2010 | -0.34 to 1.92 | 0.16 |
I(A) Lymphoid leukemias |
1675 | 25.17 | 25.17 | 90 | 39.87 | 1.33 | 1992–2010 | 0.24 to 2.44 | 0.02 |
Lymphoid leukemias, precursor cell leukemias |
1480 | 22.29 | 22.29 | 80 | 35.26 | 1.12 | 1992–2000 | -2.78 to 5.17 | 0.55 |
| -13.91 | 2000–2004 | -29.82 to 5.62 | 0.14 | ||||||
| 14.23 | 2004–2010 | 7.50 to 21.37 | < 0.01 | ||||||
I(C) Chronic myeloproliferative diseases |
30 | 0.45 | 0.45 | 0 | 0.70 | -9.02 | 1992–2010 | -13.48 to -4.33 | < 0.01 |
I(E) Unspecified and other specified leukemias |
90 | 1.40 | 1.40 | 5 | 2.21 | 18.50 | 1992–2001 | 5.61 to 32.96 | 0.01 |
| -12.68 | 2001–2010 | -22.51 to -1.59 | 0.03 | ||||||
| Lymphomas and reticuloendothelial neoplasms | 775 | 11.63 | 11.63 | 40 | 17.91 | 0.64 | 1992–2010 | -0.83 to 2.12 | 0.37 |
II(D) Miscellaneous lymphoreticular neoplasms |
65 | 0.98 | 0.98 | 0 | 1.55 | 7.59 | 1992–2010 | 3.09 to 12.29 | < 0.01 |
II(E) Unspecified lymphomas |
155 | 2.28 | 2.28 | 5 | 3.50 | 4.34 | 1992–2010 | 1.27 to 7.51 | 0.01 |
| CNS and miscellaneous intracranial and intraspinal neoplasms | 1340 | 20.14 | 20.14 | 70 | 31.49 | -1.40 | 1992–2004 | -2.82 to 0.05 | 0.06 |
| 4.99 | 2004–2010 | 0.96 to 9.18 | 0.02 | ||||||
III(A) Ependymomas and choroid plexus tumor |
115 | 1.68 | 1.68 | 5 | 2.69 | 3.33 | 1992–2010 | 0.68 to 6.05 | 0.02 |
III(B) Astrocytomas |
575 | 8.65 | 8.65 | 30 | 13.47 | -5.90 | 1992–2004 | -7.96 to -3.80 | < 0.01 |
| 5.65 | 2004–2010 | -1.56 to 13.39 | 0.12 | ||||||
III(D) Other gliomas |
185 | 2.76 | 2.76 | 5 | 4.32 | 4.52 | 1992–2010 | 2.34 to 6.74 | < 0.01 |
III(F) Unspecified intracranial and intraspinal neoplasms |
145 | 2.16 | 2.16 | 5 | 3.35 | 12.13 | 1992–2005 | 3.76 to 21.17 | 0.01 |
| -21.74 | 2005–2010 | -40.25 to 2.51 | 0.07 | ||||||
| Neuroblastoma and other peripheral nervous cell tumors | 445 | 6.67 | 6.67 | 25 | 10.94 | 1.85 | 1992–2010 | -0.35 to 4.09 | 0.09 |
| Retinoblastoma | 165 | 2.43 | 2.43 | 10 | 4.03 | 1.10 | 1992–2010 | -1.26 to 3.52 | 0.34 |
| Renal tumours | 350 | 5.29 | 5.29 | 15 | 8.45 | -0.63 | 1992–2010 | -2.40 to 1.17 | 0.47 |
| Hepatic tumours | 105 | 1.59 | 1.59 | 5 | 2.60 | 1.15 | 1992–2010 | -2.01 to 4.42 | 0.46 |
| Malignant bone tumours | 285 | 4.28 | 4.28 | 15 | 6.58 | -0.90 | 1992–2010 | -3.02 to 1.28 | 0.39 |
| Soft tissue and other extraosseous sarcomas | 395 | 5.93 | 5.93 | 25 | 9.32 | 0.28 | 1992–2010 | -1.49 to 2.08 | 0.75 |
| Germ cell tumors, trophoblastic tumors, and neoplasms of gonads | 205 | 3.06 | 3.06 | 10 | 4.82 | 1.46 | 1992–2010 | -0.88 to 3.85 | 0.21 |
| Other malignant epithelial neoplasms and malignant melanomas | 290 | 4.33 | 4.33 | 15 | 6.66 | 3.85 | 1992–2010 | 1.07 to 6.71 | 0.01 |
XI(B) Thyroid carcinomas |
110 | 1.65 | 1.65 | 10 | 2.49 | 6.34 | 1992–2010 | 2.98 to 9.81 | < 0.01 |
| Other and unspecified malignant neoplasms | 195 | 2.96 | 2.96 | 10 | 4.69 | 2.17 | 1992–2010 | -2.01 to 6.54 | 0.29 |
XII(B) Other unspecified malignant tumors |
180 | 2.70 | 2.70 | 10 | 4.27 | 65.13 | 1992–1996 | 5.53 to 158.41 | 0.03 |
| -2.18 | 1996–2010 | -6.07 to 1.87 | 0.26 | ||||||
| Quebec | |||||||||
| All childhood cancers (malignancies only) | 4140 | 96.60 | 100.00 | 220 | 168.59 | 0.13 | 1992–2010 | -0.53 to 0.79 | 0.69 |
| All childhood cancers including non-malignancies brain | 4290 | 100.00 | 103.52 | 225 | 174.36 | 0.05 | 1992–2010 | -0.60 to 0.71 | 0.87 |
| Leukemias, myeloproliferative diseases, and myelodysplastic diseases | 1310 | 30.54 | 31.61 | 70 | 53.70 | 0.57 | 1992–2010 | -0.52 to 1.67 | 0.29 |
I(D) Myelodysplastic syndrome and other myeloproliferative diseases |
35 | 0.77 | 0.80 | 0 | 1.38 | 18.53 | 1992–2004 | 4.42 to 34.55 | 0.01 |
| -12.36 | 2004–2010 | -24.97 to 2.35 | 0.09 | ||||||
| Lymphomas and reticuloendothelial neoplasms | 460 | 10.72 | 11.10 | 25 | 18.16 | -1.06 | 1992–2010 | -2.97 to 0.90 | 0.27 |
| CNS and miscellaneous intracranial and intraspinal neoplasms | 770 | 17.88 | 18.51 | 40 | 31.01 | 0.50 | 1992–2010 | -0.75 to 1.77 | 0.41 |
| CNS and miscellaneous intracranial and intraspinal neoplasms including non-malignancies | 910 | 21.28 | 22.03 | 45 | 36.78 | 2.58 | 1992–2005 | 1.19 to 3.99 | < 0.01 |
| -10.14 | 2005–2010 | -16.05 to -3.83 | < 0.01 | ||||||
III(F) Unspecified intracranial and intraspinal neoplasms including non-malignancies |
80 | 1.84 | 1.91 | 5 | 3.14 | -14.70 | 1992–2001 | -25.16 to -2.77 | 0.02 |
| 47.35 | 2001–2004 | Table 3 - Footnote – | 0.55 | ||||||
| -33.06 | 2004–2010 | -54.59 to -1.34 | 0.04 | ||||||
| Neuroblastoma and other peripheral nervous cell tumors | 385 | 8.97 | 9.29 | 20 | 16.08 | -1.27 | 1992–2010 | -3.56 to 1.08 | 0.27 |
| Retinoblastoma | 115 | 2.66 | 2.75 | 5 | 4.79 | -0.20 | 1992–2010 | -3.46 to 3.17 | 0.90 |
| Renal tumours | 235 | 5.57 | 5.77 | 15 | 10.01 | 0.08 | 1992–2010 | -2.61 to 2.85 | 0.95 |
| Hepatic tumours | 45 | 1.10 | 1.13 | 5 | 1.99 | 4.06 | 1992–2010 | -0.33 to 8.64 | 0.07 |
| Malignant bone tumours | 185 | 4.31 | 4.46 | 5 | 7.21 | -4.88 | 1992–2002 | -8.45 to -1.16 | 0.01 |
| 6.19 | 2002–2010 | 0.39 to 12.32 | 0.04 | ||||||
| Soft tissue and other extraosseous sarcomas | 265 | 6.25 | 6.47 | 15 | 10.78 | 0.04 | 1992–2010 | -2.27 to 2.41 | 0.97 |
| Germ cell tumors, trophoblastic tumors, and neoplasms of gonads | 130 | 3.05 | 3.16 | 10 | 5.31 | -1.21 | 1992–2010 | -4.90 to 2.63 | 0.51 |
X(B) Malignant extracranial and extragonadal germ cell tumors |
35 | 0.77 | 0.80 | 0 | 1.41 | 9.46 | 1992–2004 | 2.62 to 16.75 | 0.01 |
| -26.73 | 2004–2010 | -40.96 to -9.06 | 0.01 | ||||||
| Other malignant epithelial neoplasms and malignant melanomas | 180 | 4.22 | 4.37 | 10 | 7.20 | 3.47 | 1992–2010 | 0.40 to 6.63 | 0.03 |
XI(B) Thyroid carcinomas |
75 | 1.72 | 1.79 | 5 | 2.94 | 8.21 | 1992–2010 | 3.61 to 13.02 | < 0.01 |
| Other and unspecified malignant neoplasms | 60 | 1.33 | 1.38 | 0 | 2.36 | 1.09 | 1992–2010 | -4.07 to 6.53 | 0.67 |
| Atlantic provinces | |||||||||
| All childhood cancers (malignancies only) | 1180 | 96.00 | 100.00 | 60 | 152.27 | 0.34 | 1992–2010 | -0.90 to 1.59 | 0.57 |
| All childhood cancers including non-malignancies brain | 1225 | 100.00 | 104.16 | 65 | 158.19 | 0.23 | 1992–2010 | -1.01 to 1.49 | 0.70 |
| Leukemias, myeloproliferative diseases, and myelodysplastic diseases | 410 | 33.44 | 34.83 | 20 | 53.90 | 0.90 | 1992–2010 | -1.20 to 3.05 | 0.38 |
| Lymphomas and reticuloendothelial neoplasms | 120 | 9.71 | 10.11 | 5 | 14.72 | 1.38 | 1992–2010 | -1.47 to 4.30 | 0.33 |
| CNS and miscellaneous intracranial and intraspinal neoplasms | 230 | 18.68 | 19.46 | 10 | 28.77 | 8.63 | 1992–1998 | -1.07 to 19.29 | 0.08 |
| -6.38 | 1998–2010 | -10.19 to -2.40 | < 0.01 | ||||||
| CNS and miscellaneous intracranial and intraspinal neoplasms including non-malignancies | 280 | 22.68 | 23.62 | 15 | 34.69 | 10.74 | 1992–1998 | 1.84 to 20.43 | 0.02 |
| -7.22 | 1998–2010 | -10.52 to -3.79 | < 0.01 | ||||||
| Neuroblastoma and other peripheral nervous cell tumors | 75 | 5.87 | 6.12 | 5 | 10.12 | 2.22 | 1992–2010 | -0.60 to 5.11 | 0.12 |
| Retinoblastoma | 30 | 2.45 | 2.55 | 0 | 4.19 | 55.50 | 1992–1996 | Table 3 - Footnote – | 0.23 |
| -30.80 | 1996–2002 | -44.84 to -13.17 | 0.01 | ||||||
| 163.12 | 2002–2006 | Table 3 - Footnote – | 0.04 | ||||||
| -55.12 | 2006–2010 | -71.86 to -28.43 | < 0.01 | ||||||
| Renal tumours | 65 | 5.22 | 5.44 | 5 | 8.81 | 1.27 | 1992–2010 | -2.62 to 5.32 | 0.51 |
| Malignant bone tumours | 50 | 4.00 | 4.16 | 5 | 5.91 | 3.84 | 1992–2010 | -1.65 to 9.64 | 0.16 |
| Soft tissue and other extraosseous sarcomas | 90 | 7.01 | 7.31 | 5 | 10.77 | 0.07 | 1992–2010 | -4.28 to 4.62 | 0.97 |
| Germ cell tumors, trophoblastic tumors, and neoplasms of gonads | 35 | 3.10 | 3.23 | 0 | 4.88 | -0.87 | 1992–2010 | -3.88 to 2.23 | 0.56 |
| Other malignant epithelial neoplasms and malignant melanomas | 50 | 4.32 | 4.50 | 0 | 6.43 | 0.63 | 1992–2010 | -2.27 to 3.61 | 0.66 |
| Territories | |||||||||
| All childhood cancers (malignancies only) | 55 | 98.21 | 100.00 | 5 | 106.35 | 0.51 | 1992–2010 | -2.90 to 4.04 | 0.76 |
| All childhood cancers including non-malignant CNS tumors | 55 | 100.00 | 101.82 | 5 | 108.15 | 0.53 | 1992–2010 | -2.88 to 4.07 | 0.75 |
| Data sources: Canadian Cancer Registry (CCR) database at Statistics Canada and Quebec Cancer Registry (2008-2010). | |||||||||
| Total cases | % (including non-malignancies) |
% (malignancies only) |
Average annual cases |
Average ASIR |
APC | Year | 95% CI | p-value | |
|---|---|---|---|---|---|---|---|---|---|
| British Columbia | |||||||||
| All childhood cancers (malignancies only) | 1095 | 96.21 | 100.00 | 55 | 158.93 | 0.41 | 1992–2010 | -1.06 to 1.90 | 0.56 |
| All childhood cancers including non-malignancies brain | 1135 | 100.00 | 103.94 | 60 | 165.02 | 0.53 | 1992–2010 | -0.90 to 1.98 | 0.45 |
| Leukemias, myeloproliferative diseases, and myelodysplastic diseases | 380 | 33.66 | 34.98 | 20 | 56.45 | 0.94 | 1992–2010 | -0.84 to 2.74 | 0.28 |
| Lymphomas and reticuloendothelial neoplasms | 150 | 13.04 | 13.55 | 10 | 20.83 | 2.72 | 1992–2010 | -0.77 to 6.32 | 0.12 |
| CNS and miscellaneous intracranial and intraspinal neoplasms | 190 | 16.92 | 17.58 | 10 | 27.64 | -0.24 | 1992–2010 | -2.61 to 2.18 | 0.83 |
| CNS and miscellaneous intracranial and intraspinal neoplasms including non-malignancies | 235 | 20.70 | 21.52 | 10 | 33.73 | 0.48 | 1992–2010 | -2.05 to 3.08 | 0.70 |
| Neuroblastoma and other peripheral nervous cell tumors | 70 | 6.17 | 6.41 | 5 | 10.70 | 3.71 | 1992–2010 | -0.41 to 8.00 | 0.08 |
| Retinoblastoma | 30 | 2.47 | 2.56 | 5 | 4.26 | -3.92 | 1992–2010 | -6.78 to -0.97 | 0.01 |
| Renal tumours | 60 | 5.02 | 5.22 | 0 | 8.48 | 0.68 | 1992–2010 | -2.70 to 4.19 | 0.68 |
| Malignant bone tumours | 55 | 4.85 | 5.04 | 0 | 7.64 | -1.88 | 1992–2010 | -7.61 to 4.22 | 0.52 |
| Soft tissue and other extraosseous sarcomas | 70 | 5.99 | 6.23 | 5 | 9.66 | -0.62 | 1992–2010 | -4.66 to 3.59 | 0.76 |
| Germ cell tumors, trophoblastic tumors, and neoplasms of gonads | 40 | 3.52 | 3.66 | 0 | 5.72 | -4.24 | 1992–2010 | -8.65 to 0.37 | 0.07 |
| Other malignant epithelial neoplasms and malignant melanomas | 30 | 2.29 | 2.38 | 5 | 3.68 | 0.15 | 1992–2010 | -4.13 to 4.63 | 0.94 |
| Prairies | |||||||||
| All childhood cancers (malignancies only) | 1580 | 95.13 | 100.00 | 85 | 150.77 | 0.85 | 1992–2010 | -0.09 to 1.79 | 0.07 |
| All childhood cancers including non-malignancies brain | 1660 | 100.00 | 105.12 | 85 | 158.35 | 0.76 | 1992–2010 | -0.12 to 1.64 | 0.09 |
| Leukemias, myeloproliferative diseases, and myelodysplastic diseases | 535 | 32.35 | 34.01 | 30 | 51.70 | 1.54 | 1992–2010 | -0.40 to 3.52 | 0.11 |
| Lymphomas and reticuloendothelial neoplasms | 210 | 12.75 | 13.40 | 15 | 19.78 | 1.16 | 1992–2010 | -1.15 to 3.52 | 0.31 |
II(B) Non-Hodgkin lymphomas (except Burkitt lymphoma) |
75 | 4.45 | 4.68 | 0 | 6.91 | 3.84 | 1992–2010 | 0.29 to 7.51 | 0.04 |
| CNS and miscellaneous intracranial and intraspinal neoplasms | 335 | 19.96 | 20.99 | 15 | 31.36 | 0.99 | 1992–2010 | -0.72 to 2.74 | 0.24 |
III(C) Intracranial and intraspinal embryonal tumors |
75 | 4.63 | 4.87 | 5 | 7.27 | -18.75 | 1992–1996 | -43.00 to 15.83 | 0.23 |
| 6.34 | 1996–2010 | 0.33 to 12.71 | 0.04 | ||||||
| CNS and miscellaneous intracranial and intraspinal neoplasms including non-malignancies | 410 | 24.83 | 26.11 | 20 | 38.94 | 0.64 | 1992–2010 | -0.80 to 2.10 | 0.36 |
III(C) Intracranial and intraspinal embryonal tumors including non-malignancies |
80 | 4.63 | 4.87 | 5 | 7.27 | -18.75 | 1992–1996 | -43.00 to 15.83 | 0.23 |
| 6.34 | 1996–2010 | 0.33 to 12.71 | 0.04 | ||||||
| Neuroblastoma and other peripheral nervous cell tumors | 100 | 6.01 | 6.32 | 5 | 9.84 | 1.04 | 1992–2010 | -1.98 to 4.15 | 0.48 |
| Retinoblastoma | 30 | 1.98 | 2.09 | 0 | 3.27 | -2.99 | 1992–2010 | -7.49 to 1.73 | 0.20 |
| Renal tumours | 90 | 5.29 | 5.56 | 5 | 8.50 | -3.27 | 1992–2010 | -6.35 to -0.09 | 0.04 |
| Hepatic tumours | 35 | 2.10 | 2.21 | 0 | 3.43 | 4.34 | 1992–2010 | -0.78 to 9.71 | 0.09 |
| Malignant bone tumours | 65 | 3.67 | 3.86 | 5 | 5.67 | 1.32 | 1992–2010 | -2.64 to 5.45 | 0.50 |
| Soft tissue and other extraosseous sarcomas | 95 | 5.65 | 5.94 | 5 | 8.87 | -1.35 | 1992–2010 | -4.96 to 2.40 | 0.45 |
| Germ cell tumors, trophoblastic tumors, and neoplasms of gonads | 50 | 2.89 | 3.03 | 0 | 4.55 | -2.61 | 1992–2010 | -6.80 to 1.76 | 0.22 |
| Other malignant epithelial neoplasms and malignant melanomas | 40 | 2.22 | 2.34 | 0 | 3.44 | 1.75 | 1992–2010 | -2.90 to 6.62 | 0.44 |
| OntarioTable 4 - Footnote b | |||||||||
| All childhood cancers (malignancies only) | 3585 | 100.00 | 100.00 | 190 | 165.70 | 1.55 | 1992–2002 | 0.45 to 2.66 | 0.01 |
| -5.12 | 2002–2005 | -17.46 to 9.05 | 0.42 | ||||||
| 5.00 | 2005–2010 | 1.87 to 8.23 | < 0.01 | ||||||
| Leukemias, myeloproliferative diseases, and myelodysplastic diseases | 1150 | 32.11 | 32.11 | 60 | 53.46 | 0.89 | 1992–2010 | -0.06 to 1.84 | 0.06 |
I(A) Lymphoid leukemias |
935 | 26.05 | 26.05 | 45 | 43.43 | 1.36 | 1992–2010 | 0.28 to 2.45 | 0.02 |
Lymphoid leukemias, precursor cell leukemias |
820 | 22.93 | 22.93 | 45 | 38.16 | 1.28 | 1992–2001 | -2.63 to 5.34 | 0.49 |
| -18.31 | 2001–2004 | -50.22 to 34.07 | 0.39 | ||||||
| 13.60 | 2004–2010 | 5.26 to 22.61 | < 0.01 | ||||||
| Lymphomas and reticuloendothelial neoplasms | 505 | 14.06 | 14.06 | 25 | 22.79 | 1.15 | 1992–2010 | -0.76 to 3.09 | 0.22 |
II(E) Unspecified lymphomas |
100 | 2.79 | 2.79 | 5 | 4.51 | 4.46 | 1992–2010 | 1.69 to 7.30 | < 0.01 |
| CNS and miscellaneous intracranial and intraspinal neoplasms | 730 | 20.31 | 20.31 | 40 | 33.34 | 0.26 | 1992–2010 | -1.07 to 1.61 | 0.68 |
III(B) Astrocytomas |
285 | 8.01 | 8.01 | 15 | 13.09 | -2.42 | 1992–2010 | -4.58 to -0.22 | 0.03 |
III(D) Other gliomas |
90 | 2.51 | 2.51 | 5 | 4.14 | 4.71 | 1992–2010 | 1.01 to 8.54 | 0.02 |
| Neuroblastoma and other peripheral nervous cell tumors | 250 | 6.89 | 6.89 | 10 | 11.87 | 1.30 | 1992–2010 | -1.16 to 3.83 | 0.28 |
| Retinoblastoma | 80 | 2.26 | 2.26 | 0 | 3.92 | -1.36 | 1992–2010 | -5.10 to 2.53 | 0.47 |
| Renal tumours | 150 | 4.13 | 4.13 | 10 | 7.00 | -0.15 | 1992–2010 | -2.75 to 2.53 | 0.91 |
| Hepatic tumours | 65 | 1.84 | 1.84 | 5 | 3.13 | 3.58 | 1992–2010 | 0.32 to 6.94 | 0.03 |
VII(A) Hepatoblastoma |
55 | 1.48 | 1.48 | 5 | 2.54 | 5.80 | 1992–2010 | 2.68 to 9.02 | < 0.01 |
| Malignant bone tumours | 145 | 4.02 | 4.02 | 5 | 6.47 | -0.71 | 1992–2010 | -3.66 to 2.32 | 0.62 |
| Soft tissue and other extraosseous sarcomas | 220 | 6.19 | 6.19 | 10 | 10.17 | -0.74 | 1992–2010 | -3.30 to 1.89 | 0.56 |
| Germ cell tumors, trophoblastic tumors, and neoplasms of gonads | 85 | 2.48 | 2.48 | 5 | 4.14 | 1.31 | 1992–2010 | -2.62 to 5.39 | 0.50 |
| Other malignant epithelial neoplasms and malignant melanomas | 115 | 3.18 | 3.18 | 5 | 5.16 | 1.36 | 1992–2010 | -2.09 to 4.93 | 0.42 |
XI(B) Thyroid carcinomas |
35 | 0.86 | 0.86 | 0 | 1.36 | 5.68 | 1992–2010 | 1.91 to 9.58 | 0.01 |
| Other and unspecified malignant neoplasms | 95 | 2.54 | 2.54 | 5 | 4.25 | 1.20 | 1992–2010 | -4.34 to 7.06 | 0.66 |
| Quebec | |||||||||
| All childhood cancers (malignancies only) | 2230 | 95.92 | 100.00 | 115 | 177.37 | 0.14 | 1992–2010 | -0.63 to 0.92 | 0.71 |
| All childhood cancers including non-malignancies brain | 2325 | 100.00 | 104.25 | 125 | 184.65 | -0.05 | 1992–2010 | -0.79 to 0.70 | 0.89 |
| Leukemias, myeloproliferative diseases, and myelodysplastic diseases | 715 | 30.63 | 31.93 | 35 | 56.99 | 0.14 | 1992–2010 | -1.49 to 1.80 | 0.86 |
I(C) Chronic myeloproliferative diseases |
30 | 1.25 | 1.30 | 0 | 2.35 | 5.96 | 1992–2010 | 1.38 to 10.75 | 0.01 |
| Lymphomas and reticuloendothelial neoplasms | 320 | 13.57 | 14.15 | 20 | 24.37 | -1.80 | 1992–2010 | -3.96 to 0.40 | 0.10 |
| CNS and miscellaneous intracranial and intraspinal neoplasms | 425 | 18.08 | 18.85 | 20 | 33.30 | 0.35 | 1992–2010 | -1.50 to 2.24 | 0.69 |
| CNS and miscellaneous intracranial and intraspinal neoplasms including non-malignancies | 515 | 22.16 | 23.11 | 25 | 40.59 | 2.06 | 1992–2004 | 0.14 to 4.01 | 0.04 |
| -7.38 | 2004–2010 | -12.91 to -1.50 | 0.02 | ||||||
III(E) Other specified intracranial and intraspinal neoplasms including non-malignancies |
55 | 2.28 | 2.37 | 0 | 4.05 | -13.60 | 1992–2000 | -22.56 to -3.60 | 0.01 |
| 14.61 | 2000–2006 | -2.67 to 34.97 | 0.09 | ||||||
| -47.06 | 2006–2010 | -73.25 to 4.77 | 0.06 | ||||||
III(F) Unspecified intracranial and intraspinal neoplasms including non-malignancies |
50 | 2.10 | 2.19 | 5 | 3.78 | -7.94 | 1992–2010 | -12.27 to -3.41 | < 0.01 |
| Neuroblastoma and other peripheral nervous cell tumors | 195 | 8.29 | 8.64 | 10 | 15.87 | 0.38 | 1992–2010 | -2.10 to 2.93 | 0.75 |
| Retinoblastoma | 60 | 2.58 | 2.69 | 5 | 4.89 | -0.92 | 1992–2010 | -4.05 to 2.32 | 0.55 |
| Renal tumours | 105 | 4.38 | 4.57 | 5 | 8.40 | 0.97 | 1992–2010 | -3.36 to 5.50 | 0.65 |
| Hepatic tumours | 30 | 1.29 | 1.34 | 0 | 2.49 | 2.12 | 1992–2010 | -2.37 to 6.81 | 0.34 |
| Malignant bone tumours | 100 | 4.17 | 4.34 | 5 | 7.38 | 0.99 | 1992–2010 | -1.95 to 4.02 | 0.49 |
| Soft tissue and other extraosseous sarcomas | 140 | 6.01 | 6.27 | 10 | 10.93 | -0.58 | 1992–2010 | -3.89 to 2.85 | 0.72 |
| Germ cell tumors, trophoblastic tumors, and neoplasms of gonads | 60 | 2.66 | 2.78 | 5 | 4.94 | 1.02 | 1992–2010 | -2.55 to 4.73 | 0.56 |
| Other malignant epithelial neoplasms and malignant melanomas | 70 | 2.92 | 3.05 | 5 | 5.28 | 2.62 | 1992–2010 | -2.05 to 7.51 | 0.26 |
| Other and unspecified malignant neoplasms | 30 | 1.33 | 1.39 | 5 | 2.54 | 4.58 | 1992–2010 | 0.13 to 9.23 | 0.04 |
| Atlantic provinces | |||||||||
| All childhood cancers (malignancies only) | 615 | 95.49 | 100.00 | 35 | 154.99 | 0.06 | 1992–2010 | -1.81 to 1.96 | 0.95 |
| All childhood cancers including non-malignancies brain | 645 | 100.00 | 104.72 | 35 | 161.76 | -0.12 | 1992–2010 | -2.08 to 1.89 | 0.90 |
| Leukemias, myeloproliferative diseases, and myelodysplastic diseases | 210 | 33.13 | 34.69 | 10 | 54.85 | 1.61 | 1992–2010 | -1.38 to 4.68 | 0.27 |
| Lymphomas and reticuloendothelial neoplasms | 80 | 12.29 | 12.87 | 5 | 19.19 | 1.72 | 1992–2010 | -2.17 to 5.77 | 0.37 |
| CNS and miscellaneous intracranial and intraspinal neoplasms | 120 | 18.20 | 19.06 | 5 | 28.53 | -2.78 | 1992–2010 | -5.99 to 0.54 | 0.09 |
| CNS and miscellaneous intracranial and intraspinal neoplasms including non-malignancies | 145 | 22.71 | 23.78 | 5 | 35.30 | 12.16 | 1992–1997 | -5.79 to 33.52 | 0.18 |
| -7.45 | 1997–2010 | -12.19 to -2.45 | 0.01 | ||||||
| Neuroblastoma and other peripheral nervous cell tumors | 40 | 6.22 | 6.51 | 5 | 10.96 | 0.35 | 1992–2010 | -3.31 to 4.15 | 0.84 |
| Malignant bone tumours | 30 | 4.67 | 4.89 | 5 | 7.12 | 1.69 | 1992–2010 | -4.36 to 8.13 | 0.57 |
| Soft tissue and other extraosseous sarcomas | 45 | 6.53 | 6.84 | 5 | 10.22 | -24.40 | 1992–1998 | -37.07 to -9.17 | 0.01 |
| 21.86 | 1998–2006 | 0.80 to 47.31 | 0.04 | ||||||
| -25.26 | 2006–2010 | -49.89 to 11.46 | 0.14 | ||||||
| Territories | |||||||||
| All childhood cancers (malignancies only) | 25 | 100.00 | 100.00 | 0 | 95.99 | 0.42 | 1992–2010 | -3.46 to 4.45 | 0.82 |
| All childhood cancers including non-malignant CNS tumors | 25 | 100.00 | 100.00 | 0 | 95.99 | 0.42 | 1992–2010 | -3.46 to 4.45 | 0.82 |
| Data sources: Canadian Cancer Registry (CCR) database at Statistics Canada and Quebec Cancer Registry (2008-2010). | |||||||||
| Total cases | % (including non-malignancies) |
% (malignancies only) |
Average annual cases |
Average ASIR |
APC | Year | 95% CI | p-value | |
|---|---|---|---|---|---|---|---|---|---|
| British Columbia | |||||||||
| All childhood cancers (malignancies only) | 940 | 96.31 | 100.00 | 50 | 145.09 | -0.07 | 1992–2010 | -1.56 to 1.43 | 0.92 |
| All childhood cancers including non-malignancies brain | 975 | 100.00 | 103.83 | 50 | 150.57 | 0.00 | 1992–2010 | -1.50 to 1.52 | 1.00 |
| Leukemias, myeloproliferative diseases, and myelodysplastic diseases | 310 | 32.07 | 33.30 | 20 | 48.97 | -0.57 | 1992–2010 | -2.78 to 1.70 | 0.60 |
I(B) Acute myeloid leukemias |
50 | 5.02 | 5.21 | 5 | 7.50 | -17.65 | 1992–1996 | -37.50 to 8.50 | 0.15 |
| 38.45 | 1996–1999 | Table 5 - Footnote – | 0.38 | ||||||
| -10.68 | 1999–2010 | -16.27 to -4.72 | < 0.01 | ||||||
| Lymphomas and reticuloendothelial neoplasms | 70 | 7.27 | 7.55 | 5 | 10.49 | -1.96 | 1992–2010 | -6.17 to 2.43 | 0.35 |
| CNS and miscellaneous intracranial and intraspinal neoplasms | 190 | 19.26 | 20.00 | 10 | 29.01 | 0.95 | 1992–2010 | -1.80 to 3.77 | 0.48 |
| CNS and miscellaneous intracranial and intraspinal neoplasms including non-malignancies | 220 | 22.95 | 23.83 | 15 | 34.49 | 0.93 | 1992–2010 | -1.73 to 3.67 | 0.47 |
| Neuroblastoma and other peripheral nervous cell tumors | 85 | 8.71 | 9.04 | 5 | 13.76 | 1.44 | 1992–2010 | -2.01 to 5.01 | 0.40 |
| Renal tumours | 50 | 5.12 | 5.32 | 0 | 7.80 | -2.06 | 1992–2010 | -6.62 to 2.73 | 0.37 |
| Malignant bone tumours | 60 | 6.15 | 6.38 | 5 | 8.75 | -1.80 | 1992–2010 | -5.81 to 2.37 | 0.37 |
| Soft tissue and other extraosseous sarcomas | 65 | 6.66 | 6.91 | 5 | 9.83 | 0.67 | 1992–2010 | -3.22 to 4.73 | 0.72 |
| Germ cell tumors, trophoblastic tumors, and neoplasms of gonads | 35 | 3.59 | 3.72 | 5 | 5.14 | 2.86 | 1992–2010 | -2.08 to 8.04 | 0.24 |
| Other malignant epithelial neoplasms and malignant melanomas | 40 | 3.79 | 3.94 | 5 | 5.48 | 0.30 | 1992–2010 | -4.31 to 5.14 | 0.89 |
| Prairies | |||||||||
| All childhood cancers (malignancies only) | 1305 | 94.77 | 100.00 | 70 | 130.92 | -0.24 | 1992–2010 | -1.18 to 0.72 | 0.61 |
| All childhood cancers including non-malignancies brain | 1375 | 100.00 | 105.52 | 75 | 138.09 | -0.35 | 1992–2010 | -1.31 to 0.62 | 0.45 |
| Leukemias, myeloproliferative diseases, and myelodysplastic diseases | 410 | 29.72 | 31.37 | 20 | 41.42 | -0.02 | 1992–2010 | -1.47 to 1.46 | 0.98 |
| Lymphomas and reticuloendothelial neoplasms | 110 | 8.28 | 8.74 | 5 | 11.28 | 3.50 | 1992–2010 | 0.26 to 6.84 | 0.04 |
II(B) Non-Hodgkin lymphomas (except Burkitt lymphoma) |
45 | 3.05 | 3.22 | 0 | 4.21 | 6.03 | 1992–2010 | 1.64 to 10.61 | 0.01 |
| CNS and miscellaneous intracranial and intraspinal neoplasms | 280 | 20.13 | 21.24 | 15 | 27.47 | -1.38 | 1992–2010 | -3.43 to 0.72 | 0.18 |
| CNS and miscellaneous intracranial and intraspinal neoplasms including non-malignancies | 350 | 25.36 | 26.76 | 15 | 34.64 | -1.62 | 1992–2010 | -3.76 to 0.56 | 0.13 |
| Neuroblastoma and other peripheral nervous cell tumors | 100 | 7.49 | 7.90 | 5 | 10.61 | -1.29 | 1992–2010 | -4.42 to 1.93 | 0.40 |
| Retinoblastoma | 45 | 2.98 | 3.14 | 0 | 4.18 | -1.50 | 1992–2010 | -4.86 to 1.99 | 0.37 |
| Renal tumours | 95 | 6.90 | 7.29 | 5 | 9.73 | -0.07 | 1992–2010 | -3.92 to 3.94 | 0.97 |
| Malignant bone tumours | 65 | 4.72 | 4.98 | 5 | 6.30 | 0.64 | 1992–2010 | -4.14 to 5.66 | 0.79 |
| Soft tissue and other extraosseous sarcomas | 75 | 5.74 | 6.06 | 0 | 7.92 | 1.72 | 1992–2010 | -1.76 to 5.33 | 0.32 |
| Germ cell tumors, trophoblastic tumors, and neoplasms of gonads | 60 | 4.22 | 4.45 | 0 | 5.73 | -4.00 | 1992–2005 | -8.39 to 0.60 | 0.08 |
| 11.42 | 2005–2010 | -7.78 to 34.62 | 0.24 | ||||||
| Other malignant epithelial neoplasms and malignant melanomas | 40 | 3.20 | 3.37 | 0 | 4.32 | -4.46 | 1992–2010 | -8.19 to -0.59 | 0.03 |
| OntarioTable 5 - Footnote b | |||||||||
| All childhood cancers (malignancies only) | 3070 | 100.00 | 100.00 | 165 | 149.15 | -0.48 | 1992–2006 | -1.82 to 0.87 | 0.45 |
| 8.96 | 2006–2010 | 0.15 to 18.56 | 0.05 | ||||||
| Leukemias, myeloproliferative diseases, and myelodysplastic diseases | 960 | 31.21 | 31.21 | 50 | 46.64 | 0.58 | 1992–2010 | -1.29 to 2.48 | 0.53 |
Lymphoid leukemias, precursor cell leukemias |
665 | 21.54 | 21.54 | 35 | 32.22 | 10.41 | 1992–1996 | -8.74 to 33.58 | 0.28 |
| -8.94 | 1996–2004 | -16.60 to -0.57 | 0.04 | ||||||
| 14.42 | 2004–2010 | 3.53 to 26.46 | 0.01 | ||||||
I(E) Unspecified and other specified leukemias |
45 | 1.50 | 1.50 | 5 | 2.26 | 17.14 | 1992–1999 | 1.88 to 34.69 | 0.03 |
| -5.28 | 1999–2010 | -10.93 to 0.73 | 0.08 | ||||||
| Lymphomas and reticuloendothelial neoplasms | 270 | 8.79 | 8.79 | 15 | 12.79 | -0.41 | 1992–2010 | -2.34 to 1.56 | 0.66 |
| CNS and miscellaneous intracranial and intraspinal neoplasms | 615 | 19.95 | 19.95 | 35 | 29.54 | 0.34 | 1992–2010 | -1.17 to 1.86 | 0.64 |
III(A) Ependymomas and choroid plexus tumor |
50 | 1.56 | 1.56 | 5 | 2.38 | -4.60 | 1992–2003 | -11.72 to 3.08 | 0.21 |
| 17.38 | 2003–2010 | 3.29 to 33.38 | 0.02 | ||||||
III(B) Astrocytomas |
285 | 9.40 | 9.40 | 15 | 13.86 | -3.74 | 1992–2010 | -5.84 to -1.59 | < 0.01 |
III(C) Intracranial and intraspinal embryonal tumors |
100 | 3.29 | 3.29 | 5 | 4.91 | 4.01 | 1992–2010 | 1.83 to 6.24 | < 0.01 |
III(D) Other gliomas |
95 | 3.06 | 3.06 | 5 | 4.52 | 3.26 | 1992–2010 | 0.62 to 5.98 | 0.02 |
III(F) Unspecified intracranial and intraspinal neoplasms |
75 | 2.41 | 2.41 | 5 | 3.54 | 15.32 | 1992–2005 | 6.45 to 24.93 | < 0.01 |
| -36.13 | 2005–2010 | -57.62 to -3.75 | 0.03 | ||||||
| Neuroblastoma and other peripheral nervous cell tumors | 195 | 6.41 | 6.41 | 10 | 9.97 | 2.50 | 1992–2010 | -0.51 to 5.60 | 0.10 |
| Retinoblastoma | 80 | 2.64 | 2.64 | 5 | 4.15 | 3.98 | 1992–2010 | 0.91 to 7.15 | 0.01 |
| Renal tumours | 205 | 6.64 | 6.64 | 15 | 9.98 | 10.47 | 1992–1998 | 0.76 to 21.12 | 0.04 |
| -19.07 | 1998–2002 | -38.41 to 6.33 | 0.12 | ||||||
| 7.57 | 2002–2010 | 1.47 to 14.05 | 0.02 | ||||||
VI(A) Nephroblastoma and other nonepithelial renal tumors |
180 | 5.92 | 5.92 | 10 | 8.91 | 12.18 | 1992–1998 | 0.83 to 24.81 | 0.04 |
| -20.40 | 1998–2002 | -42.21 to 9.65 | 0.15 | ||||||
| 8.81 | 2002–2010 | 1.69 to 16.43 | 0.02 | ||||||
| Hepatic tumours | 40 | 1.30 | 1.30 | 0 | 2.04 | -1.61 | 1992–2010 | -6.45 to 3.48 | 0.51 |
| Malignant bone tumours | 140 | 4.59 | 4.59 | 5 | 6.70 | -1.37 | 1992–2010 | -3.93 to 1.26 | 0.28 |
| Soft tissue and other extraosseous sarcomas | 170 | 5.63 | 5.63 | 10 | 8.43 | 1.43 | 1992–2010 | -0.58 to 3.48 | 0.15 |
| Germ cell tumors, trophoblastic tumors, and neoplasms of gonads | 115 | 3.74 | 3.74 | 10 | 5.54 | 1.28 | 1992–2010 | -1.79 to 4.45 | 0.40 |
X(B) Malignant extracranial and extragonadal germ cell tumors |
35 | 1.11 | 1.11 | 0 | 1.74 | 4.76 | 1992–2010 | 0.38 to 9.34 | 0.03 |
| Other malignant epithelial neoplasms and malignant melanomas | 175 | 5.66 | 5.66 | 10 | 8.23 | 5.25 | 1992–2010 | 1.67 to 8.97 | 0.01 |
XI(B) Thyroid carcinomas |
75 | 2.57 | 2.57 | 5 | 3.69 | 7.33 | 1992–2010 | 2.42 to 12.47 | 0.01 |
| Other and unspecified malignant neoplasms | 105 | 3.45 | 3.45 | 5 | 5.14 | 2.82 | 1992–2010 | -1.04 to 6.83 | 0.14 |
| Quebec | |||||||||
| All childhood cancers (malignancies only) | 1910 | 97.40 | 100.00 | 100 | 159.41 | 0.12 | 1992–2010 | -0.73 to 0.99 | 0.76 |
| All childhood cancers including non-malignancies brain | 1965 | 100.00 | 102.67 | 105 | 163.57 | 0.18 | 1992–2010 | -0.68 to 1.04 | 0.67 |
| Leukemias, myeloproliferative diseases, and myelodysplastic diseases | 600 | 30.43 | 31.24 | 30 | 50.25 | 1.06 | 1992–2010 | -0.30 to 2.43 | 0.12 |
| Lymphomas and reticuloendothelial neoplasms | 145 | 7.34 | 7.54 | 5 | 11.64 | 0.39 | 1992–2010 | -3.03 to 3.93 | 0.82 |
| CNS and miscellaneous intracranial and intraspinal neoplasms | 345 | 17.64 | 18.11 | 15 | 28.61 | 0.60 | 1992–2010 | -1.48 to 2.73 | 0.55 |
III(C) Intracranial and intraspinal embryonal tumors |
75 | 3.87 | 3.98 | 5 | 6.24 | -4.69 | 1992–2010 | -8.61 to -0.61 | 0.03 |
| CNS and miscellaneous intracranial and intraspinal neoplasms including non-malignancies | 395 | 20.23 | 20.77 | 25 | 32.77 | 0.92 | 1992–2010 | -1.54 to 3.44 | 0.44 |
III(C) Intracranial and intraspinal embryonal tumors including non-malignancies |
75 | 3.87 | 3.98 | 0 | 6.24 | -4.69 | 1992–2010 | -8.61 to -0.61 | 0.03 |
| Neuroblastoma and other peripheral nervous cell tumors | 195 | 9.79 | 10.05 | 10 | 16.30 | -16.35 | 1992–1997 | -28.80 to -1.73 | 0.03 |
| 2.01 | 1997–2010 | -2.54 to 6.78 | 0.37 | ||||||
| Retinoblastoma | 55 | 2.75 | 2.83 | 0 | 4.68 | 1.03 | 1992–2010 | -3.59 to 5.87 | 0.65 |
| Renal tumours | 135 | 6.98 | 7.17 | 10 | 11.71 | -1.30 | 1992–2010 | -3.55 to 1.00 | 0.25 |
| Malignant bone tumours | 90 | 4.49 | 4.60 | 5 | 7.02 | -2.39 | 1992–2010 | -5.30 to 0.60 | 0.11 |
| Soft tissue and other extraosseous sarcomas | 130 | 6.52 | 6.70 | 5 | 10.63 | 0.83 | 1992–2010 | -1.51 to 3.24 | 0.47 |
| Germ cell tumors, trophoblastic tumors, and neoplasms of gonads | 65 | 3.52 | 3.61 | 5 | 5.69 | -2.02 | 1992–2010 | -6.55 to 2.73 | 0.37 |
| Other malignant epithelial neoplasms and malignant melanomas | 110 | 5.76 | 5.91 | 5 | 9.22 | 3.63 | 1992–2010 | 0.25 to 7.12 | 0.04 |
XI(B) Thyroid carcinomas |
50 | 2.70 | 2.77 | 5 | 4.32 | 8.43 | 1992–2010 | 3.96 to 13.09 | < 0.01 |
| Other and unspecified malignant neoplasms | 30 | 1.33 | 1.36 | 0 | 2.19 | 26.90 | 1992–1996 | -4.07 to 67.87 | 0.09 |
| -66.08 | 1996–1999 | Table 5 - Footnote – | 0.98 | ||||||
| 88.43 | 1999–2003 | Table 5 - Footnote – | 0.39 | ||||||
| -13.52 | 2003–2010 | -29.24 to 5.70 | 0.13 | ||||||
| Atlantic provinces | |||||||||
| All childhood cancers (malignancies only) | 565 | 96.57 | 100.00 | 30 | 149.37 | 0.42 | 1992–2010 | -1.69 to 2.58 | 0.68 |
| All childhood cancers including non-malignancies brain | 585 | 100.00 | 103.55 | 30 | 154.41 | 0.35 | 1992–2010 | -1.67 to 2.41 | 0.72 |
| Leukemias, myeloproliferative diseases, and myelodysplastic diseases | 195 | 33.79 | 34.99 | 15 | 52.90 | 0.30 | 1992–2010 | -2.58 to 3.27 | 0.83 |
I(B) Acute myeloid leukemias |
35 | 6.52 | 6.75 | 0 | 10.43 | 14.42 | 1992–2003 | 4.23 to 25.60 | 0.01 |
| -13.02 | 2003–2010 | -24.21 to -0.17 | 0.05 | ||||||
| Lymphomas and reticuloendothelial neoplasms | 40 | 6.86 | 7.10 | 5 | 10.02 | -0.94 | 1992–2010 | -4.82 to 3.09 | 0.62 |
| CNS and miscellaneous intracranial and intraspinal neoplasms | 115 | 19.21 | 19.89 | 10 | 29.00 | -0.32 | 1992–2010 | -4.18 to 3.69 | 0.87 |
| CNS and miscellaneous intracranial and intraspinal neoplasms including non-malignancies | 130 | 22.64 | 23.45 | 5 | 34.04 | -0.49 | 1992–2010 | -4.13 to 3.29 | 0.79 |
| Neuroblastoma and other peripheral nervous cell tumors | 35 | 5.49 | 5.68 | 5 | 9.25 | -38.68 | 1992–1996 | -57.57 to -11.37 | 0.01 |
| 71.74 | 1996–1999 | Table 5 - Footnote – | 0.46 | ||||||
| 2.00 | 1999–2010 | -5.28 to 9.83 | 0.57 | ||||||
| Renal tumours | 35 | 6.17 | 6.39 | 0 | 10.08 | -0.16 | 1992–2010 | -3.71 to 3.51 | 0.92 |
| Soft tissue and other extraosseous sarcomas | 45 | 7.55 | 7.82 | 0 | 11.35 | 2.60 | 1992–2010 | -2.42 to 7.88 | 0.29 |
| Other malignant epithelial neoplasms and malignant melanomas | 30 | 5.15 | 5.33 | 5 | 7.50 | 4.07 | 1992–2010 | -0.19 to 8.52 | 0.06 |
| Territories | |||||||||
| All childhood cancers (malignancies only) | 30 | 96.77 | 100.00 | 0 | 117.51 | -1.43 | 1992–2010 | -6.31 to 3.72 | 0.56 |
| All childhood cancers including non-malignant CNS tumors | 35 | 100.00 | 103.33 | 5 | 121.20 | -1.33 | 1992–2010 | -6.34 to 3.96 | 0.60 |
| Data sources: Canadian Cancer Registry (CCR) database at Statistics Canada and Quebec Cancer Registry (2008-2010). | |||||||||
Recent incidence counts and rates (2006–2010)
Figure 1 summarizes the distribution of primary cancers for Canada from 2006 to 2010 by age groups for males and females combined and separately. During this period, an average of 910 new diagnoses each year; i.e., a total of 4550 new cases, were reported among children 14 years and under in Canada: 2440 (53.6%) in males and 2110 (46.4%) in females, which amounts to a male:female ratio of 1.2:1. The average annual ASIR was 163.4 per million children, with males having a higher rate than females (170.9 vs. 155.5 per 106 children). Average annual ASIRs for all cancers combined from 2006 to 2010 were lower in the Prairies (149.4 per 106) and higher in Ontario (170.1 per 106) (Figure 2).
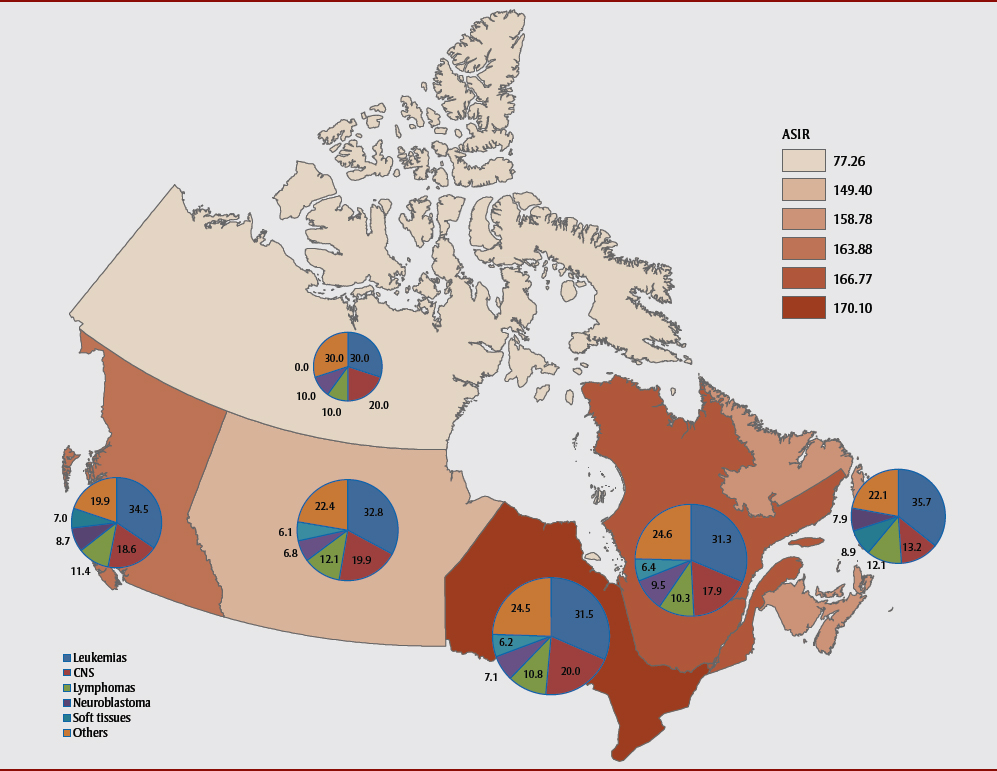
Data sources: Canadian Cancer Registry (CCR) database at Statistics Canada and Quebec Cancer Registry (2008-2010).
Notes:
- The pie charts represent the percentage distribution of new cancer cases in each region.
- The ASIRs were standardized to the 2011 Canadian population.
Figure 2 - Text Description
In this figure presenting a map of Canada, we can see the average annual age-standardized incidence rates (ASIRs) (per million) of all cancers combined and most common cancers by region. Average annual ASIRs for all cancers combined from 2006 to 2010 were lower in the Prairies (149.4 per 106) and higher in Ontario (170.1 per 106). The top 5 most common cancers (leukemias, CNS, lymphomas, neuroblastoma and soft tissues) were similarly distributed within each region, with some variations in proportions and ranking in the Atlantic region, possibly due to Type I error from the small population in the region.
While most adult cancers are carcinomas, childhood cancers show much histologic and biologic diversity, and are mainly not of epithelial origin. Overall, the most common childhood cancers diagnosed from 2006 to 2010 were leukemias (32.3%), CNS tumors (18.9%), and lymphomas (11.1%) (Figure 1). Next most common were neuroblastoma (7.8%), soft tissue sarcoma (6.5%), and renal tumors (5.2%). The top 5 most common cancers were similarly distributed within each region, with some variations in proportions and ranking in the Atlantic region (Figure 2), possibly due to Type I error from the small population in the region. The distribution of the most frequent childhood cancers was generally the same for males and females, except lymphomas were more common in males (13.6% compared to 8.2% ), and carcinomas (especially, thyroid carcinoma) were more common in females (6.1% vs. 3.2%) (Figure 1).
Around half of children’s cancer cases (47.4%) were diagnosed among those under the age of five years (Figure 1). The age-specific incidence rates in children aged less than 5 years were around twice those of their older counterparts. The highest incidence was observed in infants under the age of one year and generally declined with age. Patterns of diagnoses varied considerably by age group. In infants, neuroblastoma formed the most commonly diagnosed cancers and accounted for nearly a third of all cases (26.4%), followed by leukemias (19.6%) and CNS tumours (11.7%). The embryonal tumors of neuroblastoma, retinoblastoma, and nephroblastoma jointly accounted for 42.6% of all diagnoses in infants. Leukemias prevailed among 1–4 year olds, accounting for 42.4% of all diagnoses, while in 5–9 year olds and 10–14 year olds, lymphomas and bone tumours became increasingly common (lymphomas: 12.2% and 21.0%; bone cancers: 5.4 % and 9.5%, respectively). Also in children aged 10–14 years, leukemias (21.5%) and CNS tumours (19.0%) predominated.
Overall temporal trends (1992–2010)
Trends varied greatly by cancer type, although the small numbers of some types may have resulted in extensive random fluctuations in rates even when the trend was statistically significant. The incidence rates of childhood cancer increased by an average of 0.4% per year (95% CI = 0.1–0.8), from 154.8 per million children in 1992 to 169.7 per million in 2010 (Table 1). Leukemia overall and lymphoid leukemia specifically had an equally increase from 1992 through 2010 (APC = 0.6%, CI = 0.1–1.2). Lymphoid leukemia is the most common type in children, accounting for nearly four-fifths (78.5%) of all leukemias and as such largely determined the incidence pattern for leukemia overall. Rates which increased by at least 2% annually over the study period included: unspecified lymphomas (APC = 3.4%; CI = 0.7–6.2), ependymomas (APC = 2.3%, CI = 0.2–4.3), hepatoblastoma (APC = 2.4%, CI = 0.4–4.4), carcinoma (APC = 2.5%, CI = 0.2–4.7), thyroid cancer (APC = 4.2, CI = 1.4–7.1) and melanoma (APC = 2.7%, CI = 0.1–5.4). The data suggested a decrease for malignant gonadal germ cell tumors (APC = −2.3%, CI = −4.4 to −0.03). Figure 3 highlights the trends for all cancers combined and the most common five cancers in children under 15 years of age.
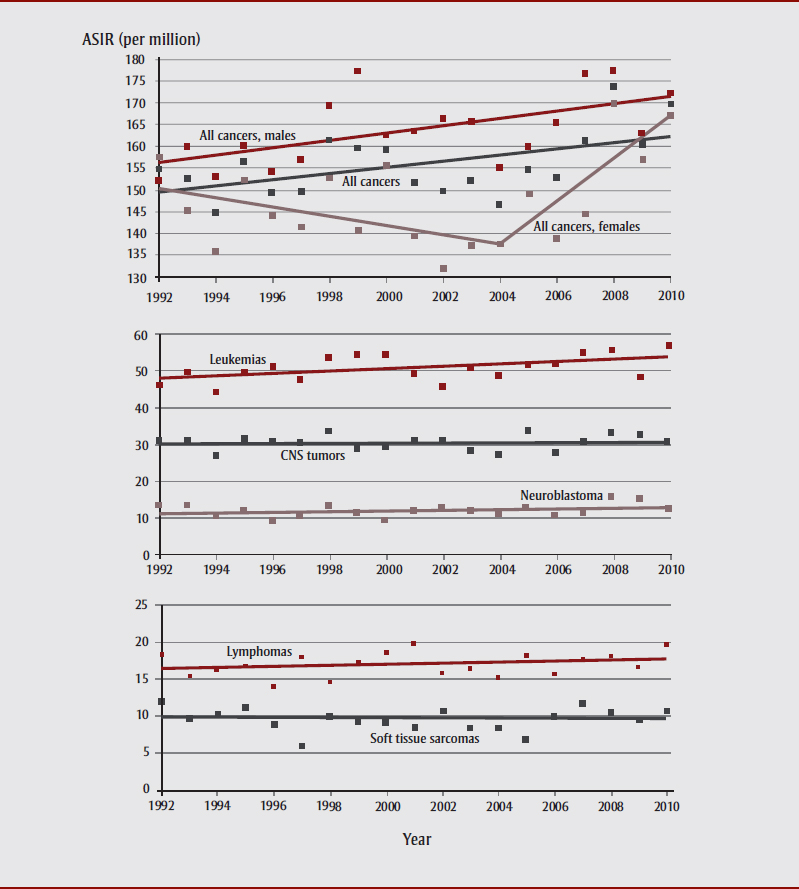
Data sources: Canadian Cancer Registry (CCR) database at Statistics Canada and Quebec Cancer Registry (2008-2010).
Abbreviations: ASIR, age-standardized incidence rate; CNS, central nervous system.
Note: The ASIRs were standardized to the 2011 Canadian population.
Figure 3 - Text Description
This figure highlights the trends for all cancers combined by sex and the most common five cancers in children under 15 years of age. The incidence rates of childhood cancer increased by an average of 0.4% per year (95% CI = 0.1– 0.8), from 154.8 per million children in 1992 to 169.7 per million in 2010. The trend for all cancers combined among males (APC = 0.5%, CI = 0.2–0.9) paralleled the increase observed overall. A break in trend was observed for all cancers combined among females; the rate increased by 3.2% per year (CI = 0.4–6.2) from 2004 to 2010, which followed an initial period of stable rates. Leukemia increased by 0.6% annually from 1992 through 2010 (CI = 0.1–1.2). The incidence rates for CNS tumors, lymphomas, neuroblastomas, and soft tissue sarcomas have remained stable.
Trends by sex
The trends for all cancers combined (APC = 0.5%, CI = 0.2–0.9) and leukemias (APC = 0.8%, CI = 0.03–1.6) among males paralleled the increases observed overall (Table 1). A break in trend was observed for all cancers combined among females; the rate increased by 3.2% per year (CI = 0.4–6.2) from 2004 to 2010, which followed an initial period of stable rates. Positive trends were also observed for other hematologic malignancies over the entire period: miscellaneous lymphoreticular neoplasms in both males (APC = 6.8%, CI = 2.2–11.7) and females (APC = 4.6%, CI = 0.7–8.6), and unspecified lymphomas among males (APC = 3.3%, CI = 0.5–6.2). Some embryonal tumors demonstrated increasing trends in males. An increase occurred for neuroblastoma overall in males (APC = 1.4%, CI = 0.2–2.6), as did its subgroup of neuroblastoma and ganglioneuroblastoma (IV(A)) which comprised nearly all male neuroblastoma cases. Hepatoblastoma constituted four-fifths (81.3%) of all hepatic cancer cases in males; rates of hepatoblastoma increased by 3.2% per year (CI = 0.6–5.9), and drove the increase of 2.2% per year for hepatic cancers overall (CI = 0.01–4.4).
While incidence rates for CNS tumors have remained stable, some of its divisions showed significant changes. Notably, ependymomas increased among females (APC = 3.0%, CI = 0.6–5.4), echoing the rate transition of this disease overall. Incidence of carcinoma among females increased (APC = 2.9%, CI = 0.6–5.4), as did its subgroup of thyroid cancer (APC = 4.9%, CI = 1.8–8.0). For malignant gonadal germ cell tumors, the rate in males decreased (APC = −4.0%, CI = −6.7 to −1.2), with a non-significant less rapid decline in rates noted in females (APC = −1.4%, CI = −4.7 to 2.1).
Trends by age group
The overall increasing trend for all cancers combined was suggested among children aged 1–4 years (APC = 0.9%, CI = 0.4–1.3), whereas the rates appeared stable in other age groups (Table 2). Specifically, the incidence rate of lymphoid leukemias increased among children aged 1–4 years (APC = 0.9%, CI = 0.1–1.8).
Astrocytoma formed the largest subgroup of all CNS tumors, constituting more than two-fifths (45.0%) of the total. The incidence proportion of astrocytoma increased with age, from 32.4% in infants to 52.4% in late childhood. The rates of astrocytoma decreased by 2.1% annually among children aged 10–14 years (CI = −3.7 to −0.5) and appeared stable in the under-tens over the entire study period. In line with the trend observed overall and in females, the rates of ependymomas increased in infants and late childhood (APC = 5.6%, CI = 1.9–9.4 and APC = 5.1%, CI = 1.5–8.9, respectively), although the rates were based on small numbers of cases.
Several types of embryonal tumors demonstrate age difference in incidence trends. The rates increased by 1.6% per year (CI = 0.2–3.1) for neuroblastoma overall and equally for neuroblastoma and ganglioneuroblastoma (IV(A)) for children ages 1–4 years. Hepatoblastoma comprised nearly all hepatic cancer cases in children under 5 years of age. In children aged 1–4 years, rates of hepatoblastoma increased by 3.7% per year (CI = 1.1–6.4).
Trends by geographic area
Trends by geographic area are presented for both sexes combined (Table 3) and individually (Table 4 and 5). The rates of all cancers combined increased the most in Ontario from 2006 (APC = 5.9%, CI = 1.9–10.1) after a preceding stable period, and increased non-significantly in the other regions from 1992 to 2010. Positive trends in Ontario were noted for both sexes: while the trend among females was very similar to those observed overall, increases in trends in males occurred between 1992 and 2002 (APC = 1.6%, CI = 0.5–2.7), and more rapidly between 2005 and 2010 (APC = 5.0%, CI = 1.9–8.2).
Some lymphohematopoietic malignancies demonstrated increasing trends in Ontario and the Prairies: lymphoid leukemias among males (APC = 1.4%, CI = 0.3–2.5) and among all children (APC = 1.3%, CI = 0.2–2.4), and unspecified lymphomas (APC = 4.3%, CI = 1.3–7.5) in Ontario; as well as lymphomas in females (APC = 3.5%, CI = 0.3–6.8), and non-Hodgkin lymphomas (except Burkitt lymphoma) in males and females combined (APC = 4.8%, CI = 1.6–8.1) and separately (males: APC = 3.8%, CI = 0.3–7.5; females: APC = 6.0%, CI = 1.6–10.6) in the Prairies. Two joinpoints suggest shifts in the direction of the trend for a subgroup of lymphoid leukemia, precursor cell lymphoblastic leukemia in Ontario for both sexes individually and combined: an early non-significant rise and a recent significant more rapid increase since 2004.
Amphi-directional incidence trends of CNS tumors were noted in some regions. Rates of CNS tumors in Ontario decreased non-significantly by 1.4% per year from 1992 to 2004 (CI = −2.8 to 0.1), and subsequently increased significantly by 5.0% per year from 2004 to 2010 (CI = 1.0–9.2). In comparison, the rates in the Atlantic region displayed a reverse trend. The ASIRs of CNS tumors in the Atlantic region were the highest in the country during 2002–2004 and then dropped to the lowest in 2005, and 2007–2010 (data not shown). Incidence of astrocytoma in Ontario decreased consistently over the study horizon in males (APC = −2.4%, CI = −4.6 to −0.2) and females (APC = −3.7%, CI = −5.8 to −1.6), while increases were observed for ependymomas (APC = 3.3%, CI = 0.7–6.1), intracranial and intraspinal embryonal tumors among females (APC = 4.0%, CI = 1.8–6.2), and other gliomas in males and females combined (APC = 4.5%, CI = 2.3–6.7) and separately (males: APC = 4.7%, CI = 1.0–8.5; females: APC = 3.3%, CI = 0.6–6.0).
Significant changes were also observed for other embryonal tumors in central Canada. Neuroblastoma in females in Quebec decreased significantly by 16.4% per year from 1992 to 1997, but increased non-significantly by 2% thereafter. For neuroblastoma in males in Quebec, a joinpoint was not suggested for the best fitted model, but an one-joinpoint model showed a similar but non-significant trend as that in females: the rates dropped by 7.0% (CI = −22.6 to 11.7) per year during 1992–1997, and then rose by 2.6% (CI = −2.1 to 7.5) (data not shown). Retinoblastoma increased by 4% annually (CI = 0.9–7.2) over the entire period in females in Ontario. Two breaks in trend show that there have been early (in the 1990s) and recent (since 2002), significant increases in the incidence of nephroblastomas in females in Ontario, and a corresponding trend was evident in renal tumors as a whole. There is a suggestion, however, that renal tumors among males decreased by 3.3% per year (CI = −6.4 to −0.1) in the Prairies.
The increases were similar for carcinoma in Ontario and Quebec, mainly driven by the increases in thyroid cancers more specifically among females. Bone cancer in Quebec decreased by 4.9% (CI = −8.5 to −1.2) per year from 1992 to 2002 for males and females combined and increased by 6.2% (CI = 0.4–12.3) thereafter.
Discussion
Our study found that the incidence rates of childhood cancer increased by an average of 0.4% per year from 1992 to 2010. Similar increases have been documented in the United States,Footnote 5 Australia,Footnote 6 in European countries,Footnote 7 in Asian nations,Footnote 8 and internationally.Footnote 16 A study using data from the National Cancer Institute’s Surveillance, Epidemiology, and End Results (SEER) program indicated that the overall cancer incidence rates increased non-significantly by 0.4% per year between 1992 and 2004 in the US,Footnote 5 consistent with our change magnitude. The non-significant increase was updated to continue (APC = 0.3%, CI = −0.1 to 0.7) during 2001–2009 based on data which provided greater population coverage.Footnote 17 Considering the findings on all cancers combined from Ellison et al. who examined the top 5 most common cancers at the national level over the same time frame,Footnote 4 our study had comparable results for males and both sexes combined; however, it also revealed a recent substantial increase among females.
For the period from 2001 to 2010, our study showed an annual increase in overall rates of 1.5% (CI = 0.6–2.4), driven mainly by the increase in cancer rates in females (APC = 2.5%, CI = 1.2–3.8) (data not shown). The overall trend in females is due in large part to the rate increases in leukemias (APC = 2.3%, CI = 0.5–4.2), lymphomas (APC = 1.8%, CI = −1.9 to 5.6), neuroblastoma (APC = 3.7%, CI = −0.8 to 8.5), soft tissue sarcoma (APC = 3.9%, CI = −0.8 to 8.8), and most pronouncedly in thyroid cancer (APC = 10.4%, CI = 3.4–17.8) (data not shown). Regarding an earlier period (1985–1992), Health Canada reported that the incidence rates for all cancers combined in children and teenagers aged under 20 tended to increase slightly.Footnote 18
Broad similarities in the increase of ASIRs for some cancers raise questions as to the potential for common etiologies, given the etiology of pediatric cancer is largely unknown. Several hypotheses have been put forward to explain the trends. The changes may partially be artefacts of changes in classification, increased use of advanced diagnostic technology, and improved cancer reporting. The overall increases were confined to 1992–1999 and 2003–2010, mirrored trends in leukemias, lymphomas, soft tissue sarcoma, and CNS tumors (data not shown). The increases which occurred in 1992–1999 coincided with the introduction of ICCC in 1996 and the increased use of magnetic resonance imaging (MRI) during 1990–2001, whereas the increase which occurred in 2003–2010 coincided with the introduction of ICD-O-3 in 2001 and the increased use of molecular tests to supplement pathological diagnosis in an attempt to improve the precision and objectivity of the histopathological diagnosis. The incidence trends in children have also been associated with changes in environmental exposures or gene-environment interactions, parental lifestyle, changes in birth weight, or changes in social structures.Footnote 7
The observed increased incidence trends could, in part, be explained as an artefact of increases in survival. Prognosis has been improving in the last three decades as a result of more accurate diagnoses and improved treatment strategies. Research has shown that risk for subsequent malignant neoplasms is higher for childhood cancer survivors than is the risk for cancer in people of the same age in the general population.Footnote 19 Our data show that the percentage of second or third cancers increased from 0.7% in 1992 to 4.1% in 2006 (with an interruption in 2004), and then dropped sharply in males; as it did in females but with a smaller increase (data not shown). These increases of subsequent malignant neoplasms in Canada coincide with the magnitude and significance of the increases in the overall incidence trends.
Risk of pediatric cancer has been linked to maternal age at birth. A large US case–control study reported an increase of 8% in overall childhood cancer risk for each quinquennial increase in maternal age, with similar increases for most of the frequent cancers.Footnote 20 Maternal age could also be a marker for unknown environmental exposures which may have changed over time.Footnote 6 As in most developed countries, the average maternal ages at both first and all childbirths have risen since the mid-1970s in Canada.Footnote 21 During our study period, the average age at all childbirths increased from 27.9 years in 1992 to 30.1 years in 2010.Footnote 21 The rise of maternal age might have contributed to the incidence increase, but the extent to which this might occur is unknown.
Childhood cancer is characterized by heterogeneity, different cancers likely have different etiologies. To follow up our findings, it would be useful to identify the tumour types and population groups that were specifically affected by these trends. The strongest increase of ASIRs for all cancers combined is seen in children aged 1–4 years. The rise is driven, in large part, by an increase in leukemia, which is the most common cancer (accounting for a third of all cancers) in children. Ontario experienced the most pronounced increase from 2006 to 2010 for all cancers combined, and for leukemia, subgroups of lymphomas, CNS tumors, embryonal tumors, carcinoma and thyroid cancer. While demographic and/or etiologic differences could potentially exist between the geographic regions, the variation in cancer registry practices could also explain the geographical differences in cancer incidence.
Leukemia overall and lymphoid leukemia specifically had an equally significant increase. The incidence rate of lymphoid leukemia also increased significantly in those aged 1–4 years. Similar increases in leukemia have been reported in other developed countries.Footnote 5,Footnote 6,Footnote 22 Previous studies have shown that ionizing radiation, certain genetic disorders, high birth weight, cytotoxic alkylating agents, parental age, parental smoking, prenatal and postnatal pesticide exposures, residential traffic-related air pollution and prenatal exposure to infectious agents such as John Cunningham virus have been associated with leukemia in children.Footnote 23,Footnote 24,Footnote 25,Footnote 26,Footnote 27 Fetuses and young children might be more susceptible to the exposures because of their underdeveloped detoxification mechanisms or higher intake rates relative to their body weight compared with older children. There is considerable evidence of a positive association between improving socioeconomic status and a peak incidence of precursor B-cell acute lymphoblastic leukemia (ALL) in children aged 2–3.Footnote 28 It has also been suggested that aberrant immune response to delayed infection by unknown agents may play a role in conversion of preleukemic clones into overt precursor B-cell ALL.Footnote 23 Precursor cell lymphoblastic leukemia increased non-significantly by 0.4% per year (CI = −0.6 to 1.5) among Canadian children aged 1–4 years from 1992 to 2010 (Table 2), whereas a significant increase of the disease in Ontario was confined to 2004–2010 (Table 3). A Canadian spatial study found that areas with a higher proportion of immigrants had higher childhood leukemia incidence rates.Footnote 29 The proportion of immigrants in Canada steadily increased from 16.1% of the total population in 1991 to 18.4% in 2001 and 20.6% in 2011.Footnote 30 The percentage of immigrants who settled in Ontario was over 50% from 1992 to 2006,Footnote 31 with the proportion of immigrants increasing from 25.6% of the total provincial population in 1996, to 26.8% in 2001 and 28.3% in 2006.Footnote 32 The increased immigrant population may play a role in the observed increases in cancer incidence. However this association is from a single study.
The stable rate of CNS tumors was also observed in the US for similar reporting periods (1992–2004Footnote 5 and 1987–2009Footnote 33). The increase of CNS tumors in the US confined to 2000–2010 is comparable to the Ontario trend.Footnote 22 Also, a significant change in rate was found for non-malignant brain tumors in the US population. It has been suggested that the increase is likely attributable to changes in the detection and reporting of these diseases.Footnote 34 The recent increase of CNS tumors in Ontario may reflect the increased use of molecular markers to supplement pathological diagnosis.
The International Agency for Research on Cancer (IARC) stated that X-radiation and gamma-radiation, forms of ionizing radiation, are the only established risk factors for CNS cancers.Footnote 35 IARC also groups radiofrequency non-ionizing radiation from telecommunications as a possible cause of CNS malignancies, with limited evidence.Footnote 35,Footnote 36 Genetic and hereditary conditions are associated with an increased risk. Changes in environmental and medical exposures or gene-environment interactions, such as ionizing radiation and pesticides have been linked to the recent increases in incidence of CNS tumors.Footnote 37 A Canadian study found a positive association between astrocytoma and maternal exposure to residential air pollution.Footnote 24
Our study shows that incidence of hepatoblastoma has risen 2.4% per year between 1992 and 2010. An annual increase of 4% was observed in the US between 1992 and 2004.Footnote 5 Although few causes of hepatoblastoma have been established, several clues have emerged. StudiesFootnote 38,Footnote 39,Footnote 40 have found a strong association between hepatoblastoma and very low birth weight (VLBW) (< 1500 g), suggesting an iatrogenic etiology. Risk of hepatoblastoma was elevated 20-fold in Children with VLBW, and doubled in children with moderately low birth weight (1500–2500 g).Footnote 38 It has been previously noted that the rise in hepatoblastoma corresponds to the increase in the frequency of low or very low weight births in the US.Footnote 41 The Public Health Agency of Canada reported that the low birth weight rate generally increased from 2001 to 2010 in Canada.Footnote 42 Furthermore, the survival rate of low birth weight babies in Canada has increased with improved neonatal care. These together may, in part, account for the increased trend in hepatoblastoma in this study.
As presented in our data, neuroblastoma is the most common pediatric cancer diagnosed in infants,Footnote 43 accounting for 26.4% of all diagnoses in Canada. It is the third most frequent cancer in children 1–4 year olds, accounting for 10.5% of all cases (Figure 1). The incidence of neuroblastoma increased significantly in children 1–4 year olds during 1992–2010, similar to patterns observed in Europe.Footnote 43 Increased use of advanced diagnostic techniques, detecting latent or asymptomatic tumours, may have contributed to the observed increase in incidence.Footnote 44 The large declines in neuroblastoma in Quebec noted in the 1992–1997 period reflects the ending of a large screening trial in 1994 which resulted in the identification of many cases of neuroblastoma which may otherwise never have been clinically detected.Footnote 45
The rapid increase of pediatric thyroid cancer was confirmed by other studies.Footnote 17,Footnote 46 Siegel et al. reported that thyroid cancer incidence rates increased by 4.9% per year (CI = 3.2–6.6) among US children and adolescents (less than 20 years of age) during 2001–2009.Footnote 17 Previous studies have also revealed increased rates of thyroid cancers among adults in Canada and other countries.Footnote 1,Footnote 47,Footnote 48 It is unknown if causes for the increase in thyroid carcinomas in children are the same as those in adults. Increased use of advanced diagnostic technologies has contributed to the detection of small, subclinical thyroid tumors.Footnote 49 More frequent use of imaging to diagnose benign thyroid diseases, which are more common in females than males, may explain the more increase of thyroid cancer in females.Footnote 49 On the other hand, it has been shown that exposure to radiation by increased use of CT scansFootnote 50 may increase risk of thyroid cancer.Footnote 51,Footnote 52 There is also evidence of a positive association between obesity and adult thyroid cancer risk.Footnote 53,Footnote 54 The increased obesity prevalence among the pediatric populationFootnote 55,Footnote 56,Footnote 57 may be responsible for some of the increases in thyroid cancer.
The annual significant decrease of 2.1% in astrocytoma incidence among children aged 10–14 years is similar to the non-significant decrease (APC = −1.9, CI = −4.4 to 0.8) in the same age group between 1992 and 2004 observed in the US.Footnote 5 The decrease of astrocytoma could be partially explained by improvements in diagnosis and classification with implementation of the ICD-O-3 in 2001. As per ICD-O-3, pilocytic astrocytomas are coded as uncertain/borderline tumors (morphological code 9421/1), and thus, were excluded from analysis of the malignant cases. In addition, the decrease of astrocytomas not otherwise specified (NOS) suggests improvements in precise diagnostic classification of CNS tumors.Footnote 33 Declining incidence trends for malignant gonadal germ cell tumors accords with the reduction in prevalence of congenital anomalies.Footnote 20,Footnote 58
Strengths and limitations
Our findings should be interpreted in the context of study limitations and strengths. Although the provincial and territorial cancer registries strive to find and define new cancer cases according to the national standard, reporting procedures and completeness remain inconsistent across the registries.Footnote 1 The incidence of some cancers in Quebec, particularly for those that rely more heavily on pathological diagnosis, are underestimated as a result of the registry’s dependence on hospitalization data during the study period. Although all provincial and territorial cancer registries now record cancers according to the SEER rules for multiple primaries, not all registries were able to report according to the new requirements beginning in 2007.Footnote 9
Cancer incidence may be under-reported in some provinces due to missing information on “death certificate only” (DCO) cases or incomplete linkage of cancer data with vital statistics information for the data used in this study. The number of DCO cases from 2008 to 2010 in Newfoundland and Labrador (NL) was estimated based on 2007 data. NL has recently implemented death clearance processes to improve case ascertainment and have also improved the case reporting from areas that previously under-registered cases. In Quebec, DCO cases were incompletely recorded before 2000. The number of DCO cases for 2010 in Quebec was calculated as the average of 2005 to 2009 data. Ontario did not report DCO cases for 2008 to 2010. Their number of DCO cases for these three years was estimated by averaging the DCO cases in 2003 to 2007. The number of DCO cases is below 2% of total new cases.
Non-malignant brain tumors are not routinely captured or reported to CCR, and these cases in CCR are underreported based on our analysis (data not shown). Inclusion of benign brain tumors in the analysis could result in an artefact when comparing incidence across time and geographic area, given the incompleteness of the data collection. For example, the analysis based on the dataset comprising non-malignant along with malignant CNS tumors did not detect the statistically significant break in the ASIR trend for all cancers combined in females. Another example is that the addition of a preponderance of non-malignant cases (86%) to the total of other specified intracranial and intraspinal neoplasms (III(E)) resulted in a significant joinpoint trend in the 5–9 year age group (Table 2).
A Type I error may have biased the results for the diagnostic groups with only a small number of cases. Multiple tests were performed with adjustment to control the overall over-fitting error probability of 0.05; because of small numbers, random fluctuations in rates may erroneously show as significant certain trends. Therefore, trends involving a small number of cases and those with wide confidence intervals should be interpreted critically. For example, the increase of non-Hodgkin lymphomas (except Burkitt lymphoma) among females in the Prairies involved a small number of cases (45) between 1992 and 2010. Some significant findings show significance that is close to the cut-off of 0.05, e.g. decreasing malignant gonadal germ cell tumors, and increasing hepatic cancers in males. These trends should be further validated.
The increases of all cancers and selected malignancies varied in magnitude and significance among regions. The statistical significance achieved in Ontario may be a reflection of the size of its population.
Differences in trends by tumor type, sex, age, and region were described in this study but the relationships among the trends were not tested statistically. The results therefore may include spurious associations.
The principal strength of CCR is the complete population coverage and high data quality. Our analysis provides current trends in childhood cancer incidence, and to our knowledge represents the first report for the detailed diagnostic groups in demographic and geographic context.
Conclusion
In summary, overall incidence rates of childhood cancer have slowly increased since 1992. Statistically significant increases were observed in several malignancies such as leukemia, unspecified lymphoma, ependymoma, hepatoblastoma, thyroid and melanoma. The differences in the temporal trends were also registered by sex, age, and geographic area. The rates for all cancers combined increased the most in Ontario, and increased non-significantly in the other regions from 1992 to 2010. Another new finding is that astrocytoma incidence decreased significantly among children aged 10–14 years. Given the limited understanding of pediatric cancer etiology, this study underscores the value of surveillance in creating opportunities to seek insights into the factors driving incidence trends. This knowledge may ultimately help inform public health policy and programs.
Acknowledgements
We acknowledge the collaboration between the provincial and territorial cancer registries and the Health Statistics Division of Statistics Canada for providing the Canadian Cancer Registry data. We thank the Quebec Cancer Registry for providing their aggregate data for 2008 to 2010. We thank Mr. Robert Semenciw, formerly from the Public Health Agency of Canada (PHAC), for providing expert advice on cancer surveillance, and reviewing the manuscript. We thank Dr. Dianne Zakaria of PHAC for discussions on analysis method, and Dr. Shiliang Liu for discussions on risk factors. We also thank Ms. Judy Snider for reviewing the manuscript.
Conflicts of interest
The authors declare no conflicts of interest.
Author contributions and statement
All authors contributed to study design, interpretation of the data, and drafting and/or revising the paper. LX performed the analysis.
The content and views expressed in this article are those of the authors and do not necessarily reflect those of the Government of Canada.