
At-a-glance – Concurrent monitoring of opioid prescribing practices and opioid-related deaths: the context in Nova Scotia, Canada
Health Promotion and Chronic Disease Prevention in Canada
Emily Schleihauf, MAEAuthor reference 1; Kirstin Crabtree, BHIM, CHIMAuthor reference 2; Carolyn Dohoo, MScAuthor reference 3; Sarah Fleming, MScAuthor reference 4; Heather McPeake, MBA, MAAuthor reference 2; Matthew Bowes, MD, FRCPC (5)
https://doi.org/10.24095/hpcdp.38.9.05
Author references:
- Author reference 1
-
Public Health Agency of Canada, Halifax, Nova Scotia, Canada
- Author reference 2
-
Nova Scotia Prescription Monitoring Program, Dartmouth, Nova Scotia, Canada
- Author reference 3
-
Public Health Agency of Canada, Ottawa, Ontario, Canada
- Author reference 4
-
Nova Scotia Department of Health and Wellness, Halifax, Nova Scotia, Canada
- Author reference 5
-
Nova Scotia Medical Examiner Service, Dartmouth, Nova Scotia, Canada
Correspondence: Emily Schleihauf, 51 Garland Ave., Dartmouth, NS B3B 0J2; Tel: 902-403-7042; Email: emily.schleihauf@canada.ca
Abstract
Timely public health surveillance is required to understand trends in opioid use and harms. Here, opioid dispensing data from the Nova Scotia Prescription Monitoring Program are presented alongside fatality data from the Nova Scotia Medical Examiner Service. Concurrent monitoring of trends in these data sources is essential to detect population-level effects (whether intended or unintended) of interventions related to opioid prescribing.
Keywords: public health surveillance, opioid-related disorders, prescription drug monitoring programs, coroners and medical examiners
Highlights
- The annual opioid toxicity mortality rate in Nova Scotia remained stable from 2011 to 2017.
- The number of individuals dispensed any opioid (excluding those used for treatment of dependency) has decreased over time in Nova Scotia. The number of morphine equivalents dispensed has also decreased in recent quarters.
- Because changes in the availability of prescription opioids can influence illicit opioid markets, timely monitoring of trends in both opioid dispensing and toxicity fatalities by opioid type is essential to understand the impact of changes to prescribing guidelines.
Introduction
Acute opioid toxicity claimed an estimated 2861 lives in Canada in 2016.Footnote 1 The introduction of highly potent opioids, mainly nonpharmaceutical fentanyl, into illicit drug markets in Canada and the USA has been a major factor in significant increases in acute opioid toxicity mortality rates in some jurisdictions.Footnote 1Footnote 2Footnote 3 In others, including Nova Scotia (NS), there has not been an increase in opioid toxicity mortality to date.Footnote 1
Correlations between population-level prescription opioid consumption and opioid-related morbidity and mortality rates have been well documented.Footnote 4Footnote 5Footnote 6 Research also supports the individual-level association between higher morphine milligram equivalents (MME) prescribed and risk of toxicity death.Footnote 7 The recent revisions to opioid prescribing guidelinesFootnote 8Footnote 9 have offered regulators a powerful mechanism to impact outmoded prescribing behaviours and promote new considerations for therapeutic interventions related to pain and dependency. Considering the evidence that some people who use prescription opioids switch to or use heroin concurrently over time,Footnote 10Footnote 11 that changes in the availability of prescription opioids can influence drug availability and price in the illicit opioid market,Footnote 11Footnote 12 and that nonpharmaceutical opioids contributed to the majority of opioid deaths in jurisdictions with high mortality rates,Footnote 2Footnote 3 the fundamentals of these aspects of “supply” and “demand” are important to consider.
Understanding the pathways for pharmaceutical and nonpharmaceutical opioid access is central to designing intervention strategies and informing policy development. Where dispensing information is available, it is possible to monitor prescribing trends concurrently with opioid-related death data as part of a comprehensive public health surveillance system. This report highlights the findings of these surveillance activities in NS.
Methods
Data sources
All deaths that may be due to drug intoxication fall within the legislative mandate of the Nova Scotia Medical Examiner Service (NSMES). The NSMES uses an electronic application to collect and store case information, including demographics and cause of death, related to fatality investigations. As standard practice, the medical examiners include the generic names of the parent drugs contributing to death in the cause of death statement and routine toxicology testing covers numerous fentanyl analogues and other novel opioids. We extracted data for cases investigated by NSMES for deaths occurring between 1 January, 2011, and 31 December, 2017.
Since its inception in 1993, the Nova Scotia Prescription Monitoring Program (NSPMP) has been monitoring all community pharmacy dispensing of opioids listed as controlled substances in the Controlled Drugs and Substances Act.Footnote 13 The data we extracted from the NSPMP database included counts of unique health card numbers for which monitored opioids were dispensed and sums of MME, by drug type and quarter from 2011 to 2017. MME were not assigned to methadone, buprenorphine or to infrequently prescribed opioids butorphanol, diphenoxylate, normethadone, opium, pentazocine, tapentadol, or sufentanil.
Case definitions
Deaths that occurred in NS and were investigated by the NSMES were included in our study. Cause and antecedent causes of death were used to classify acute toxicity deaths, by specific opioid type, according the case definitions in Table 1.
| Nature of case | Acute opioid toxicity death | Suspected nonpharmaceutical fentanyl toxicity death |
|---|---|---|
Confirmed case |
Cause of death is acute drug toxicity with one or more opioids listed |
Cause of death is acute fentanyl toxicity (with or without other drugs) History or scene investigation indicates use of nonpharmaceutical fentanyl powder/tablets No evidence of pharmaceutical patches or hospital administration of fentanyl |
Probable case |
Cause of death remains under investigation post-autopsy Positive toxicology findings for one or more opioids |
Cause of death remains under investigation Positive toxicology findings for fentanyl No evidence of pharmaceutical patches or hospital administration of fentanyl |
We categorized nonpharmaceutical opioid toxicity deaths to include suspected nonpharmaceutical fentanyl, fentanyl analogues, heroin and U-47700. No other nonpharmaceutical opioids were reported among opioid toxicity deaths in NS during the time period. Opioid toxicity fatalities are often multidrug toxicity events involving multiple drugs from various drug classes. Fatality data presented by opioid type are not mutually exclusive; total numbers of fatalities are less than the sum of fatalities by drug type.
Analysis
We conducted our analyses of NSMES and NSPMP data using Stata software version 13.0 (StataCorp, College Station, TX, USA) and Microsoft Excel 2016 (Microsoft Corporation, Redmond, Washington, USA). Population estimates were based on Statistics Canada census data from 2011 and 2016.
Results
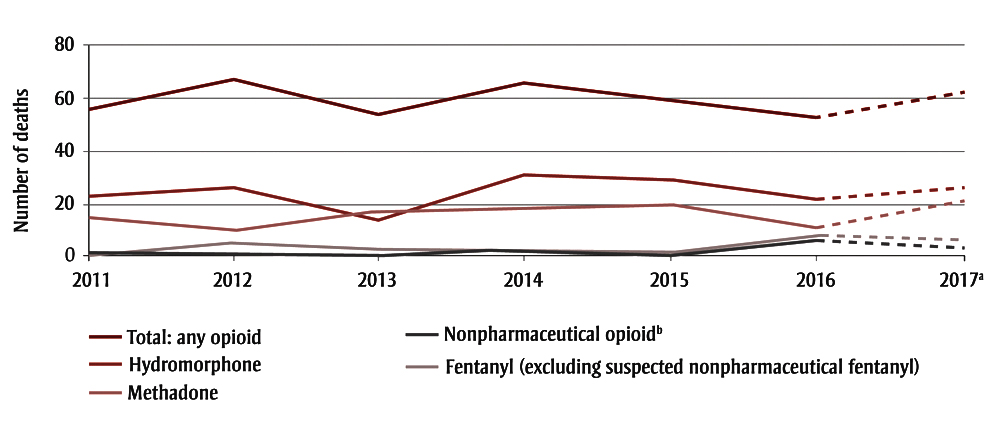
The acute opioid toxicity mortality rate in NS remained stable from 2011 to 2017, with a mean annual rate of 6.3 deaths per 100 000 population. Hydromorphone was involved in the largest proportion of deaths, followed by methadone (Figure 1). The number of deaths related to nonpharmaceutical opioids increased in 2016 (Figure 1), when six deaths were attributed to nonpharmaceutical fentanyl, furanyl-fentanyl, despropionyl fentanyl, U-47700 and heroin (sometimes in combination). In comparison, nonpharmaceutical opioids caused between zero and two deaths per year in previous years, of which all but one were related to heroin. In 2017, there were three toxicity deaths related to nonpharmaceutical opioids, which included toxicity related to suspected nonpharmaceutical fentanyl, despropionyl fentanyl and U-47700 (sometimes in combination).
Figure 1. Confirmed and probable acute opioid toxicity deaths in Nova Scotia by drug type and year, 2011 to 2017Figure 1 Footnote a
- Figure 1 Footnote a
-
2017 data are incomplete as toxicology results remain outstanding for some December cases. Nineteen percent of 2017 cases were classified as probable and remain under investigation; <1% of cases for 2011 to 2016 were classified as probable.
- Figure 1 Footnote b
-
Nonpharmaceutical opioid category includes heroin, U-47700, furanyl-fentanyl, despropionyl fentanyl and suspected nonpharmaceutical fentanyl.
Text Description
| Year | Number of deaths | ||||
|---|---|---|---|---|---|
| Hydromorphone | Methadone | Nonpharmaceutical opioidFigure 1 Footnote b | Fentanyl (excluding suspected nonpharmaceutical fentanyl) | Total: any opioid | |
| 2011 | 23 | 15 | 1 | 1 | 56 |
| 2012 | 26 | 10 | 0 | 5 | 67 |
| 2013 | 14 | 17 | 0 | 3 | 54 |
| 2014 | 31 | 17 | 2 | 3 | 66 |
| 2015 | 29 | 19 | 1 | 1 | 58 |
| 2016 | 22 | 11 | 6 | 8 | 53 |
| 2017Figure 1 Footnote a | 26 | 21 | 3 | 6 | 62 |
Overall, the number of individuals dispensed any monitored opioid excluding methadone and buprenorphine has decreased over time, from 43 922 to 35 640 individuals per quarter (a decrease from 4.6% to 3.7% of the population; Figure 2). Of individuals dispensed monitored opioids in any quarter, excluding those people dispensed only methadone and/or buprenorphine, over 40% were dispensed a codeine product, alone or in combination with other opioid products. Since 2016 Quarter 1 (Q1), there has been a decreasing trend in MME dispensed, with a mean reduction of over 4000 MME per 1000 population per quarter (Figure 2). Hydromorphone products consistently contributed to over 40% of the total MME dispensed per quarter. The number of individuals dispensed methadone and buprenorphine, drugs used for opioid dependency treatment, increased from 2062 to 4088 over the time period (from 0.2% to 0.4% of the population; Figure 2).
Figure 2. Opioids dispensed through community pharmacies in Nova Scotia, Canada, by population and morphine equivalents over time, 2011 to 2017
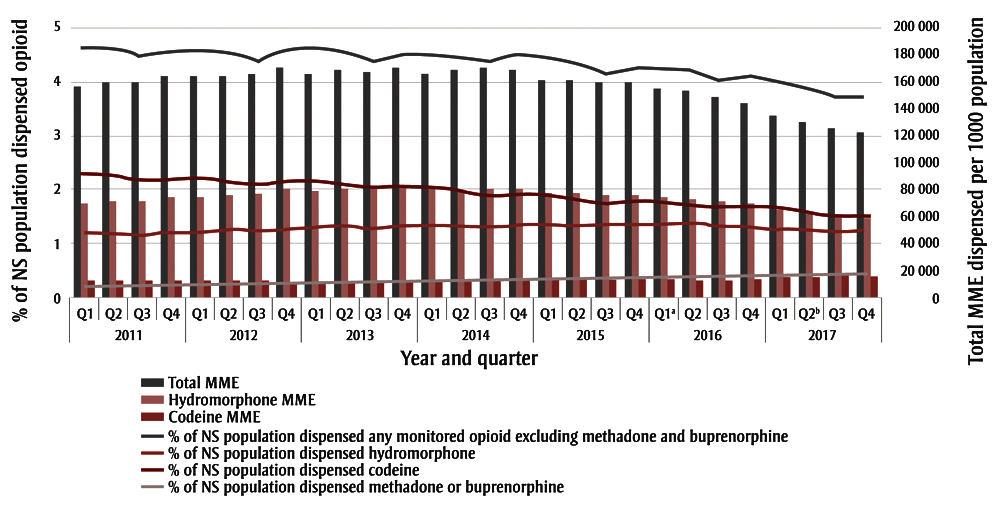
Abbreviations: MME, morphine milligram equivalents; NS, Nova Scotia.
Note: Morphine equivalents not assigned to methadone, buprenorphine or to infrequently prescribed opioids butorphanol, diphenoxylate, normethadone, opium, pentazocine, tapentadol, or sufentanil.
- Figure 2 Footnote a
-
Release of CDC Guideline for Prescribing Opioids for Chronic Pain.9
- Figure 2 Footnote b
-
Release of Canadian Guideline for Opioid Therapy and Chronic Noncancer Pain.8
Text Description
| Year | Quarter | Total MME | Hydromorphone MME | Codeine MME | % of NS population dispensed hydromorphone | % of NS population dispensed codeine | % of NS population dispensed any monitored opioid excluding methadone and buprenorphine | % of NS population dispensed methadone or buprenorphine |
|---|---|---|---|---|---|---|---|---|
| 2011 | Q1 | 155636.2 | 70329.04 | 13486.01 | 1.191197 | 2.298468 | 4.63 | 0.22 |
| Q2 | 159578.7 | 71608.08 | 13245.13 | 1.181813 | 2.264834 | 4.61 | 0.22 | |
| Q3 | 159666.4 | 71520.27 | 13261.39 | 1.159777 | 2.17279 | 4.47 | 0.22 | |
| Q4 | 163745.7 | 74296.59 | 12765.83 | 1.220507 | 2.194299 | 4.55 | 0.23 | |
| 2012 | Q1 | 164302.6 | 74880.2 | 12669.5 | 1.232008 | 2.216729 | 4.59 | 0.24 |
| Q2 | 164303.2 | 75719.85 | 12529.01 | 1.247819 | 2.172669 | 4.53 | 0.24 | |
| Q3 | 165285 | 76935.9 | 12330.98 | 1.221994 | 2.086445 | 4.39 | 0.25 | |
| Q4 | 170390.6 | 80150.58 | 11836.41 | 1.278915 | 2.180469 | 4.58 | 0.25 | |
| 2013 | Q1 | 165148.6 | 78884.48 | 12016.75 | 1.305891 | 2.160486 | 4.60 | 0.25 |
| Q2 | 168607.6 | 80404.85 | 11789.52 | 1.315808 | 2.087274 | 4.54 | 0.27 | |
| Q3 | 167218.3 | 79497.19 | 11924.13 | 1.277408 | 2.013218 | 4.41 | 0.27 | |
| Q4 | 170653.7 | 81825.18 | 11584.88 | 1.342181 | 2.080733 | 4.54 | 0.28 | |
| 2014 | Q1 | 165744.3 | 79673.4 | 11896.41 | 1.355099 | 2.03824 | 4.51 | 0.29 |
| Q2 | 167808.9 | 79554.73 | 11914.16 | 1.34803 | 1.976414 | 4.42 | 0.30 | |
| Q3 | 170356.4 | 80058.65 | 11839.16 | 1.328406 | 1.880089 | 4.31 | 0.31 | |
| Q4 | 168319.4 | 80748.05 | 11738.09 | 1.354255 | 1.914905 | 4.41 | 0.32 | |
| 2015 | Q1 | 160469.1 | 77182.47 | 12285.35 | 1.337568 | 1.875421 | 4.34 | 0.31 |
| Q2 | 160266.5 | 77639.78 | 12212.99 | 1.363406 | 1.831128 | 4.27 | 0.34 | |
| Q3 | 159174.4 | 76455.09 | 12402.23 | 1.360453 | 1.744965 | 4.16 | 0.35 | |
| Q4 | 159824.1 | 75784.88 | 12511.91 | 1.379963 | 1.787994 | 4.25 | 0.36 | |
| 2016 | Q1Figure 2 Footnote a | 155343.9 | 74146.66 | 12793.54 | 1.364118 | 1.766396 | 4.21 | 0.37 |
| Q2 | 152680.8 | 73891.1 | 12837.79 | 1.374133 | 1.722225 | 4.16 | 0.38 | |
| Q3 | 148133.1 | 71198.61 | 13323.27 | 1.292117 | 1.669621 | 4.02 | 0.39 | |
| Q4 | 144109.6 | 69225.54 | 13703.01 | 1.32174 | 1.671835 | 4.05 | 0.39 | |
| 2017 | Q1 | 134931.6 | 64529.58 | 14719.85 | 1.273548 | 1.627388 | 3.97 | 0.40 |
| Q2Figure 2 Footnote b | 129622.9 | 62682.27 | 15153.66 | 1.250387 | 1.56938 | 3.86 | 0.41 | |
| Q3 | 125102.6 | 60539.62 | 15689.98 | 1.207644 | 1.498422 | 3.71 | 0.42 | |
| Q4 | 122912 | 59537.71 | 15954.02 | 1.230279 | 1.515688 | 3.75 | 0.43 |
Discussion
NS has not experienced an increase in opioid toxicity mortality to date. However, nonpharmaceutical opioids, including suspected nonpharmaceutical fentanyl and fentanyl analogues, were involved in acute opioid toxicity deaths more frequently in 2016 and 2017 than in previous years. This is important given that nonpharmaceutical fentanyl is largely responsible for the ongoing public health emergency in Western Canada.Footnote 1Footnote 2Footnote 14 The selling of fentanyl or fentanyl-adulterated heroin as heroin is considered to have contributed to a large proportion of toxicity events in which the individuals involved were unaware of the risks associated with the drug obtained.Footnote 15Footnote 16 Illicit drug producers have sought to meet the demand for authentic prescription opioids through the production of counterfeit prescription opioid tablets, often containing illicit fentanyl or fentanyl analogues.Footnote 15 Consequently, preferences for specific drug types and changes to the composition of those drug types, mostly related to variations in potency, will predict risk of toxicity. The majority of pharmaceutical opioid toxicity fatalities in NS were related to opioids obtained illicitly (data not shown). Whether limited or well dispersed distribution networks for nonpharmaceutical opioids exist in NS requires further investigation.
Appropriate and judicious prescribing is a sound approach to decreasing opioid harms in the long term.Footnote 17 Reductions in MME dispensed per quarter in NS followed the release of updated guidelines for prescribing opioids for chronic pain, first in the US by the CDC in 2016 Q1,Footnote 9 and then in Canada in 2017,Footnote 8 and may also be attributable to interventions by the NSPMP, increased awareness of the issue and other factors. To date, hydromorphone remains the most common opioid detected among opioid toxicity fatalities as well as the opioid with the highest MME dispensed per quarter in NS. Diversion of hydromorphone, or any opioid, is difficult to track given that it is an illegal activity. Information from testing of samples from drugs seized by law enforcementFootnote 18 may not be reflective of or proportionate to the true picture of drugs in circulation. Some jurisdictions have implemented surveys of key populations or web monitoring (or both) to characterize localized shifts in availability and price of diverted opioids.Footnote 19 These types of surveillance activities could provide some evidence for determining whether population-level decreases in MME dispensed translate to decreases in numbers of opioid products diverted.
Attempts must be made to monitor all opioids, obtained both licitly and illicitly, when describing trends in opioid use and harms in a population. Discontinuing the prescribing of one pharmaceutical can result in increased prescribing of other opioids as substitutes.Footnote 20 Also, the availability of prescription opioids is known to influence the heroin market.Footnote 11Footnote 12 Heroin purity, availability and cost are factors associated with the introduction of fentanyl into the illicit opioid market.Footnote 12 Changes to prescribing practices must be considered in the context of the illicit market, when the goal of preventing new dependencies is coupled with that of keeping those accessing opioids safe. Notably, the greatest reduction in prescribing in Canada from 2015 to 2016 was found in British Columbia,Footnote 21 which coincided with the highest rate of fentanyl-related deaths in the country in 2016.Footnote 1 This does not imply a causal relationship. Still, if type of opioid used is dependent on availability, populations accessing pharmaceutical and nonpharmaceutical opioids illicitly likely overlap. In fact, making pharmaceutical opioids more easily available to those currently accessing an opioid supply with dangerously inconsistent potency is a novel response under consideration in British Columbia.Footnote 22 NS has not yet experienced an increase in opioid fatalities and pharmaceutical opioids have been more commonly seized by police than nonpharmaceuticals.Footnote 18 As prescribing rates decrease, there is an opportunity to monitor and respond to shifts in population rates of opioid dispensing and harms.
Strengths and limitations
Using the NSMES and NSPMP to understand opioid harms and monitor interventions is a novel approach to public health surveillance. Not all jurisdictions have a prescription monitoring program in place. NSPMP includes all opioids dispensed, not only those that are publicly funded. NSMES and NSPMP data offer significant historic baseline information and timely information related to opioid-specific fatalities and opioid prescribing practices. The measures presented serve as population surveillance indicators, which can stimulate further monitoring and research activities to better understand the relationships between opioid prescribing, opioid use and opioid harms including acute toxicity death.
It is possible that some acute drug toxicity deaths may not be reported to the NSMES, especially deaths in which the fatal effects of toxicity are significantly delayed. It is thought that this number is low, but this is difficult to verify. For a small proportion of 2017 cases, cause of death and/or toxicology results remain outstanding; however, numbers are small and are not expected to affect the findings presented.
Conclusion
An evidence-based approach to reducing opioid harms includes an overall reduction in opioid prescribing coupled with increases to harm reduction services and access to treatment for opioid dependency.Footnote 23Footnote 24 Timely monitoring of trends in both opioid dispensing and toxicity fatalities by opioid type is essential to understand the impact of changing prescribing guidelines and to detect and respond to any associated shifts in mortality rates.
Acknowledgements
We would like to thank Sean Margueratt and Lena Shah for many valuable discussions.
Conflicts of interest
All authors have no conflicts of interest to disclose.
Authors’ contributions and statement
All authors agreed on the surveillance design and concept of the paper. ES and KC analyzed the data. ES drafted the paper. All authors critically reviewed and revised the paper. All authors read and gave final approval of this version to be published.
The content and views expressed in this article are those of the authors and do not necessarily reflect those of the Government of Canada.
References
- Footnote 1
-
Government of Canada. Apparent opioid-related deaths [Internet]. Ottawa (ON): Government of Canada; 2018 [modified 2018 Mar 27; cited 2018 Jan 11]. Available from: https://www.canada.ca/en/health-canada/services/substance-abuse/prescription-drug-abuse/opioids/apparent-opioid-related-deaths.html
- Footnote 2
-
British Columbia Coroners Service (BCCS). Illicit drug overdose deaths in BC [Internet]. Burnaby (BC): BCCS; 2018 [updated monthly; cited 2018 Jan 11]. Available from: https://www2.gov.bc.ca/assets/gov/public-safety-and-emergency-services/death-investigation/statistical/illicit-drug.pdf
- Footnote 3
-
Rudd RA, Seth P, David F, Scholl L. Increases in drug and opioid-involved overdose deaths—United States, 2010–2015. MMWR Morb Mortal Wkly Rep. 2016;65:1445–52.
- Footnote 4
-
Imtiaz S, Shield KD, Fischer B, Rehm, J. Harms of prescription opioid use in the United States. Subst Abuse Treat Prev Policy [Internet]. 2014 [cited 2018 Jan 11];9:43. doi: 10.1186/1747-597X-9-43.
- Footnote 5
-
Gomes T, Juurlink DN, Moineddin R, et al. Geographical variation in opioid prescribing and opioid-related mortality in Ontario. Healthc Q. 2011;14(1): 22-4.
- Footnote 6
-
Fischer B, Jones W, and Rehm J. High correlations between levels of consumption and mortality related to strong prescription opioid analgesics in British Columbia and Ontario, 2005–2009. Pharmacoepidemiol Drug Saf. 2013;22(4):438-42.
- Footnote 7
-
Bohnert ASB, Valenstein M, Bair M, et al. Association between opioid prescribing patterns and opioid overdose-related deaths. JAMA. 2011;305(13):1315-21.
- Footnote 8
-
Busse J, Craigie S, Juurlink D, et al. Guideline for opioid therapy and chronic noncancer pain. CMAJ. 2017;189(18):E659-E666.
- Footnote 9
-
Dowell D, Haegerich TM, Chou R. CDC guideline for prescribing opioids for chronic pain—United States, 2016. MMWR Recomm Rep. 2016;65(No. RR-1):1–49.
- Footnote 10
-
Compton WM, Jones CM, Baldwin GT. Relationship between nonmedical prescription-opioid use and heroin use. N Engl J Med. 2016;374(2):154-63.
- Footnote 11
-
Mars SG, Bourgois P, Karandinos G, et al. “Every ‘never’ I ever said came true”: transitions from opioid pills to heroin injecting. Int J Drug Policy. 2014;25(2):257-66.
- Footnote 12
-
Hempstead K, Yildirim EO. Supply-side response to declining heroin purity: fentanyl overdose episode in New Jersey. Health Econ. 2014;23(6): 688-705.
- Footnote 13
-
Government of Canada Justice Laws Website. Controlled Drugs and Substances Act (S.C. 1996, c. 19) [Internet]. Ottawa (ON): Government of Canada; 2018 [modified 2018 May 4; cited 2018 Jan 11]. Available from: http://laws-lois.justice.gc.ca/eng/acts/C-38.8/
- Footnote 14
-
Canadian Centre on Substance Abuse. CCENDU drug alert: illicit fentanyl [Internet]. Ottawa (ON): CCSA; 2013 [cited 2018 Jan 11]. Available from: http://www.ccsa.ca/Resource%20Library/CCSA-CCENDU-Drug-Alert-Illicit-Fentanyl-2013-en.pdf
- Footnote 15
-
US Drug Enforcement Agency. Counterfeit prescription pills containing fentanyls: a global threat [Internet]. DEA Intelligence Brief DEA-DCT-D1B-021-16. July 2016 [cited 2018 Feb 4]. Available from: https://www.hsdl.org/?view&did=796541
- Footnote 16
-
Hayashi K, Milloy MJ, Lysyshyn M, et al. Substance use patterns associated with recent exposure to fentanyl among people who inject drugs in Vancouver, Canada: a cross-sectional urine toxicology screening study. Drug Alcohol Depend. 2018;183:1-6.
- Footnote 17
-
Fischer B, Rehm J, Tyndall M. Effective Canadian policy to reduce harms from prescription opioids: learning from past failures. CMAJ. 2016;188(17-18):1240-4.
- Footnote 18
-
Health Canada. Drug Analysis Service: summary report of samples analysed [Internet]. Ottawa (ON): Government of Canada; [modified 2017 Dec 12; cited 2018 Jan 30]. Available from: https://www.canada.ca/en/health-canada/services/health-concerns/controlled-substances-precursor-chemicals/drug-analysis-service/drug-analysis-service-summary-report-samples-analysed.html
- Footnote 19
-
Researched Abuse, Diversion and Addiction-Related Surveillance (RADARS®) System. Rocky Mountain Poison and Drug Center. Denver (CO): Denver Health and Hospital Authority; 2018 [cited 2018 Feb 7]. Available from: https://www.radars.org/radars-system-programs/web-monitoring.html
- Footnote 20
-
Gomes T, Mastorakos A, Paterson M, et al. Changes in the dispensing of opioid medications in Canada following the introduction of a tamper-deterrent formulation of long-acting oxycodone: a time series analysis. CMAJ Open [Internet]. 2017 [cited 2018 Jan 11];5(4): E800-E807. Available from: http://cmajopen.ca/content/5/4/E800.full
- Footnote 21
-
Canadian Institute for Health Information. Pan-Canadian trends in the prescribing of opioids, 2012 to 2016. Ottawa (ON): CIHI; 2017. 34 p.
- Footnote 22
-
Tyndall M. An emergency response to the opioid overdose crisis in Canada: a regulated opioid distribution program. CMAJ. 2018;190(2):E35-E36.
- Footnote 23
-
Kolodny A, Frieden TR. Ten steps the federal government should take now to reverse the opioid addiction epidemic. JAMA. 2017;318(16):1537-8.
- Footnote 24
-
Government of Nova Scotia. Nova Scotia’s Opioid Use and Overdose Framework [Internet]. Halifax (NS): Government of Nova Scotia; 2017 [cited 2018 Jan 11]. Available from: https://novascotia.ca/opioid/