
At-a-glance – Cancer trends in Canada, 1984 to 2015
Health Promotion and Chronic Disease Prevention in Canada
Alain A. Demers, PhDAuthor reference 1Author reference 2; Darren R. Brenner, PhDAuthor reference 3; Leah Smith, PhDAuthor reference 4; Amanda Shaw, MScAuthor reference 1
https://doi.org/10.24095/hpcdp.39.11.04
Author references:
- Author reference 1
-
Public Health Agency of Canada, Ottawa, Ontario, Canada
- Author reference 2
-
Department of Community Health Sciences, University of Manitoba, Winnipeg, Manitoba, Canada
- Author reference 3
-
Departments of Oncology and Community Health Sciences, Cumming School of Medicine, University of Calgary, Calgary, Alberta, Canada
- Author reference 4
-
Canadian Cancer Society, St. John's, Newfoundland and Labrador, Canada
Correspondence : Alain Demers, Centre for Surveillance and Applied Research, Public Health Agency of Canada, 785 Carling Avenue, room 611B2, Ottawa, ON K1A 0K9; Tel: 613-797-2129; Email: alain.demers@canada.ca
Abstract
Examining incidence trends of all cancers combined in order to understand cancer trends can be misleading, as patterns can vary across individual cancer types. This paper highlights findings on trends over time from Canadian Cancer Statistics 2019, as measured by the annual percent change (APC) of age-standardized incidence rates. Among the results were a recent increase in thyroid cancer in males (APC: 6.4%, 1997–2015), as well as decreases in prostate cancer (APC: −9.1%, 2011–2015) and cervical cancer (APC: −3.3%, 2010–2015).
Keywords: neoplasms, data analysis, trend, cancer
Highlights
- The incidence of some cancers is changing rapidly in Canada.
- Recent trends show increasing rates of thyroid cancer in males, drawing attention to the potential impact of overdiagnosis.
- Prostate cancer incidence is decreasing rapidly, likely reflecting recent changes in screening guidelines.
Introduction
Chronic disease trends are often seen as stable or changing at low rates in populations. For example, the incidence rate of diabetes in Canada went from 6.7 per 1000 population in 2003/04 to 6.3 per 1000 in 2013/14.Footnote 1 Up to 2011, before the incidence rates of prostate cancer started to decline rapidly, this claim of relative stability could also be made for all cancers, if they were presented as an overall group. Canadian Cancer Statistics 2019 (CCS 2019) reports that from 1984 to 2015, cancer incidence rates in Canada increased 0.1% per year on average.Footnote 2 However, this collective picture is misleading, as trends can differ greatly depending on the cancer type and the time period.Footnote 2
Monitoring incidence of individual cancers over time can help identify emerging trends, highlight where progress has been made, and suggest where more work and resources are needed. The purpose of this report is to feature findings from the CCS 2019 report relating to time trends in the incidence of cancers in Canada, with a particular focus on patterns of change for individual cancer types.
Methods
Results are drawn from the incidence chapter of the CCS 2019 report,Footnote 2 covering the period from 1984 to 2015. Quebec was not included because data were available up to 2010 only. The Canadian Cancer Registry (CCR)Footnote 3 was the source of data for 1992 to 2015, and the National Cancer Incidence Reporting System (NCIRS) was utilized prior to 1992.
All analyses were performed by the Public Health Agency of Canada. Age-standardized incidence rates (ASIRs) were calculated through direct standardization using the age structure of the 2011 Canadian population by five-year age group. JoinpointFootnote 4 analysis software (version 4.6.0.0) was used to calculate the annual percent change (APC) using the annual ASIRs for each cancer type from 1984 to 2015, and to determine years in which the APC changed significantly. The minimum time span to report a trend was set at five years. Thus, the most recent trend period possible was 2011 to 2015. Otherwise, default Joinpoint parameters were used. In total, 23 types of cancer were investigated.
Results and discussion
Table 1 shows all trends identified by Joinpoint between 1984 and 2015; Figure 1 pulls out the most recent trend. For both sexes in Figure 1, cancers were divided into those that have decreased or increased significantly (p-value < .05 or p-value < .001) in the most recent trend and those that have been stable (p-value ≥ .05). The following text highlights a few of the results.
| Cancer type | Males | Females | ||||||
|---|---|---|---|---|---|---|---|---|
| Year | APC | p -value | Year | APC | p -value | |||
| From | To | From | To | |||||
| Oral | 1984 | 2004 | −2.5 | < .001 | 1984 | 2003 | −1.0 | < .001 |
| 2004 | 2011 | 2.1 | .003 | 2003 | 2015 | 0.7 | .028 | |
| 2011 | 2015 | −0.1 | .94 | |||||
| Esophagus | 1984 | 2006 | 0.3 | .020 | 1984 | 2015 | −0.4 | < .001 |
| 2006 | 2010 | 4.3 | .068 | |||||
| 2010 | 2015 | −2.4 | .015 | |||||
| Stomach | 1984 | 2002 | −2.5 | < .001 | 1984 | 1999 | −3.0 | < .001 |
| 2002 | 2015 | −1.1 | < .001 | 1999 | 2015 | −0.8 | < .001 | |
| Colorectal | 1984 | 1996 | −0.7 | < .001 | 1984 | 1996 | −1.5 | < .001 |
| 1996 | 2000 | 0.9 | .33 | 1996 | 2000 | 1.2 | .23 | |
| 2000 | 2011 | −0.5 | .001 | 2000 | 2011 | −0.5 | < .001 | |
| 2011 | 2015 | −2.2 | < .001 | 2011 | 2015 | −1.9 | .002 | |
| Liver | 1984 | 2011 | 3.8 | < .001 | 1984 | 2015 | 2.7 | < .001 |
| 2011 | 2015 | 0.2 | .88 | |||||
| Pancreas | 1984 | 2000 | −1.5 | < .001 | 1984 | 2015 | 0.1 | .58 |
| 2000 | 2015 | 0.8 | .009 | |||||
| Larynx | 1984 | 2015 | −2.6 | < .001 | 1984 | 1991 | 0.7 | .64 |
| 1991 | 2015 | −3.0 | < .001 | |||||
| Lung and bronchus | 1984 | 1990 | −0.6 | .087 | 1984 | 1993 | 2.9 | < .001 |
| 1990 | 2003 | −2.2 | < .001 | 1993 | 2011 | 0.9 | < .001 | |
| 2003 | 2011 | −0.9 | .002 | |||||
| 2011 | 2015 | −3.3 | < .001 | 2011 | 2015 | −1.3 | .043 | |
| Melanoma | 1984 | 2015 | 2.2 | < .001 | 1984 | 1994 | 0.1 | .79 |
| 1994 | 2015 | 2.0 | < .001 | |||||
| Breast | 1984 | 2015 | 0.5 | .015 | 1984 | 1991 | 2.1 | < .001 |
| 1991 | 2015 | −0.2 | .010 | |||||
| Cervix | N/A | 1984 | 2006 | −2.1 | < .001 | |||
| 2006 | 2010 | 1.5 | .41 | |||||
| 2010 | 2015 | −3.3 | < .001 | |||||
| Uterus | N/A | 1984 | 1990 | −1.5 | .063 | |||
| 1990 | 2006 | 0.5 | .013 | |||||
| 2006 | 2011 | 3.7 | .002 | |||||
| 2011 | 2015 | 0.1 | .92 | |||||
| Ovary | N/A | 1984 | 1994 | −1.7 | < .001 | |||
| 1994 | 2015 | −0.4 | .001 | |||||
| Prostate | 1984 | 1993 | 6.3 | < .001 | N/A | |||
| 1993 | 1997 | −3.0 | .38 | |||||
| 1997 | 2001 | 4.1 | .23 | |||||
| 2001 | 2011 | −1.6 | .006 | |||||
| 2011 | 2015 | −9.1 | < .001 | |||||
| Testis | 1984 | 2015 | 1.3 | < .001 | N/A | |||
| Bladder | 1984 | 2009 | −1.0 | < .001 | 1984 | 2009 | −0.9 | < .001 |
| 2010 | 2015 | −1.5 | .052 | 2010 | 2015 | −1.3 | .18 | |
| Kidney and renal pelvis | 1984 | 1989 | 4.0 | .005 | 1984 | 2015 | 1.0 | < .001 |
| 1989 | 2003 | 0.1 | .64 | |||||
| 2003 | 2011 | 2.8 | < .001 | |||||
| 2011 | 2015 | −0.3 | .76 | |||||
| Brain/CNS | 1984 | 2009 | −0.2 | .081 | 1984 | 2011 | −0.3 | .002 |
| 2009 | 2015 | −1.9 | .012 | 2011 | 2015 | −3.2 | .059 | |
| Thyroid | 1984 | 1997 | 2.8 | .002 | 1984 | 1998 | 3.8 | < .001 |
| 1997 | 2015 | 6.4 | < .001 | 1998 | 2002 | 11.9 | < .001 | |
| 2002 | 2011 | 6.5 | < .001 | |||||
| 2011 | 2015 | 0.1 | .94 | |||||
| Hodgkin lymphoma | 1984 | 2015 | −0.4 | < .001 | 1984 | 2015 | 0.0 | .74 |
| Non-Hodgkin lymphoma | 1984 | 2015 | 1.3 | < .001 | 1984 | 1993 | 2.2 | < .001 |
| 1993 | 2015 | 0.9 | < .001 | |||||
| Multiple myeloma | 1984 | 2007 | 0.3 | .077 | 1984 | 2015 | 0.6 | < .001 |
| 2007 | 2015 | 2.6 | < .001 | |||||
| Leukemia | 1984 | 1994 | −0.9 | .067 | 1984 | 2003 | −0.2 | .18 |
| 1994 | 2015 | 0.7 | < .001 | 2003 | 2007 | 3.7 | .071 | |
| 2007 | 2015 | −0.6 | .14 | |||||
Data source: Canadian Cancer Statistics Advisory Committee. Canadian cancer statistics 2019. Toronto (ON): Canadian Cancer Society; 2019. Abbreviations: APC, annual percent change; CNS, central nervous system; N/A, not applicable. |
||||||||
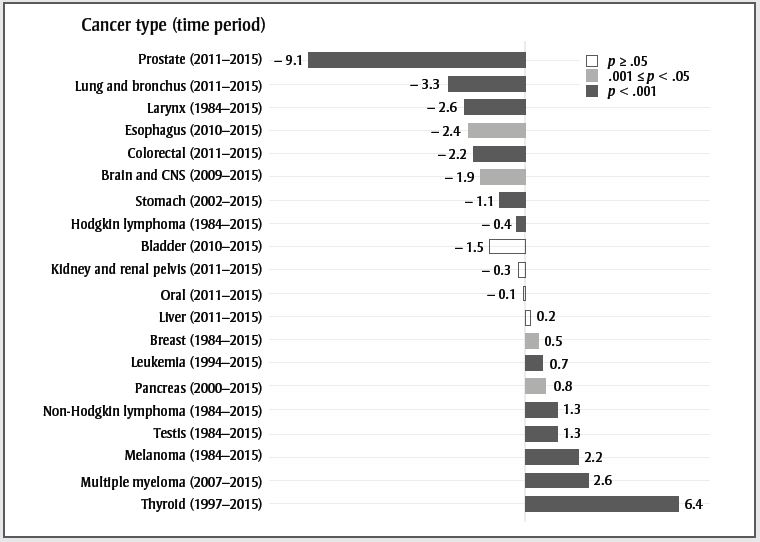
Text description
| Cancer type (time period) | Annual percent change | p-value |
|---|---|---|
| Prostate (2011–2015) | −9.1 | p < .001 |
| Lung and bronchus (2011–2015) | −3.3 | p < .001 |
| Larynx (1984–2015) | −2.6 | p < .001 |
| Esophagus (2010–2015) | −2.4 | .001 ≤ p < .05 |
| Colorectal (2011–2015) | −2.2 | p < .001 |
| Brain and CNS (2009–2015) | −1.9 | .001 ≤ p < .05 |
| Stomach (2002–2015) | −1.1 | p < .001 |
| Hodgkin lymphoma (1984–2015) | −0.4 | p < .001 |
| Bladder (2010–2015) | −1.5 | p ≥ .05 |
| Kidney and renal pelvis (2011–2015) | −0.3 | p ≥ .05 |
| Oral (2011–2015) | −0.1 | p ≥ .05 |
| Liver (2011–2015) | 0.2 | p ≥ .05 |
| Breast (1984–2015) | 0.5 | .001 ≤ p < .05 |
| Leukemia (1994–2015) | 0.7 | p < .001 |
| Pancreas (2000–2015) | 0.8 | .001 ≤ p < .05 |
| Non-Hodgkin lymphoma (1984–2015) | 1.3 | p < .001 |
| Testis (1984–2015) | 1.3 | p < .001 |
| Melanoma (1984–2015) | 2.2 | p < .001 |
| Multiple myeloma (2007–2015) | 2.6 | p < .001 |
| Thyroid (1997–2015) | 6.4 | p < .001 |
Females
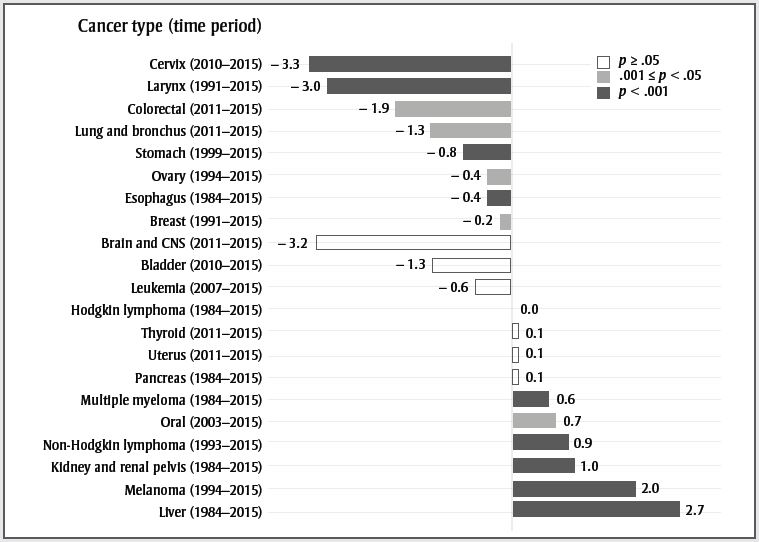
Data source: Canadian Cancer Statistics Advisory Committee. Canadian cancer statistics 2019. Toronto (ON): Canadian Cancer Society; 2019.
Abbreviation: CNS, central nervous system.
- Figure 1 Footnote a
-
The APCs were calculated from 1984 to 2015. If one or more significant change in the trend of rates was detected, the APC reflects the trend from the most recent significant change to 2015. If no significant change was detected, the APC reflects the trend over the entire period.
Text description
| Cancer type (time period) | Annual percent change | p-value |
|---|---|---|
| Cervix (2010–2015) | −3.3 | p < .001 |
| Larynx (1991–2015) | −3.0 | p < .001 |
| Colorectal (2011–2015) | −1.9 | .001 ≤ p < .05 |
| Lung and bronchus (2011–2015) | −1.3 | .001 ≤ p < .05 |
| Stomach (1999–2015) | −0.8 | p < .001 |
| Ovary (1994–2015) | −0.4 | .001 ≤ p < .05 |
| Esophagus (1984–2015) | −0.4 | p < .001 |
| Breast (1991–2015) | −0.2 | .001 ≤ p < .05 |
| Brain and CNS (2011–2015) | −3.2 | p ≥ .05 |
| Bladder (2010–2015) | −1.3 | p ≥ .05 |
| Leukemia (2007–2015) | −0.6 | p ≥ .05 |
| Hodgkin lymphoma (1984–2015) | 0.0 | p ≥ .05 |
| Thyroid (2011–2015) | 0.1 | p ≥ .05 |
| Uterus (2011–2015) | 0.1 | p ≥ .05 |
| Pancreas (1984–2015) | 0.1 | p ≥ .05 |
| Multiple myeloma (1984–2015) | 0.6 | p < .001 |
| Oral (2003–2015) | 0.7 | .001 ≤ p < .05 |
| Non-Hodgkin lymphoma (1993–2015) | 0.9 | p < .001 |
| Kidney and renal pelvis (1984–2015) | 1.0 | p < .001 |
| Melanoma (1994–2015) | 2.0 | p < .001 |
| Liver (1984–2015) | 2.7 | p < .001 |
Thyroid cancer has stabilized in females after many years of increase; however, it is still increasing rapidly in males. The increase may be due to overdiagnosis resulting from increased use of diagnostic technologies such as ultrasound;Footnote 5 however, recent studies also show an increase in late-stage papillary tumours, suggesting that the overall increase may not be entirely due to overdiagnosis.Footnote 6 The increase in multiple myeloma in males and females could be related to the increased prevalence of obesity.Footnote 7 It may also be due to improved detection and case ascertainment, as the rate of myeloma is relatively stable in countries with high ascertainment.Footnote 8Footnote 9Footnote 10Footnote 11Footnote 12 Melanoma rates are still increasing in males and females. Exposure to ultraviolet radiation through sunlight, tanning beds and sun lamps are well-established risk factors for melanoma.Footnote 13 Increase in ultraviolet light exposure without corresponding increases in sun safety behaviours likely explains these increasing rates.Footnote 14
Laryngeal cancer is strongly associated with smoking,Footnote 15 and the decreasing trend observed in both males and females likely reflects the decreasing trend in smoking rates in Canada.Footnote 16Footnote 17 The same observations probably explain the recent trend in lung cancer ASIR in males and females. The recent decline in colorectal cancer ASIR is likely due in part to increased screening that identifies treatable precancerous polyps. Since 2007, the majority of provinces and territories have implemented organized colorectal cancer screening programs.Footnote 18 While not evident in this report, increasing rates have been reported in the younger population, likely due in part to the prevalence of obesity.Footnote 19 Esophageal cancer ASIR is decreasing in both males and females. Risk factors for this cancer include obesity, alcohol consumption and tobacco consumption.Footnote 20 Whereas obesityFootnote 7 and sales of alcoholic drinksFootnote 21 have been increasing in Canada, past decreases in tobacco consumptionFootnote 22 may account for the decreasing rates. In males, liver cancer ASIR has stabilized, though it is still increasing in females. Increases in the most common type of liver cancer, hepatocellular carcinoma (HCC), are generally driven by chronic hepatitis B and C infection, as well as increasing rates of excessive alcohol consumption and diabetes.Footnote 23 However, HCC is more prevalent in low-income countries, and the increase in Canada may be partially explained by rising immigration from regions where HCC is common, including parts of Asia and Africa.Footnote 24
Female breast cancer ASIR has decreased slowly since 1991. This pattern is likely due to mammography screening and long-term changes in risk factors.Footnote 25 Cervical cancer is decreasing, largely due to routine screening with Pap tests. Every province in Canada (except Quebec) has an organized cervical cancer screening program. Current guidelines recommend screening every two to three years starting at age 21 or 25 until age 65 or 70.Footnote 26 In the coming years, human papillomavirus vaccination is expected to result in further reductions in cervical cancer incidence.Footnote 27 The ASIR of prostate cancer over time has mirrored the utilization of prostate-specific antigen testing (PSA) in Canada.Footnote 28 In 2014, the Canadian Task Force on Preventive Health Care advised against PSA screening in men of all ages due to a lack of evidence for benefits and the risk of overdiagnosis and harms of unnecessary treatment.Footnote 29 Prostate cancer ASIRs are currently decreasing rapidly.
In 2014, Cancer Care Ontario implemented a new cancer reporting system that brought several enhancements to the identification of cancer cases, including the registration of in situ bladder cancers, which were not previously reported.Footnote 30 The implementation was retrospectively applied to the data from 2010 onward. This change created an apparent increase in incident cases of bladder cancer for the year 2010 and after. Although the decreasing trend for bladder cancer from 2010 to 2015 is comparable to that of 1984 to 2009, this time period is not long enough to be significant. We forced a joinpoint in 2010 to account for the data collection artefact.
Brain and central nervous system (CNS) cancers decreased 3.9% annually in females between 2011 and 2015, although the decrease was not statistically significant (p = .059). The lack of significance is most likely due to the shortness of the trend and the variability in the annual rates. The significant decrease of 1.9% per year in males started in 2009.
Conclusion
Results show that cancer trends in Canada are dynamic and type-specific. The most recent trends show increasing rates of thyroid cancer in males, drawing attention to the potential impact of overdiagnosis on cancer incidence. Conversely, rates of other cancers have recently decreased, most notably prostate and cervical cancers. The decreases for prostate and cervical cancers underscore the potential impact of improving screening guidelines based on the best evidence. Specifically, reductions in overscreening (e.g. prostate cancer) and the implementation of routine screening (e.g. cervical cancer) can both lead to decreased incidence.
Conflicts of interest
The authors have no conflicts of interest to declare.
Authors' contributions and statement
All authors contributed to the design, conceptualization and revision of the work. Drafting, analysis and interpretation of the data were done by the Public Health Agency of Canada.
The content and views expressed in this article are those of the authors and do not necessarily reflect those of the Government of Canada.
References
- Footnote 1
-
Government of Canada. Diabetes in Canada [Internet]. Ottawa (ON): Government of Canada; 2017 [modified 2017 Nov 14; cited 2019 Jul 03]. Available from: https://www.canada.ca/en/public-health/services/publications/diseases-conditions/diabetes-canada-highlights-chronic-disease-surveillance-system.html
- Footnote 2
-
Canadian Cancer Statistics Advisory Committee. Canadian cancer statistics 2019. Toronto (ON): Canadian Cancer Society; 2019. 95 p.
- Footnote 3
-
Statistics Canada. Canadian Cancer Registry (CCR) [Internet]. Ottawa (ON): Government of Canada; 2019 [modified 2019 Jan 28; cited 2019 Mar 5]. Available from: http://www23.statcan.gc.ca/imdb/p2SV.pl?Function=getSurvey&SDDS=3207
- Footnote 4
-
National Cancer Institute, Division of Cancer Control & Population Sciences, Surveillance Research Program. Joinpoint trend analysis software, version 4.6.0.0. Bethesda (MD): National Cancer Institute; 2019 Feb 26 [cited 2019 Mar 6]. Available from: https://surveillance.cancer.gov/joinpoint
- Footnote 5
-
Vaccarella S, Dal Maso L, Laversanne M, et al. The impact of diagnostic changes on the rise in thyroid cancer incidence: a population-based study in selected high-resource countries. Thyroid. 2015;25(10):1127-36.
- Footnote 6
-
Lim H, Devesa SS, Sosa JA, Check D, Kitahara CM. Trends in thyroid cancer incidence and mortality in the United States, 1974-2013. JAMA. 2017;317(13):1338-48.
- Footnote 7
-
Twells LK, Gregory DM, Reddigan J, et al. Current and predicted prevalence of obesity in Canada: a trend analysis. CMAJ Open [Internet]. 2014 Mar 3 [cited 2019 May 1];2(1):E18-E26. Available from: http://cmajopen.ca/content/2/1/E18.long
- Footnote 8
-
Velez R, Turesson I, Landgren O, Kristinsson SY, Cuzick J. Incidence of multiple myeloma in Great Britain, Sweden, and Malmo, Sweden: the impact of differences in case ascertainment on observed incidence trends. BMJ Open [Internet]. 2016 Jan 21 [cited 2019 May 1];6(1):e009584.
- Footnote 9
-
Andres M, Feller A, Arndt V, NICER Working Group. Trends of incidence, mortality, and survival of multiple myeloma in Switzerland between 1994 and 2013. Cancer Epidemiol. 2018;53:105-10.
- Footnote 10
-
Kyle RA, Therneau TM, Rajkumar SV, Larson DR, Plevak MF, Melton LJ 3rd. Incidence of multiple myeloma in Olmsted County, Minnesota: trend over 6 decades. Cancer. 2004;101(11):2667-74.
- Footnote 11
-
Renshaw C, Ketley N, Moller H, Davies EA. Trends in the incidence and survival of multiple myeloma in South East England 1985-2004. BMC Cancer. 2010;10:74.
- Footnote 12
-
Soutar RL, Dawson AA, Wilson BJ. Multiple myeloma in north east Scotland: a review of incidence and survival over three decades. Health Bull. 1996;54(3):232-40.
- Footnote 13
-
International Agency for Research on Cancer. Exposure to artificial UV radiation and skin cancer. Geneva (CH): World Health Organization; 2006. 76 p.
- Footnote 14
-
National Skin Cancer Prevention Committee. Exposure to and protection from the sun in Canada: a report based on the 2006 Second National Sun Survey. Toronto (ON): Canadian Partnership Against Cancer; 2010.
- Footnote 15
-
IARC Working Group on the Evaluation of Carcinogenic Risks to Humans. Tobacco smoke and involuntary smoking. IARC Monogr Eval Carcinog Risks Hum. 2004;83:1-1438.
- Footnote 16
-
Statistics Canada. Canadian Tobacco, Alcohol and Drugs Survey (CTADS): 2013 summary [Internet]. Ottawa (ON): Health Canada; 2015 [modified 2015 Feb 03; cited 2019 Mar 30]. Available from: https://www.canada.ca/en/health-canada/services/canadian-tobacco-alcohol-drugs-survey/2013-summary.html
- Footnote 17
-
Health Canada. Canadian Alcohol and Drug Use Monitoring Survey (CADUMS) [Internet]. 2014 [modified 2014 Apr 08; cited 2019 Mar 30]. Available from: https://www.canada.ca/en/health-canada/services/health-concerns/drug-prevention-treatment/canadian-alcohol-drug-use-monitoring-survey.html
- Footnote 18
-
Major D, Bryant H, Delaney M, et al. Colorectal cancer screening in Canada: results from the first round of screening for five provincial programs. Curr Oncol. 2013;20(5):252-7.
- Footnote 19
-
Cancer Care Ontario. Cancer fact - Colorectal cancer incidence increasing in younger adults [Internet]. 2016 [cited 2019 Mar 30]; Available from: https://www.cancercareontario.ca/en/cancer-facts/colorectal-cancer-increasing-younger-adults
- Footnote 20
-
Otterstatter MC, Brierley JD, De P, et al. Esophageal cancer in Canada: trends according to morphology and anatomical location. Can J Gastroenterol. 2012;26(10):723-7.
- Footnote 21
-
Agriculture and Agri-Food Canada. Consumer trends: wine, beer and spirits in Canada. Ottawa (ON): Government of Canada; 2013. 21 p.
- Footnote 22
-
Organisation for Economic Co-operation Development (OECD). Daily smokers. 2018 [cited 2019 Mar 30]. Available from: https://data.oecd.org/healthrisk/daily-smokers.htm
- Footnote 23
-
Trad D, Bibani N, Sabbah M, et al. Known, new and emerging risk factors of hepatocellular carcinoma (review). Presse Med. 2017;46(11):1000-7.
- Footnote 24
-
Bosetti C, Turati F, La Vecchia C. Hepatocellular carcinoma epidemiology. Best Pract Res Clin Gastroenterol. 2014;28(5):753-70.
- Footnote 25
-
Holford TR, Cronin KA, Mariotto AB, et al. Changing patterns in breast cancer incidence trends. J Natl Cancer Inst Monogr. 2006;(36):19-25.
- Footnote 26
-
Canadian Partnership Against Cancer. Cervical cancer screening in Canada: environmental scan (2018). Toronto (ON): Canadian Partnership Against Cancer; 2018 [cited 2019 Mar 30]. Available from: https://www.partnershipagainstcancer.ca/topics/cervical-cancer-screening-environmental-scan-2018
- Footnote 27
-
Canadian Cancer Society's Advisory Committee on Cancer Statistics. Canadian cancer statistics 2016. Toronto (ON): Canadian Cancer Society; 2016. 142 p.
- Footnote 28
-
LeBlanc AG, Demers A, Shaw A. Recent trends in prostate cancer in Canada. Health Rep. 2019;30(4):12-17.
- Footnote 29
-
Bell N, Connor Gorber S, Shane A, et al. Recommendations on screening for prostate cancer with the prostate-specific antigen test. CMAJ. 2014;186(16):1225-34.
- Footnote 30
-
Cancer Care Ontario. Ontario cancer statistics 2018. Toronto (ON): Cancer Care Ontario; 2018. 172 p.