
Evidence synthesis – Where are children and adults physically active and sedentary? – a rapid review of location-based studies
Health Promotion and Chronic Disease Prevention in Canada
Stephanie A. Prince, PhDAuthor reference 1Author reference 2; Gregory P. Butler, MScAuthor reference 1; Deepa P. Rao, PhDAuthor reference 1; Wendy Thompson, MScAuthor reference 1
https://doi.org/10.24095/hpcdp.39.3.01
This article has been peer reviewed.
Author references:
- Author reference 1
-
Public Health Agency of Canada, Ottawa, Ontario, Canada
- Author reference 2
-
Division of Cardiac Prevention and Rehabilitation, University of Ottawa Heart Institute, Ottawa, Ontario, Canada
Correspondence: Stephanie A. Prince, Centre for Surveillance and Applied Research, Public Health Agency of Canada, 785 Carling Avenue, Ottawa, ON K1A 0K9; Tel: 613-558-5950; Email: stephanie.princeware@canada.ca
Abstract
Introduction: Geographical positioning systems (GPS) have the capacity to provide further context around where physical activity (PA) and sedentary time (ST) are accrued especially when overlaid onto objectively measured movement. The objective of this rapid review was to summarize evidence from location-based studies which employed the simultaneous use of GPS and objective measures of PA and/or ST.
Methods: Six databases were searched to identify studies that employed the simultaneous use of GPS and objective measures of PA or ST to quantify location of movement. Risk of bias was assessed, and a qualitative synthesis completed.
Results: Searching identified 3446 articles; 59 were included in the review. A total of 22 studies in children, 17 in youth and 20 in adults were captured. The active transportation environment emerged as an important location for moderate-to-vigorous intensity physical activity (MVPA) in children, youth and adults. In children and youth, the school is an important location for MVPA, especially the schoolyard for children. Indoor locations (e.g., schools, homes) appear to be greater sources of lighter intensities of PA and ST. The review was limited by a lack of standardization in the nomenclature used to describe the locations and methods, as well as measures of variance.
Conclusion: Evidence suggests that the active transportation environment is a potentially important contributor of MVPA across an individual's lifespan. There is a need for future location-based studies to report on locations of all intensity of movement (including minutes and proportion) using a whole-day approach in larger representative samples.
Keywords: motor activity, sedentary time, location, built environment, active transportation
Highlights
- The active transportation environment is an important location for physical activity in children, youth and adults.
- Among children and youth, the school (especially the schoolyard) is an important location for physical activity.
- Indoor locations (e.g., schools, homes) appear to be greater sources of lighter intensities of physical activity and sedentary time.
Introduction
Greater physical activity (PA) and lower sedentary time (ST) have been shown to independently play a role in the prevention of chronic conditions (e.g., cardiovascular disease, diabetes, obesity and cancer).Footnote 1Footnote 2 While the importance of these health behaviours is largely acknowledged, the majority of children and adults do not meet current PA guidelines and spend most of their days engaged in sedentary behaviour.Footnote 3Footnote 4Footnote 5 Further, PA levels decline with age, and sex differences in PA are often observed.Footnote 6Footnote 7 The built environment refers to our physical surroundings and includes for example parks, workplaces, schools, active transportation infrastructure, and homes among many others. The built environment has been associated with levels of PA and ST.Footnote 8Footnote 9
Much of the evidence around the relationship between the built environment and PA/ST has come from cross-sectional studies which obtain contextual information (e.g., presence of parks in the neighbourhood) from either self-report perceptions of environment or by using geographical information systems (GIS) and associations with movement (largely based on self-report).Footnote 10Footnote 11Footnote 12 While this information can provide an assessment of environmental exposure, it cannot always infer direct causality for where an individual's behaviour actually occurs. Context-specific patterns of movement refer to movement that occurs within specific domains or locations. Context-specific studies have examined behaviours which occur in locations such as neighbourhoodsFootnote 13 or parksFootnote 14 through direct observation or mapping and can provide detailed information about what parts of the environment individuals interact with (e.g., paths within a park, play structures, etc.). However, these studies are often limited to one location/domain and can be time and resource intensive to conduct.
The advent of newer technologies to track an individual's location such as geographic positioning systems (GPS) have the capacity to provide further context around where PA and ST are accrued.Footnote 15Footnote 16Footnote 17 Additionally, the overlay of GPS onto objectively measured movement data allows for a more robust quantification of behaviour within locations and has the capacity to provide a more comprehensive picture of an individual's activity space.Footnote 18 Providing greater context can facilitate a better understanding of the locations in which behaviours are undertaken and whether they differ across the life span and between sexes. The objective of this review was to identify and summarize evidence from location-based studies which employed the simultaneous use of GPS and objectively measured PA or ST.
Methods
A rapid review was employed; the protocol was prospectively registered with PROSPERO (see: https://www.crd.york.ac.uk/prospero/; #CRD42018084640). A rapid review employs general systematic review methodology but allows modifications for a quicker time to publication. This rapid review employed systematic review methodology but relied upon a single screener and data abstractor with support from data verification checks.
Criteria for considering studies for this review
Population
Data from high-income Organization for Economic Co-operation and Development (OECD) countriesFootnote 19 and apparently healthy populations were included. Findings were grouped into children (3–11 years), youth (12–17 years) and adults (≥ 18 years).
Exposures
The review included studies that used GPS information to objectively identify location of movement behaviour. GPS technologies included the Global Navigation Satellite System to determine location, direction and speed of the device.Footnote 20 For the purpose of the review, active transportation was included as a location term to define the location of behaviours that were specific to transportation, that weren't reflected by other locations (e.g., journey from home to school).
Outcomes
Studies must have used an objective measure of movement including pedometers, heart rate monitors and accelerometers to define time spent sedentary, time spent in light intensity physical activity (LPA), in moderate intensity physical activity (MPA) and in vigorous intensity physical activity (VPA).
Study design
Observational (prospective cohort, cross-sectional and case-control) and experimental (randomized controlled trials, pre-post and quasi-experimental) studies were included. Reviews and qualitative studies were excluded.
Publication status and language
Only publications in English or French, and published studies and indexed dissertations were eligible.
Search strategy
A comprehensive search strategy was developed in collaboration with two research librarians. The following six bibliographic databases were searched: Ovid MEDLINE(R) In-Process (1946 to January 5, 2018); Ovid EMBASE (1974 to January 5, 2018); Ovid PsycINFO (1806 to January Week 1, 2018); EBSCO CINAHL (1982 to January 5, 2018); EBSCO SportDISCUS (1830 to November Week 2, 2017); and, ProQuest Dissertations & Theses Global (1743 to January 5, 2018). The search strategy used for MEDLINE is included in Table 1. Bibliographies of key review papers were also searched.
| # | Searches | Results |
|---|---|---|
| 1 | ("global positioning" or "gps" or "geographic information system?" or "GIS" or Garmin or Qstarz or Geostats or NAVSTAR).tw,kf. | 32 312 |
| 2 | Geographic Information Systems/ | 7 617 |
| 3 | 1 or 2 | 34 947 |
| 4 | (acceleromet* or inclinomet* or pedomet* or stepscount or piezo* or yamax or "digiwalker*" or "digi walker*" or "digi-walker*" or lifecorder* or accusplit or actigraph or actical* or actimet* or actiheart* or bodymedia or geneactiv* or activinsights or fitbit* or polar* or omron).tw,kf. | 249 142 |
| 5 | exp Accelerometry/ | 6 695 |
| 6 | Monitoring, Ambulatory/ | 8 147 |
| 7 | ((activity or exercise or step? or move*) adj3 (monitor* or track* or count*)).tw,kf. | 31 451 |
| 8 | or/4-7 | 285 476 |
| 9 | 3 and 8 | 945 |
Selection of studies
Articles were imported into RefWorks (RefWorks, Bethesda, MD, USA) and, after removal of duplicates, exported to Microsoft Excel for screening. A single reviewer (SAP) screened the titles, abstracts and full texts of all studies. In the event that the reviewer was unsure, a co-author (GPB) was consulted.
Data extraction and analysis
Data abstraction forms were completed in Microsoft Excel by one reviewer (SAP) and a random 10% sample verified by another (AM). Information extracted included: publication details (author, year, location); sample size; study design; participant characteristics (age, sex, population); data collection period (e.g., seven days of wear); GPS monitor; movement monitor and cut-points (e.g., ST < 100 counts/minute); locations assessed (e.g., home, work, school, transportation, park); outcome assessed (e.g., ST, LPA, moderate-to-vigorous intensity physical activity [MVPA], steps); and, description of outcome.
Due to heterogeneity in reporting outcomes across studies and lack of reporting on variance, the review uses a qualitative synthesis. Insufficient data was available to examine differences by level of socio-economic status, location cost or by country. Sex differences are discussed where available.
Risk of bias appraisal
The risk of bias of individual studies was assessed using a modified version of the Cochrane Collaboration's Tool for Assessing Risk of Bias.Footnote 21 Studies were assessed for potential biases including: selection bias (sampling methods); performance and detection bias (measurement issues); attrition bias (incomplete follow-up and > 10% missing data), selective reporting bias (selective/incomplete reporting, rated high if secondary data analyses); and other possible sources of bias (i.e., inadequate adjustment for sex and wear time).
Results
Description of studies
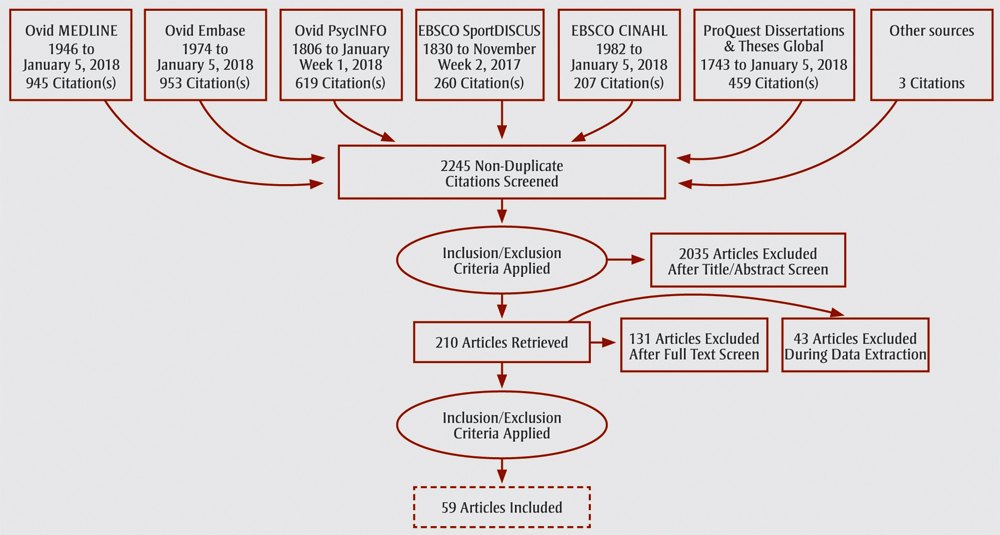
Figure 1 provides details of the literature search and screening process. Of the 3446 originally identified citations, 945 were identified in MEDLINE, 953 in EMBASE, 619 in PsycINFO, 207 in CINAHL, 260 in SPORTDiscus, 459 in Dissertations and Theses, and 3 from other sources. A total of 59 studies met the eligibility criteria. Study characteristics and findings are presented in Table 2. The review includes studies published over a 13-year period (2005 to 2017) and conducted in 12 countries with the majority from the United States (US) and the United Kingdom (UK); three were Canadian. The most widely used GPS and activity monitor devices were the QStarz Q-1000XT and ActiGraph, respectively. The most common locations included: home, school, workplace, active transportation, parks/playgrounds, and green spaces. Many locations were defined using buffers around the centre of an address (e.g., 50 m around home). MVPA was the most studied behaviour. There are a total of 22 studies in children,Footnote 22Footnote 23Footnote 24Footnote 25Footnote 26Footnote 27Footnote 28Footnote 29Footnote 30Footnote 31Footnote 32Footnote 33Footnote 34Footnote 35Footnote 36Footnote 37Footnote 38Footnote 39Footnote 40Footnote 41Footnote 42Footnote 43 17 in youthFootnote 44Footnote 45Footnote 46Footnote 47Footnote 48Footnote 49Footnote 50Footnote 51Footnote 52Footnote 53Footnote 54Footnote 55Footnote 56Footnote 57Footnote 58Footnote 59Footnote 60 and 20 in adults.Footnote 28Footnote 61Footnote 62Footnote 63Footnote 64Footnote 65Footnote 66Footnote 67Footnote 68Footnote 69Footnote 70Footnote 71Footnote 72Footnote 73Footnote 74Footnote 75Footnote 76Footnote 77Footnote 78Footnote 79 Sample sizes ranged from 12 to 1053; 39% were small (N ≤ 100).
Figure 1. Flow diagram of the literature search and screening process
Text Description
This figure provides details of the literature search and screening process.
Of the 3446 originally identified citations, 945 were identified in Ovid MEDLINE (1946 to January 5, 2018), 953 in Ovid EMBASE (1974 to January 5, 2018), 619 in Ovid PsycINFO (1806 to January Week 1, 2018), 207 in EBSCO CINAHL (1982 to January 5, 2018), 260 in EBSCO SPORTDiscus (1830 to November Week 2, 2017), 459 in ProQuest Dissertations and Theses Global (1743 to January 5, 2018), and 3 from other sources.
2245 non-duplicate citations were screened. 2035 articles were excluded after a screening of the title and abstract. Of the remaining 210 articles, 131 articles were excluded after a full-text screen and 43 articles were excluded during data extraction, leaving a total of 59 studies which met the eligibility criteria.
| Author, year | Country, study | NTable 2 Footnote a (% female) | AgeTable 2 Footnote b | Monitors, wear time | Behaviour | LocationTable 2 Footnote c | Results | |
|---|---|---|---|---|---|---|---|---|
| Children | ||||||||
Almanza, 2012Footnote 22 |
USA, Healthy PLACES |
208 (51–54%) |
8–14 |
ActiGraph GT2M/ GloblSat BT-335, 7 days |
MVPA (> 500 cpm, continuous) |
Home (30 m buffer) and NB (500 m buffer) greenness (vegetation using NDVI data) |
ST
MVPA
|
|
Burgi, 2016Footnote 23 |
Switzerland NR |
83 (48%) |
8.5 (0.3), 7–9 |
ActiGraph GT3X/BT-QStarz Q1000XT, 7 days (median 12.6 h/day) |
ST (< 101 cpm), MVPA (≥ 2296 cpm, continuous) |
Home (30 m buffer), own school (10 m bufferTable 2 Footnote *), other school (10 m bufferTable 2 Footnote *), sports facilities (10 m bufferTable 2 Footnote *), streets (10 m bufferTable 2 Footnote *), public parks and playgrounds (10 m bufferTable 2 Footnote *), other (others' home, shopping, restaurants), outside urban area |
Median weekly minutes (IQR) and proportion (IQR) oftime per location spent sedentary:
Median weekly minutes (IQR) and proportion (IQR) of time spent in MVPA in each location:
Proportion of total weekly MVPA:
|
|
Cerin, 2016Footnote 24 |
USA, NR |
66 (42%) |
4.5 (0.8) |
ActiGraph GT3X/QStarz Q100X, 1 week (average wear time NR) |
ST (< 152 cpm), MVPA (≥ 1680 cpm, continuous) |
Home (30 m buffer), childcare/school/daycare (30 m buffer), park/playground (30 m buffer), other without outdoor play area (30 m buffer), other with outdoor play area (30 m buffer). All locations include indoor and outdoor time. |
Proportion of time per location (SD) spent sedentary:
Proportion of time per location (SD) spent in MVPA:
|
|
Coombes, 2013Footnote 25 |
UK, SPEEDY |
100 (53%) |
9–10 |
ActiGraph GT1M/Garmin Forerunner 205, 4 non-school days (i.e., holidays and included 2 weekend days) |
ST (≤ 100 cpm), LPA (101–1999 cpm, continuous), MPA (2000–3999 cpm, continuous), VPA (≥ 4000 cpm, continuous), MVPA (≥ 2000 cpm, continuous), MVPA (5 min bouts) |
Beaches, woodland, grassland, farmland, parks, domestic gardens (home yard), roads and pavements, other built land use, buildings. Identified using land-use datasets; each GPS data point was assigned a land use category based on the land parcel it fell within. |
Proportion of total daily LPA:
Proportion of total daily MPA:
MVPA
Proportion of total daily VPA:
Sex differences
|
|
Cooper, 2010Footnote 26 |
England, PEACH Study |
137 (66%) |
11.3 (0.3) |
ActiGraph GT1M/Garmin Foretrex 201, 2 days of combined wear; between 8:00 and 9:00 a.m. |
MVPA (> 3200 cpm, continuous) during journey to school |
AT (journey to school – identified as points outside of playground polygon), school playground (polygon drawn around playground) |
MVPA
|
|
Dessing, 2013Footnote 27 |
Netherlands, SPACE study |
76 (58%) |
8.6 (1.4), 6–11 |
ActiGraph GT1M/QStarz BT-1000X, 7 days (average wear time of 11.2 h/day) |
MVPA (> 2296 cpm, continuous) |
Schoolyard (10 m buffer of schoolyard polygon), school building (points during class time), outside school environment (> 10 m buffer around school) |
Daily minutes (SD) and proportion (SD) of time per location spent in MVPA:
Proportion of total daily MVPA:
Sex differences
|
|
Dunton, 2013Footnote 28 |
USA, NR |
291 (53%) |
11.2, 8–14 |
ActiGraph GT2M/ GlobalSat BT-335, 7 days (mean = 4.5 days with 310.8 min/day of matched parent-child pairs) |
Parent-child ST (< 100 cpm) and MVPA (age-specific thresholds using 4 METs) |
Residential (500 m buffer around home neighbourhood, e.g., houses, apartments, condos), commercial (e.g., retail stores, restaurants, personal services, private health club/gym, motels), open space (e.g., parks, gardens, wildlife preserves), educational (e.g., schools), public facilities (e.g., government, health care, religious, libraries, community centres), other (e.g., roads, water) |
Proportion of total parent-child ST:
Proportion of total parent-child MVPA:
|
|
Dunton, 2014Footnote 29 |
USA, Healthy PLACES |
135 (50%) |
8–14 |
ActiGraph GT2M/ GlobalSat BT-335, 7 days (average wear time NR) |
MVPA (age-specific thresholds ≥ 4 METs) |
Parks (within 500 m radial buffer, included national, state, county, city parks and forests) |
MVPA
|
|
Eyre, 2014Footnote 30 |
England, NR |
64 (53%) |
7–9 |
Garmin Forerunner 305, 4 days (including 2 weekend days; average wear time = 388 ± 179 min) |
MVPA (≥ 50% heart rate reserve) |
School (indoors and outdoors: school field, school playground, school indoors), home, AT (not defined), indoors (house, other building and school), outdoors (green space and non-green space) |
Proportion of total MVPA:
Proportion (SD) of time per location spent in MVPA:
Sex differences
|
|
Jones, 2009Footnote 31 |
England, SPEEDY |
100 (53%) |
9–10 |
ActiGraph GT1M/Garmin Forerunner 205, 4 days (boys: 11.1 ± 2.2 h/day, girls: 10.0 ± 3.2 h/day of wear time) |
MVPA (5 min bouts, ≥ 2000 cpm) |
Inside (≤ 800 m pedestrian network around home), outside NB (> 800 m network), buildings (domestic residences, shops, indoor sports facilities, covered structure), other built land use, roads and pavement, gardens (private), parks, farmland, grassland, woodland, beaches |
Average total minutes (SD) and proportion of MVPA over 4 days:
Sex differences
|
|
Lee, 2014Footnote 32 |
USA, Why and Why Nots of Active Living |
112 (51%) |
9.5, 7–12 |
ActiGraph GT1M or GT3X/Garmin Forerunner 203, 7 days (minimum 8 h/day) |
MVPA (≥ 4 METs) total continuous |
Home-school trips (AT); walkers (walk to/from school at least once a week, live within ½ mile of school and parents reported distance walkable); captive walkers (walk to/from, distance > ½ mile or parents reported distance too far); non-walkers (did not walk to/from school) |
MVPA
Sex differences
|
|
Mackett, 2007Footnote 33 |
UK, CAPABLE Study |
82 (57%) |
8–11 |
RT3/Garmin Foretrex 201, 4 days (2 week and 2 weekend days) |
PA intensity using continuous activity counts (no cut-points used) |
Road (e.g., roads, tracks or paths) vs. open space (e.g., public open space: parks, fields, woods) |
|
|
McMinn, 2014Footnote 34 |
Scotland, NR |
39 (31%) |
8.5, 8–9 |
ActiGraph GT1M/ Trackstick Super, 1 journey home from school |
MVPA during AT from home to school (> 2296 cpm) |
AT (vehicle transport identified as speeds > 25 km/h excluded), location from home to school: green space; other natural; road/track/path; other human-made |
MVPA
Proportion of total AT time within each separate land-use category spent in MVPA:
|
|
Moore, 2014Footnote 35 |
England, NR |
28 (61%) |
11.8, 11–14 |
ActiGraph GT3X/QStarz BT-Q1000XT, 7 days (average 10.0 ± 2.7 h/day) |
MVPA (≥ 2220 cpm, in bouts of ≥ 3 min) |
Home, school, street, rural/urban green space defined by researcher using Google Maps |
Minutes (SD) of daily MVPA:
|
|
O'Connor, 2013Footnote 36 |
USA, NR |
12 (40%) |
4.7 (0.8), 3–5 |
ActiGraph GT3X/QStarz BT 100X, NR |
Activity counts/30 seconds, continuous |
Home, other home, store, restaurant, church, community center, park, other locations (all used 100 m buffer) |
|
|
Oreskovic, 2012Footnote 37 |
USA, NR |
24 (58%) |
11–12 |
ActiGraph GT1/ Forerunner 201, 7 days including 2 weekend days |
MVPA (≥ 1952 cpm, continuous) |
Home (25 m buffer), school (within 100 m from school perimeter), car, indoor/other (non-home or school), park/playground (incl. outdoor rec space), street/walking (all coded by GIS specialist) |
Minutes (proportion) of total MVPA:
Seasonal differences
|
|
Pearce, 2014Footnote 38 |
UK, PEACH Study |
427 (54%) |
10.7 (0.5), 10–11 |
ActiGraph GT1M/ Forerunner 201, 7 days (3:00 p.m.–10:00 p.m. on weekdays) |
MVPA (≥ 2296 cpm, continuous) |
Indoors vs. outdoors after school |
Minutes (SD) and proportion of total daily after school MVPA:
|
|
Pizarro, 2017Footnote 39 |
Portugal, SALTA Project |
374 (54%) |
11.7 (0.9) |
ActiGraph GT3X/QStarz BT-Q1000XT, 7 days |
MVPA (≥ 2296 cpm; 5 min bouts) |
Leisure, school (polygon using Google Maps), transport (≥ 100 m buffer with average speed ≥ 1.5 km/hr), home (25 m buffer) |
Proportion of total MVPA:
Proportion of time per domain spent in MVPA:
Sex differences
|
|
Quigg, 2010Footnote 40 |
New Zealand, CALE Study |
184 (54%) |
7.6, 5–10 |
ActiGraph GT1M/ GlobalStat DG-100, 7 days (≥ 5 h/day) |
PA (accelerometer counts) |
Parks/playgrounds (within park boundaries) |
Physical activity
Sex differences
|
|
Southward, 2012Footnote 41 |
England, PEACH Study |
84 |
11–12 |
ActiGraph GT1M/Garmin Foretrex 201, school journey on 4 days |
MVPA (≥ 2296 cpm, continuous) |
AT: path from home to school and back (within 200 m of home and school) |
Minutes and proportion of total daily MVPA:
Proportion of AT time spent in MVPA:
Sex differences
|
|
Van Kann, 2016Footnote 42 |
Netherlands, Active Living Study |
257 (53%) |
8–11 |
ActiGraph GT3X/QStarz BT-Q1000XT, 5 days (minimum of 5 min/school yard period) |
ST (> 101 cpm), MVPA (> 2295 cpm, continuous) |
Schoolyard (10 m Euclidian buffer) |
Minutes (SD) and proportion of total daily ST:
Minutes (SD) and proportion of total daily MVPA:
Sex differences
|
|
Wheeler, 2010Footnote 43 |
UK, PEACH Study |
1053 (53%) |
10–11 |
ActiGraph GT1M/Garmin Foretrex 201, 4 days (after school only) |
MVPA (≥ 3200 cpm, continuous) |
Indoors vs. outdoors not green space vs. outdoors in green space vs. outdoors out of area |
Minutes (SD) and proportion of total daily MVPA:
Proportion of time per location spent in MVPA:
Sex differences
|
|
| Youth | ||||||||
Andersen, 2017Footnote 44 |
Denmark, NR |
Baseline 354, post-renewal: 319 |
13.2 (1.18), 11–16 |
ActiGraph GT3X/QStarz BT-Q1000XT, 7 days (~13 h/day) |
ST (≤ 100 cpm), LPA (101–2295 cpm), MVPA (> 2295 cpm, continuous) |
In-district time pre-post urban renewal project which included 4 new urban green spaces/ playgrounds and renovation of large public park |
ST
LPA
MVPA
|
|
Burgi, 2015Footnote 45 |
Switzerland, NR |
119 (57%) |
12.5 (0.4), 11–14 |
ActiGraph GT3X/ BT-QStarz Q1000XT, 7 days |
MVPA (≥ 2296 cpm, continuous) |
Home (30 m buffer), own school (all school property, 10 m buffer), other school, recreation facility (public parks and sports facilities, 10 m buffer), street (10 m buffer), other (others home, shopping, restaurants), outside urban area |
Median weekly minutes (IQR) and proportion of total daily MVPA:
Median proportion (IQR) of time per location spent in MVPA:
Sex differences
|
|
Carlson, 2016Footnote 46 |
USA, TEAN Study |
549 (50%) |
14.1 (1.4), 12–16 |
ActiGraph 7164 or 71256 or GT1M or GT3X/GlobalSat DG-100, 7 days |
MVPA (≥ 2296 cpm, continuous) |
Home (50 m buffer), near home (1 km street network buffer), school (15 m buffer), near school (1 km street network buffer), other locations |
Minutes (SD) and proportion of total daily MVPA on school days:
Minutes (SD) and proportion of total daily MVPA on non-school days:
Minutes (SD) and proportion of total daily MVPA (weighted week):
Sex differences
|
|
Collins, 2015Footnote 47 |
England, NR |
75 (49%) |
13–14 |
HR monitor/ Garmin Forerunner 305, 4 school days (after-school hours) |
MVPA (> 120 bpm, > 140 bpm) |
Commute from school to home |
Minutes (SD) and proportion of total daily MVPA:
Sex differences
|
|
Geyer, 2013Footnote 48 |
Scotland, GAG Study |
27 (52%) |
13–15 |
ActiGraph/ GPS-enabled Blackberry, 6–7 days |
ST (< 1100 cpm), LPA (1100–3200 cpm), MVPA (> 3200 cpm, continuous) during leisure time |
Green space (natural environments in urban spaces) |
Proportion of total daily MVPA:
Proportion of time per location spent in MVPA:
|
|
Klinker, 2014Footnote 49 |
Denmark, WCMC Study |
367 (52%) |
13.2 (1.2), 11–16 |
ActiGraph GT3X/QStarz BT-1000X, 7 days (mean 2.5 days, median 12.7 h/day) |
MVPA (≥ 2296 cpm, continuous) |
School grounds (address), clubs, sports facilities (if offered activities for 10–16-year-olds; address), playgrounds (address), urban green space (geodata), shopping centers (address), other places, school, recess (using school schedule), physical education (using school schedule), transport, home (10 m buffers) |
Median minutes (IQR) of total daily MVPA (boys):
Median proportion of time per location spent in MVPA (boys):
Median minutes (IQR) of total daily MVPA (girls):
Median proportion of time per location spent in MVPA (girls):
Sex differences
|
|
Klinker, 2014Footnote 50 |
Denmark, WCMC Study |
170 (51%) |
11–16 |
ActiGraph GT3X/QStarz BT-1000X, 7 days (≥ 9 h/day) |
Outdoor MVPA (≥ 2296 cpm, continuous) |
School grounds (10 m buffer), clubs (10 m buffer), sports facilities (10 m buffer), playgrounds (10 m buffer), urban green space (10 m buffer), shopping centers (10 m buffer), other places (10 m buffer), school (10 m buffer), recess (school schedule), physical education (school schedule), transport (active vs. passive), home (10 m buffer) |
Proportion of total daily MVPA:
Median minutes (IQR) of total daily outdoor MVPA:
Sex differences
|
|
Lachowycz, 2012Footnote 51 |
England, PEACH Study |
902 (53%) |
weekday evenings: 12.0 (0.39), weekends: 12.1 (0.40),11–12 |
ActiGraph GT1M/Garmin Foretrex 201, 5 days |
Weeknight and weekend day ST (< 100 cpm), LPA (100–2296 cpm), MVPA (≥ 2296 cpm, continuous) |
Indoors vs. outdoors, green space, parks (all types, park –formal [organized layout, well-maintained], park-informal [informal recreation], park-natural [provide access to nature including heathland, woodland and wetland], park-sports [area used for organized and competitive sports; e.g., playing fields and tennis courts], park-young persons [designed for use by children and youth including play and game equipment]), private gardens (green space around the home), school grounds (grassland around school), other green space (vegetated areas not otherwise defined including private sports and recreation facilities, cemeteries, golf courses, gardens of publicly accessible buildings), roads/pavement, green verges (small fragmented vegetation/grass land e.g., centres of roundabouts and strips alongside pavement) , built surfaces |
Minutes (SD) and proportion of total daily ST (3 –10 pm of weekday):
Minutes (SD) and proportion of total daily outdoor ST (3 –10 pm of weekday):
Minutes (SD) and proportion of total daily ST (8 am–10 pm of weekend day):
Minutes (SD) and proportion of total daily outdoor ST (8 am–10 pm of weekend day):
Minutes (SD) and proportion of total daily LPA (3 –10 pm of weekday):
Minutes (SD) and proportion of total daily outdoor LPA (3 –10 pm of weekday):
Minutes (SD) and proportion of total daily LPA (8 am –10 pm of weekend day):
Minutes (SD) and proportion of total daily outdoor LPA (8 am –10 pm of weekend day):
Minutes (SD) and proportion of total daily MVPA (3 –10 pm of weekday):
Minutes (SD) and proportion of total daily outdoor MVPA (3 –10 pm of weekday):
Minutes (SD) and proportion of total daily MVPA (8 am –10 pm of weekend day):
Minutes (SD) and proportion of total daily outdoor MVPA (8 am –10 pm of weekend day):
|
|
Maddison, 2010Footnote 52 |
New Zealand, ICAN Study |
79 (42%) |
14.5 (1.6), 12–17 |
ActiGraph 7164/Garmin Forerunner 305, 4 days (2 weekday, 2 weekend; ≥ 10 h/day) |
ST (<1.5 METs), LPA (1.5–2.9 METs), MPA (3.0–5.9 METs), VPA (≥ 6.0 METs), MVPA (10 min bouts) |
Home (150 m buffer), school (1 km buffer) |
Proportion of time in ST per location:
Proportion of time per location in LPA:
Proportion of time per location in MPA:
Proportion of time per location in VPA:
Proportion of time per location in MVPA bouts:
|
|
Oreskovic, 2015Footnote 53 |
USA, NR |
80 (56%) |
12.6 (1.1), 11–14 |
ActiGraph GT3X/QStarz BT-Q1000XT, 2 weeks |
ST (< 100 cpm), MVPA (≥ 2296 cpm, continuous) |
Home (40 m buffer), school (40 m buffer), park (incl. green spaces and open land), playground (incl. areas for public rec such as soccer, football, baseball, golf), streets and sidewalks, other |
Median minutes (IQR) of total daily ST:
Mean minutes (SD) of total daily ST:
Median minutes (IQR) of total daily MVPA:
|
|
Pearce, 2015Footnote 54 |
Scotland, NR |
82 (57%) |
12.4 (0.4), 11–13 |
ActiGraph GT3X/QStarz BT-Q1000eX, 7 days (≥ 9 h/day) |
MVPA (> 2296 cpm, continuous) |
School (verified using school timetable), indoor vs. outdoor, unstructured vs. structured (identified via diary data) |
Median minutes (IQR) and proportion of total daily weekday MVPA:
Median minutes (IQR) and proportion of total daily weekend day MVPA:
|
|
Pizarro, 2016Footnote 55 |
Portugal, NR |
155 (55%) |
15.9 (1.1), 14–18 |
ActiGraph GT3X/QStarz BT-Q1000XT, 7 days (school journey) |
MVPA (≥ 2296 cpm, continuous) |
AT (to and from school) – Walking: classified if they had a 90th percentile of speed < 10 km/h Bicycling: 90th percentile speed between 10–35 km/h Vehicle: 90th percentile of speed ≥ 35 km/h |
Minutes/trip (SD) and proportion of time in MVPA bouts per mode of AT:
|
|
Rainham, 2012Footnote 56 |
Canada, NR |
316 (47%) |
13.2 (0.9), 12–16 |
ActiGraph GT1M/EM-408 SiRF III, 8 days (> 10 h/day) |
MVPA (not defined) |
Home, school, commuting, athletic facility, entertainment, green space, military, parking lot, religious, residential, restaurant, retail, services, transportation (all not defined) |
Proportion of total MVPA per location: | |
Urban boys :
|
Urban girls:
|
|||||||
Suburban boys :
|
Suburban girls:
|
|||||||
Rural boys:
|
Rural girls:
|
|||||||
Sex differences
|
||||||||
Robinson, 2013Footnote 57 |
USA, NR |
31 (71%) |
11–14 |
ActiGraph GT3X, 14 days |
MVPA (≥ 2296 cpm, continuous) |
NB (youth identified vs. census defined) |
Minutes of total daily MVPA:
|
|
Rodriguez, 2012Footnote 58 |
USA, TAAG study |
293 (100%) |
15–18 |
ActiGraph 7164/Garmin Foretrex 201, 6 days |
ST (< 100 cpm), LPA (≥ 100 to < 3000 cpm), MVPA (≥ 3000 cpm, continuous) |
PA facilities (businesses that support PA including bowling alleys, dance studios, swimming pools, yoga studios, exercise facilities, sports clubs), food outlets, parks, population density (all 50 m buffer) |
ST, LPA and MVPA In San Diego, presence of each item within 50 m buffer of each GPS/accelerometer point significantly associated with:
In Minneapolis, presence of each item within 50 m buffer of each GPS/accelerometer point significantly associated with:
|
|
Voss, 2014Footnote 59 |
Canada, ASAPJ Study |
43 (~37%) |
13.8 (0.6) |
ActiGraph GT3X/QStarz BT-Q1000XT, 7 days (during trip) |
MVPA (≥ 2296 cpm, continuous) |
AT: transportation to and from school |
Minutes (SD) of total daily MVPA per trip:
|
|
Voss, 2015Footnote 60 |
Canada, ASAPJ Study |
42 (36%) |
13.8 (0.6) |
ActiGraph GT3X/QStarz BT-Q1000XT, 7 days |
MVPA (≥ 2296 cpm, continuous) |
AT: transportation mode for school trips |
Minutes (SD) of total daily MVPA per trip:
|
|
| Adults | ||||||||
Audrey, 2014Footnote 61 |
England, Walk to Work Study |
103 (57%) |
36.3 (11.7) |
ActiGraph GT3X/QStarz BT-Q1000XT, 7 days (≥ 10 h/day) |
MVPA (> 1952 cpm, continuous) |
AT: walk to work (based on home and work address and included other destinations if taken as part of journey) |
Minutes and proportion of total daily MVPA per trip:
|
|
Chaix, 2016Footnote 62 |
France, RECORD GPS Study |
227 (32%) |
≥ 35 |
ActiGraph GT3X/QStarz BT-Q1000XT, 7 days |
Walking (> 200 steps/10 min, continuous) |
AT: trip distance, mode, and characteristics |
Walking:
|
|
Chaix, 2014Footnote 63 |
France, RECORD GPS Study |
234 (35%) |
Median 58 (IR: 41–73) |
ActiGraph GT3X/QStarz BT-Q1000XT, 7 days (median 12h, 35 min) |
ST (< 150 cpm), MVPA (≥ 2690 cpm, continuous) – vector magnitude |
AT (trip = travel from one destination to the next destination) |
Median (interdecile range) proportion of total daily ST:
Median (interdecile range) proportion of total daily steps:
Median (interdecile range) proportion of total daily MVPA:
|
|
Costa, 2015Footnote 64 |
UK, Commuting and Health in Cambridge Study |
41 (56%) |
24–62 |
Actiheart/ QStarz BT-Q1000X, 7 days |
ST (< 1.5 MET), LPA (1.5–3 MET), MPA (3–6 MET), VPA (> 6 MET, continuous) |
AT: commuting journeys by mode of transportation (car, bus, car + walk, car + cycle, walk, cycle) |
Median proportion of time per mode spent in ST:
Median proportion of time per mode spent in LPA:
Median proportion of time per mode spent in MVPA:
|
|
Dewulf, 2016Footnote 65 |
Belgium, NR |
180 (48%) |
59–65 |
ActiGraph GT3X/QStarz BT-Q1000XT, 1 week (≥ 4 days, ≥ 6 h/day) |
ST (0–100 cpm), LPA (101–1951 cpm), MVPA (1952–100 000 cpm, continuous) |
Home (50 m buffer), NB (51–1000 m buffer), outside NB (> 1000 m buffer), green areas (including agriculture, grassland, forest, swamp, health land, coastal dune, park, recreation and sport terrains) |
Mean proportion of time per location spent in ST:
Mean proportion of time per location spent in LPA:
Mean proportion of time per location spent in MVPA:
Sex differences
|
|
Dunton, 2013Footnote 28 |
USA, NR |
291 (88%) |
39.6 (6), 26–62 |
ActiGraph GT2M/ GlobalSat BT-335, 7 days |
ST (< 100 cpm), MVPA (≥ 2020 cpm, continuous) |
Residential, commercial (retail stores, restaurants, personal services, private health club/gym, motels), open space (parks, gardens, wildlife preserves), educational (schools), public facilities (government, health care, religious, libraries, community centres), other (roads, water) |
Proportion of total daily ST (joint parent-child):
Proportion of total daily MVPA (joint parent-child):
|
|
Evenson, 2013Footnote 66 |
USA, SOPARC Study |
238 (56%) |
40.4, 18–85 |
ActiGraph GT1M/QStarz BT-1000X, 3 weeks (average 11.5 h/day) |
ST (≤ 100 cpm), LPA (101–759 cpm), MPA (2020–5998 cpm), VPA (≥ 5999 cpm), MVPA (≥ 2020 cpm, 10 min bouts) |
Parks, AT (to and from parks) |
Proportion of total daily ST:
Proportion of time per location spent in ST:
Proportion of total daily LPA:
Proportion of time per location spent in LPA:
Proportion of total daily MPA + VPA:
Proportion of time per location spent in MVPA:
|
|
Hillsdon, 2015Footnote 67 |
England, FAST Study |
195 (58%) |
18–91 |
ActiGraph GT1M/QStarz BT-1000X, 7 days (≥ 10 h/day) |
Outdoor LMVPA (≥ 500 cpm) |
Inside home NB (800 m buffer) vs. outside home NB |
Proportion of total daily outdoor LMVPA:
Sex differences
|
|
Holliday, 2017Footnote 68p> |
USA, SOPARC GPS Study |
223 (57%) |
18–85 |
ActiGraph GT1M/QStarz BT-1000X, 3 weeks (≥ 4 days, ≥ 10 h/day) |
MVPA (used three different cut-points: Matthews' MVPA (≥ 760 cpm, bouts ≥ 10 min); NHANES' MVPA (≥ 2020 cpm, bouts ≥ 10 min); NHANES' VPA (≥ 5999 cpm, bouts ≥ 10 min)) |
Home (address), roads, parks, commercial (retail locations, strip malls, malls, dense commercial districts, restaurants, gas stations), school (pre-K to university), other (services, offices, golf courses, factories, places of worship, entertainment), fitness (pay gyms, private tennis/soccer facilities, swim clubs, dance/martial arts studios), residential (excluding participant homes), footpath/trail, motorized |
Median (IQR) and proportion of total daily MVPA over 3 weeks:
Median (IQR) and proportion of total daily VPA (NHANES) over 3 weeks:
|
|
Hurvitz, 2014Footnote 69 |
USA, TRAC Study |
611 (61%) |
≥ 18 |
ActiGraph GT1M/ GlobalSat DG-100, 7 days |
ST (≤ 150 cpm), LPA (151–1951 cpm), MPA (1952–5274 cpm, continuous), VPA (≥ 5275 cpm, continuous) |
Home (< 125 m), near home (125–1666 m), away (> 1666 m) |
Mean (SD) and proportion of total daily ST:
Mean (SD) and proportion of total daily LPA:
Mean (SD) and proportion of total daily MVPA:
Proportion of time per location spent in MVPA:
Mean (SD) and proportion of total daily VPA:
|
|
Hwang, 2016Footnote 70 |
USA, NR |
106 (76%) |
41.7 (10.5), 24–70 |
ActiGraph GT3X/QStarz TR-Q1000XT, 2 weeks (12–14 valid days) |
Walking bouts (> 2000–6166 cpm for at least 7 min) |
Inside (1-, 2- and 3-km radii around home) vs. outside NB |
Walking
|
|
Jansen, 2016Footnote 71 |
Netherlands, SPACE Project |
308 (55%) |
56.4 (6.2), 45–65 |
ActiGraph GT3X/QStarz BT-Q1000X, 7 days (≥ 10 h/day, ≥ 4 days) |
MVPA (≥ 3208 cpm, continuous) |
Home (25 m buffer), shopping area (25 m buffer), workplace (50 m buffer), small green area (parks and public gardens), larger green area (recreational, agricultural, forest, natural terrain), sports facilities (require membership or subscription), other residential area (25 m buffer around residences) |
Median minutes (IQR) of total daily MVPA:
Median proportion (IQR) of time per location spent in MVPA:
|
|
Jansen, 2017Footnote 72 |
Netherlands, SPACE Project |
279 (54%) |
46–65 |
ActiGraph GT3X/QStarz BT-Q1000X, 7 days (≥ 10 h/day, ≥ 4 days) |
ST (< 150 cpm), LPA (150–3208 cpm), MVPA (≥ 3208 cpm, continuous) |
Parks (e.g., city parks, children's farm), recreational area (e.g., zoo, playground, picnic places), agricultural green (e.g., grassland, orchard), forest and moorland (e.g., forest, moorland, dunes), blue space (e.g., lakes, rivers, water parks, seas) |
ST
LPA
MVPA
|
|
Perez, 2016Footnote 73 |
USA, Faith in Action |
86 (100%) |
45.4 (9.3), 18–65 |
ActiGraph GT3X/QStarz BT-Q1000X, 7 days (≥ 8 h/day, ≥ 2 days) |
MVPA (≥ 2020 cpm, continuous) |
NB outdoor environment (500 m buffer around home) vs. home (50 m radius) |
Median (IQR) minutes of total daily MVPA:
|
|
Rafferty, 2016Footnote 74 |
UK, NR |
26 (65%) |
38, 23–65 |
activPAL/Amod AGL3080, 7 days |
MVPA (> 109 steps per minute, continuous) |
Work, AT commute (home to work), work excursion (e.g., out for lunch), home, home excursion (at home but outside or going back home from somewhere), other (shopping mall, restaurant, cinema) |
Mean (SD) and proportion of total daily MVPA:
|
|
Ramulu, 2012Footnote 75 |
USA, NR |
35 (74%) |
38, 18–61 |
Actical/pTrac Pro, 6 days |
MVPA (≥ 1535 cpm, continuous) |
Home (≤ 536 m buffer) vs. away from home (> 536 m) |
Median minutes (IQR) and proportion (IQR) of total daily MVPA on weekdays:
Median minutes (IQR) and proportion (IQR) of total daily MVPA on weekend days:
|
|
Rodriguez, 2005Footnote 76 |
USA, NR |
35 (60%) |
20–61 |
ActiGraph 7164/Garmin Foretrex 201, 3 days |
MVPA (≥ 10 min bouts, threshold not defined) |
Indoors (≥ 33% of GPS data located within building footprint), outdoors in NB (1.54 km buffer around home address), outdoors out of NB (all other bouts) |
Proportion of total daily MVPA:
|
|
Stewart, 2016Footnote 77 |
USA, TRAC Project |
671 (63%) |
≥ 18 |
ActiGraph GT1M/ GlobalSat DG-100, 1 week (≥ 8 h/day) |
ST (≤ 100 cpm), park PA (> 1000 cpm), MVPA (≥ 1952 cpm, 5 min bouts) |
Parks (publicly owned, freely accessible, outdoor spaces intended for leisure or recreation) |
Mean (SD) minutes and proportion (SD) of time per location spent in ST:
Mean (SD) minutes and proportion (SD) of time per location spent in MVPA:
|
|
Troped, 2010Footnote 78 |
USA, NR |
148 (53%) |
44.0 (13.0), 19–78 |
ActiGraph 7164/GeoStats GeoLogger, 4 days |
MPA (1952–5724 cpm), VPA (≥ 5725 cpm) |
Home buffer 50 m, home buffer 1 km, work buffer 50 m, work buffer 1 km |
Mean (SD) minutes and proportion (SD) of time per location spent in MPA:
Mean (SD) minutes and proportion (SD) of time per location spent in VPA:
Sex differences No significant differences between men and women. |
|
Zenk, 2011Footnote 79 |
USA, DASES Study |
120 (75%) |
> 18 |
ActiGraph GT1M/Garmin Foretrex 201, 7 days (≥ 3 days, ≥ 10 h/day) |
MVPA (≥ 2200 cpm, continuous) |
Fast food outlet density (top 50 national quick service restaurants excluding coffee shops, ice cream places, and juice bars), supermarket availability (chained supermarkets), park land use (municipal park land) |
MVPA
|
|
Abbreviations: ASAPJ, Active Streets, Active People Junior Study; assoc., associated; AT, active transportation; bpm, beats per minute; CALE, Children's Activity in their Local Environment; CAPABLE, Children's Activities, Perceptions and Behaviour in the Local Environments; CI, confidence interval; cpm, counts per minute; DASES, Detroit Activity Space Environments Study; F, female; FAST, Forty Area Study; GAG, GPS, Accelerometry and GIS; IQR, interquartile range; km, kilometer; LMVPA, light, moderate and vigorous intensity physical activity; LPA, light intensity physical activity; m, metre; MET, metabolic equivalent; min, minutes; MPA, moderate intensity physical activity; MVPA, moderate-to-vigorous intensity physical activity; NB, neighbourhood; NHANES, National Health and Examination Survey; NR, not reported; OR, odds ratio; PA, physical activity; PEACH, Personal and Environmental Associations with Children's Health; RECORD, Residential Environment and Coronary Heart Disease; SALTA, Environmental Support for Leisure and Active Transport; SD, standard deviation; SOPARC, System for Observing Play and Recreation in Communities; SPACE, Spatial Planning and Children's Exercise; SPEEDY, Sport, Physical activity and Eating behaviour Environmental Determinants in Young people; ST, sedentary time; TAAG, Trial of Activity for Adolescent Girls; TEAN, Teen Environment and Neighborhood; TRAC, Travel Assessment and Community; UK, United Kingdom; USA, United States of America; VPA, vigorous intensity physical activity; WCMC, When Cities Move Children.
|
||||||||
Risk of bias assessment
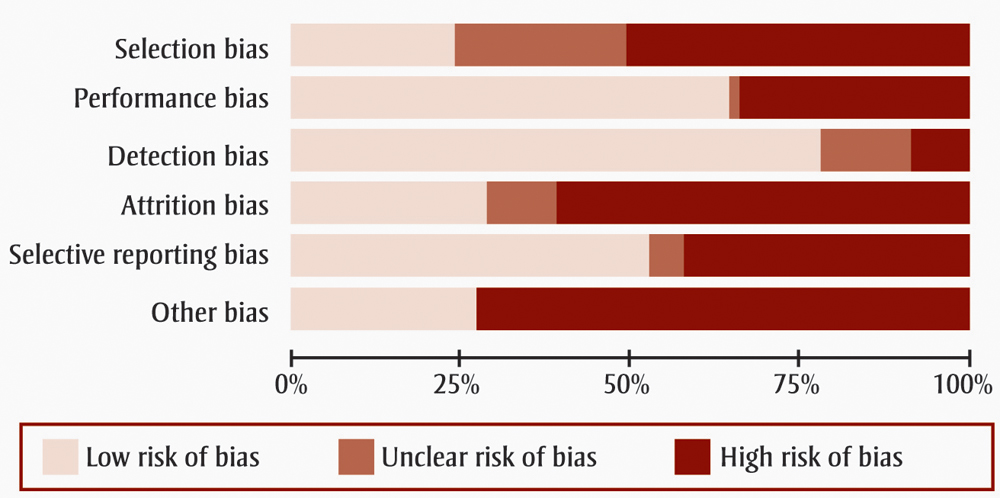
Risk of bias results are summarized in Figure 2. Just over half of the studies had a high risk of selection bias as many included convenience samples. About a quarter had no description of how the study sample was derived. The majority had a low risk of performance and detection bias since they mostly employed GPS technology overlaid using GIS and used accelerometers with valid cut-points to define ST, LPA and MVPA. However, some studies had a high risk of performance bias as there was potential for misclassification of location based on the decisions of coders and/or the use of ‘buffers’ to define spaces. Slightly less than half of the studies had a high risk of selective reporting; many conducted secondary analyses for which the primary objective of the study was not to examine location of movement. Finally, most studies had a high risk of ‘other’ bias which included the lack of adjustment for wear time and sex in analyses.
Figure 2. Risk of bias summary
Text Description
Risk of bias results are summarized in this figure. Just over half of the studies had a high risk of selection bias as many included convenience samples. About a quarter had no description of how the study sample was derived. The majority had a low risk of performance and detection bias since they mostly employed GPS technology overlaid using GIS and used accelerometers with valid cut-points to define ST, LPA and MVPA. However, some studies had a high risk of performance bias as there was potential for misclassification of location based on the decisions of coders and/or the use of ‘buffers’ to define spaces. Slightly less than half of the studies had a high risk of selective reporting; many conducted secondary analyses for which the primary objective of the study was not to examine location of movement. More than half of studies had a high risk of attrition bias, whereas slightly more than a quarter of studies had a low risk of this bias. Finally, most studies had a high risk of ‘other’ bias which included the lack of adjustment for wear time and sex in analyses.
Location-based findings for children (3-11 years)
The most commonly reported locations in the child studies were: homes, schools, parks, active transportation, and streets/roads. Results suggest that the active transportation and school environments are important locations for MVPA, while the home environment is less of a contributor.
Many studies focussed on movement patterns within specific sub-sets of environments rather than total-day movement. For example, several studies examined or reported exclusively on time spent in travel to-and-from school.Footnote 26Footnote 32Footnote 34Footnote 41 In these studies, a substantial proportion of time (31-37%) spent commuting to school was spent in MVPAFootnote 26Footnote 34 and contributed to 11-22% of total MVPA (especially among walkers).Footnote 32Footnote 41 Children who walked to school tended to live closer than those who use passive modes of transit.Footnote 26 Additional studies identified streets/roads as great sources of MVPA among children,Footnote 35 largely owing to their use for active transit to-and-from school.Footnote 39
Consistent evidence suggests that the school environment is one of the greatest sources for total MVPAFootnote 23Footnote 27Footnote 30Footnote 35Footnote 39Footnote 42 for children. Specifically, the schoolyard appears to be a large contributor to school-based MVPA, especially among boys.Footnote 27Footnote 42 The Spatial Planning and Children’s Exercise (SPACE) Study in the Netherlands found that children spent a very small proportion of the time (2-3%) inside the school building in MVPA; the schoolyard (especially at recess) was a greater contributor.Footnote 27 Similarly, children from the Active Living Study obtained 18% of their daily MVPA in the schoolyard.Footnote 42
While parks and green space were low contributors of total MVPA,Footnote 40 time spent within these spaces was often at higher intensities.Footnote 23Footnote 24Footnote 29Footnote 43 The Children’s Activity in their Local Environment (CALE) Study from New Zealand found that only 2% of recorded PA took place in city parks.Footnote 40 Data from the Healthy PLACES study in the US found that only 27% of children used a neighbourhood park and proximity was directly related to use.Footnote 29
Indoor locations appear to be a substantial source of LPAFootnote 25 and ST,Footnote 22 while outdoor locations contribute more to MVPA.Footnote 24Footnote 30Footnote 43 There is likely a seasonal effect on location of MVPA. Oreskovic et al.Footnote 37 found that MVPA was higher in the home environment during winter months and higher in parks/playgrounds during the summer months.
Much of time in the home environment is spent sedentary and appears to be a substantial source of ST.Footnote 22Footnote 23Footnote 24Footnote 28 Dunton et al.Footnote 28 found that 76% of parent-child ST was spent in the home. A study of preschoolers found that 45% of time spent in the home environment was spent sedentary.Footnote 24 Burgi et al.Footnote 23 found that 7- to 9-year-olds spent a median of 60% of their home time sedentary. Results from the Healthy PLACES study also found that among 8- to 14-year-olds, ST often occurred in the home.Footnote 22
Several studies reported on sex differences in locations for MVPA. One study found that boys obtained a higher proportion of their MVPA outside their neighbourhood (> 800 m), while girls obtained a higher proportion inside their neighbourhood.Footnote 31 Two studies observed that active transportation is an important location of MVPA, especially among girls. The home-school journey was found to contribute a greater proportion of daily MVPA among girls compared to boys (36% vs. 31%) in one studyFootnote 41 while another found that girls engaged in more active transportation compared to boys (29% vs. 26%), which in turn contributed to a greater percent of total MVPA (55% vs. 35%).Footnote 39 Boys were found to obtain a greater proportion of their daily MVPA at schoolFootnote 39 and in schoolyards compared to girls.Footnote 42 Other studies found no sex differences in location of ST, light intensity PA or MVPA.Footnote 25Footnote 30Footnote 32Footnote 38Footnote 41
Location-based findings for youth (12-17 years)
The most commonly reported locations in youth were: homes; schools; recreational facilities; active transportation; and, green space. Many focussed exclusively on MVPA within the active transportation environment, specifically the commute to-and-from school.Footnote 47Footnote 55Footnote 59Footnote 60 Collins et al.Footnote 47 in their study of youth from England found that active commuting contributed to 35% of daily MVPA. Commuting distance appears to be a significant predictor of active transportation, with active commuters often living closer to the destination than passive commuters.Footnote 47Footnote 55Footnote 60
Roads and sidewalks are major sources of youth MVPA,Footnote 45Footnote 51Footnote 53 largely owing to their use for active transit.Footnote 49Footnote 56 A Canadian study found that urban youth accumulated the majority (56% for girls, 58% for boys) of their daily MVPA while commuting (largely to-and-from school); this was greater than for suburban and rural students.Footnote 56
Similar to children, the school environment is one of the greatest sources of MVPA among youth;Footnote 45Footnote 46Footnote 49Footnote 50Footnote 53Footnote 54Footnote 56 likely reflective of the location where they spend a substantial amount of their day. However, Carlson et al.Footnote 46 using data from the US-based TEAN Study, found that although most (55% on school days) MVPA was achieved at school, relative to the proportion of time spent at school, it was a low amount.
Contrary to findings for children, the home environment was found to be a large contributor of MVPA in several studies,Footnote 45Footnote 46Footnote 52 especially on non-school daysFootnote 46 and in suburban and rural compared to urban youth.Footnote 56 A couple of studies, however, noted that the home environment was less of a contributor.Footnote 49Footnote 53
Evidence around green space as a contributor of total MVPA is mixed. Results of the GAG Study in Scotland found that green space accounted for only 11% of leisure time MVPA.Footnote 48 Whereas, the When Cities Move Children (WCMC) Study in Denmark found urban green space was a major contributor of daily outdoor MVPA.Footnote 50 Lachowycz et al.Footnote 51 reported that green space and parks were responsible for 46% and 29% of all weekend outdoor MVPA, respectively.
Very few youth studies reported on locations for LPA and ST.Footnote 51Footnote 52Footnote 53 Similar to findings for children in this regard, indoor locations appear to be greater sources of LPAFootnote 51 and ST.Footnote 51Footnote 53
Few studies reported on sex analyses. Boys were found to achieve more MVPA outside compared to girls.Footnote 45 Studies have found that boys obtain more MVPA compared to girls at school,Footnote 45Footnote 46Footnote 49 in transportFootnote 49 and at home,Footnote 46 but that girls had more MVPA near school.Footnote 46 Rainham et al.Footnote 56 found sex differences in suburban and rural, but not urban youth. Suburban boys obtained more of their MVPA at home than suburban girls (30% vs. 20%). While suburban girls spent more of their MVPA time commuting compared to suburban boys (42.5% vs. 27.4%), rural girls spent less of their MVPA time commuting compared to rural boys (20.7% vs. 27.0%).Footnote 56 Collins et al.Footnote 47 found no sex differences in active commuting.
Location-based findings for adults (≥ 18 years)
The most commonly reported locations in adult studies were: home neighbourhood; home; outside home neighbourhood; parks; green space; active transportation; and, commercial destinations. Evidence suggests that among adults the active transportation environment is one of the greatest sources while the home environment is one of the least common locations of MVPA.
Several studies examined or reported exclusively on time spent in active transportation.Footnote 61Footnote 62Footnote 63Footnote 64Footnote 74 Commuting/active transportation accounted for between 33% and 68% of total daily MVPA.Footnote 61Footnote 63Footnote 74 Chaix et al.Footnote 63 found that in general transportation accounted for a median of 13% of ST, but public transportation trips were associated with significantly more ST compared to personalized motor vehicle trips. Costa et al.Footnote 64 found that the mode of transportation during a journey was related to the median proportion of time spent in ST, LPA and MVPA. Journey time spent in ST was highest in car- (59%) and bus-only (~41%) journeys, time spent in LPA was greatest among trips that used a combination of car (38%) or car and cycling or walking (~33-35%) or bus-only trips (~29%), and journey time spent in MVPA was greatest in walking- (100%) or cycling-only (~33% MPA + 56% VPA) trips. Approximately 20% of bus-only trip time was spent in MVPA.Footnote 64
Several studies examined time spent in the home environment.Footnote 65Footnote 68Footnote 69Footnote 74Footnote 75Footnote 78 The home environment appears to be associated with ST and LPA,Footnote 28Footnote 65Footnote 69 but not MVPA with most MVPA occurring outside of the home area,Footnote 69Footnote 74Footnote 75 especially on weekdays.Footnote 75 In contrast, the US-based System for Observing Play and Recreation in Communities (SOPARC) Study found that homes accounted for 20-29% of bout-based MVPA, whereas roads and fitness facilities were important locations for VPA.Footnote 68
The evidence around parks and green space was mixed, but generally identified that both locations are potential sources of MVPAFootnote 65 (though not necessarily substantial amountsFootnote 66Footnote 71) among adults, depending on whether they are actually used.Footnote 66Footnote 77 Data from the SOPARC study found that only 12% of time in parks was spent engaged in MVPAFootnote 66 and that this represented ~13% of total daily MVPA.Footnote 68
While few studies commented on the workplace environment, two found that the workplace and workplace neighbourhood were substantial contributors to MVPA, but much of this was likely owed to transportation to-and-from work and daily time spent at work.Footnote 71Footnote 74 Interestingly, Troped et al.Footnote 78 found most MVPA occurred outside of home and work buffers than within them.
Three studies conducted sex-specific analyses. Troped et al.Footnote 78 found no significant differences in the location of MVPA by sex. Hillsdon et al.Footnote 67 found that men accrued significantly more PA outside of the neighbourhood than women (64.7 % vs. 57.4%). Dewulf and colleaguesFootnote 65 found that among men, greater time spent in non-green areas was associated with more MVPA; the opposite was true in women.
Discussion
This rapid review examines and synthesizes the available literature around locations of PA and ST in children, youth and adults. Findings provide guidance for the design of future studies by understanding where individuals engage in PA and ST and areas of uncertain/weak evidence. Results can be used to support the current knowledge base around correlates and determinants of PA and ST and subsequently inform direction for new interventions by identifying environmental settings of importance.
Only one other review to date has looked at location-based studies. McGrath et al.Footnote 8 conducted a systematic review of objectively measured environmental features and MVPA in children and youth. They found that walking on local streets accounted for the greatest proportion of children and youth’s daily activity spent outdoors (~40%). They also found that a large proportion of PA occurred in non-green space/other urban areas (26-27%). Similar to our results, they found that streets, roads, car parks, hard surface play areas, pedestrian pathways and shopping areas contributed more to outdoor PA than green spaces, parks and other grassland areas.Footnote 8 Our results also underscore the importance of active transportation to-and-from schools and schoolyards as major contributors to daily PA levels in children and youth. Important to note, however, is that McGrath et al.Footnote 8 excluded studies which examined citywide data rather than that of neighbourhood areas or data that used school locations as proxies for residential neighbourhoods. Our review builds on this previous work by including: studies regardless of type of location; other intensities (LPA, ST); updated literature; and, adults.
Findings of the present review support and contrast previous systematic reviews looking at the correlates and determinants of PA. The evidence for associations between aspects of the built environment and PA has been mixed, but with the most consistent evidence derived from studies using objectively measured environments and domain-specific PA.Footnote 80 In children and youth, evidence suggests a positive association exists between access to recreation facilities, playgrounds/parks, measures of walkability (including sidewalks) and PA.Footnote 80Footnote 81 Findings from our review suggest that schoolyards and active transportation are substantial contributors to child/youth daily PA rather than parks, especially on weekdays. Similar to our findings, systematic review evidence suggests that distance to school is negatively associated with PA in children.Footnote 81
In adults, systematic review evidence suggests that in general, access to recreation facilities is positively associated with PA.Footnote 80Footnote 82Footnote 83 Only oneFootnote 68 of the location studies used in our review commented specifically on indoor recreation facilities (e.g., fitness centres, pools). There is mixed evidence on the association between sidewalks and PA.Footnote 82Footnote 83 Among adults, factors in the built environment are likely relevant to different domains of PA. For example, sidewalks may be integral to the active transportation environment or to the workplace environment. Similar to our findings, evidence also suggests that the transportation environment is a correlate and determinant of total PA in adults.Footnote 80
Much less previous work has examined the associations between factors in the built environment and ST.Footnote 9Footnote 84Footnote 85 In children, contrary to popular assumption, a higher playground density and availability of sports equipment in the school has been shown to be associated with greater ST,Footnote 85 whereas increasing the length of breaks at school and providing safe road crossings are associated with lower ST.Footnote 85 The studies in our review highlight the impact of the school environment on ST. For instance, most ST is recorded in the home and school environments,Footnote 23 emphasizing the importance of activity breaks in these environments and providing an opportunity for active transportation to-and-from school for regular MVPA. In adults, evidence suggests that proximity or density to green spaces is negatively associated with objectively measured sitting time.Footnote 84 Only one study in the present review looked at a measure of area ‘greenness’ and found that ST was higher in non-green areas compared to greener areas.Footnote 65 Mixed findings have been found around the association with neighbourhood walkability, walking/cycling infrastructure and recreation facilities and ST.Footnote 9Footnote 84 While the presence of active transportation supportive environments (e.g., lockers, bike storage, shower facilities) in the workplace have been shown to be positively associated with total objectively measured ST, they are also associated with greater levels of PA.Footnote 84 This finding suggests and supports the idea that interventions designed to increase PA may not always result in significant reductions of ST.Footnote 86
This review serves to provide direction for future location-based studies. Many of the studies did not employ a full-day perspective and instead reported on results related to specific locations. For example, many focussed exclusively on time spent in travel to-and-from school or work. In recognition of the importance of movement across the 24-hour spectrum, future studies should report on locations across all intensities of movement including LPA and ST. Future studies would also benefit from reporting results by sex to understand if girls/women and boys/men spend their time in different locations at different intensities.
Strengths and limitations
The strengths of this review include a comprehensive search strategy developed with two research librarians, an a priori established protocol and the assessment of risk of bias. The review also took a life-course approach by looking at the findings separately in children, youth and adults and reporting on sex differences where available. Unfortunately, none of the included studies reported on findings specifically in older adults. Given that many included this population in their overall sample, we encourage future researchers to report on this segment of the adult population separately.
One of the major limitations of the review is the heterogeneity of the studies and their reporting. There was little standardization of the nomenclature used to describe the locations and many studies did not report measures of variance, preventing the conduct of a meta-analysis; future studies would benefit from reporting both on daily minutes and proportion per location. We were also not able to distinguish whether home environment behaviours occurred inside or outside of the home. Nor were we able to discern the location characteristics (e.g., road, path, and sidewalk) for many studies that focussed on active transportation. As this is an important domain of PA, we felt it was important to include these studies under a general “active transportation” location. Other studies reported movement behaviours in locations often associated with active transportation (e.g., roads), but the purpose/domain of this activity was not distinguishable. There will always be a limitation with being too specific in these efforts as active transportation takes place over a heterogeneous set of street geographies. As an example, it might start on a quiet residential street, continue on a shared-use walk/bike path, move to a painted bike lane and finish on a dedicated bike lane. In this example, only 3 out of 4 components of the journey occurred on a “road”, and even then the types of roads differ. In our opinion, the key point is that PA occurred in the “travel” environment. Many of the studies were based on small and biased samples; there is a need for larger representative samples. Using GPS overlaid onto GIS helps to increase the accuracy of identifying locations of movement, but it is important to understand that the quality of GIS data can be variable and can ultimately introduce a source of measurement bias.Footnote 87 Findings from the literature have also identified that 12-14 days of monitoring are needed to provide reliable estimates of PA, and that time in the home or commercial environments require substantial monitoring times (> 19 days).Footnote 88Footnote 89 The majority of the included studies assessed movement over a 7-day period and many only required 4 days of valid data. Therefore, the findings may not be reliable. Future studies should consider the evidence around monitoring time requirements for reliable estimates. There was also substantial heterogeneity in the measures of activity and ST including the different devices, wear time requirements and cut-points used to define intensity. Finally, while GPS devices improve our understanding of the location of PA and ST, they also have their own limitations: there is the potential for large data loss due to signal drop outs, inadequate battery power and wear time adherence.Footnote 16 Many of the studies experienced substantial data loss.
Conclusion
In conclusion, this review provides a summary of the evidence around the locations where children, youth and adults obtain their ST, LPA and MVPA. There is limited evidence around the location of LPA and ST compared to MVPA. Evidence suggests that the active transportation environment is a potentially important contributor of MVPA across an individual’s lifespan. There is a need for future location-based studies to report on locations of all intensity of movement using a whole-day approach in larger more representative samples.
Acknowledgements
We would like to thank Katherine Merucci from the Public Health Agency of Canada (PHAC) Health Library and Nathalie Leclair from the Berkman Library at the University of Ottawa Heart Institute for their help with the search strategy development. We would also like to thank Alexandria Melvin for her assistance with data verification. Stephanie Prince is funded by a Canadian Institutes of Health Research – PHAC Health System Impact Fellowship.
Conflicts of interest
We declare that we have no conflicts of interest related to this work.
Authors’ contributions and statement
SAP was responsible for the conceptualization, design, acquisition, analysis, interpretation of the data, and drafting and revising of the paper. GPB, DPR and WT were responsible for the conceptualization, interpretation of the data, and revising of the paper.
The content and views expressed in this article are those of the authors and do not necessarily reflect those of the Government of Canada.
References
- Footnote 1
-
Warburton DE, Charlesworth S, Ivey A, et al. A systematic review of the evidence for Canada's Physical Activity Guidelines for Adults. Int J Behav Nutr Phys Act. 2010;7:39. doi: 10.1186/1479-5868-7-39.
- Footnote 2
-
Biswas A, Oh PI, Faulkner GE, et al. Sedentary time and its association with risk for disease incidence, mortality, and hospitalization in adults: a systematic review and meta-analysis. Ann Intern Med. 2015;162(2):123-132. doi: 10.7326/M14-1651.
- Footnote 3
-
Garriguet D, Carson V, Colley RC, et al. Physical activity and sedentary behaviour of Canadian children aged 3 to 5. Health Rep. 2016;27(9):14-23.
- Footnote 4
-
Colley RC, Garriguet D, Janssen I, et al. Physical activity of Canadian adults: accelerometer results from the 2007 to 2009 Canadian Health Measures Survey. Health Rep. 2011;22(1):7-14.
- Footnote 5
-
Colley RC, Carson V, Garriguet D, et al. Physical activity of Canadian children and youth, 2007 to 2015. Health Rep. 2017;28(10):8-16.
- Footnote 6
-
Caspersen CJ, Pereira MA, Curran KM. Changes in physical activity patterns in the United States, by sex and cross-sectional age. Med Sci Sport Exerc. 2000;32(9):1601-1609.
- Footnote 7
-
Bauman A, Bull F, Chey T, et al. The international prevalence study on physical activity: results from 20 countries. Int J Behav Nutr Phys Act. 2009;6(1):21. doi:10.1186/1479-5868-6-21.
- Footnote 8
-
McGrath LJ, Hopkins WG, Hinckson EA. Associations of objectively measured built-environment attributes with youth moderate-vigorous physical activity: a systematic review and meta-analysis. Sports Med. 2015;45(6):841-865. doi: 10.1007/s40279-015-0301-3.
- Footnote 9
-
Prince SA, Reed JL, McFetridge C, et al. Correlates of sedentary behaviour in adults: a systematic review. Obes Rev. 2017;18(8):915-935. doi: 10.1111/obr.12529.
- Footnote 10
-
Davison KK, Lawson CT. Do attributes in the physical environment influence children's physical activity? A review of the literature. Int J Behav Nutr Phys Act. 2006;3:19. doi: 10.1186/1479-5868-3-19.
- Footnote 11
-
Ding D, Sallis JF, Kerr J, et al. Neighborhood environment and physical activity among youth: a review. Am J Prev Med. 2011;41(4):442-455. doi: 10.1016/j.amepre.2011.06.036.
- Footnote 12
-
Ding D, Gebel K. Built environment, physical activity, and obesity: What have we learned from reviewing the literature? Health Place. 2012;18(1):100-105. doi: 10.1016/j.healthplace.2011.08.021.
- Footnote 13
-
Fitzhugh EC, Bassett Jr DR, Evans MF. Urban trails and physical activity: a natural experiment. Am J Prev Med. 2010;39(3):259-262.
- Footnote 14
-
Evenson KR, Jones SA, Holliday KM, et al. Park characteristics, use, and physical activity: A review of studies using SOPARC (System for Observing Play and Recreation in Communities). Prev Med. 2016;86:153-166.
- Footnote 15
-
Jankowska MM, Schipperijn J, Kerr J. A framework for using GPS data in physical activity and sedentary behavior studies. Exerc Sport Sci Rev. 2015;43(1):48-56. doi: 10.1249/JES.0000000000000035.
- Footnote 16
-
Krenn PJ, Titze S, Oja P, et al. Use of global positioning systems to study physical activity and the environment: a systematic review. Am J Prev Med. 2011;41(5):508-515. doi: 10.1016/j.amepre.2011.06.046.
- Footnote 17
-
Maddison R, Ni Mhurchu C. Global positioning system: A new opportunity in physical activity measurement. Int J Behav Nutr Phys Act. 2009;6:1479. doi: 10.1186/1479-5868-6-73.
- Footnote 18
-
Chaix B, Meline J, Duncan S, et al. GPS tracking in neighborhood and health studies: A step forward for environmental exposure assessment, a step backward for causal inference? Health Place. 2013;21:46-51. doi: 10.1016/j.healthplace.2013.01.003.
- Footnote 19
-
Organization for Economic Co-operation and Development. Members and partners [Internet]. 2017 [cited 2017 Oct 24]; Available from: http://www.oecd.org/about/membersandpartners/
- Footnote 20
-
Maddison R, Ni Mhurchu C. Global positioning system: a new opportunity in physical activity measurement. Int J Behav Nutr Phys Act. 2009;6:73. doi: 10.1186/1479-5868-6-73.
- Footnote 21
-
Poitras VJ, Gray CE, Borghese MM, et al. Systematic review of the relationships between objectively measured physical activity and health indicators in school-aged children and youth. Appl Physiol Nutr Metab. 2016;41(6 Suppl 3):S197-239. doi: 10.1139/apnm-2015-0663.
- Footnote 22
-
Almanza E, Jerrett M, Dunton G, et al. A study of community design, greenness, and physical activity in children using satellite, GPS and accelerometer data. Health Place. 2012;18(1):46-54. doi: 10.1016/j.healthplace.2011.09.003.
- Footnote 23
-
Burgi R, Tomatis L, Murer K, et al. Spatial physical activity patterns among primary school children living in neighbourhoods of varying socioeconomic status: a cross-sectional study using accelerometry and Global Positioning System. BMC Public Health. 2016;16:282. doi: 10.1186/s12889-016-2954-8.
- Footnote 24
-
Cerin E, Baranowski T, Barnett A, et al. Places where preschoolers are (in)active: an observational study on Latino preschoolers and their parents using objective measures. Int J Behav Nutr Phys Act. 2016;13:29. doi: 10.1186/s12966-016-0355-0.
- Footnote 25
-
Coombes E, van Sluijs E, Jones A. Is environmental setting associated with the intensity and duration of children's physical activity? Findings from the SPEEDY GPS study. Health Place. 2013;20:62-65. doi: 10.1016/j.healthplace.2012.11.008.
- Footnote 26
-
Cooper AR, Page AS, Wheeler BW, et al. Mapping the walk to school using accelerometry combined with a global positioning system. Am J Prev Med. 2010;38(2):178-183. doi: 10.1016/j.amepre.2009.10.036.
- Footnote 27
-
Dessing D, Pierik FH, Sterkenburg RP, et al. Schoolyard physical activity of 6-11 year old children assessed by GPS and accelerometry. Int J Behav Nutr Phys Act. 2013;10:97. doi: 10.1186/1479-5868-10-97.
- Footnote 28
-
Dunton GF, Liao Y, Almanza E, et al. Locations of joint physical activity in parent-child pairs based on accelerometer and GPS monitoring. Ann Behav Med. 2013;45:S162-S172. doi: 10.1007/s12160-012-9417-y.
- Footnote 29
-
Dunton GF, Almanza E, Jerrett M, et al. Neighborhood park use by children: Use of accelerometry and global positioning systems. Am J Prev Med. 2014;46(2):136-142. doi: 10.1016/j.amepre.2013.10.009.
- Footnote 30
-
Eyre E. Environmental influences on physical activity and weight status in children from deprived multi-ethnic backgrounds in Coventry [online PhD thesis]. Coventry (UK): Coventry University; 2014. Available from: https://curve.coventry.ac.uk/open/items/d2080789-8c3b-4775-a41f-d2dc2a2df687/1/
- Footnote 31
-
Jones AP, Coombes EG, Griffin SJ, et al. Environmental supportiveness for physical activity in English schoolchildren: A study using Global Positioning Systems. Int J Behav Nutr Phys Act. 2009. doi: 10.1186/1479-5868-6-42.
- Footnote 32
-
Lee C, Li L. Demographic, physical activity, and route characteristics related to school transportation: an exploratory study. Am J Health Promot. 2014;28(3 Supplement):S77-S88. doi: 10.4278/ajhp.130430-QUAN-211.
- Footnote 33
-
Mackett R, Brown B, Gong Y, et al. Children's independent movement in the local environment. Built Env. 2007;33(4):454-468.
- Footnote 34
-
McMinn D, Oreskovic NM, Aitkenhead MJ, et al. The physical environment and health-enhancing activity during the school commute: global positioning system, geographical information systems and accelerometry. Geospat Health. 2014;8(2):569-572. doi: 10.4081/gh.2014.46.
- Footnote 35
-
Moore HJ, Nixon CA, Lake AA, et al. The environment can explain differences in adolescents' daily physical activity levels living in a deprived urban area: cross-sectional study using accelerometry, GPS, and focus groups. J Phys Act Health. 2014;11(8):1517-1524. doi: 10.1123/jpah.2012-0420.
- Footnote 36
-
O'Connor TM, Cerin E, Robles J, et al. Feasibility study to objectively assess activity and location of Hispanic preschoolers: a short communication. Geospat Health. 2013;7(2):375-380. doi: 10.4081/gh.2013.94.
- Footnote 37
-
Oreskovic NM, Blossom J, Field AE, et al. Combining global positioning system and accelerometer data to determine the locations of physical activity in children. Geospat Health. 2012;6(2):263-272. doi: 10.4081/gh.2012.144.
- Footnote 38
-
Pearce M, Page AS, Griffin TP, et al. Who children spend time with after school: associations with objectively recorded indoor and outdoor physical activity. Int J Behav Nutr Phys Act. 2014;11(1):45. doi: 10.1186/1479-5868-11-45.
- Footnote 39
-
Pizarro AN, Schipperijn J, Ribeiro JC, et al. Gender differences in the domain-specific contributions to moderate-to-vigorous physical activity, accessed by GPS. J Phys Act Health 2017;14(6):474-478. doi: 10.1123/jpah.2016-0346.
- Footnote 40
-
Quigg R, Gray A, Reeder AI, et al. Using accelerometers and GPS units to identify the proportion of daily physical activity located in parks with playgrounds in New Zealand children. Prev Med. 2010;50(5-6):235-240. doi: 10.1016/j.ypmed.2010.02.002.
- Footnote 41
-
Southward EF, Page AS, Wheeler BW, et al. Contribution of the school journey to daily physical activity in children aged 11-12 years. Am J Prev Med. 2012;43(2):201-204. doi: 10.1016/j.amepre.2012.04.015.
- Footnote 42
-
Van Kann DH, de Vries SI, Schipperijn J, et al. Schoolyard characteristics, physical activity, and sedentary behavior: combining GPS and accelerometry. J Sch Health. 2016;86(12):913-921. doi: 10.1111/josh.12459.
- Footnote 43
-
Wheeler BW, Cooper AR, Page AS, et al. Greenspace and children's physical activity: a GPS/GIS analysis of the PEACH project. Prev Med 2010;51(2):148-152. doi: 10.1016/j.ypmed.2010.06.001.
- Footnote 44
-
Andersen HB, Christiansen LB, Klinker CD, et al. Increases in use and activity due to urban renewal: effect of a natural experiment. Am J Prev Med. 2017;53(3):e81-e87. doi: 10.1016/j.amepre.2017.03.010.
- Footnote 45
-
Burgi R, Tomatis L, Murer K, et al. Localization of physical activity in primary school children using accelerometry and global positioning system. PLoS ONE. 2015;10(11):e0142223. doi: 10.1371/journal.pone.0142223.
- Footnote 46
-
Carlson JA, Schipperijn J, Kerr J, et al. Locations of physical activity as assessed by GPS in young adolescents. Pediatrics. 2016;137(1):e20152430. doi: 10.1542/peds.2015-2430.
- Footnote 47
-
Collins P, Al-Nakeeb Y, Lyons M. Tracking the commute home from school utilizing GPS and heart rate monitoring: establishing the contribution to free-living physical activity. J Phys Act Health. 2015;12(2):155-162. doi: 10.1123/jpah.2013-0048.
- Footnote 48
-
Geyer J. Developing an understanding of greenspace as a resource for physical activity of adolescents in Scotland [online PhD thesis]. Edinburgh (UK): The University of Edinburgh; 2013. Available from: https://www.era.lib.ed.ac.uk/handle/1842/7917
- Footnote 49
-
Klinker CD, Schipperijn J, Christian H, et al. Using accelerometers and global positioning system devices to assess gender and age differences in children's school, transport, leisure and home based physical activity. Int J Behav Nutr Phys Act. 2014;11(1):8. doi: 10.1186/1479-5868-11-8.
- Footnote 50
-
Klinker CD, Schipperijn J, Kerr J, et al. Context-specific outdoor time and physical activity among school-children across gender and age: using accelerometers and GPS to advance methods. Front Public Health. 2014;2:20. doi: 10.3389/fpubh.2014.00020.
- Footnote 51
-
Lachowycz K, Jones AP, Page AS, et al. What can global positioning systems tell us about the contribution of different types of urban greenspace to children's physical activity? Health Place. 2012;18(3):586-594. doi: 10.1016/j.healthplace.2012.01.006.
- Footnote 52
-
Maddison R, Jiang Y, Vander Hoorn S, et al. Describing patterns of physical activity in adolescents using global positioning systems and accelerometry. Ped Exerc Sci. 2010;22(3):392-407.
- Footnote 53
-
Oreskovic NM, Perrin JM, Robinson AI, et al. Adolescents' use of the built environment for physical activity. BMC Public Health 2015;15:251. doi: 10.1186/s12889-015-1596-6.
- Footnote 54
-
Pearce M. Combining measurement tools to understand the context of children's indoor and outdoor leisure-time physical activity [online PhD thesis]. Edinburgh (UK): The University of Edinburgh; 2015. Available from: https://www.era.lib.ed.ac.uk/handle/1842/20408
- Footnote 55
-
Pizarro AN, Schipperijn J, Andersen HB, et al. Active commuting to school in Portuguese adolescents: Using PALMS to detect trips. J Transport Health. 2016;3(3):297-304. doi: 10.1016/j.jth.2016.02.004.
- Footnote 56
-
Rainham DG, Bates CJ, Blanchard CM, et al. Spatial classification of youth physical activity patterns. Am J Prev Med. 2012;42(5):e87-e96. doi: 10.1016/j.amepre.2012.02.011.
- Footnote 57
-
Robinson AI, Oreskovic NM. Comparing self-identified and census-defined neighborhoods among adolescents using GPS and accelerometer. Int J Health Geo. 2013;12:57. doi: 10.1186/1476-072X-12-57.
- Footnote 58
-
Rodriguez DA, Cho G, Evenson KR, et al. Out and about: association of the built environment with physical activity behaviors of adolescent females. Health Place. 2012;18(1):55-62. doi: 10.1016/j.healthplace.2011.08.020.
- Footnote 59
-
Voss C, Winters M, Frazer AD, et al. They go straight home - don't they? Using global positioning systems to assess adolescent school-travel patterns. J Transport Health. 2014;1(4):282-287. doi: 10.1016/j.jth.2014.09.013.
- Footnote 60
-
Voss C, Winters M, Frazer A, et al. School-travel by public transit: Rethinking active transportation. Prev Med Rep. 2015;2:65-70. doi: 10.1016/j.pmedr.2015.01.004.
- Footnote 61
-
Audrey S, Procter S, Cooper AR. The contribution of walking to work to adult physical activity levels: a cross sectional study. Int J Behav Nutr Phys Act. 2014;11(1):37. doi: 10.1186/1479-5868-11-37.
- Footnote 62
-
Chaix B, Kestens Y, Duncan DT, et al. A GPS-based methodology to analyze environment-health associations at the trip level: case-crossover analyses of built environments and walking. Am J Epidemiol. 2016;184(8):579-589. doi: 10.1093/aje/kww071.
- Footnote 63
-
Chaix B, Kestens Y, Duncan S, et al. Active transportation and public transportation use to achieve physical activity recommendations? A combined GPS, accelerometer, and mobility survey study. Int J Behav Nutr Phys Act. 2014;11(1):124. doi: 10.1186/s12966-014-0124-x.
- Footnote 64
-
Costa S, Ogilvie D, Dalton A, et al. Quantifying the physical activity energy expenditure of commuters using a combination of global positioning system and combined heart rate and movement sensors. Prev Med. 2015;81:339-344. doi: 10.1016/j.ypmed.2015.09.022.
- Footnote 65
-
Dewulf B, Neutens T, Van Dyck D, et al. Associations between time spent in green areas and physical activity among late middle-aged adults. Geospatial Health. 2016;11(3):411. doi: 10.4081/gh.2016.411.
- Footnote 66
-
Evenson KR, Wen F, Hillier A, et al. Assessing the contribution of parks to physical activity using global positioning system and accelerometry. Med Sci Sports Exerc. 2013;45(10):1981-1987. doi: 10.1249/MSS.0b013e318293330e.
- Footnote 67
-
Hillsdon M, Coombes E, Griew P, et al. An assessment of the relevance of the home neighbourhood for understanding environmental influences on physical activity: How far from home do people roam? Int J Behav Nutr Phys Act. 2015;12(1):100. doi: 10.1186/s12966-015-0260-y.
- Footnote 68
-
Holliday KM, Howard AG, Emch M, et al. Where are adults active? An examination of physical activity locations using GPS in five US cities. J Urban Health. 2017;94(4):459-469.
- Footnote 69
-
Hurvitz PM, Moudon AV, Kang B, et al. How far from home? The locations of physical activity in an urban U.S. setting. Prev Med. 2014;69:181-186. doi: 10.1007/s11524-017-0164-z.
- Footnote 70
-
Hwang LD, Hurvitz PM, Duncan GE. Cross sectional association between spatially measured walking bouts and neighborhood walkability. Int J Environ Res Public Health. 2016;13(4):412. doi: 10.3390/ijerph13040412.
- Footnote 71
-
Jansen M, Ettema D, Pierik F, et al. Sports facilities, shopping centers or homes: What locations are important for adults' physical activity? A cross-sectional study. Int J Environ Res Public Health. 2016;13(3): 287. doi: 10.3390/ijerph13030287.
- Footnote 72
-
Jansen FM, Ettema DF, Kamphuis CBM, et al. How do type and size of natural environments relate to physical activity behavior? Health Place. 2017;46:73-81. doi: 10.1016/j.healthplace.2017.05.005.
- Footnote 73
-
Perez LG, Carlson J, Slymen DJ, et al. Does the social environment moderate associations of the built environment with Latinas' objectively-measured neighborhood outdoor physical activity. Prev Med Rep. 2016;4:551-557. doi: 10.1016/j.pmedr.2016.10.006.
- Footnote 74
-
Rafferty D, Dolan C, Granat M. Attending a workplace: its contribution to volume and intensity of physical activity. Physiol Meas. 2016;37(12):2144-2153.
- Footnote 75
-
Ramulu PY, Chan ES, Loyd TL, et al. Comparison of home and away-from-home physical activity using accelerometers and cellular network-based tracking devices. J Phys Act Health. 2012;9(6):809-817.
- Footnote 76
-
Rodriguez DA, Brown AL, Troped PJ. Portable global positioning units to complement accelerometry-based physical activity monitors. Med Sci Sports Exerc. 2005;37(11 SUPPL):S572-S581.
- Footnote 77
-
Stewart OT, Moudon AV, Fesinmeyer MD, et al. The association between park visitation and physical activity measured with accelerometer, GPS, and travel diary. Health Place. 2016;38:82-88. doi: 10.1016/j.healthplace.2016.01.004.
- Footnote 78
-
Troped PJ, Wilson JS, Matthews CE, et al. The built environment and location-based physical activity. Am J Prev Med. 2010;38(4):429-438. doi: 10.1016/j.amepre.2009.12.032.
- Footnote 79
-
Zenk SN, Schulz AJ, Matthews SA, et al. Activity space environment and dietary and physical activity behaviors: A pilot study. Health Place. 2011;17(5):1150-1161. doi: 10.1016/j.healthplace.2011.05.001.
- Footnote 80
-
Bauman AE, Reis RS, Sallis JF, et al. Correlates of physical activity: why are some people physically active and others not. Lancet. 2012;380(9838):258-271. doi: 10.1016/S0140-6736(12)60735-1.
- Footnote 81
-
Sterdt E, Liersch S, Walter U. Correlates of physical activity of children and adolescents: A systematic review of reviews. Health Educ J. 2014;73(1):72-89. doi: 10.1177/0017896912469578.
- Footnote 82
-
Choi J, Lee M, Lee JK, et al. Correlates associated with participation in physical activity among adults: a systematic review of reviews and update. BMC Public Health. 2017;17(356). doi: 10.1186/s12889-017-4255-2.
- Footnote 83
-
Trost SG, Owen N, Bauman AE, et al. Correlates of adults' participation in physical activity: review and update. Med Sci Sports Exerc. 2002;34(12):1996-2001. doi: 10.1249/01.MSS.0000038974.76900.92.
- Footnote 84
-
O'Donoghue G, Perchoux C, Mensah K, et al. A systematic review of correlates of sedentary behaviour in adults aged 18-65 years: a socio-ecological approach. BMC Public Health. 2016;16:163-016-2841-3. doi: 10.1186/s12889-016-2841-3.
- Footnote 85
-
Stierlin AS, De Lepeleere S, Cardon G, et al. A systematic review of determinants of sedentary behaviour in youth: a DEDIPAC-study. Int J Behav Nutr Phys Act. 2015;12:133. doi: 10.1186/s12966-015-0291-4.
- Footnote 86
-
Prince SA, Saunders TJ, Gresty K, et al. A comparison of the effectiveness of physical activity and sedentary behaviour interventions in reducing sedentary time in adults: a systematic review and meta-analysis of controlled trials. Obes Rev. 2014;15(11):905-919. doi: 10.1111/obr.12215.
- Footnote 87
-
Porter DE, Kirtland KA, Williams JE, et al. Considerations for using a geographic information system to assess environmental supports for physical activity. Prev Chron Dis. 2004;1(4):A20.
- Footnote 88
-
Holliday KM, Howard AG, Emch M, et al. Deriving a GPS monitoring time recommendation for physical activity studies of adults. Med Sci Sports Exerc. 2017;49(5):939-947. doi: 10.1249/MSS.0000000000001190.
- Footnote 89
-
Zenk SN, Matthews SA, Kraft AN, et al. How many days of global positioning system (GPS) monitoring do you need to measure activity space environments in health research? Health Place. 2018;51:52-60. doi: 10.1016/j.healthplace.2018.02.004.