
Original quantitative research – Validation of Canproj for projecting Canadian cancer incidence data
Health Promotion and Chronic Disease Prevention in Canada
Alain Demers, PhDAuthor reference footnote 1; Zhenguo Qiu, PhDAuthor reference footnote 2; Ron Dewar, MScAuthor reference footnote 3; Amanda Shaw, MScAuthor reference footnote 1
https://doi.org/10.24095/hpcdp.40.9.02
This article has been peer reviewed.
Correspondence: Alain Demers, Public Health Agency of Canada, 785 Carling Avenue (603A1), Ottawa, ON K1A 0K9; Tel: 613-797-2129; Email: alain.demers@canada.ca
Abstract
Introduction: Cancer projections can provide key information to help prioritize cancer control strategies, allocate resources and evaluate current treatments and interventions. Canproj is a cancer-projection tool that builds on the Nordpred R-package by adding a selection of projection models. The objective of this project was to validate the Canproj R-package for the short-term projection of cancer rates.
Methods: We used national cancer incidence data from 1986 to 2014 from the National Cancer Incidence Reporting System and Canadian Cancer Registry. Cross-validation was used to estimate the accuracy of the projections generated by Canproj and relative bias (RB) was used as validation measure. The Canproj automatic model selection decision tree was also assessed.
Results: Five of the six models had mean RB between 5% and 10% and median RB around 5%. For some of the cancer sites that were more difficult to project, a shorter time period improved reliability. The Nordpred model was selected 79% of the time by Canproj automatic model selection although it had the smallest RB only 24% of the time.
Conclusions: The Canproj package was able to provide projections that closely matched the real data for most cancer sites.
Keywords: neoplasms, forecasting, validation studies
Highlights
- The range of models Canproj offers allows for making reliable projections for most cancer sites.
- When there were variations in incidence rates, a recent, shorter time period could be used as the projection base to improve the accuracy of the projected incidence rates.
- For the national dataset, the Nordpred model was the one most often selected by the Canproj decision tree.
- Nordpred was the model with the smallest relative bias (RB) 24% of the time, nevertheless it was selected by Canproj decision tree 79% of the time.
Introduction
For the past 30 years, the Canadian Cancer Society and the Government of Canada (Public Health Agency of Canada and Statistics Canada) have published an annual comprehensive report, Canadian Cancer Statistics (CCS). The report includes a series of population cancer incidence and mortality counts and rate projections that fill the gap between the latest available year of data and the year the report is released. These projections are a planning and prioritizing resource for stakeholders; they also keep the Canadian population informed on the considerable burden of cancer.
A few projection models have been used over the years to produce the CCS. The Poisson regressionFootnote 1 used from 2003 to 2012 changed to Nordpred in 2011/2012. Nordpred, an R-package that was developed in Norway, makes available one single projection model, the age–period–cohort (APC) model with a drift component.Footnote 2 Nordpred is a well-studied package that has been shown to improve the reliability of cancer projections.Footnote 3Footnote 4Footnote 5Footnote 6Footnote 7
In an effort to further cancer projections, Qiu et al. developed Canproj, which is also an R-package.Footnote 8 Canproj has three key advantages over Nordpred: 1) replacement of the Poisson distribution by the negative-binomial distribution when over-dispersion is present; 2) inclusion of an age–cohort model; and 3) a set of hybrid models that combine the strengths of Poisson or negative-binomial regression, the segmented regression method,Footnote 9 and an average method for projections based on age-specific counts. Some of the features of Canproj were used for the 2017 CCSFootnote 10 while the full package was utilized for the 2019 CCS.
Canproj is a relatively new cancer-projection tool that has neither been extensively used nor validated.Footnote 11Footnote 12 The objective of our project was to validate the national short-term (up to 5 years) cancer incidence projections generated by the Canproj package using Canadian data. Specifically, we compared the outputs of the Canproj projection models to actual data using the holdout cross-validation methodFootnote 13 and graphical representation. We also evaluated the automatic model selection features of Canproj (decision trees) to assess the capacity of these functions to select the best model.
Methods
Data
Cancer incidence data from 1986 to 2014 from the National Cancer Incidence Reporting System (NCIRS) and Canadian Cancer Registry (CCR) were used for the analysis.Footnote 14 Data from the province of Quebec were not included since the provincial cancer registry has not submitted new data to the CCR since 2010. The data file used the International Agency for Research on Cancer’s international rules for multiple primary cancers.Footnote 15 Results were tabulated for all cancers combined, by cancer site (the same cancer sites as those included in the CCS annual reports) and sex.Footnote 10 A dataset was created for each combination of sex (n = 2) and cancer type (19 common to males and females plus five sex-specific types: cervix, ovary, uterus, prostate and testis). Datasets contained information by years from 1986 to 2014 and eighteen 5-year age groups (0–4, 5–9, …, 85+). Annual population estimates by geography, age and sex were provided by Statistics Canada with post-censal population estimates based on the 2016 Canadian census.Footnote 16 Inter- and post-censal estimates were adjusted by Statistics Canada for net under-coverage. Rates were age standardized using the direct method and the 2011 Canada population.Footnote 17
Canproj
The Canproj R-package contains several models used to project cancer incidence or mortality data. These include the Nordpred model, which incorporates age, drift, period and cohort effects; the age–cohort model; three hybrid models that incorporate age and potentially period effects (age-specific or all ages); and the 5-year average model (Table 1).Footnote 18
Table 1. Models available in the Canproj R-package and variables included in the models
| ModelFootnote a of Table 1 | Model variables | |||
|---|---|---|---|---|
| Age | Period | Cohort | Drift | |
| Nordpred | Footnote ✓ of Table 1 | Footnote ✓ of Table 1 | Footnote ✓ of Table 1 | Footnote ✓ of Table 1 |
| Age-cohort | Footnote ✓ of Table 1 | Footnote – of Table 1 | Footnote ✓ of Table 1 | Footnote – of Table 1 |
| Hybrid age-specific trendFootnote b of Table 1 | Footnote ✓ of Table 1 | Footnote ✓ of Table 1 | Footnote – of Table 1 | Footnote – of Table 1 |
| Hybrid age-common trendFootnote c of Table 1 | Footnote ✓ of Table 1 | Footnote ✓ of Table 1 | Footnote – of Table 1 | Footnote – of Table 1 |
| Hybrid age only (average)Footnote d of Table 1 | Footnote ✓ of Table 1 | Footnote – of Table 1 | Footnote – of Table 1 | Footnote – of Table 1 |
| 5-year averageFootnote e of Table 1 | Footnote ✓ of Table 1 | Footnote – of Table 1 | Footnote – of Table 1 | Footnote – of Table 1 |
The Canproj package uses two decision trees to determine which model is the most appropriate based on the significance of the variables. Alternatively, models can be selected individually. At first, Canproj considers four variables, namely age, period, cohort and a drift parameter; this is the most complex model, and these are the variables Nordpred uses. Canproj first determines if the cohort variable is significant. If it is significant, Canproj determines if the drift parameter is significant. If the cohort variable and the drift parameter are both significant, Canproj selects the Nordpred model to make the projections. If the cohort variable is significant but the drift parameter is not, Canproj selects the age–cohort model.
If the cohort effect is not significant, Canproj selects one of the hybrid models. If the number of cases is too small to run a regression model, a 5-year average is calculated. If the number of cases is big enough, Canproj will fit two models: an “age-common trend” model and an “age-specific trend” model. If the age-specific trend model has a better fit, then this model is selected. If not, the age-common trend model is selected. The slope of the common trend variable is then tested to determine if it differs from zero. If it is not different, then only the age variable is used in the model; if it is, the age + common trend model is used.
Validation
Cross-validation was used to estimate the accuracy of the Canproj-generated projections by using a subset of the data (the training data) and validating the results on the other subset (the independent testing data). This study used the holdout methodFootnote 13 to create the training and the independent testing datasets. Data from 1986 to 2010 (five 5-year periods) were used as the training data, and data from 2011 to 2014 (the last 4 years of data) were used as the independent testing data. The predictions from the training model and the actual data from the last 4 years were compared to evaluate the accuracy of the projection models.
The validation measure we used, the relative bias (RB), compares the expected value generated by the projection models to the observed values in the testing dataset for diagnosis years 2011 to 2014. The RB measures the relative difference in percentage between the expected (or projected) value (E) and the observed value (O).
, where t = 2011 to 2014
In our case, the “value” investigated is the age-standardized rate.
The RBs were summarized by projection model, cancer type and sex.
We compared the mean and median RBs by model, cancer type and sex over the 4-year projected (testing) period. Median RB indicates the typical performance of a model, whereas mean RB (due to its sensitivity to extreme values) helps reveal models that are typically accurate but occasionally very inaccurate.
Joinpoint analyses
We used Joinpoint Trend Analysis Software version 4.5.0.1 (National Cancer Institute, Bethesda, MD, USA)Footnote 19 to calculate trends in Canadian cancer incidence by type and sex between 1986 and 2010. Joinpoint model estimates were used to calculate the 1986 to 2010 RBs. This measure gives an estimate of the variability of the training data, which we compared to the RB measured on the projected data. The maximum number of joinpoints was set to 4; the minimum number of observations from a joinpoint to either end of the data was set to 3; and the minimum number of observations between two joinpoints was set to 4. Otherwise, the default joinpoint parameters were used. The log-transformed age-standardized rates and associated standard errors input into joinpoint were calculated in statistical package SAS version 9.3 (SAS Institute Inc., Cary, NC, USA). Canproj was run using R version 3.5.1 (R Foundation for Statistical Computing, Vienna, Austria) and RStudio version 1.1.453 (RStudio Inc., Boston, MA, USA).
Performance indicators
Two indicators were used to highlight which models would likely project rates less reliably. The first was the identification of a joinpoint over the most recent 10-year period in the data used to train the projection models (2001–2010). Recent changes in the trend could indicate that the models will have more difficulty performing reliable projections. We divided the joinpoints between those that happened between 10 to 6 years before the last year of training data available and those that happened 5 to 3 years before the last year of data. Joinpoints were not allowed to occur between 0 and 3 years. In Table 2, yellow cells indicate joinpoints that happened between 2001 and 2005 and orange cells indicate those that happened between 2006 and 2008.
Table 2. 2011–2014 median relative bias (%) by model and cancer type
| Sex | Cancer type | Model | Diagnostic | |||||||
|---|---|---|---|---|---|---|---|---|---|---|
| Nordpred | Age–cohort | Hybrid | 5-year average | JPFootnote b of Table 2 | RB ratioFootnote e of Table 2 | RB (%) | ||||
| Age-specific trend | Age-common trend | Age only | ||||||||
| Male | All cancers | 11.0 | 10.1 | 5.9 | 5.6Footnote a of Table 2 | 7.8 | 7.5 | 2007Footnote d of Table 2 | 5.7Footnote g of Table 2 | 1.0 |
| Oral | 8.8 | 13.4 | 14.8 | 12.7 | 1.0Footnote a of Table 2 | 6.3 | 2003Footnote c of Table 2 | 0.7 | 1.3 | |
| Esophagus | 2.6 | 2.2Footnote a of Table 2 | 3.0 | 2.7 | 5.9 | 2.2 | 2005Footnote c of Table 2 | 0.8 | 2.8 | |
| Stomach | 3.1Footnote a of Table 2 | 3.8 | 3.9 | 3.9 | 25.2 | 8.5 | 1986 | 1.6 | 1.9 | |
| Colorectal | 7.4 | 7.7 | 6.4Footnote a of Table 2 | 8.1 | 10.2 | 7.8 | 2008Footnote d of Table 2 | 16.0Footnote g of Table 2 | 0.4 | |
| Liver | 4.4 | 4.2 | 4.8 | 3.9Footnote a of Table 2 | 26.2 | 10.0 | 1986 | 1.0 | 4.0 | |
| Pancreas | 3.0Footnote a of Table 2 | 6.9 | 6.5 | 5.4 | 3.1 | 3.5 | 1997 | 2.3Footnote f of Table 2 | 1.3 | |
| Larynx | 1.4Footnote a of Table 2 | 3.6 | 2.4 | 2.0 | 44.0 | 18.2 | 1986 | 0.6 | 2.4 | |
| Lung and bronchus | 3.1 | 1.8 | 1.9 | 1.7Footnote a of Table 2 | 30.2 | 11.1 | 1986 | 1.3 | 1.3 | |
| Melanoma | 1.4Footnote a of Table 2 | 6.1 | 1.5 | 4.6 | 17.6 | 8.3 | 1986 | 0.7 | 2.0 | |
| Breast | 4.9 | 4.3Footnote a of Table 2 | 6.3 | 6.0 | 6.6 | 6.7 | 1986 | 0.6 | 6.9 | |
| Prostate | 48.4 | 90.1 | 41.4 | 44.4 | 33.8 | 33.1Footnote a of Table 2 | 2001Footnote c of Table 2 | 11.2Footnote g of Table 2 | 2.9 | |
| Testis | 1.4 | 1.4 | 1.3 | 1.3Footnote a of Table 2 | 13.9 | 7.2 | 1986 | 0.3 | 4.4 | |
| Urinary bladder | 10.1 | 15.9 | 12.4 | 14.7 | 9.8 | 9.3Footnote a of Table 2 | 1990 | 3.5Footnote f of Table 2 | 2.7 | |
| Kidney and renal pelvis | 5.0 | 2.8 | 2.0 | 2.0Footnote a of Table 2 | 9.1 | 4.8 | 1998 | 1.0 | 1.9 | |
| Brain/CNS | 4.1 | 2.9Footnote a of Table 2 | 4.3 | 3.4 | 7.7 | 5.6 | 1986 | 1.5 | 2.0 | |
| Thyroid | 3.7Footnote a of Table 2 | 17.0 | 13.0 | 13.0 | 48.9 | 27.4 | 1997 | 0.8 | 4.6 | |
| Hodgkin lymphoma | 1.4 | 1.4 | 2.1 | 1.6 | 3.4 | 1.3Footnote a of Table 2 | 1986 | 0.5 | 2.6 | |
| Non-Hodgkin lymphoma | 7.7 | 7.4 | 6.6Footnote a of Table 2 | 7.3 | 8.5 | 7.8 | 2007Footnote d of Table 2 | 4.4Footnote f of Table 2 | 1.5 | |
| Myeloma | 5.2 | 4.7 | 5.1 | 4.6Footnote a of Table 2 | 10.0 | 6.8 | 1986 | 1.3 | 3.6 | |
| Leukemia | 6.2 | 3.8 | 6.1 | 5.2 | 0.8Footnote a of Table 2 | 3.5 | 1994 | 0.4 | 2.0 | |
| All others | 4.0 | 4.1 | 2.8 | 2.8Footnote a of Table 2 | 4.5 | 3.6 | 2003Footnote c of Table 2 | 2.1Footnote f of Table 2 | 1.3 | |
| Female | All cancers | 0.9 | 0.8Footnote a of Table 2 | 0.8 | 0.8 | 3.3 | 0.9 | 1986 | 1.0 | 0.8 |
| Oral | 3.1 | 4.2 | 4.2 | 4.2 | 1.7Footnote a of Table 2 | 2.8 | 1986 | 0.6 | 2.9 | |
| Esophagus | 1.1 | 1.1 | 1.5 | 0.9Footnote a of Table 2 | 6.8 | 1.3 | 1986 | 0.3 | 3.4 | |
| Stomach | 1.3Footnote a of Table 2 | 2.7 | 7.2 | 4.4 | 20.5 | 3.5 | 1992 | 0.6 | 2.0 | |
| Colorectal | 4.0 | 3.7 | 2.7Footnote a of Table 2 | 4.2 | 8.3 | 4.9 | 2000 | 5.5Footnote g of Table 2 | 0.5 | |
| Liver | 5.3 | 4.8 | 5.1 | 4.4Footnote a of Table 2 | 21.2 | 8.9 | 1986 | 0.7 | 6.4 | |
| Pancreas | 4.3 | 5.1 | 5.5 | 4.9 | 3.5Footnote a of Table 2 | 4.2 | 1986 | 1.4 | 2.5 | |
| Larynx | 10.0Footnote a of Table 2 | 13.6 | 17.3 | 15.1 | 64.1 | 28.5 | 1986 | 1.8 | 5.5 | |
| Lung and bronchus | 1.3 | 1.3Footnote a of Table 2 | 9.0 | 4.9 | 3.9 | 1.9 | 2006Footnote d of Table 2 | 2.1Footnote f of Table 2 | 0.6 | |
| Melanoma | 2.8Footnote a of Table 2 | 8.4 | 3.5 | 3.4 | 16.3 | 9.3 | 1992 | 1.4 | 2.0 | |
| Breast | 2.3 | 3.2 | 0.7Footnote a of Table 2 | 1.3 | 1.9 | 1.6 | 1991 | 0.4 | 1.9 | |
| Cervix uteri | 3.4 | 4.7 | 1.4Footnote a of Table 2 | 1.4 | 22.3 | 8.6 | 2006Footnote d of Table 2 | 0.7 | 2.1 | |
| Uterus | 3.1 | 8.0 | 3.4 | 2.6Footnote a of Table 2 | 10.0 | 10.0 | 2005Footnote c of Table 2 | 1.8 | 1.5 | |
| Ovary | 1.1 | 1.1Footnote a of Table 2 | 1.2 | 1.7 | 9.9 | 4.7 | 1986 | 0.6 | 1.7 | |
| Urinary bladder | 14.1 | 14.2 | 13.1 | 14.5 | 10.1 | 9.7Footnote a of Table 2 | 1986 | 3.1Footnote f of Table 2 | 3.1 | |
| Kidney and renal pelvis | 12.0 | 4.3 | 4.6 | 4.3 | 6.1 | 4.2Footnote a of Table 2 | 1986 | 1.8 | 2.4 | |
| Brain/CNS | 5.6 | 5.3Footnote a of Table 2 | 5.7 | 5.5 | 8.8 | 6.2 | 1986 | 2.2Footnote f of Table 2 | 2.4 | |
| Thyroid | 4.5Footnote a of Table 2 | 6.3 | 5.4 | 5.9 | 50.1 | 21.7 | 2005Footnote c of Table 2 | 2.7Footnote f of Table 2 | 1.7 | |
| Hodgkin lymphoma | 10.3 | 10.9 | 12.2 | 11.6 | 8.0Footnote a of Table 2 | 10.4 | 1986 | 2.4Footnote f of Table 2 | 3.4 | |
| Non-Hodgkin lymphoma | 5.3 | 4.9 | 4.4Footnote a of Table 2 | 4.9 | 5.8 | 6.0 | 1997 | 3.9Footnote f of Table 2 | 1.1 | |
| Myeloma | 3.8Footnote a of Table 2 | 4.1 | 3.9 | 3.9 | 6.8 | 4.2 | 1986 | 1.0 | 3.7 | |
| Leukemia | 14.3 | 5.0 | 4.7 | 6.8 | 2.6Footnote a of Table 2 | 4.8 | 2001Footnote c of Table 2 | 1.5 | 1.7 | |
| All others | 3.1 | 4.2 | 3.6 | 4.1 | 3.0Footnote a of Table 2 | 3.1 | 2004Footnote c of Table 2 | 3.5Footnote f of Table 2 | 0.8 | |
For the second indicator, we used the RB ratio, which is the ratio of RB from 1986 to 2010 to the RB for the 2011–2014 period. We considered that the bias from the projected rates should be at least equal to or greater than the bias in the rates that were used to build the projection models. To obtain the 1986 to 2010 RB, we used the output of the joinpoint analysis. In Table 2, if the 2011–2014 RB was 2 to 5 times higher than the 1986–2010 RB, table cells are in yellow; if the 2011–2014 RB was more than 5 times higher than the 1986–2010 RB, the cells are in orange. These cutoffs were arbitrarily determined after looking at the distribution of the results.
Results
Canproj models
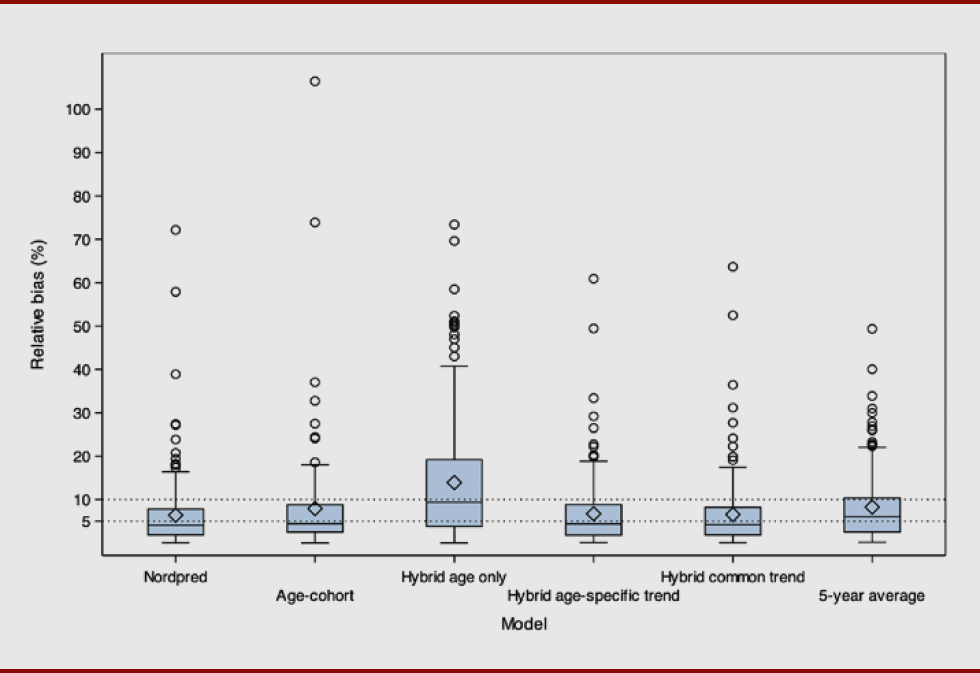
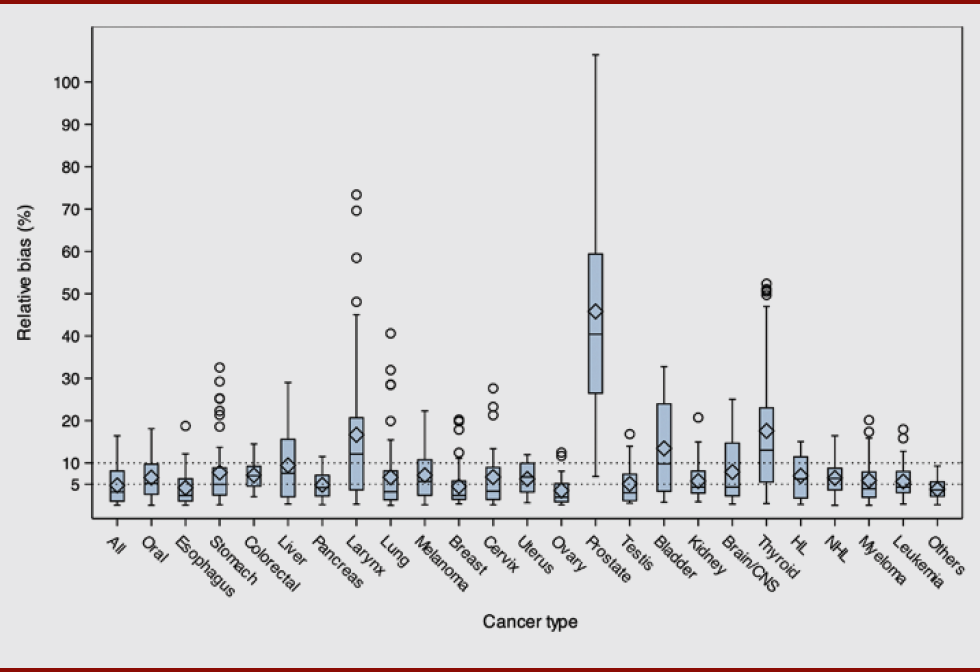
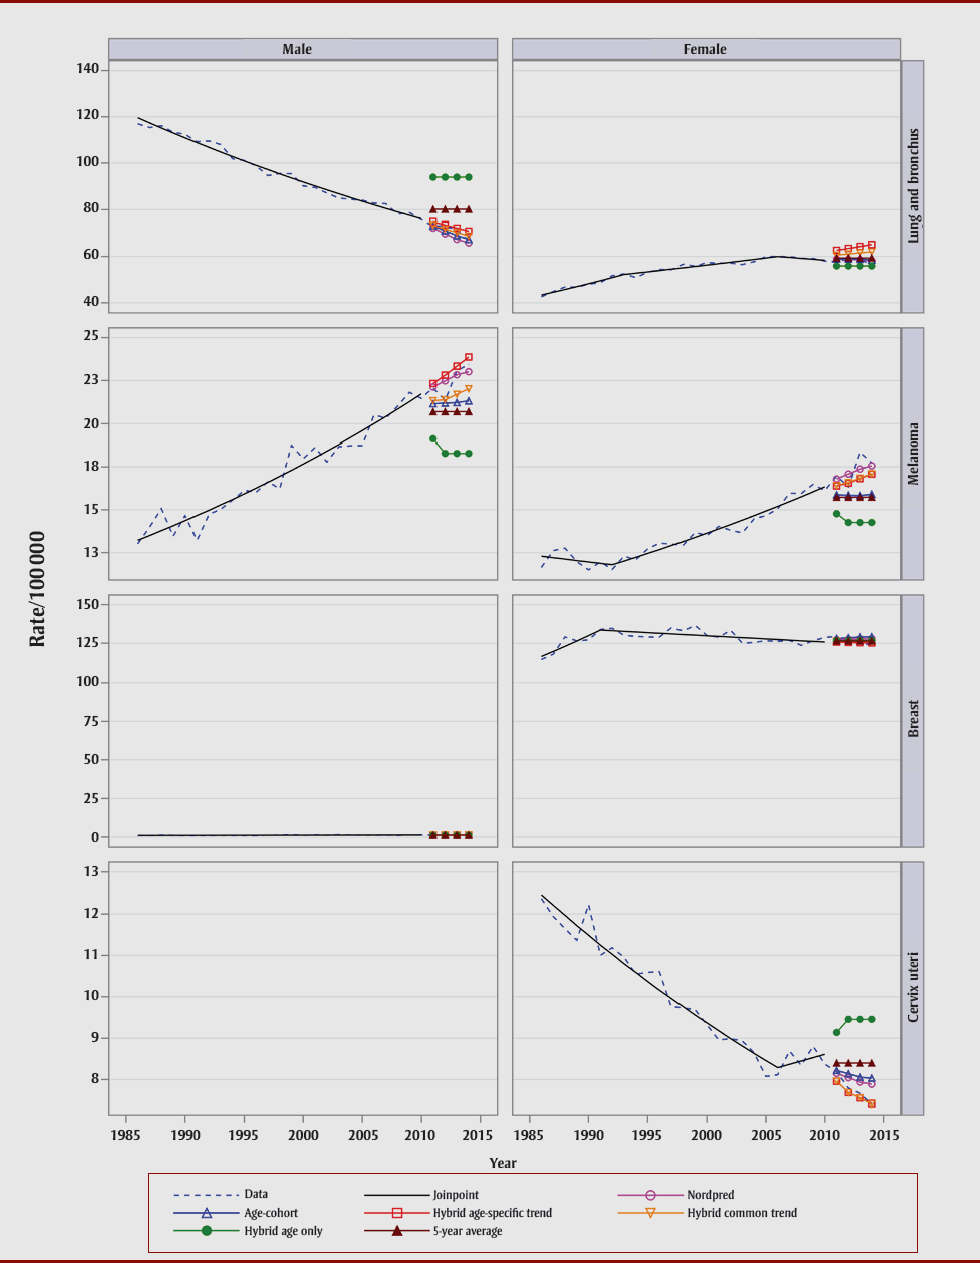
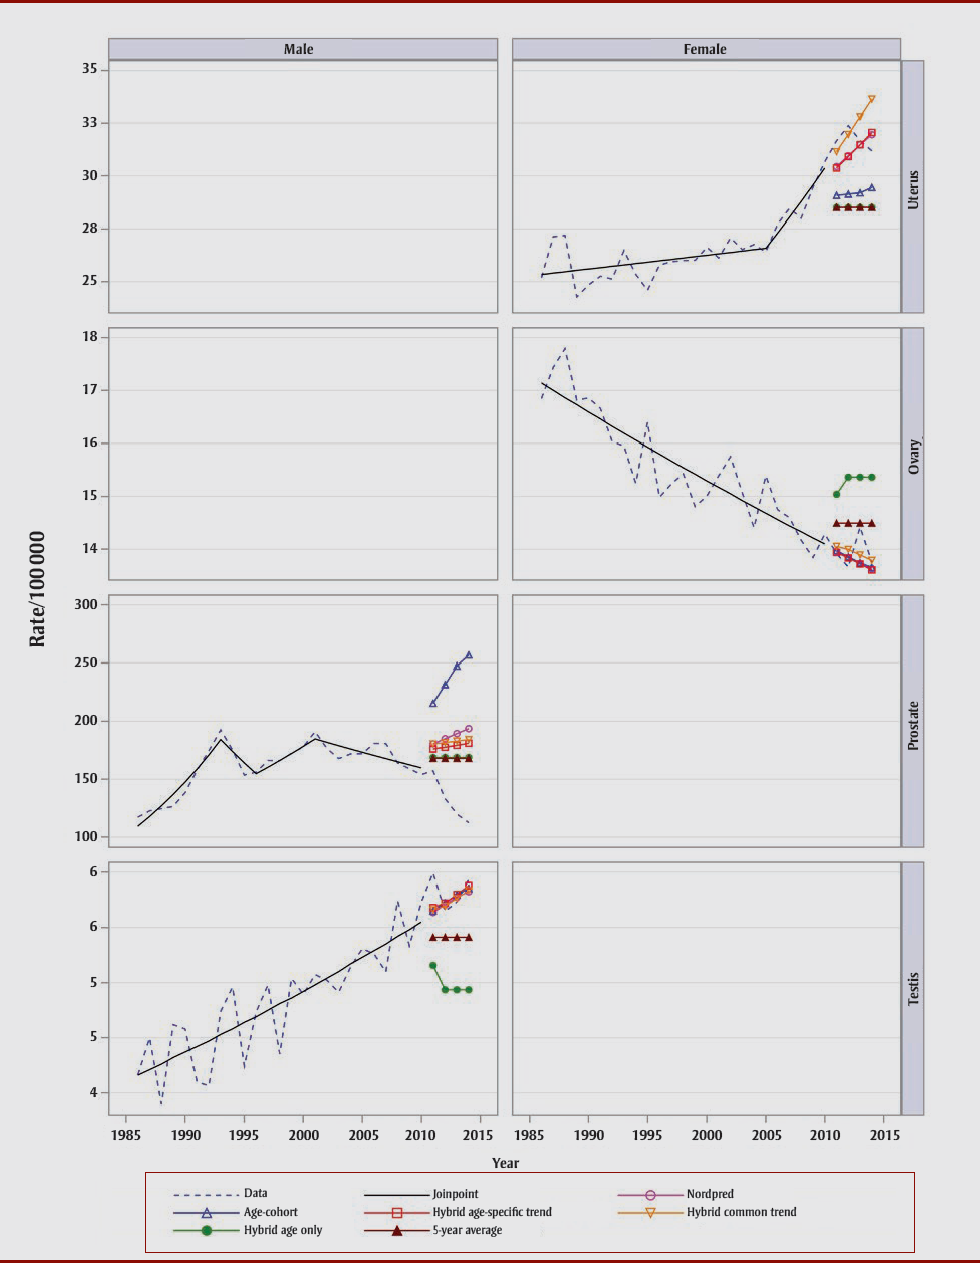
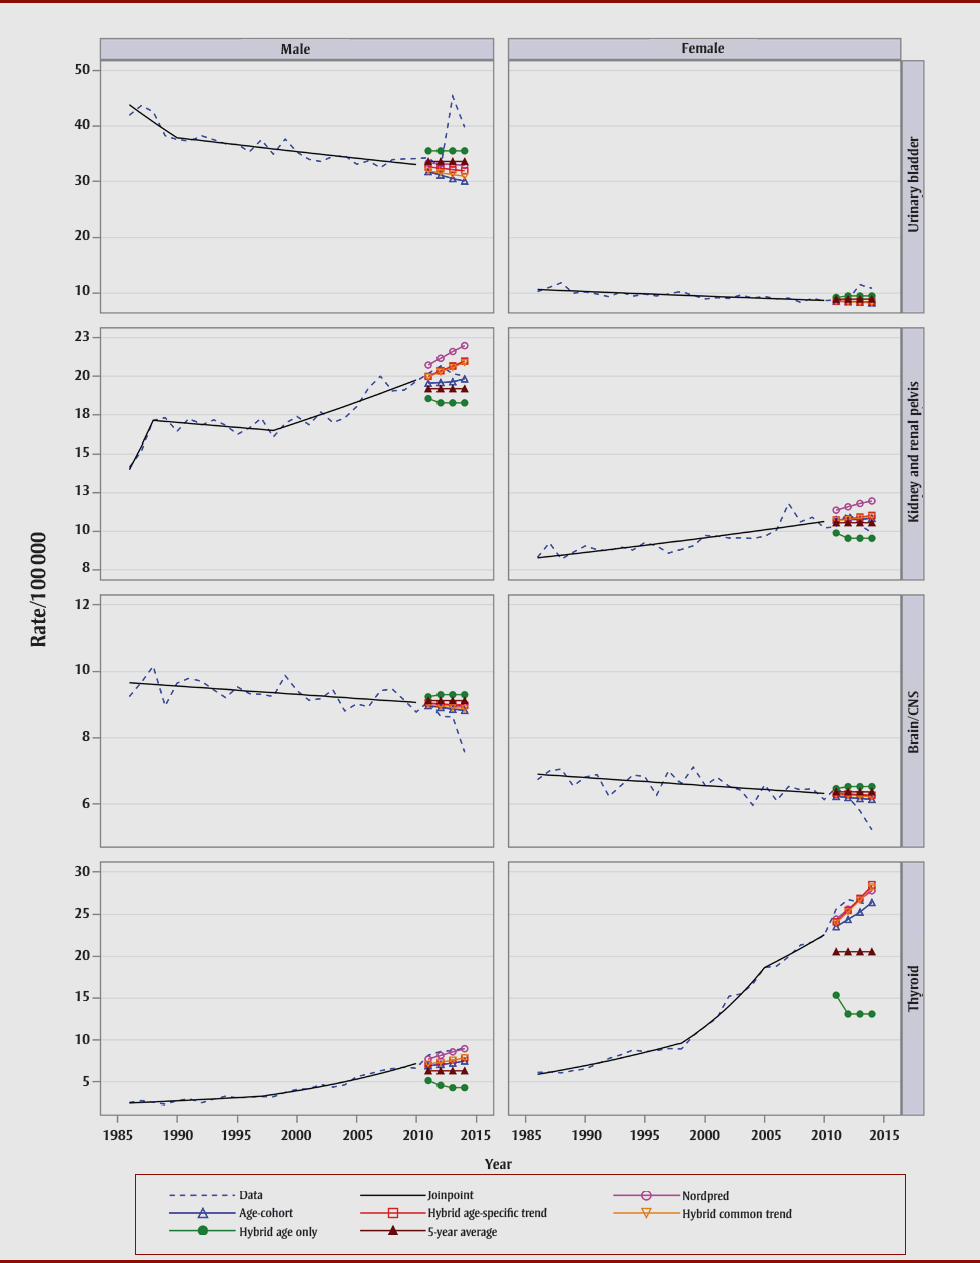
Five of the six models (Nordpred, the age–cohort model, the hybrid common trend model, the hybrid age-specific trend model and the 5-year average model) had mean RB between 5% and 10% and a median RB around 5% (Figure 1). Greater variation was observed in the mean and median RB when the accuracy of the projection models was compared by cancer site (Figure 2). None of the models were good at predicting prostate cancer and a greater predictive variability was apparent for cancers of the thyroid, larynx, bladder, liver and brain/central nervous system (CNS).
Figure 1. Relative bias by projection model for all cancer sites
Text description: Figure
Figure 1. Relative bias by projection model for all cancer sites
| Data | Relative bias (%) | |||||
|---|---|---|---|---|---|---|
| Model | Nordpred | Age-cohort | Hybrid age only | Hybrid age-specific trend | Hybrid common trend | 5-year average |
| Interquartile range | 1.875–7.8 | 2.5–8.825 | 3.775–19 | 1.8–8.825 | 1.8–8.2 | 2.5–10.325 |
| Median | 4.05 | 4.4 | 9.4 | 4.35 | 4.2 | 6.05 |
| Minimum | 0.1 | 0 | 0 | 0.1 | 0.1 | 0.2 |
| Maximum | 16.4 | 18 | 43 | 18.8 | 17.4 | 20.6 |
| Outliers | 17.3, 18, 18, 18.2, 19.3, 20.7, 23.8, 27.1, 27.4, 38.9, 57.9, 72.2 | 18.6, 24.1, 24.4, 27.5, 32.8, 37, 73.9, 106.4, 128.4 | 45.1, 47, 48.1, 49.7, 50.1, 50.5, 50.9, 51.1, 52.4, 58.5, 69.6, 73.4 | 19.8, 19.9, 20.1, 20.3, 22.2, 22.8, 26.5, 29.2, 33.4, 49.4, 60.9 | 19, 19.8, 19.9, 22.3, 24.1, 27.7, 31.2, 36.4, 52.5, 63.7 | 21.1, 21.6, 22, 22.3, 22.6, 22.8, 23.3, 26, 26, 26.2, 26.7, 27.8, 30, 31, 33.9, 40, 49.3 |
Figure 2. Relative bias by cancer site for all projection models
Text description: Figure 2
Figure 2. Relative bias by cancer site for all projection models
| Cancer type | Relative bias (%) | ||||
|---|---|---|---|---|---|
| Interquartile range | Median | Minimum | Maximum | Outliers | |
| All | 1–7.775 | 3.2 | 0.1 | 16.4 | – |
| Oral | 2.675–9.675 | 5.15 | 0 | 18.1 | – |
| Esophagus | 1.075–6.2 | 2.35 | 0.1 | 12.2 | 18.8 |
| Stomach | 2.475–8.65 | 4.95 | 0.1 | 13.7 | 18.6, 21.4, 22.3, 25.2, 25.3, 29.3, 32.6 |
| Colorectal | 4.625–9.225 | 7 | 2.1 | 14.5 | – |
| Liver | 2.05–15.4 | 7.6 | 0.3 | 29 | – |
| Pancreas | 2.2–7.1 | 4.15 | 0.2 | 11.5 | – |
| Larynx | 3.675–20.3 | 12.15 | 0.3 | 45.1 | 48.1, 58.5, 69.6, 73.4 |
| Lung | 1.3–7.825 | 3.2 | 0 | 15.5 | 19.9, 28.4, 28.6, 31.9, 40.6 |
| Melanoma | 2.625–10.55 | 5.65 | 0.1 | 22.3 | – |
| Breast | 1.475–5.625 | 2.35 | 0.3 | 11.1 | 12.4, 17.9, 19.8, 20.3 |
| Cervix | 1.4–8.675 | 3.35 | 0.1 | 13.4 | 21.3, 23.3, 27.7 |
| Uterus | 3.4–9.9 | 6.7 | 0.6 | 11.9 | – |
| Ovary | 0.875–5.025 | 1.95 | 0.1 | 8.1 | 11.7, 12.5 |
| Prostate | 26.65–58.65 | 40.4 | 6.8 | 128.4 | – |
| Testis | 1.175–6.625 | 3 | 0.6 | 13.9 | 16.8 |
| Bladder | 3.375–23.875 | 9.8 | 0.7 | 32.8 | – |
| Kidney | 3.025–8.05 | 4.35 | 0.8 | 15 | 20.7 |
| Brain/CNS | 2.3–13.7 | 4.35 | 0.3 | 25 | – |
| Thyroid | 5.575–22.925 | 13.05 | 0.5 | 47 | 49.7, 50.5, 50.9, 51.1, 52.4 |
| HL | 1.8–11.375 | 6.3 | 0.2 | 15.1 | – |
| NHL | 3.775–8.8 | 6.4 | 0 | 16.4 | – |
| Myeloma | 1.95–7.85 | 3.95 | 0 | 15.9 | 17.4, 20.1 |
| Leukemia | 3.15–8 | 4.35 | 0.3 | 12.8 | 15.8, 18 |
| Others | 2.175–5.55 | 3.65 | 0.2 | 9.3 | – |
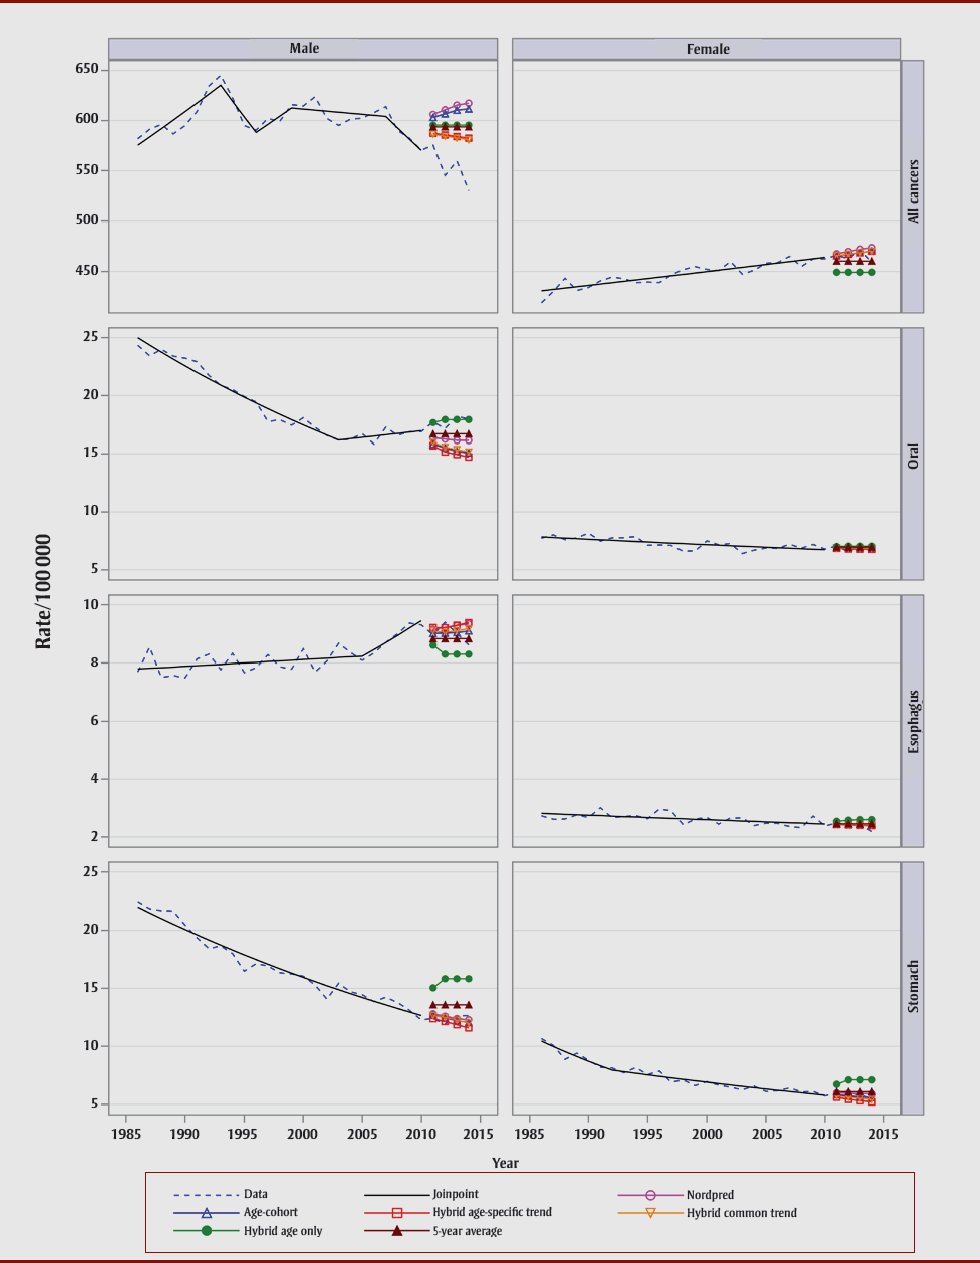
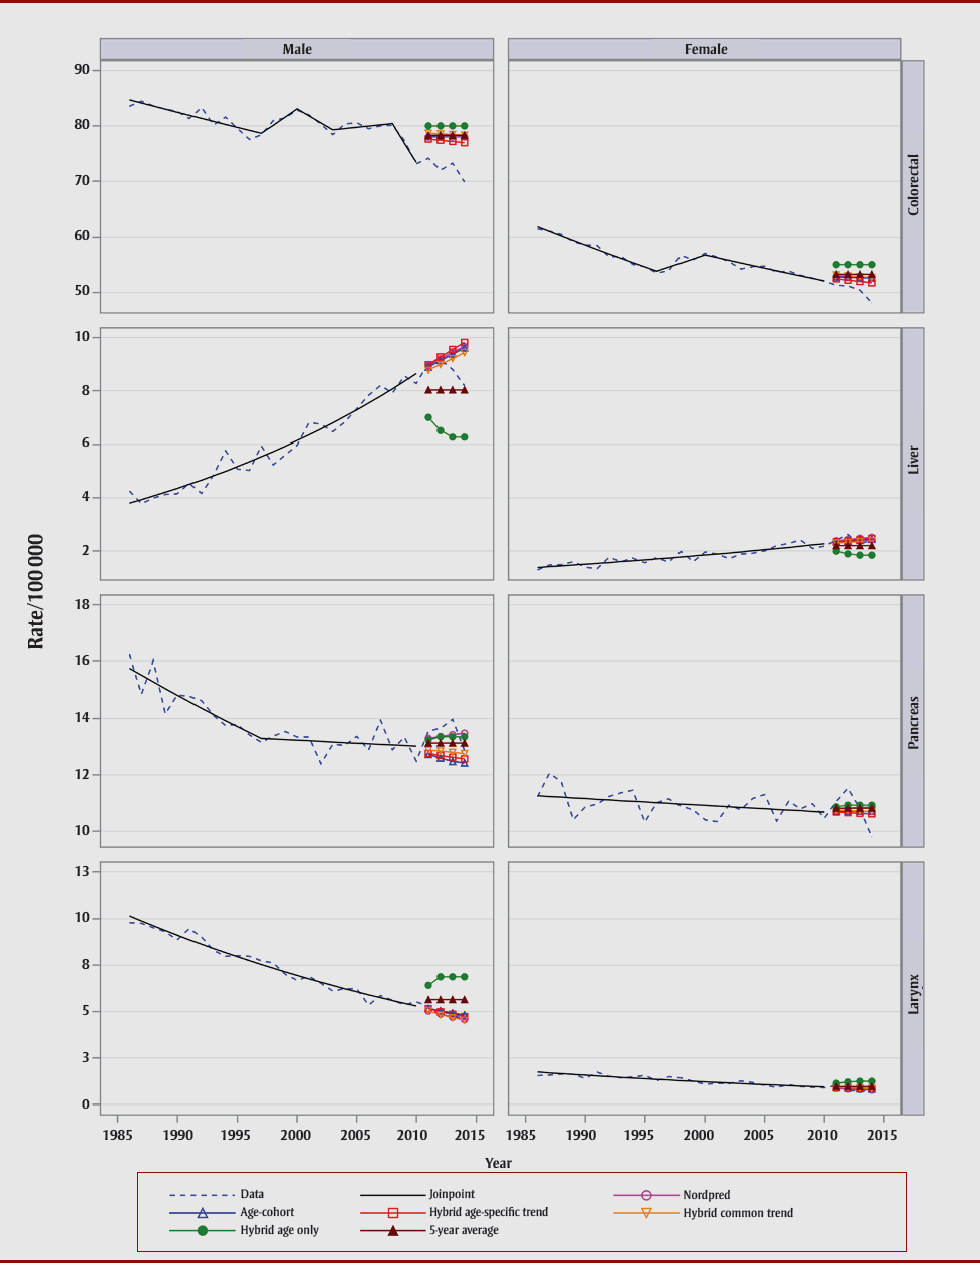
A more detailed and slightly different picture emerges when models are graphically compared by type of cancer and sex (Figure 3, Table 2). The performance of all projection models was poor for male all cancer sites combined, male and female colorectal, prostate, male bladder, male and female brain/CNS, female Hodgkin lymphoma and male myeloma. The greater variation observed in Figure 2 for cancers of the liver, larynx and thyroid seems to be due to the inability of a few models to predict rates.
Figure 3. Actual age-standardized incidence rates (1986–2010) and projected age-standardized rates (2011–2014) obtained with Canproj projection models by sex and cancer site, Canada (Section 1 of 7)
Text description: Figure 3 (Section 1 of 7)
Figure 3. Actual age-standardized incidence rates (1986–2010) and projected age-standardized rates (2011–2014) obtained with Canproj projection models by sex and cancer site, Canada (Section 1 of 7)
All cancers
| Sex | Year | Observed data | Joinpoint | Nordpred | Age-cohort | Hybrid age-specific trend | Hybrid age-common trend | Hybrid age-only | 5-Year average |
|---|---|---|---|---|---|---|---|---|---|
| Male | 1986 | 581.9 | 575.4 | - | - | - | - | - | - |
| 1987 | 591.4 | 583.6 | - | - | - | - | - | - | |
| 1988 | 596.2 | 591.9 | - | - | - | - | - | - | |
| 1989 | 586.7 | 600.4 | - | - | - | - | - | - | |
| 1990 | 595 | 608.9 | - | - | - | - | - | - | |
| 1991 | 609.1 | 617.6 | - | - | - | - | - | - | |
| 1992 | 634.6 | 626.4 | - | - | - | - | - | - | |
| 1993 | 645.2 | 635.3 | - | - | - | - | - | - | |
| 1994 | 622.5 | 619.2 | - | - | - | - | - | - | |
| 1995 | 595 | 603.5 | - | - | - | - | - | - | |
| 1996 | 590.5 | 588.2 | - | - | - | - | - | - | |
| 1997 | 602.1 | 596.2 | - | - | - | - | - | - | |
| 1998 | 599.1 | 604.3 | - | - | - | - | - | - | |
| 1999 | 615.9 | 612.5 | - | - | - | - | - | - | |
| 2000 | 614.6 | 611.5 | - | - | - | - | - | - | |
| 2001 | 623.8 | 610.4 | - | - | - | - | - | - | |
| 2002 | 602.2 | 609.4 | - | - | - | - | - | - | |
| 2003 | 595.2 | 608.3 | - | - | - | - | - | - | |
| 2004 | 601.3 | 607.3 | - | - | - | - | - | - | |
| 2005 | 602.3 | 606.2 | - | - | - | - | - | - | |
| 2006 | 608 | 605.2 | - | - | - | - | - | - | |
| 2007 | 613.9 | 604.1 | - | - | - | - | - | - | |
| 2008 | 590.2 | 592.7 | - | - | - | - | - | - | |
| 2009 | 582.4 | 581.4 | - | - | - | - | - | - | |
| 2010 | 570.4 | 570.3 | - | - | - | - | - | - | |
| 2011 | 575.6 | - | 606.1 | 603.1 | 587.3 | 586.4 | 595.4 | 593.7 | |
| 2012 | 545.4 | - | 610.8 | 606.7 | 585.7 | 584.5 | 595.4 | 593.7 | |
| 2013 | 559.8 | - | 615.4 | 610.3 | 584.1 | 582.7 | 595.4 | 593.7 | |
| 2014 | 530.3 | - | 617.3 | 611.6 | 582.5 | 580.8 | 595.4 | 593.7 | |
| Female | 1986 | 418.8 | 430.8 | - | - | - | - | - | - |
| 1987 | 430.2 | 432.1 | - | - | - | - | - | - | |
| 1988 | 443.3 | 433.5 | - | - | - | - | - | - | |
| 1989 | 431.1 | 434.8 | - | - | - | - | - | - | |
| 1990 | 434.1 | 436.2 | - | - | - | - | - | - | |
| 1991 | 440.8 | 437.5 | - | - | - | - | - | - | |
| 1992 | 444.5 | 438.9 | - | - | - | - | - | - | |
| 1993 | 442.8 | 440.3 | - | - | - | - | - | - | |
| 1994 | 439 | 441.6 | - | - | - | - | - | - | |
| 1995 | 439.4 | 443 | - | - | - | - | - | - | |
| 1996 | 439 | 444.4 | - | - | - | - | - | - | |
| 1997 | 446.5 | 445.8 | - | - | - | - | - | - | |
| 1998 | 451.9 | 447.2 | - | - | - | - | - | - | |
| 1999 | 454.9 | 448.6 | - | - | - | - | - | - | |
| 2000 | 452 | 449.9 | - | - | - | - | - | - | |
| 2001 | 451 | 451.3 | - | - | - | - | - | - | |
| 2002 | 460 | 452.8 | - | - | - | - | - | - | |
| 2003 | 447.4 | 454.2 | - | - | - | - | - | - | |
| 2004 | 451.3 | 455.6 | - | - | - | - | - | - | |
| 2005 | 458.3 | 457 | - | - | - | - | - | - | |
| 2006 | 458.9 | 458.4 | - | - | - | - | - | - | |
| 2007 | 465.1 | 459.8 | - | - | - | - | - | - | |
| 2008 | 454.9 | 461.3 | - | - | - | - | - | - | |
| 2009 | 462.6 | 462.7 | - | - | - | - | - | - | |
| 2010 | 462.7 | 464.1 | - | - | - | - | - | - | |
| 2011 | 466.3 | - | 467.7 | 465.6 | 465.8 | 465.9 | 449.3 | 460.4 | |
| 2012 | 462.6 | - | 469.9 | 467.1 | 467.3 | 467.4 | 449.3 | 460.4 | |
| 2013 | 471.9 | - | 472.2 | 468.7 | 468.7 | 468.9 | 449.3 | 460.4 | |
| 2014 | 459.1 | - | 473.7 | 470.5 | 470.2 | 470.4 | 449.3 | 460.4 |
Oral
| Sex | Year | Observed data | Joinpoint | Nordpred | Age-cohort | Hybrid age-specific trend | Hybrid age-common trend | Hybrid age-only | 5-Year average |
|---|---|---|---|---|---|---|---|---|---|
| Male | 1986 | 24.3 | 25 | - | - | - | - | - | - |
| 1987 | 23.4 | 24.4 | - | - | - | - | - | - | |
| 1988 | 24 | 23.8 | - | - | - | - | - | - | |
| 1989 | 23.4 | 23.2 | - | - | - | - | - | - | |
| 1990 | 23.2 | 22.6 | - | - | - | - | - | - | |
| 1991 | 22.9 | 22 | - | - | - | - | - | - | |
| 1992 | 21.7 | 21.4 | - | - | - | - | - | - | |
| 1993 | 20.9 | 20.9 | - | - | - | - | - | - | |
| 1994 | 20.5 | 20.4 | - | - | - | - | - | - | |
| 1995 | 19.9 | 19.9 | - | - | - | - | - | - | |
| 1996 | 19.4 | 19.4 | - | - | - | - | - | - | |
| 1997 | 17.8 | 18.9 | - | - | - | - | - | - | |
| 1998 | 17.9 | 18.4 | - | - | - | - | - | - | |
| 1999 | 17.5 | 17.9 | - | - | - | - | - | - | |
| 2000 | 18.1 | 17.5 | - | - | - | - | - | - | |
| 2001 | 17.3 | 17 | - | - | - | - | - | - | |
| 2002 | 16.6 | 16.6 | - | - | - | - | - | - | |
| 2003 | 16.2 | 16.2 | - | - | - | - | - | - | |
| 2004 | 16.3 | 16.3 | - | - | - | - | - | - | |
| 2005 | 16.7 | 16.4 | - | - | - | - | - | - | |
| 2006 | 15.8 | 16.5 | - | - | - | - | - | - | |
| 2007 | 17.3 | 16.6 | - | - | - | - | - | - | |
| 2008 | 16.6 | 16.8 | - | - | - | - | - | - | |
| 2009 | 16.9 | 16.9 | - | - | - | - | - | - | |
| 2010 | 16.9 | 17 | - | - | - | - | - | - | |
| 2011 | 17.7 | - | 16.4 | 15.8 | 15.7 | 16 | 17.7 | 16.7 | |
| 2012 | 17.2 | - | 16.3 | 15.5 | 15.2 | 15.6 | 17.9 | 16.7 | |
| 2013 | 18.2 | - | 16.2 | 15.2 | 14.9 | 15.4 | 17.9 | 16.7 | |
| 2014 | 17.9 | - | 16.2 | 15.1 | 14.7 | 15.2 | 17.9 | 16.7 | |
| Female | 1986 | 7.7 | 7.8 | - | - | - | - | - | - |
| 1987 | 8 | 7.8 | - | - | - | - | - | - | |
| 1988 | 7.6 | 7.7 | - | - | - | - | - | - | |
| 1989 | 7.8 | 7.7 | - | - | - | - | - | - | |
| 1990 | 8.2 | 7.6 | - | - | - | - | - | - | |
| 1991 | 7.5 | 7.6 | - | - | - | - | - | - | |
| 1992 | 7.8 | 7.6 | - | - | - | - | - | - | |
| 1993 | 7.8 | 7.5 | - | - | - | - | - | - | |
| 1994 | 7.9 | 7.5 | - | - | - | - | - | - | |
| 1995 | 7.1 | 7.4 | - | - | - | - | - | - | |
| 1996 | 7.2 | 7.4 | - | - | - | - | - | - | |
| 1997 | 7.1 | 7.3 | - | - | - | - | - | - | |
| 1998 | 6.6 | 7.3 | - | - | - | - | - | - | |
| 1999 | 6.6 | 7.2 | - | - | - | - | - | - | |
| 2000 | 7.5 | 7.2 | - | - | - | - | - | - | |
| 2001 | 7.2 | 7.1 | - | - | - | - | - | - | |
| 2002 | 7.3 | 7.1 | - | - | - | - | - | - | |
| 2003 | 6.4 | 7 | - | - | - | - | - | - | |
| 2004 | 6.7 | 7 | - | - | - | - | - | - | |
| 2005 | 6.9 | 7 | - | - | - | - | - | - | |
| 2006 | 6.9 | 6.9 | - | - | - | - | - | - | |
| 2007 | 7.2 | 6.9 | - | - | - | - | - | - | |
| 2008 | 6.9 | 6.8 | - | - | - | - | - | - | |
| 2009 | 7.2 | 6.8 | - | - | - | - | - | - | |
| 2010 | 6.8 | 6.7 | - | - | - | - | - | - | |
| 2011 | 7.1 | - | 7 | 6.9 | 6.9 | 6.9 | 7 | 7 | |
| 2012 | 6.6 | - | 6.9 | 6.9 | 6.8 | 6.9 | 7 | 7 | |
| 2013 | 7.2 | - | 6.9 | 6.8 | 6.8 | 6.9 | 7 | 7 | |
| 2014 | 7.1 | - | 6.9 | 6.8 | 6.8 | 6.9 | 7 | 7 |
Esophagus
| Sex | Year | Observed data | Joinpoint | Nordpred | Age-cohort | Hybrid age-specific trend | Hybrid age-common trend | Hybrid age-only | 5-Year average |
|---|---|---|---|---|---|---|---|---|---|
| Male | 1986 | 7.7 | 7.8 | - | - | - | - | - | - |
| 1987 | 8.5 | 7.8 | - | - | - | - | - | - | |
| 1988 | 7.5 | 7.8 | - | - | - | - | - | - | |
| 1989 | 7.6 | 7.9 | - | - | - | - | - | - | |
| 1990 | 7.5 | 7.9 | - | - | - | - | - | - | |
| 1991 | 8.1 | 7.9 | - | - | - | - | - | - | |
| 1992 | 8.3 | 7.9 | - | - | - | - | - | - | |
| 1993 | 7.8 | 8 | - | - | - | - | - | - | |
| 1994 | 8.3 | 8 | - | - | - | - | - | - | |
| 1995 | 7.7 | 8 | - | - | - | - | - | - | |
| 1996 | 7.8 | 8 | - | - | - | - | - | - | |
| 1997 | 8.3 | 8.1 | - | - | - | - | - | - | |
| 1998 | 7.9 | 8.1 | - | - | - | - | - | - | |
| 1999 | 7.8 | 8.1 | - | - | - | - | - | - | |
| 2000 | 8.5 | 8.1 | - | - | - | - | - | - | |
| 2001 | 7.7 | 8.1 | - | - | - | - | - | - | |
| 2002 | 8.1 | 8.2 | - | - | - | - | - | - | |
| 2003 | 8.7 | 8.2 | - | - | - | - | - | - | |
| 2004 | 8.4 | 8.2 | - | - | - | - | - | - | |
| 2005 | 8.1 | 8.2 | - | - | - | - | - | - | |
| 2006 | 8.3 | 8.5 | - | - | - | - | - | - | |
| 2007 | 8.7 | 8.7 | - | - | - | - | - | - | |
| 2008 | 9 | 8.9 | - | - | - | - | - | - | |
| 2009 | 9.4 | 9.2 | - | - | - | - | - | - | |
| 2010 | 9.3 | 9.5 | - | - | - | - | - | - | |
| 2011 | 9 | - | 9.2 | 9 | 9.2 | 9.1 | 8.6 | 8.8 | |
| 2012 | 9.4 | - | 9.2 | 9 | 9.2 | 9 | 8.3 | 8.8 | |
| 2013 | 9 | - | 9.3 | 9 | 9.3 | 9.1 | 8.3 | 8.8 | |
| 2014 | 8.6 | - | 9.3 | 9.1 | 9.4 | 9.2 | 8.3 | 8.8 | |
| Female | 1986 | 2.7 | 2.8 | - | - | - | - | - | - |
| 1987 | 2.6 | 2.8 | - | - | - | - | - | - | |
| 1988 | 2.6 | 2.8 | - | - | - | - | - | - | |
| 1989 | 2.8 | 2.8 | - | - | - | - | - | - | |
| 1990 | 2.7 | 2.8 | - | - | - | - | - | - | |
| 1991 | 3 | 2.7 | - | - | - | - | - | - | |
| 1992 | 2.7 | 2.7 | - | - | - | - | - | - | |
| 1993 | 2.7 | 2.7 | - | - | - | - | - | - | |
| 1994 | 2.7 | 2.7 | - | - | - | - | - | - | |
| 1995 | 2.6 | 2.7 | - | - | - | - | - | - | |
| 1996 | 3 | 2.7 | - | - | - | - | - | - | |
| 1997 | 2.9 | 2.6 | - | - | - | - | - | - | |
| 1998 | 2.4 | 2.6 | - | - | - | - | - | - | |
| 1999 | 2.6 | 2.6 | - | - | - | - | - | - | |
| 2000 | 2.7 | 2.6 | - | - | - | - | - | - | |
| 2001 | 2.4 | 2.6 | - | - | - | - | - | - | |
| 2002 | 2.7 | 2.6 | - | - | - | - | - | - | |
| 2003 | 2.7 | 2.6 | - | - | - | - | - | - | |
| 2004 | 2.4 | 2.5 | - | - | - | - | - | - | |
| 2005 | 2.5 | 2.5 | - | - | - | - | - | - | |
| 2006 | 2.5 | 2.5 | - | - | - | - | - | - | |
| 2007 | 2.4 | 2.5 | - | - | - | - | - | - | |
| 2008 | 2.3 | 2.5 | - | - | - | - | - | - | |
| 2009 | 2.7 | 2.5 | - | - | - | - | - | - | |
| 2010 | 2.4 | 2.5 | - | - | - | - | - | - | |
| 2011 | 2.5 | - | 2.4 | 2.4 | 2.4 | 2.4 | 2.5 | 2.5 | |
| 2012 | 2.4 | - | 2.4 | 2.4 | 2.4 | 2.4 | 2.6 | 2.5 | |
| 2013 | 2.4 | - | 2.4 | 2.4 | 2.4 | 2.4 | 2.6 | 2.5 | |
| 2014 | 2.2 | - | 2.4 | 2.4 | 2.4 | 2.4 | 2.6 | 2.5 |
Stomach
| Sex | Year | Observed data | Joinpoint | Nordpred | Age-cohort | Hybrid age-specific trend | Hybrid age-common trend | Hybrid age-only | 5-Year average |
|---|---|---|---|---|---|---|---|---|---|
| Male | 1986 | 22.5 | 22 | - | - | - | - | - | - |
| 1987 | 21.9 | 21.5 | - | - | - | - | - | - | |
| 1988 | 21.7 | 21 | - | - | - | - | - | - | |
| 1989 | 21.7 | 20.5 | - | - | - | - | - | - | |
| 1990 | 20.4 | 20.1 | - | - | - | - | - | - | |
| 1991 | 19.4 | 19.6 | - | - | - | - | - | - | |
| 1992 | 18.4 | 19.2 | - | - | - | - | - | - | |
| 1993 | 18.7 | 18.7 | - | - | - | - | - | - | |
| 1994 | 18 | 18.3 | - | - | - | - | - | - | |
| 1995 | 16.5 | 17.9 | - | - | - | - | - | - | |
| 1996 | 17.1 | 17.5 | - | - | - | - | - | - | |
| 1997 | 16.9 | 17.1 | - | - | - | - | - | - | |
| 1998 | 16.3 | 16.7 | - | - | - | - | - | - | |
| 1999 | 16.2 | 16.3 | - | - | - | - | - | - | |
| 2000 | 16 | 15.9 | - | - | - | - | - | - | |
| 2001 | 15.3 | 15.6 | - | - | - | - | - | - | |
| 2002 | 14.1 | 15.2 | - | - | - | - | - | - | |
| 2003 | 15.4 | 14.9 | - | - | - | - | - | - | |
| 2004 | 14.7 | 14.5 | - | - | - | - | - | - | |
| 2005 | 14.4 | 14.2 | - | - | - | - | - | - | |
| 2006 | 13.9 | 13.9 | - | - | - | - | - | - | |
| 2007 | 14.2 | 13.6 | - | - | - | - | - | - | |
| 2008 | 13.8 | 13.3 | - | - | - | - | - | - | |
| 2009 | 13.1 | 13 | - | - | - | - | - | - | |
| 2010 | 12.3 | 12.7 | - | - | - | - | - | - | |
| 2011 | 12.4 | - | 12.8 | 12.7 | 12.4 | 12.6 | 15 | 13.6 | |
| 2012 | 11.9 | - | 12.6 | 12.5 | 12.1 | 12.5 | 15.8 | 13.6 | |
| 2013 | 12.6 | - | 12.4 | 12.2 | 11.9 | 12.3 | 15.8 | 13.6 | |
| 2014 | 12.6 | - | 12.3 | 12 | 11.6 | 12 | 15.8 | 13.6 | |
| Female | 1986 | 10.7 | 10.5 | - | - | - | - | - | - |
| 1987 | 10.1 | 10 | - | - | - | - | - | - | |
| 1988 | 8.9 | 9.5 | - | - | - | - | - | - | |
| 1989 | 9.4 | 9.1 | - | - | - | - | - | - | |
| 1990 | 8.8 | 8.7 | - | - | - | - | - | - | |
| 1991 | 8.2 | 8.3 | - | - | - | - | - | - | |
| 1992 | 8.1 | 8 | - | - | - | - | - | - | |
| 1993 | 7.7 | 7.8 | - | - | - | - | - | - | |
| 1994 | 8.2 | 7.7 | - | - | - | - | - | - | |
| 1995 | 7.6 | 7.5 | - | - | - | - | - | - | |
| 1996 | 7.9 | 7.4 | - | - | - | - | - | - | |
| 1997 | 6.9 | 7.3 | - | - | - | - | - | - | |
| 1998 | 7.1 | 7.2 | - | - | - | - | - | - | |
| 1999 | 6.6 | 7 | - | - | - | - | - | - | |
| 2000 | 7 | 6.9 | - | - | - | - | - | - | |
| 2001 | 6.7 | 6.8 | - | - | - | - | - | - | |
| 2002 | 6.5 | 6.7 | - | - | - | - | - | - | |
| 2003 | 6.3 | 6.6 | - | - | - | - | - | - | |
| 2004 | 6.6 | 6.4 | - | - | - | - | - | - | |
| 2005 | 6.1 | 6.3 | - | - | - | - | - | - | |
| 2006 | 6.2 | 6.2 | - | - | - | - | - | - | |
| 2007 | 6.4 | 6.1 | - | - | - | - | - | - | |
| 2008 | 6.1 | 6 | - | - | - | - | - | - | |
| 2009 | 6.1 | 5.9 | - | - | - | - | - | - | |
| 2010 | 5.7 | 5.8 | - | - | - | - | - | - | |
| 2011 | 6 | - | 6 | 5.8 | 5.6 | 5.7 | 6.7 | 6.1 | |
| 2012 | 6 | - | 6 | 5.7 | 5.4 | 5.6 | 7.1 | 6.1 | |
| 2013 | 5.8 | - | 5.9 | 5.6 | 5.3 | 5.5 | 7.1 | 6.1 | |
| 2014 | 5.5 | - | 5.9 | 5.6 | 5.2 | 5.4 | 7.1 | 6.1 |
Figure 3. Actual age-standardized incidence rates (1986–2010) and projected age-standardized rates (2011–2014) obtained with Canproj projection models by sex and cancer site, Canada (Section 2 of 7)
Text description: Figure 3 (Section 2 of 7)
Figure 3. Actual age-standardized incidence rates (1986–2010) and projected age-standardized rates (2011–2014) obtained with Canproj projection models by sex and cancer site, Canada (Section 2 of 7)
Colorectal
| Sex | Year | Observed data | Joinpoint | Nordpred | Age-cohort | Hybrid age-specific trend | Hybrid age-common trend | Hybrid age-only | 5-Year average |
|---|---|---|---|---|---|---|---|---|---|
| Male | 1986 | 83.6 | 84.7 | - | - | - | - | - | - |
| 1987 | 84.5 | 84.1 | - | - | - | - | - | - | |
| 1988 | 83.6 | 83.6 | - | - | - | - | - | - | |
| 1989 | 83 | 83 | - | - | - | - | - | - | |
| 1990 | 82.6 | 82.5 | - | - | - | - | - | - | |
| 1991 | 81.3 | 81.9 | - | - | - | - | - | - | |
| 1992 | 83.3 | 81.4 | - | - | - | - | - | - | |
| 1993 | 80.2 | 80.8 | - | - | - | - | - | - | |
| 1994 | 81.6 | 80.3 | - | - | - | - | - | - | |
| 1995 | 79.5 | 79.7 | - | - | - | - | - | - | |
| 1996 | 77.5 | 79.2 | - | - | - | - | - | - | |
| 1997 | 78.4 | 78.7 | - | - | - | - | - | - | |
| 1998 | 80.9 | 80.1 | - | - | - | - | - | - | |
| 1999 | 81.4 | 81.6 | - | - | - | - | - | - | |
| 2000 | 82.8 | 83.1 | - | - | - | - | - | - | |
| 2001 | 82 | 81.8 | - | - | - | - | - | - | |
| 2002 | 80.3 | 80.5 | - | - | - | - | - | - | |
| 2003 | 78.4 | 79.3 | - | - | - | - | - | - | |
| 2004 | 80.3 | 79.5 | - | - | - | - | - | - | |
| 2005 | 80.6 | 79.7 | - | - | - | - | - | - | |
| 2006 | 79.5 | 80 | - | - | - | - | - | - | |
| 2007 | 80 | 80.2 | - | - | - | - | - | - | |
| 2008 | 80.1 | 80.4 | - | - | - | - | - | - | |
| 2009 | 77.4 | 76.8 | - | - | - | - | - | - | |
| 2010 | 73.1 | 73.4 | - | - | - | - | - | - | |
| 2011 | 74.1 | - | 78 | 78.1 | 77.6 | 78.7 | 80 | 78.3 | |
| 2012 | 72 | - | 78 | 78.2 | 77.4 | 78.6 | 80 | 78.3 | |
| 2013 | 73.2 | - | 78 | 78.2 | 77.2 | 78.4 | 80 | 78.3 | |
| 2014 | 69.9 | - | 78 | 78.2 | 77 | 78.3 | 80 | 78.3 | |
| Female | 1986 | 61.6 | 62 | - | - | - | - | - | - |
| 1987 | 61.2 | 61.1 | - | - | - | - | - | - | |
| 1988 | 60.5 | 60.3 | - | - | - | - | - | - | |
| 1989 | 59.2 | 59.4 | - | - | - | - | - | - | |
| 1990 | 58.6 | 58.6 | - | - | - | - | - | - | |
| 1991 | 58.5 | 57.8 | - | - | - | - | - | - | |
| 1992 | 56.5 | 57 | - | - | - | - | - | - | |
| 1993 | 56.6 | 56.2 | - | - | - | - | - | - | |
| 1994 | 55.1 | 55.4 | - | - | - | - | - | - | |
| 1995 | 54.7 | 54.6 | - | - | - | - | - | - | |
| 1996 | 53.6 | 53.9 | - | - | - | - | - | - | |
| 1997 | 53.9 | 54.6 | - | - | - | - | - | - | |
| 1998 | 56.7 | 55.3 | - | - | - | - | - | - | |
| 1999 | 55.9 | 56.1 | - | - | - | - | - | - | |
| 2000 | 57.1 | 56.8 | - | - | - | - | - | - | |
| 2001 | 56.4 | 56.3 | - | - | - | - | - | - | |
| 2002 | 55.6 | 55.8 | - | - | - | - | - | - | |
| 2003 | 54.3 | 55.4 | - | - | - | - | - | - | |
| 2004 | 54.7 | 54.9 | - | - | - | - | - | - | |
| 2005 | 54.8 | 54.4 | - | - | - | - | - | - | |
| 2006 | 53.7 | 53.9 | - | - | - | - | - | - | |
| 2007 | 53.9 | 53.5 | - | - | - | - | - | - | |
| 2008 | 53.1 | 53 | - | - | - | - | - | - | |
| 2009 | 52.6 | 52.6 | - | - | - | - | - | - | |
| 2010 | 52 | 52.1 | - | - | - | - | - | - | |
| 2011 | 51.3 | - | 52.9 | 52.8 | 52.5 | 53.2 | 55.1 | 53.3 | |
| 2012 | 51.2 | - | 52.9 | 52.8 | 52.3 | 53 | 55.1 | 53.3 | |
| 2013 | 50.5 | - | 52.8 | 52.7 | 52 | 52.9 | 55.1 | 53.3 | |
| 2014 | 48.2 | - | 52.8 | 52.6 | 51.8 | 52.7 | 55.1 | 53.3 |
Liver
| Sex | Year | Observed data | Joinpoint | Nordpred | Age-cohort | Hybrid age-specific trend | Hybrid age-common trend | Hybrid age-only | 5-Year average |
|---|---|---|---|---|---|---|---|---|---|
| Male | 1986 | 4.3 | 3.8 | - | - | - | - | - | - |
| 1987 | 3.8 | 3.9 | - | - | - | - | - | - | |
| 1988 | 4 | 4.1 | - | - | - | - | - | - | |
| 1989 | 4.1 | 4.2 | - | - | - | - | - | - | |
| 1990 | 4.2 | 4.4 | - | - | - | - | - | - | |
| 1991 | 4.5 | 4.5 | - | - | - | - | - | - | |
| 1992 | 4.2 | 4.7 | - | - | - | - | - | - | |
| 1993 | 4.9 | 4.8 | - | - | - | - | - | - | |
| 1994 | 5.8 | 5 | - | - | - | - | - | - | |
| 1995 | 5.1 | 5.2 | - | - | - | - | - | - | |
| 1996 | 5 | 5.4 | - | - | - | - | - | - | |
| 1997 | 5.9 | 5.5 | - | - | - | - | - | - | |
| 1998 | 5.2 | 5.7 | - | - | - | - | - | - | |
| 1999 | 5.6 | 5.9 | - | - | - | - | - | - | |
| 2000 | 6 | 6.1 | - | - | - | - | - | - | |
| 2001 | 6.8 | 6.4 | - | - | - | - | - | - | |
| 2002 | 6.8 | 6.6 | - | - | - | - | - | - | |
| 2003 | 6.5 | 6.8 | - | - | - | - | - | - | |
| 2004 | 6.8 | 7 | - | - | - | - | - | - | |
| 2005 | 7.3 | 7.3 | - | - | - | - | - | - | |
| 2006 | 7.8 | 7.5 | - | - | - | - | - | - | |
| 2007 | 8.2 | 7.8 | - | - | - | - | - | - | |
| 2008 | 7.9 | 8.1 | - | - | - | - | - | - | |
| 2009 | 8.6 | 8.4 | - | - | - | - | - | - | |
| 2010 | 8.3 | 8.7 | - | - | - | - | - | - | |
| 2011 | 9.1 | - | 8.9 | 8.9 | 9 | 8.8 | 7 | 8 | |
| 2012 | 9.2 | - | 9.2 | 9.1 | 9.3 | 9 | 6.5 | 8 | |
| 2013 | 8.8 | - | 9.5 | 9.4 | 9.6 | 9.2 | 6.3 | 8 | |
| 2014 | 8.2 | - | 9.7 | 9.6 | 9.8 | 9.4 | 6.3 | 8 | |
| Female | 1986 | 1.3 | 1.4 | - | - | - | - | - | - |
| 1987 | 1.5 | 1.4 | - | - | - | - | - | - | |
| 1988 | 1.5 | 1.4 | - | - | - | - | - | - | |
| 1989 | 1.6 | 1.5 | - | - | - | - | - | - | |
| 1990 | 1.4 | 1.5 | - | - | - | - | - | - | |
| 1991 | 1.3 | 1.5 | - | - | - | - | - | - | |
| 1992 | 1.8 | 1.6 | - | - | - | - | - | - | |
| 1993 | 1.6 | 1.6 | - | - | - | - | - | - | |
| 1994 | 1.7 | 1.6 | - | - | - | - | - | - | |
| 1995 | 1.6 | 1.7 | - | - | - | - | - | - | |
| 1996 | 1.7 | 1.7 | - | - | - | - | - | - | |
| 1997 | 1.6 | 1.7 | - | - | - | - | - | - | |
| 1998 | 2 | 1.8 | - | - | - | - | - | - | |
| 1999 | 1.6 | 1.8 | - | - | - | - | - | - | |
| 2000 | 2 | 1.9 | - | - | - | - | - | - | |
| 2001 | 1.9 | 1.9 | - | - | - | - | - | - | |
| 2002 | 1.7 | 1.9 | - | - | - | - | - | - | |
| 2003 | 1.9 | 2 | - | - | - | - | - | - | |
| 2004 | 1.9 | 2 | - | - | - | - | - | - | |
| 2005 | 2 | 2.1 | - | - | - | - | - | - | |
| 2006 | 2.2 | 2.1 | - | - | - | - | - | - | |
| 2007 | 2.3 | 2.1 | - | - | - | - | - | - | |
| 2008 | 2.4 | 2.2 | - | - | - | - | - | - | |
| 2009 | 2.1 | 2.2 | - | - | - | - | - | - | |
| 2010 | 2.2 | 2.3 | - | - | - | - | - | - | |
| 2011 | 2.4 | - | 2.4 | 2.3 | 2.3 | 2.3 | 2 | 2.2 | |
| 2012 | 2.6 | - | 2.4 | 2.4 | 2.4 | 2.3 | 1.9 | 2.2 | |
| 2013 | 2.2 | - | 2.5 | 2.4 | 2.4 | 2.4 | 1.8 | 2.2 | |
| 2014 | 2.4 | - | 2.5 | 2.4 | 2.5 | 2.4 | 1.8 | 2.2 |
Pancreas
| Sex | Year | Observed data | Joinpoint | Nordpred | Age-cohort | Hybrid age-specific trend | Hybrid age-common trend | Hybrid age-only | 5-Year average |
|---|---|---|---|---|---|---|---|---|---|
| Male | 1986 | 16.2 | 15.8 | - | - | - | - | - | - |
| 1987 | 14.9 | 15.5 | - | - | - | - | - | - | |
| 1988 | 16 | 15.3 | - | - | - | - | - | - | |
| 1989 | 14.2 | 15.1 | - | - | - | - | - | - | |
| 1990 | 14.8 | 14.8 | - | - | - | - | - | - | |
| 1991 | 14.8 | 14.6 | - | - | - | - | - | - | |
| 1992 | 14.6 | 14.4 | - | - | - | - | - | - | |
| 1993 | 14.1 | 14.1 | - | - | - | - | - | - | |
| 1994 | 13.7 | 13.9 | - | - | - | - | - | - | |
| 1995 | 13.8 | 13.7 | - | - | - | - | - | - | |
| 1996 | 13.4 | 13.5 | - | - | - | - | - | - | |
| 1997 | 13.2 | 13.3 | - | - | - | - | - | - | |
| 1998 | 13.4 | 13.3 | - | - | - | - | - | - | |
| 1999 | 13.5 | 13.3 | - | - | - | - | - | - | |
| 2000 | 13.3 | 13.2 | - | - | - | - | - | - | |
| 2001 | 13.3 | 13.2 | - | - | - | - | - | - | |
| 2002 | 12.4 | 13.2 | - | - | - | - | - | - | |
| 2003 | 13.1 | 13.2 | - | - | - | - | - | - | |
| 2004 | 13 | 13.1 | - | - | - | - | - | - | |
| 2005 | 13.4 | 13.1 | - | - | - | - | - | - | |
| 2006 | 12.9 | 13.1 | - | - | - | - | - | - | |
| 2007 | 13.9 | 13.1 | - | - | - | - | - | - | |
| 2008 | 12.9 | 13.1 | - | - | - | - | - | - | |
| 2009 | 13.3 | 13 | - | - | - | - | - | - | |
| 2010 | 12.5 | 13 | - | - | - | - | - | - | |
| 2011 | 13.5 | - | 13.3 | 12.7 | 12.8 | 12.9 | 13.2 | 13.1 | |
| 2012 | 13.7 | - | 13.4 | 12.6 | 12.7 | 12.8 | 13.4 | 13.1 | |
| 2013 | 14 | - | 13.4 | 12.5 | 12.6 | 12.8 | 13.4 | 13.1 | |
| 2014 | 12.9 | - | 13.5 | 12.4 | 12.6 | 12.8 | 13.4 | 13.1 | |
| Female | 1986 | 11.2 | 11.3 | - | - | - | - | - | - |
| 1987 | 12.1 | 11.2 | - | - | - | - | - | - | |
| 1988 | 11.7 | 11.2 | - | - | - | - | - | - | |
| 1989 | 10.4 | 11.2 | - | - | - | - | - | - | |
| 1990 | 10.9 | 11.2 | - | - | - | - | - | - | |
| 1991 | 11 | 11.1 | - | - | - | - | - | - | |
| 1992 | 11.2 | 11.1 | - | - | - | - | - | - | |
| 1993 | 11.4 | 11.1 | - | - | - | - | - | - | |
| 1994 | 11.5 | 11.1 | - | - | - | - | - | - | |
| 1995 | 10.3 | 11 | - | - | - | - | - | - | |
| 1996 | 11 | 11 | - | - | - | - | - | - | |
| 1997 | 11.1 | 11 | - | - | - | - | - | - | |
| 1998 | 10.9 | 11 | - | - | - | - | - | - | |
| 1999 | 10.8 | 10.9 | - | - | - | - | - | - | |
| 2000 | 10.4 | 10.9 | - | - | - | - | - | - | |
| 2001 | 10.3 | 10.9 | - | - | - | - | - | - | |
| 2002 | 10.9 | 10.9 | - | - | - | - | - | - | |
| 2003 | 10.8 | 10.8 | - | - | - | - | - | - | |
| 2004 | 11.2 | 10.8 | - | - | - | - | - | - | |
| 2005 | 11.3 | 10.8 | - | - | - | - | - | - | |
| 2006 | 10.4 | 10.8 | - | - | - | - | - | - | |
| 2007 | 11.1 | 10.8 | - | - | - | - | - | - | |
| 2008 | 10.8 | 10.7 | - | - | - | - | - | - | |
| 2009 | 11 | 10.7 | - | - | - | - | - | - | |
| 2010 | 10.5 | 10.7 | - | - | - | - | - | - | |
| 2011 | 11.1 | - | 10.8 | 10.7 | 10.7 | 10.7 | 10.9 | 10.8 | |
| 2012 | 11.5 | - | 10.8 | 10.7 | 10.7 | 10.7 | 10.9 | 10.8 | |
| 2013 | 10.8 | - | 10.8 | 10.7 | 10.6 | 10.7 | 10.9 | 10.8 | |
| 2014 | 9.8 | - | 10.8 | 10.7 | 10.6 | 10.7 | 10.9 | 10.8 |
Larynx
| Sex | Year | Observed data | Joinpoint | Nordpred | Age-cohort | Hybrid age-specific trend | Hybrid age-common trend | Hybrid age-only | 5-Year average |
|---|---|---|---|---|---|---|---|---|---|
| Male | 1986 | 9.8 | 10.2 | - | - | - | - | - | - |
| 1987 | 9.8 | 9.9 | - | - | - | - | - | - | |
| 1988 | 9.5 | 9.6 | - | - | - | - | - | - | |
| 1989 | 9.3 | 9.4 | - | - | - | - | - | - | |
| 1990 | 8.9 | 9.1 | - | - | - | - | - | - | |
| 1991 | 9.5 | 8.9 | - | - | - | - | - | - | |
| 1992 | 9 | 8.6 | - | - | - | - | - | - | |
| 1993 | 8.3 | 8.4 | - | - | - | - | - | - | |
| 1994 | 8 | 8.2 | - | - | - | - | - | - | |
| 1995 | 8 | 8 | - | - | - | - | - | - | |
| 1996 | 8 | 7.8 | - | - | - | - | - | - | |
| 1997 | 7.7 | 7.5 | - | - | - | - | - | - | |
| 1998 | 7.6 | 7.3 | - | - | - | - | - | - | |
| 1999 | 7 | 7.1 | - | - | - | - | - | - | |
| 2000 | 6.7 | 7 | - | - | - | - | - | - | |
| 2001 | 6.9 | 6.8 | - | - | - | - | - | - | |
| 2002 | 6.5 | 6.6 | - | - | - | - | - | - | |
| 2003 | 6.1 | 6.4 | - | - | - | - | - | - | |
| 2004 | 6.2 | 6.2 | - | - | - | - | - | - | |
| 2005 | 6.2 | 6.1 | - | - | - | - | - | - | |
| 2006 | 5.3 | 5.9 | - | - | - | - | - | - | |
| 2007 | 5.9 | 5.8 | - | - | - | - | - | - | |
| 2008 | 5.6 | 5.6 | - | - | - | - | - | - | |
| 2009 | 5.4 | 5.4 | - | - | - | - | - | - | |
| 2010 | 5.5 | 5.3 | - | - | - | - | - | - | |
| 2011 | 5.3 | - | 5 | 5.2 | 5.2 | 5 | 6.4 | 5.6 | |
| 2012 | 4.8 | - | 4.9 | 5 | 5 | 4.8 | 6.9 | 5.6 | |
| 2013 | 4.7 | - | 4.7 | 4.9 | 4.9 | 4.7 | 6.9 | 5.6 | |
| 2014 | 4.6 | - | 4.6 | 4.8 | 4.7 | 4.5 | 6.9 | 5.6 | |
| Female | 1986 | 1.5 | 1.7 | - | - | - | - | - | - |
| 1987 | 1.6 | 1.7 | - | - | - | - | - | - | |
| 1988 | 1.6 | 1.7 | - | - | - | - | - | - | |
| 1989 | 1.6 | 1.6 | - | - | - | - | - | - | |
| 1990 | 1.4 | 1.6 | - | - | - | - | - | - | |
| 1991 | 1.7 | 1.5 | - | - | - | - | - | - | |
| 1992 | 1.5 | 1.5 | - | - | - | - | - | - | |
| 1993 | 1.4 | 1.5 | - | - | - | - | - | - | |
| 1994 | 1.5 | 1.4 | - | - | - | - | - | - | |
| 1995 | 1.6 | 1.4 | - | - | - | - | - | - | |
| 1996 | 1.3 | 1.3 | - | - | - | - | - | - | |
| 1997 | 1.5 | 1.3 | - | - | - | - | - | - | |
| 1998 | 1.4 | 1.3 | - | - | - | - | - | - | |
| 1999 | 1.2 | 1.2 | - | - | - | - | - | - | |
| 2000 | 1.1 | 1.2 | - | - | - | - | - | - | |
| 2001 | 1.1 | 1.2 | - | - | - | - | - | - | |
| 2002 | 1.1 | 1.2 | - | - | - | - | - | - | |
| 2003 | 1.3 | 1.1 | - | - | - | - | - | - | |
| 2004 | 1.2 | 1.1 | - | - | - | - | - | - | |
| 2005 | 1 | 1.1 | - | - | - | - | - | - | |
| 2006 | 0.9 | 1 | - | - | - | - | - | - | |
| 2007 | 1.1 | 1 | - | - | - | - | - | - | |
| 2008 | 1 | 1 | - | - | - | - | - | - | |
| 2009 | 0.9 | 1 | - | - | - | - | - | - | |
| 2010 | 0.9 | 0.9 | - | - | - | - | - | - | |
| 2011 | 1 | - | 0.9 | 0.9 | 0.9 | 0.9 | 1.1 | 1 | |
| 2012 | 0.8 | - | 0.8 | 0.9 | 0.9 | 0.9 | 1.2 | 1 | |
| 2013 | 0.7 | - | 0.8 | 0.8 | 0.9 | 0.9 | 1.2 | 1 | |
| 2014 | 0.7 | - | 0.8 | 0.8 | 0.9 | 0.8 | 1.2 | 1 |
Figure 3. Actual age-standardized incidence rates (1986–2010) and projected age-standardized rates (2011–2014) obtained with Canproj projection models by sex and cancer site, Canada (Section 3 of 7)
Text description: Figure 3 (Section 3 of 7)
Figure 3. Actual age-standardized incidence rates (1986–2010) and projected age-standardized rates (2011–2014) obtained with Canproj projection models by sex and cancer site, Canada (Section 3 of 7)
Lung and bronchus
| Sex | Year | Observed data | Joinpoint | Nordpred | Age-cohort | Hybrid age-specific trend | Hybrid age-common trend | Hybrid age-only | 5-Year average |
|---|---|---|---|---|---|---|---|---|---|
| Male | 1986 | 117 | 119.6 | - | - | - | - | - | - |
| 1987 | 115.4 | 117.4 | - | - | - | - | - | - | |
| 1988 | 116.2 | 115.2 | - | - | - | - | - | - | |
| 1989 | 113.3 | 113 | - | - | - | - | - | - | |
| 1990 | 112.5 | 110.9 | - | - | - | - | - | - | |
| 1991 | 109.2 | 108.9 | - | - | - | - | - | - | |
| 1992 | 109.6 | 106.8 | - | - | - | - | - | - | |
| 1993 | 108 | 104.8 | - | - | - | - | - | - | |
| 1994 | 101.9 | 102.9 | - | - | - | - | - | - | |
| 1995 | 101.2 | 101 | - | - | - | - | - | - | |
| 1996 | 98.8 | 99.1 | - | - | - | - | - | - | |
| 1997 | 94.6 | 97.2 | - | - | - | - | - | - | |
| 1998 | 95.5 | 95.4 | - | - | - | - | - | - | |
| 1999 | 95.5 | 93.6 | - | - | - | - | - | - | |
| 2000 | 90.2 | 91.9 | - | - | - | - | - | - | |
| 2001 | 89.5 | 90.2 | - | - | - | - | - | - | |
| 2002 | 87.1 | 88.5 | - | - | - | - | - | - | |
| 2003 | 84.9 | 86.8 | - | - | - | - | - | - | |
| 2004 | 84.4 | 85.2 | - | - | - | - | - | - | |
| 2005 | 84 | 83.6 | - | - | - | - | - | - | |
| 2006 | 82.8 | 82.1 | - | - | - | - | - | - | |
| 2007 | 82.5 | 80.5 | - | - | - | - | - | - | |
| 2008 | 78 | 79 | - | - | - | - | - | - | |
| 2009 | 78.7 | 77.6 | - | - | - | - | - | - | |
| 2010 | 75.7 | 76.1 | - | - | - | - | - | - | |
| 2011 | 73.1 | - | 72.2 | 73.1 | 74.8 | 73.3 | 94 | 80.1 | |
| 2012 | 73.2 | - | 69.7 | 71 | 73.5 | 71.7 | 94 | 80.1 | |
| 2013 | 71.2 | - | 67.3 | 68.9 | 72.2 | 70.2 | 94 | 80.1 | |
| 2014 | 66.8 | - | 65.8 | 67.3 | 70.9 | 68.8 | 94 | 80.1 | |
| Female | 1986 | 42.6 | 43.4 | - | - | - | - | - | - |
| 1987 | 44.8 | 44.5 | - | - | - | - | - | - | |
| 1988 | 46.8 | 45.7 | - | - | - | - | - | - | |
| 1989 | 46.8 | 47 | - | - | - | - | - | - | |
| 1990 | 48 | 48.2 | - | - | - | - | - | - | |
| 1991 | 48.7 | 49.5 | - | - | - | - | - | - | |
| 1992 | 51.7 | 50.9 | - | - | - | - | - | - | |
| 1993 | 52.4 | 52.2 | - | - | - | - | - | - | |
| 1994 | 50.9 | 52.8 | - | - | - | - | - | - | |
| 1995 | 53.1 | 53.3 | - | - | - | - | - | - | |
| 1996 | 54.4 | 53.9 | - | - | - | - | - | - | |
| 1997 | 54.3 | 54.5 | - | - | - | - | - | - | |
| 1998 | 56.7 | 55.1 | - | - | - | - | - | - | |
| 1999 | 55.8 | 55.7 | - | - | - | - | - | - | |
| 2000 | 57.3 | 56.3 | - | - | - | - | - | - | |
| 2001 | 57.1 | 56.9 | - | - | - | - | - | - | |
| 2002 | 57.1 | 57.5 | - | - | - | - | - | - | |
| 2003 | 56.5 | 58.1 | - | - | - | - | - | - | |
| 2004 | 57.7 | 58.7 | - | - | - | - | - | - | |
| 2005 | 59.9 | 59.3 | - | - | - | - | - | - | |
| 2006 | 60 | 60 | - | - | - | - | - | - | |
| 2007 | 59.9 | 59.6 | - | - | - | - | - | - | |
| 2008 | 59.2 | 59.2 | - | - | - | - | - | - | |
| 2009 | 59.1 | 58.8 | - | - | - | - | - | - | |
| 2010 | 58 | 58.4 | - | - | - | - | - | - | |
| 2011 | 57.6 | - | 58.8 | 58.9 | 62.6 | 60.6 | 55.9 | 59.3 | |
| 2012 | 59 | - | 58.7 | 58.9 | 63.4 | 61 | 55.9 | 59.3 | |
| 2013 | 58.8 | - | 58.6 | 58.8 | 64.3 | 61.5 | 55.9 | 59.3 | |
| 2014 | 56.4 | - | 58.2 | 58.5 | 65.1 | 62 | 55.9 | 59.3 |
Melanoma
| Sex | Year | Observed data | Joinpoint | Nordpred | Age-cohort | Hybrid age-specific trend | Hybrid age-common trend | Hybrid age-only | 5-Year average |
|---|---|---|---|---|---|---|---|---|---|
| Male | 1986 | 13 | 13.2 | - | - | - | - | - | - |
| 1987 | 14 | 13.5 | - | - | - | - | - | - | |
| 1988 | 15.1 | 13.8 | - | - | - | - | - | - | |
| 1989 | 13.5 | 14.1 | - | - | - | - | - | - | |
| 1990 | 14.7 | 14.4 | - | - | - | - | - | - | |
| 1991 | 13.2 | 14.7 | - | - | - | - | - | - | |
| 1992 | 14.7 | 15 | - | - | - | - | - | - | |
| 1993 | 15 | 15.3 | - | - | - | - | - | - | |
| 1994 | 15.6 | 15.6 | - | - | - | - | - | - | |
| 1995 | 16.1 | 15.9 | - | - | - | - | - | - | |
| 1996 | 16 | 16.3 | - | - | - | - | - | - | |
| 1997 | 16.6 | 16.6 | - | - | - | - | - | - | |
| 1998 | 16.2 | 17 | - | - | - | - | - | - | |
| 1999 | 18.8 | 17.3 | - | - | - | - | - | - | |
| 2000 | 18 | 17.7 | - | - | - | - | - | - | |
| 2001 | 18.6 | 18 | - | - | - | - | - | - | |
| 2002 | 17.8 | 18.4 | - | - | - | - | - | - | |
| 2003 | 18.7 | 18.8 | - | - | - | - | - | - | |
| 2004 | 18.7 | 19.2 | - | - | - | - | - | - | |
| 2005 | 18.7 | 19.6 | - | - | - | - | - | - | |
| 2006 | 20.5 | 20 | - | - | - | - | - | - | |
| 2007 | 20.3 | 20.4 | - | - | - | - | - | - | |
| 2008 | 21 | 20.8 | - | - | - | - | - | - | |
| 2009 | 21.8 | 21.3 | - | - | - | - | - | - | |
| 2010 | 21.5 | 21.7 | - | - | - | - | - | - | |
| 2011 | 22.1 | - | 22.1 | 21.1 | 22.3 | 21.3 | 19.1 | 20.7 | |
| 2012 | 21.4 | - | 22.5 | 21.2 | 22.8 | 21.4 | 18.3 | 20.7 | |
| 2013 | 23.1 | - | 22.8 | 21.2 | 23.3 | 21.7 | 18.3 | 20.7 | |
| 2014 | 23.4 | - | 23 | 21.3 | 23.9 | 22 | 18.3 | 20.7 | |
| Female | 1986 | 11.6 | 12.3 | - | - | - | - | - | - |
| 1987 | 12.6 | 12.2 | - | - | - | - | - | - | |
| 1988 | 12.8 | 12.1 | - | - | - | - | - | - | |
| 1989 | 12 | 12 | - | - | - | - | - | - | |
| 1990 | 11.5 | 12 | - | - | - | - | - | - | |
| 1991 | 12 | 11.9 | - | - | - | - | - | - | |
| 1992 | 11.5 | 11.8 | - | - | - | - | - | - | |
| 1993 | 12.3 | 12 | - | - | - | - | - | - | |
| 1994 | 12.1 | 12.2 | - | - | - | - | - | - | |
| 1995 | 12.7 | 12.5 | - | - | - | - | - | - | |
| 1996 | 13.1 | 12.7 | - | - | - | - | - | - | |
| 1997 | 13 | 12.9 | - | - | - | - | - | - | |
| 1998 | 12.9 | 13.2 | - | - | - | - | - | - | |
| 1999 | 13.7 | 13.4 | - | - | - | - | - | - | |
| 2000 | 13.5 | 13.6 | - | - | - | - | - | - | |
| 2001 | 14 | 13.9 | - | - | - | - | - | - | |
| 2002 | 13.8 | 14.1 | - | - | - | - | - | - | |
| 2003 | 13.7 | 14.4 | - | - | - | - | - | - | |
| 2004 | 14.5 | 14.7 | - | - | - | - | - | - | |
| 2005 | 14.7 | 14.9 | - | - | - | - | - | - | |
| 2006 | 15.1 | 15.2 | - | - | - | - | - | - | |
| 2007 | 16 | 15.5 | - | - | - | - | - | - | |
| 2008 | 16 | 15.8 | - | - | - | - | - | - | |
| 2009 | 16.5 | 16.1 | - | - | - | - | - | - | |
| 2010 | 16.1 | 16.3 | - | - | - | - | - | - | |
| 2011 | 17 | - | 16.8 | 15.9 | 16.4 | 16.4 | 14.8 | 15.7 | |
| 2012 | 16.3 | - | 17.1 | 15.9 | 16.6 | 16.6 | 14.3 | 15.7 | |
| 2013 | 18.4 | - | 17.4 | 15.8 | 16.8 | 16.8 | 14.3 | 15.7 | |
| 2014 | 17.7 | - | 17.6 | 15.9 | 17.1 | 17.1 | 14.3 | 15.7 |
Breast
| Sex | Year | Observed data | Joinpoint | Nordpred | Age-cohort | Hybrid age-specific trend | Hybrid age-common trend | Hybrid age-only | 5-Year average |
|---|---|---|---|---|---|---|---|---|---|
| Male | 1986 | 1 | 1 | - | - | - | - | - | - |
| 1987 | 1 | 1.1 | - | - | - | - | - | - | |
| 1988 | 1.2 | 1.1 | - | - | - | - | - | - | |
| 1989 | 1.1 | 1.1 | - | - | - | - | - | - | |
| 1990 | 1 | 1.1 | - | - | - | - | - | - | |
| 1991 | 1 | 1.1 | - | - | - | - | - | - | |
| 1992 | 1 | 1.1 | - | - | - | - | - | - | |
| 1993 | 1.1 | 1.1 | - | - | - | - | - | - | |
| 1994 | 1 | 1.1 | - | - | - | - | - | - | |
| 1995 | 1 | 1.1 | - | - | - | - | - | - | |
| 1996 | 1 | 1.1 | - | - | - | - | - | - | |
| 1997 | 1.2 | 1.1 | - | - | - | - | - | - | |
| 1998 | 1.2 | 1.2 | - | - | - | - | - | - | |
| 1999 | 1.5 | 1.2 | - | - | - | - | - | - | |
| 2000 | 1.1 | 1.2 | - | - | - | - | - | - | |
| 2001 | 1.3 | 1.2 | - | - | - | - | - | - | |
| 2002 | 1.2 | 1.2 | - | - | - | - | - | - | |
| 2003 | 1.5 | 1.2 | - | - | - | - | - | - | |
| 2004 | 1.2 | 1.2 | - | - | - | - | - | - | |
| 2005 | 1.2 | 1.2 | - | - | - | - | - | - | |
| 2006 | 1.1 | 1.2 | - | - | - | - | - | - | |
| 2007 | 1.2 | 1.3 | - | - | - | - | - | - | |
| 2008 | 1 | 1.3 | - | - | - | - | - | - | |
| 2009 | 1.3 | 1.3 | - | - | - | - | - | - | |
| 2010 | 1.3 | 1.3 | - | - | - | - | - | - | |
| 2011 | 1.2 | - | 1.2 | 1.3 | 1.3 | 1.3 | 1.2 | 1.2 | |
| 2012 | 1.3 | - | 1.2 | 1.3 | 1.3 | 1.3 | 1.2 | 1.2 | |
| 2013 | 1.1 | - | 1.2 | 1.3 | 1.3 | 1.3 | 1.2 | 1.2 | |
| 2014 | 1.3 | - | 1.2 | 1.3 | 1.3 | 1.3 | 1.2 | 1.2 | |
| Female | 1986 | 114.5 | 116.5 | - | - | - | - | - | - |
| 1987 | 118 | 119.7 | - | - | - | - | - | - | |
| 1988 | 129.1 | 123 | - | - | - | - | - | - | |
| 1989 | 126.6 | 126.4 | - | - | - | - | - | - | |
| 1990 | 127.2 | 129.9 | - | - | - | - | - | - | |
| 1991 | 133.9 | 133.6 | - | - | - | - | - | - | |
| 1992 | 134.7 | 133.1 | - | - | - | - | - | - | |
| 1993 | 130.3 | 132.7 | - | - | - | - | - | - | |
| 1994 | 129.4 | 132.3 | - | - | - | - | - | - | |
| 1995 | 129 | 131.9 | - | - | - | - | - | - | |
| 1996 | 129 | 131.5 | - | - | - | - | - | - | |
| 1997 | 134.9 | 131.1 | - | - | - | - | - | - | |
| 1998 | 133.1 | 130.7 | - | - | - | - | - | - | |
| 1999 | 136.6 | 130.2 | - | - | - | - | - | - | |
| 2000 | 130 | 129.8 | - | - | - | - | - | - | |
| 2001 | 128.9 | 129.4 | - | - | - | - | - | - | |
| 2002 | 133.4 | 129 | - | - | - | - | - | - | |
| 2003 | 125.1 | 128.6 | - | - | - | - | - | - | |
| 2004 | 125.6 | 128.2 | - | - | - | - | - | - | |
| 2005 | 126.7 | 127.8 | - | - | - | - | - | - | |
| 2006 | 126.2 | 127.4 | - | - | - | - | - | - | |
| 2007 | 126.9 | 127 | - | - | - | - | - | - | |
| 2008 | 123.6 | 126.6 | - | - | - | - | - | - | |
| 2009 | 126.6 | 126.2 | - | - | - | - | - | - | |
| 2010 | 128.7 | 125.8 | - | - | - | - | - | - | |
| 2011 | 129.5 | - | 127.3 | 128 | 125.8 | 126.4 | 126.9 | 126.5 | |
| 2012 | 124.7 | - | 127.5 | 128.5 | 125.6 | 126.3 | 126.9 | 126.5 | |
| 2013 | 124.9 | - | 127.8 | 129.1 | 125.4 | 126.2 | 126.9 | 126.5 | |
| 2014 | 124.3 | - | 127.9 | 129.2 | 125.2 | 126 | 126.9 | 126.5 |
Cervix uteri
| Sex | Year | Observed data | Joinpoint | Nordpred | Age-cohort | Hybrid age-specific trend | Hybrid age-common trend | Hybrid age-only | 5-Year average |
|---|---|---|---|---|---|---|---|---|---|
| Male | 1986 | - | - | - | - | - | - | - | - |
| 1987 | - | - | - | - | - | - | - | - | |
| 1988 | - | - | - | - | - | - | - | - | |
| 1989 | - | - | - | - | - | - | - | - | |
| 1990 | - | - | - | - | - | - | - | - | |
| 1991 | - | - | - | - | - | - | - | - | |
| 1992 | - | - | - | - | - | - | - | - | |
| 1993 | - | - | - | - | - | - | - | - | |
| 1994 | - | - | - | - | - | - | - | - | |
| 1995 | - | - | - | - | - | - | - | - | |
| 1996 | - | - | - | - | - | - | - | - | |
| 1997 | - | - | - | - | - | - | - | - | |
| 1998 | - | - | - | - | - | - | - | - | |
| 1999 | - | - | - | - | - | - | - | - | |
| 2000 | - | - | - | - | - | - | - | - | |
| 2001 | - | - | - | - | - | - | - | - | |
| 2002 | - | - | - | - | - | - | - | - | |
| 2003 | - | - | - | - | - | - | - | - | |
| 2004 | - | - | - | - | - | - | - | - | |
| 2005 | - | - | - | - | - | - | - | - | |
| 2006 | - | - | - | - | - | - | - | - | |
| 2007 | - | - | - | - | - | - | - | - | |
| 2008 | - | - | - | - | - | - | - | - | |
| 2009 | - | - | - | - | - | - | - | - | |
| 2010 | - | - | - | - | - | - | - | - | |
| 2011 | - | - | - | - | - | - | - | - | |
| 2012 | - | - | - | - | - | - | - | - | |
| 2013 | - | - | - | - | - | - | - | - | |
| 2014 | - | - | - | - | - | - | - | - | |
| Female | 1986 | 12.4 | 12.5 | - | - | - | - | - | - |
| 1987 | 11.9 | 12.2 | - | - | - | - | - | - | |
| 1988 | 11.6 | 12 | - | - | - | - | - | - | |
| 1989 | 11.4 | 11.7 | - | - | - | - | - | - | |
| 1990 | 12.2 | 11.5 | - | - | - | - | - | - | |
| 1991 | 11 | 11.3 | - | - | - | - | - | - | |
| 1992 | 11.2 | 11 | - | - | - | - | - | - | |
| 1993 | 11 | 10.8 | - | - | - | - | - | - | |
| 1994 | 10.5 | 10.6 | - | - | - | - | - | - | |
| 1995 | 10.6 | 10.4 | - | - | - | - | - | - | |
| 1996 | 10.6 | 10.2 | - | - | - | - | - | - | |
| 1997 | 9.8 | 10 | - | - | - | - | - | - | |
| 1998 | 9.7 | 9.8 | - | - | - | - | - | - | |
| 1999 | 9.7 | 9.6 | - | - | - | - | - | - | |
| 2000 | 9.3 | 9.4 | - | - | - | - | - | - | |
| 2001 | 9 | 9.2 | - | - | - | - | - | - | |
| 2002 | 9 | 9 | - | - | - | - | - | - | |
| 2003 | 8.9 | 8.8 | - | - | - | - | - | - | |
| 2004 | 8.6 | 8.6 | - | - | - | - | - | - | |
| 2005 | 8.1 | 8.5 | - | - | - | - | - | - | |
| 2006 | 8.1 | 8.3 | - | - | - | - | - | - | |
| 2007 | 8.7 | 8.4 | - | - | - | - | - | - | |
| 2008 | 8.3 | 8.5 | - | - | - | - | - | - | |
| 2009 | 8.8 | 8.5 | - | - | - | - | - | - | |
| 2010 | 8.4 | 8.6 | - | - | - | - | - | - | |
| 2011 | 8.2 | - | 12.4 | 12.5 | 12.4 | 12.5 | 12.4 | 12.5 | |
| 2012 | 7.8 | - | 11.9 | 12.2 | 11.9 | 12.2 | 11.9 | 12.2 | |
| 2013 | 7.7 | - | 11.6 | 12 | 11.6 | 12 | 11.6 | 12 | |
| 2014 | 7.4 | - | 11.4 | 11.7 | 11.4 | 11.7 | 11.4 | 11.7 |
Figure 3. Actual age-standardized incidence rates (1986–2010) and projected age-standardized rates (2011–2014) obtained with Canproj projection models by sex and cancer site, Canada (Section 4 of 7)
Text description: Figure 3 (Section 4 of 7)
Figure 3. Actual age-standardized incidence rates (1986–2010) and projected age-standardized rates (2011–2014) obtained with Canproj projection models by sex and cancer site, Canada (Section 4 of 7)
Uterus
| Sex | Year | Observed data | Joinpoint | Nordpred | Age-cohort | Hybrid age-specific trend | Hybrid age-common trend | Hybrid age-only | 5-Year average |
|---|---|---|---|---|---|---|---|---|---|
| Male | 1986 | - | - | - | - | - | - | - | - |
| 1987 | - | - | - | - | - | - | - | - | |
| 1988 | - | - | - | - | - | - | - | - | |
| 1989 | - | - | - | - | - | - | - | - | |
| 1990 | - | - | - | - | - | - | - | - | |
| 1991 | - | - | - | - | - | - | - | - | |
| 1992 | - | - | - | - | - | - | - | - | |
| 1993 | - | - | - | - | - | - | - | - | |
| 1994 | - | - | - | - | - | - | - | - | |
| 1995 | - | - | - | - | - | - | - | - | |
| 1996 | - | - | - | - | - | - | - | - | |
| 1997 | - | - | - | - | - | - | - | - | |
| 1998 | - | - | - | - | - | - | - | - | |
| 1999 | - | - | - | - | - | - | - | - | |
| 2000 | - | - | - | - | - | - | - | - | |
| 2001 | - | - | - | - | - | - | - | - | |
| 2002 | - | - | - | - | - | - | - | - | |
| 2003 | - | - | - | - | - | - | - | - | |
| 2004 | - | - | - | - | - | - | - | - | |
| 2005 | - | - | - | - | - | - | - | - | |
| 2006 | - | - | - | - | - | - | - | - | |
| 2007 | - | - | - | - | - | - | - | - | |
| 2008 | - | - | - | - | - | - | - | - | |
| 2009 | - | - | - | - | - | - | - | - | |
| 2010 | - | - | - | - | - | - | - | - | |
| 2011 | - | - | - | - | - | - | - | - | |
| 2012 | - | - | - | - | - | - | - | - | |
| 2013 | - | - | - | - | - | - | - | - | |
| 2014 | - | - | - | - | - | - | - | - | |
| Female | 1986 | 25.2 | 25.3 | - | - | - | - | - | - |
| 1987 | 27.1 | 25.4 | - | - | - | - | - | - | |
| 1988 | 27.2 | 25.5 | - | - | - | - | - | - | |
| 1989 | 24.3 | 25.5 | - | - | - | - | - | - | |
| 1990 | 24.8 | 25.6 | - | - | - | - | - | - | |
| 1991 | 25.3 | 25.7 | - | - | - | - | - | - | |
| 1992 | 25.1 | 25.7 | - | - | - | - | - | - | |
| 1993 | 26.5 | 25.8 | - | - | - | - | - | - | |
| 1994 | 25.3 | 25.9 | - | - | - | - | - | - | |
| 1995 | 24.6 | 25.9 | - | - | - | - | - | - | |
| 1996 | 25.8 | 26 | - | - | - | - | - | - | |
| 1997 | 25.9 | 26.1 | - | - | - | - | - | - | |
| 1998 | 26 | 26.1 | - | - | - | - | - | - | |
| 1999 | 26 | 26.2 | - | - | - | - | - | - | |
| 2000 | 26.6 | 26.3 | - | - | - | - | - | - | |
| 2001 | 26.1 | 26.3 | - | - | - | - | - | - | |
| 2002 | 27.1 | 26.4 | - | - | - | - | - | - | |
| 2003 | 26.5 | 26.5 | - | - | - | - | - | - | |
| 2004 | 26.8 | 26.5 | - | - | - | - | - | - | |
| 2005 | 26.4 | 26.6 | - | - | - | - | - | - | |
| 2006 | 27.7 | 27.3 | - | - | - | - | - | - | |
| 2007 | 28.5 | 28 | - | - | - | - | - | - | |
| 2008 | 28 | 28.8 | - | - | - | - | - | - | |
| 2009 | 29.5 | 29.6 | - | - | - | - | - | - | |
| 2010 | 30.7 | 30.4 | - | - | - | - | - | - | |
| 2011 | 31.7 | - | 30.4 | 29.1 | 30.4 | 31.1 | 28.5 | 28.5 | |
| 2012 | 32.4 | - | 31 | 29.1 | 30.9 | 32 | 28.5 | 28.5 | |
| 2013 | 31.7 | - | 31.5 | 29.2 | 31.5 | 32.8 | 28.5 | 28.5 | |
| 2014 | 31.2 | - | 32 | 29.4 | 32 | 33.6 | 28.5 | 28.5 |
Ovary
| Sex | Year | Observed data | Joinpoint | Nordpred | Age-cohort | Hybrid age-specific trend | Hybrid age-common trend | Hybrid age-only | 5-Year average |
|---|---|---|---|---|---|---|---|---|---|
| Male | 1986 | - | - | - | - | - | - | - | - |
| 1987 | - | - | - | - | - | - | - | - | |
| 1988 | - | - | - | - | - | - | - | - | |
| 1989 | - | - | - | - | - | - | - | - | |
| 1990 | - | - | - | - | - | - | - | - | |
| 1991 | - | - | - | - | - | - | - | - | |
| 1992 | - | - | - | - | - | - | - | - | |
| 1993 | - | - | - | - | - | - | - | - | |
| 1994 | - | - | - | - | - | - | - | - | |
| 1995 | - | - | - | - | - | - | - | - | |
| 1996 | - | - | - | - | - | - | - | - | |
| 1997 | - | - | - | - | - | - | - | - | |
| 1998 | - | - | - | - | - | - | - | - | |
| 1999 | - | - | - | - | - | - | - | - | |
| 2000 | - | - | - | - | - | - | - | - | |
| 2001 | - | - | - | - | - | - | - | - | |
| 2002 | - | - | - | - | - | - | - | - | |
| 2003 | - | - | - | - | - | - | - | - | |
| 2004 | - | - | - | - | - | - | - | - | |
| 2005 | - | - | - | - | - | - | - | - | |
| 2006 | - | - | - | - | - | - | - | - | |
| 2007 | - | - | - | - | - | - | - | - | |
| 2008 | - | - | - | - | - | - | - | - | |
| 2009 | - | - | - | - | - | - | - | - | |
| 2010 | - | - | - | - | - | - | - | - | |
| 2011 | - | - | - | - | - | - | - | - | |
| 2012 | - | - | - | - | - | - | - | - | |
| 2013 | - | - | - | - | - | - | - | - | |
| 2014 | - | - | - | - | - | - | - | - | |
| Female | 1986 | 16.8 | 17.1 | - | - | - | - | - | - |
| 1987 | 17.4 | 17 | - | - | - | - | - | - | |
| 1988 | 17.8 | 16.9 | - | - | - | - | - | - | |
| 1989 | 16.8 | 16.7 | - | - | - | - | - | - | |
| 1990 | 16.9 | 16.6 | - | - | - | - | - | - | |
| 1991 | 16.7 | 16.5 | - | - | - | - | - | - | |
| 1992 | 16 | 16.3 | - | - | - | - | - | - | |
| 1993 | 16 | 16.2 | - | - | - | - | - | - | |
| 1994 | 15.2 | 16.1 | - | - | - | - | - | - | |
| 1995 | 16.4 | 15.9 | - | - | - | - | - | - | |
| 1996 | 15 | 15.8 | - | - | - | - | - | - | |
| 1997 | 15.2 | 15.7 | - | - | - | - | - | - | |
| 1998 | 15.4 | 15.5 | - | - | - | - | - | - | |
| 1999 | 14.8 | 15.4 | - | - | - | - | - | - | |
| 2000 | 15 | 15.3 | - | - | - | - | - | - | |
| 2001 | 15.4 | 15.2 | - | - | - | - | - | - | |
| 2002 | 15.8 | 15.1 | - | - | - | - | - | - | |
| 2003 | 15.1 | 14.9 | - | - | - | - | - | - | |
| 2004 | 14.4 | 14.8 | - | - | - | - | - | - | |
| 2005 | 15.4 | 14.7 | - | - | - | - | - | - | |
| 2006 | 14.7 | 14.6 | - | - | - | - | - | - | |
| 2007 | 14.6 | 14.4 | - | - | - | - | - | - | |
| 2008 | 14.2 | 14.3 | - | - | - | - | - | - | |
| 2009 | 13.8 | 14.2 | - | - | - | - | - | - | |
| 2010 | 14.3 | 14.1 | - | - | - | - | - | - | |
| 2011 | 13.9 | - | 14 | 14 | 13.9 | 14.1 | 15 | 14.5 | |
| 2012 | 13.7 | - | 13.8 | 13.9 | 13.8 | 14 | 15.4 | 14.5 | |
| 2013 | 14.4 | - | 13.7 | 13.7 | 13.7 | 13.9 | 15.4 | 14.5 | |
| 2014 | 13.8 | - | 13.6 | 13.7 | 13.6 | 13.8 | 15.4 | 14.5 |
Prostate
| Sex | Year | Observed data | Joinpoint | Nordpred | Age-cohort | Hybrid age-specific trend | Hybrid age-common trend | Hybrid age-only | 5-Year average |
|---|---|---|---|---|---|---|---|---|---|
| Male | 1986 | 117.2 | 109.4 | - | - | - | - | - | - |
| 1987 | 122.6 | 117.8 | - | - | - | - | - | - | |
| 1988 | 124.6 | 126.9 | - | - | - | - | - | - | |
| 1989 | 126.4 | 136.8 | - | - | - | - | - | - | |
| 1990 | 138.3 | 147.3 | - | - | - | - | - | - | |
| 1991 | 157.6 | 158.7 | - | - | - | - | - | - | |
| 1992 | 174.6 | 171 | - | - | - | - | - | - | |
| 1993 | 192.5 | 184.2 | - | - | - | - | - | - | |
| 1994 | 175 | 173.8 | - | - | - | - | - | - | |
| 1995 | 153.6 | 164 | - | - | - | - | - | - | |
| 1996 | 156.1 | 154.7 | - | - | - | - | - | - | |
| 1997 | 166.1 | 160.3 | - | - | - | - | - | - | |
| 1998 | 165.9 | 166.1 | - | - | - | - | - | - | |
| 1999 | 172.3 | 172.1 | - | - | - | - | - | - | |
| 2000 | 177.9 | 178.3 | - | - | - | - | - | - | |
| 2001 | 191 | 184.7 | - | - | - | - | - | - | |
| 2002 | 176.6 | 181.8 | - | - | - | - | - | - | |
| 2003 | 167.7 | 178.9 | - | - | - | - | - | - | |
| 2004 | 171.7 | 176 | - | - | - | - | - | - | |
| 2005 | 172 | 173.2 | - | - | - | - | - | - | |
| 2006 | 180.8 | 170.4 | - | - | - | - | - | - | |
| 2007 | 180.7 | 167.7 | - | - | - | - | - | - | |
| 2008 | 164 | 165 | - | - | - | - | - | - | |
| 2009 | 159 | 162.4 | - | - | - | - | - | - | |
| 2010 | 154 | 159.8 | - | - | - | - | - | - | |
| 2011 | 157.1 | - | 180.4 | 215.3 | 176 | 180.4 | 168.7 | 167.9 | |
| 2012 | 133.1 | - | 184.9 | 231.4 | 177.5 | 181.6 | 168.7 | 167.9 | |
| 2013 | 119.9 | - | 189.3 | 247.5 | 179.1 | 182.8 | 168.7 | 167.9 | |
| 2014 | 112.4 | - | 193.5 | 256.8 | 180.9 | 184 | 168.7 | 167.9 | |
| Female | 1986 | - | - | - | - | - | - | - | - |
| 1987 | - | - | - | - | - | - | - | - | |
| 1988 | - | - | - | - | - | - | - | - | |
| 1989 | - | - | - | - | - | - | - | - | |
| 1990 | - | - | - | - | - | - | - | - | |
| 1991 | - | - | - | - | - | - | - | - | |
| 1992 | - | - | - | - | - | - | - | - | |
| 1993 | - | - | - | - | - | - | - | - | |
| 1994 | - | - | - | - | - | - | - | - | |
| 1995 | - | - | - | - | - | - | - | - | |
| 1996 | - | - | - | - | - | - | - | - | |
| 1997 | - | - | - | - | - | - | - | - | |
| 1998 | - | - | - | - | - | - | - | - | |
| 1999 | - | - | - | - | - | - | - | - | |
| 2000 | - | - | - | - | - | - | - | - | |
| 2001 | - | - | - | - | - | - | - | - | |
| 2002 | - | - | - | - | - | - | - | - | |
| 2003 | - | - | - | - | - | - | - | - | |
| 2004 | - | - | - | - | - | - | - | - | |
| 2005 | - | - | - | - | - | - | - | - | |
| 2006 | - | - | - | - | - | - | - | - | |
| 2007 | - | - | - | - | - | - | - | - | |
| 2008 | - | - | - | - | - | - | - | - | |
| 2009 | - | - | - | - | - | - | - | - | |
| 2010 | - | - | - | - | - | - | - | - | |
| 2011 | - | - | - | - | - | - | - | - | |
| 2012 | - | - | - | - | - | - | - | - | |
| 2013 | - | - | - | - | - | - | - | - | |
| 2014 | - | - | - | - | - | - | - | - |
Testis
| Sex | Year | Observed data | Joinpoint | Nordpred | Age-cohort | Hybrid age-specific trend | Hybrid age-common trend | Hybrid age-only | 5-Year average |
|---|---|---|---|---|---|---|---|---|---|
| Male | 1986 | 4.2 | 4.2 | - | - | - | - | - | - |
| 1987 | 4.5 | 4.2 | - | - | - | - | - | - | |
| 1988 | 3.9 | 4.3 | - | - | - | - | - | - | |
| 1989 | 4.6 | 4.3 | - | - | - | - | - | - | |
| 1990 | 4.6 | 4.4 | - | - | - | - | - | - | |
| 1991 | 4.1 | 4.4 | - | - | - | - | - | - | |
| 1992 | 4.1 | 4.5 | - | - | - | - | - | - | |
| 1993 | 4.7 | 4.5 | - | - | - | - | - | - | |
| 1994 | 5 | 4.6 | - | - | - | - | - | - | |
| 1995 | 4.2 | 4.6 | - | - | - | - | - | - | |
| 1996 | 4.7 | 4.7 | - | - | - | - | - | - | |
| 1997 | 5 | 4.8 | - | - | - | - | - | - | |
| 1998 | 4.4 | 4.8 | - | - | - | - | - | - | |
| 1999 | 5 | 4.9 | - | - | - | - | - | - | |
| 2000 | 4.9 | 4.9 | - | - | - | - | - | - | |
| 2001 | 5.1 | 5 | - | - | - | - | - | - | |
| 2002 | 5 | 5 | - | - | - | - | - | - | |
| 2003 | 4.9 | 5.1 | - | - | - | - | - | - | |
| 2004 | 5.1 | 5.2 | - | - | - | - | - | - | |
| 2005 | 5.3 | 5.2 | - | - | - | - | - | - | |
| 2006 | 5.3 | 5.3 | - | - | - | - | - | - | |
| 2007 | 5.1 | 5.4 | - | - | - | - | - | - | |
| 2008 | 5.7 | 5.4 | - | - | - | - | - | - | |
| 2009 | 5.3 | 5.5 | - | - | - | - | - | - | |
| 2010 | 5.7 | 5.6 | - | - | - | - | - | - | |
| 2011 | 6 | - | 5.6 | 5.6 | 5.7 | 5.7 | 5.2 | 5.4 | |
| 2012 | 5.6 | - | 5.7 | 5.7 | 5.7 | 5.7 | 4.9 | 5.4 | |
| 2013 | 5.7 | - | 5.8 | 5.8 | 5.8 | 5.8 | 4.9 | 5.4 | |
| 2014 | 5.9 | - | 5.8 | 5.9 | 5.9 | 5.8 | 4.9 | 5.4 | |
| Female | 1986 | - | - | - | - | - | - | - | - |
| 1987 | - | - | - | - | - | - | - | - | |
| 1988 | - | - | - | - | - | - | - | - | |
| 1989 | - | - | - | - | - | - | - | - | |
| 1990 | - | - | - | - | - | - | - | - | |
| 1991 | - | - | - | - | - | - | - | - | |
| 1992 | - | - | - | - | - | - | - | - | |
| 1993 | - | - | - | - | - | - | - | - | |
| 1994 | - | - | - | - | - | - | - | - | |
| 1995 | - | - | - | - | - | - | - | - | |
| 1996 | - | - | - | - | - | - | - | - | |
| 1997 | - | - | - | - | - | - | - | - | |
| 1998 | - | - | - | - | - | - | - | - | |
| 1999 | - | - | - | - | - | - | - | - | |
| 2000 | - | - | - | - | - | - | - | - | |
| 2001 | - | - | - | - | - | - | - | - | |
| 2002 | - | - | - | - | - | - | - | - | |
| 2003 | - | - | - | - | - | - | - | - | |
| 2004 | - | - | - | - | - | - | - | - | |
| 2005 | - | - | - | - | - | - | - | - | |
| 2006 | - | - | - | - | - | - | - | - | |
| 2007 | - | - | - | - | - | - | - | - | |
| 2008 | - | - | - | - | - | - | - | - | |
| 2009 | - | - | - | - | - | - | - | - | |
| 2010 | - | - | - | - | - | - | - | - | |
| 2011 | - | - | - | - | - | - | - | - | |
| 2012 | - | - | - | - | - | - | - | - | |
| 2013 | - | - | - | - | - | - | - | - | |
| 2014 | - | - | - | - | - | - | - | - |
Figure 3. Actual age-standardized incidence rates (1986–2010) and projected age-standardized rates (2011–2014) obtained with Canproj projection models by sex and cancer site, Canada (Section 5 of 7)
Text description: Figure 3 (Section 5 of 7)
Figure 3. Actual age-standardized incidence rates (1986–2010) and projected age-standardized rates (2011–2014) obtained with Canproj projection models by sex and cancer site, Canada (Section 5 of 7)
Urinary bladder
| Sex | Year | Observed data | Joinpoint | Nordpred | Age-cohort | Hybrid age-specific trend | Hybrid age-common trend | Hybrid age-only | 5-Year average |
|---|---|---|---|---|---|---|---|---|---|
| Male | 1986 | 41.9 | 43.8 | - | - | - | - | - | - |
| 1987 | 43.7 | 42.3 | - | - | - | - | - | - | |
| 1988 | 42.6 | 40.7 | - | - | - | - | - | - | |
| 1989 | 38.2 | 39.3 | - | - | - | - | - | - | |
| 1990 | 37.5 | 37.9 | - | - | - | - | - | - | |
| 1991 | 37.3 | 37.6 | - | - | - | - | - | - | |
| 1992 | 38.2 | 37.4 | - | - | - | - | - | - | |
| 1993 | 37.5 | 37.1 | - | - | - | - | - | - | |
| 1994 | 36.8 | 36.9 | - | - | - | - | - | - | |
| 1995 | 36.7 | 36.6 | - | - | - | - | - | - | |
| 1996 | 35.4 | 36.4 | - | - | - | - | - | - | |
| 1997 | 37.5 | 36.1 | - | - | - | - | - | - | |
| 1998 | 34.9 | 35.9 | - | - | - | - | - | - | |
| 1999 | 37.6 | 35.6 | - | - | - | - | - | - | |
| 2000 | 35.3 | 35.4 | - | - | - | - | - | - | |
| 2001 | 34 | 35.1 | - | - | - | - | - | - | |
| 2002 | 33.6 | 34.9 | - | - | - | - | - | - | |
| 2003 | 34.5 | 34.7 | - | - | - | - | - | - | |
| 2004 | 34.7 | 34.4 | - | - | - | - | - | - | |
| 2005 | 33.1 | 34.2 | - | - | - | - | - | - | |
| 2006 | 33.7 | 33.9 | - | - | - | - | - | - | |
| 2007 | 32.5 | 33.7 | - | - | - | - | - | - | |
| 2008 | 33.9 | 33.5 | - | - | - | - | - | - | |
| 2009 | 34.1 | 33.3 | - | - | - | - | - | - | |
| 2010 | 34.1 | 33 | - | - | - | - | - | - | |
| 2011 | 34.3 | - | 33.3 | 31.8 | 32.6 | 31.9 | 35.5 | 33.6 | |
| 2012 | 32.6 | - | 33.2 | 31.1 | 32.4 | 31.5 | 35.5 | 33.6 | |
| 2013 | 45.4 | - | 33 | 30.5 | 32.1 | 31.2 | 35.5 | 33.6 | |
| 2014 | 39.8 | - | 32.9 | 30.1 | 31.9 | 30.9 | 35.5 | 33.6 | |
| Female | 1986 | 10.3 | 10.7 | - | - | - | - | - | - |
| 1987 | 11.1 | 10.6 | - | - | - | - | - | - | |
| 1988 | 11.9 | 10.5 | - | - | - | - | - | - | |
| 1989 | 10 | 10.4 | - | - | - | - | - | - | |
| 1990 | 10.2 | 10.3 | - | - | - | - | - | - | |
| 1991 | 9.8 | 10.2 | - | - | - | - | - | - | |
| 1992 | 9.4 | 10.1 | - | - | - | - | - | - | |
| 1993 | 10.2 | 10 | - | - | - | - | - | - | |
| 1994 | 9.5 | 10 | - | - | - | - | - | - | |
| 1995 | 9.8 | 9.9 | - | - | - | - | - | - | |
| 1996 | 9.5 | 9.8 | - | - | - | - | - | - | |
| 1997 | 9.8 | 9.7 | - | - | - | - | - | - | |
| 1998 | 10.3 | 9.6 | - | - | - | - | - | - | |
| 1999 | 9.6 | 9.5 | - | - | - | - | - | - | |
| 2000 | 9 | 9.5 | - | - | - | - | - | - | |
| 2001 | 9.2 | 9.4 | - | - | - | - | - | - | |
| 2002 | 9.1 | 9.3 | - | - | - | - | - | - | |
| 2003 | 9.7 | 9.2 | - | - | - | - | - | - | |
| 2004 | 9.1 | 9.1 | - | - | - | - | - | - | |
| 2005 | 9.4 | 9.1 | - | - | - | - | - | - | |
| 2006 | 8.9 | 9 | - | - | - | - | - | - | |
| 2007 | 9.1 | 8.9 | - | - | - | - | - | - | |
| 2008 | 8.4 | 8.8 | - | - | - | - | - | - | |
| 2009 | 9 | 8.8 | - | - | - | - | - | - | |
| 2010 | 8.6 | 8.7 | - | - | - | - | - | - | |
| 2011 | 8.8 | - | 8.5 | 8.5 | 8.6 | 8.5 | 9.2 | 8.9 | |
| 2012 | 8.8 | - | 8.5 | 8.4 | 8.5 | 8.4 | 9.5 | 8.9 | |
| 2013 | 11.5 | - | 8.4 | 8.4 | 8.5 | 8.3 | 9.5 | 8.9 | |
| 2014 | 10.9 | - | 8.3 | 8.3 | 8.4 | 8.2 | 9.5 | 8.9 |
Kidney and renal pelvis
| Sex | Year | Observed data | Joinpoint | Nordpred | Age-cohort | Hybrid age-specific trend | Hybrid age-common trend | Hybrid age-only | 5-Year average |
|---|---|---|---|---|---|---|---|---|---|
| Male | 1986 | 14.2 | 14 | - | - | - | - | - | - |
| 1987 | 15.2 | 15.5 | - | - | - | - | - | - | |
| 1988 | 17.1 | 17.1 | - | - | - | - | - | - | |
| 1989 | 17.3 | 17.1 | - | - | - | - | - | - | |
| 1990 | 16.4 | 17 | - | - | - | - | - | - | |
| 1991 | 17.3 | 16.9 | - | - | - | - | - | - | |
| 1992 | 16.8 | 16.9 | - | - | - | - | - | - | |
| 1993 | 17.2 | 16.8 | - | - | - | - | - | - | |
| 1994 | 16.8 | 16.7 | - | - | - | - | - | - | |
| 1995 | 16.2 | 16.7 | - | - | - | - | - | - | |
| 1996 | 16.7 | 16.6 | - | - | - | - | - | - | |
| 1997 | 17.3 | 16.6 | - | - | - | - | - | - | |
| 1998 | 16.1 | 16.5 | - | - | - | - | - | - | |
| 1999 | 16.9 | 16.7 | - | - | - | - | - | - | |
| 2000 | 17.4 | 17 | - | - | - | - | - | - | |
| 2001 | 16.9 | 17.3 | - | - | - | - | - | - | |
| 2002 | 17.7 | 17.5 | - | - | - | - | - | - | |
| 2003 | 17 | 17.8 | - | - | - | - | - | - | |
| 2004 | 17.3 | 18 | - | - | - | - | - | - | |
| 2005 | 18 | 18.3 | - | - | - | - | - | - | |
| 2006 | 19.2 | 18.6 | - | - | - | - | - | - | |
| 2007 | 20 | 18.9 | - | - | - | - | - | - | |
| 2008 | 19 | 19.2 | - | - | - | - | - | - | |
| 2009 | 19.1 | 19.5 | - | - | - | - | - | - | |
| 2010 | 19.7 | 19.8 | - | - | - | - | - | - | |
| 2011 | 14.2 | 14 | 20.7 | 19.5 | 20 | 19.9 | 18.5 | 19.2 | |
| 2012 | 15.2 | 15.5 | 21.2 | 19.6 | 20.3 | 20.3 | 18.3 | 19.2 | |
| 2013 | 17.1 | 17.1 | 21.6 | 19.6 | 20.7 | 20.6 | 18.3 | 19.2 | |
| 2014 | 17.3 | 17.1 | 22 | 19.8 | 21 | 20.9 | 18.3 | 19.2 | |
| Female | 1986 | 8.3 | 8.3 | - | - | - | - | - | - |
| 1987 | 9.3 | 8.4 | - | - | - | - | - | - | |
| 1988 | 8.2 | 8.5 | - | - | - | - | - | - | |
| 1989 | 8.6 | 8.5 | - | - | - | - | - | - | |
| 1990 | 9.1 | 8.6 | - | - | - | - | - | - | |
| 1991 | 8.8 | 8.7 | - | - | - | - | - | - | |
| 1992 | 8.8 | 8.8 | - | - | - | - | - | - | |
| 1993 | 9 | 8.9 | - | - | - | - | - | - | |
| 1994 | 8.8 | 9 | - | - | - | - | - | - | |
| 1995 | 9.3 | 9.1 | - | - | - | - | - | - | |
| 1996 | 9.1 | 9.2 | - | - | - | - | - | - | |
| 1997 | 8.6 | 9.3 | - | - | - | - | - | - | |
| 1998 | 8.8 | 9.4 | - | - | - | - | - | - | |
| 1999 | 9.1 | 9.5 | - | - | - | - | - | - | |
| 2000 | 9.7 | 9.6 | - | - | - | - | - | - | |
| 2001 | 9.7 | 9.7 | - | - | - | - | - | - | |
| 2002 | 9.6 | 9.8 | - | - | - | - | - | - | |
| 2003 | 9.6 | 9.9 | - | - | - | - | - | - | |
| 2004 | 9.5 | 10 | - | - | - | - | - | - | |
| 2005 | 9.7 | 10.1 | - | - | - | - | - | - | |
| 2006 | 10.1 | 10.2 | - | - | - | - | - | - | |
| 2007 | 11.8 | 10.3 | - | - | - | - | - | - | |
| 2008 | 10.6 | 10.4 | - | - | - | - | - | - | |
| 2009 | 10.9 | 10.5 | - | - | - | - | - | - | |
| 2010 | 10.2 | 10.6 | - | - | - | - | - | - | |
| 2011 | 10.3 | - | 11.4 | 10.8 | 10.7 | 10.7 | 9.9 | 10.6 | |
| 2012 | 11.2 | - | 11.6 | 10.8 | 10.8 | 10.8 | 9.5 | 10.6 | |
| 2013 | 10.4 | - | 11.8 | 10.8 | 10.9 | 10.9 | 9.5 | 10.6 | |
| 2014 | 9.9 | - | 12 | 10.9 | 11 | 11 | 9.5 | 10.6 |
Brain/CNS
| Sex | Year | Observed data | Joinpoint | Nordpred | Age-cohort | Hybrid age-specific trend | Hybrid age-common trend | Hybrid age-only | 5-Year average |
|---|---|---|---|---|---|---|---|---|---|
| Male | 1986 | 9.3 | 9.7 | - | - | - | - | - | - |
| 1987 | 9.7 | 9.6 | - | - | - | - | - | - | |
| 1988 | 10.2 | 9.6 | - | - | - | - | - | - | |
| 1989 | 9 | 9.6 | - | - | - | - | - | - | |
| 1990 | 9.7 | 9.6 | - | - | - | - | - | - | |
| 1991 | 9.8 | 9.5 | - | - | - | - | - | - | |
| 1992 | 9.7 | 9.5 | - | - | - | - | - | - | |
| 1993 | 9.4 | 9.5 | - | - | - | - | - | - | |
| 1994 | 9.2 | 9.5 | - | - | - | - | - | - | |
| 1995 | 9.5 | 9.4 | - | - | - | - | - | - | |
| 1996 | 9.3 | 9.4 | - | - | - | - | - | - | |
| 1997 | 9.3 | 9.4 | - | - | - | - | - | - | |
| 1998 | 9.3 | 9.4 | - | - | - | - | - | - | |
| 1999 | 9.9 | 9.3 | - | - | - | - | - | - | |
| 2000 | 9.4 | 9.3 | - | - | - | - | - | - | |
| 2001 | 9.1 | 9.3 | - | - | - | - | - | - | |
| 2002 | 9.2 | 9.3 | - | - | - | - | - | - | |
| 2003 | 9.5 | 9.2 | - | - | - | - | - | - | |
| 2004 | 8.8 | 9.2 | - | - | - | - | - | - | |
| 2005 | 9 | 9.2 | - | - | - | - | - | - | |
| 2006 | 8.9 | 9.2 | - | - | - | - | - | - | |
| 2007 | 9.4 | 9.1 | - | - | - | - | - | - | |
| 2008 | 9.5 | 9.1 | - | - | - | - | - | - | |
| 2009 | 9.1 | 9.1 | - | - | - | - | - | - | |
| 2010 | 8.8 | 9.1 | - | - | - | - | - | - | |
| 2011 | 9.1 | - | 9 | 9 | 9.1 | 9 | 9.2 | 9.1 | |
| 2012 | 8.6 | - | 9 | 8.9 | 9 | 8.9 | 9.3 | 9.1 | |
| 2013 | 8.6 | - | 9 | 8.9 | 9 | 8.9 | 9.3 | 9.1 | |
| 2014 | 7.6 | - | 8.9 | 8.8 | 9 | 8.9 | 9.3 | 9.1 | |
| Female | 1986 | 6.7 | 6.9 | - | - | - | - | - | - |
| 1987 | 7 | 6.9 | - | - | - | - | - | - | |
| 1988 | 7.1 | 6.9 | - | - | - | - | - | - | |
| 1989 | 6.5 | 6.8 | - | - | - | - | - | - | |
| 1990 | 6.8 | 6.8 | - | - | - | - | - | - | |
| 1991 | 6.9 | 6.8 | - | - | - | - | - | - | |
| 1992 | 6.2 | 6.8 | - | - | - | - | - | - | |
| 1993 | 6.6 | 6.7 | - | - | - | - | - | - | |
| 1994 | 6.9 | 6.7 | - | - | - | - | - | - | |
| 1995 | 6.8 | 6.7 | - | - | - | - | - | - | |
| 1996 | 6.3 | 6.7 | - | - | - | - | - | - | |
| 1997 | 7 | 6.6 | - | - | - | - | - | - | |
| 1998 | 6.6 | 6.6 | - | - | - | - | - | - | |
| 1999 | 7.1 | 6.6 | - | - | - | - | - | - | |
| 2000 | 6.6 | 6.6 | - | - | - | - | - | - | |
| 2001 | 6.8 | 6.5 | - | - | - | - | - | - | |
| 2002 | 6.5 | 6.5 | - | - | - | - | - | - | |
| 2003 | 6.4 | 6.5 | - | - | - | - | - | - | |
| 2004 | 6 | 6.5 | - | - | - | - | - | - | |
| 2005 | 6.6 | 6.4 | - | - | - | - | - | - | |
| 2006 | 6.1 | 6.4 | - | - | - | - | - | - | |
| 2007 | 6.5 | 6.4 | - | - | - | - | - | - | |
| 2008 | 6.4 | 6.4 | - | - | - | - | - | - | |
| 2009 | 6.5 | 6.3 | - | - | - | - | - | - | |
| 2010 | 6.1 | 6.3 | - | - | - | - | - | - | |
| 2011 | 6.5 | - | 6.3 | 6.2 | 6.3 | 6.3 | 6.5 | 6.4 | |
| 2012 | 6.2 | - | 6.3 | 6.2 | 6.3 | 6.3 | 6.5 | 6.4 | |
| 2013 | 5.8 | - | 6.2 | 6.2 | 6.3 | 6.2 | 6.5 | 6.4 | |
| 2014 | 5.2 | - | 6.2 | 6.1 | 6.3 | 6.2 | 6.5 | 6.4 |
Thyroid
| Sex | Year | Observed data | Joinpoint | Nordpred | Age-cohort | Hybrid age-specific trend | Hybrid age-common trend | Hybrid age-only | 5-Year average |
|---|---|---|---|---|---|---|---|---|---|
| Male | 1986 | 2.5 | 2.5 | - | - | - | - | - | - |
| 1987 | 2.7 | 2.5 | - | - | - | - | - | - | |
| 1988 | 2.5 | 2.6 | - | - | - | - | - | - | |
| 1989 | 2.3 | 2.7 | - | - | - | - | - | - | |
| 1990 | 2.7 | 2.7 | - | - | - | - | - | - | |
| 1991 | 3 | 2.8 | - | - | - | - | - | - | |
| 1992 | 2.5 | 2.9 | - | - | - | - | - | - | |
| 1993 | 2.9 | 2.9 | - | - | - | - | - | - | |
| 1994 | 3.3 | 3 | - | - | - | - | - | - | |
| 1995 | 3.1 | 3.1 | - | - | - | - | - | - | |
| 1996 | 3.2 | 3.2 | - | - | - | - | - | - | |
| 1997 | 3.2 | 3.3 | - | - | - | - | - | - | |
| 1998 | 3.2 | 3.5 | - | - | - | - | - | - | |
| 1999 | 3.7 | 3.7 | - | - | - | - | - | - | |
| 2000 | 4.1 | 3.9 | - | - | - | - | - | - | |
| 2001 | 4.1 | 4.2 | - | - | - | - | - | - | |
| 2002 | 4.7 | 4.4 | - | - | - | - | - | - | |
| 2003 | 4.4 | 4.7 | - | - | - | - | - | - | |
| 2004 | 4.6 | 5 | - | - | - | - | - | - | |
| 2005 | 5.6 | 5.3 | - | - | - | - | - | - | |
| 2006 | 5.9 | 5.6 | - | - | - | - | - | - | |
| 2007 | 6.3 | 6 | - | - | - | - | - | - | |
| 2008 | 6.6 | 6.4 | - | - | - | - | - | - | |
| 2009 | 6.7 | 6.8 | - | - | - | - | - | - | |
| 2010 | 6.6 | 7.2 | - | - | - | - | - | - | |
| 2011 | 8.2 | - | 7.7 | 6.9 | 7.1 | 7.1 | 5.1 | 6.3 | |
| 2012 | 8.6 | - | 8.1 | 7.1 | 7.3 | 7.3 | 4.6 | 6.3 | |
| 2013 | 8.7 | - | 8.6 | 7.2 | 7.6 | 7.6 | 4.3 | 6.3 | |
| 2014 | 9 | - | 9 | 7.5 | 7.9 | 7.8 | 4.3 | 6.3 | |
| Female | 1986 | 6.1 | 5.9 | - | - | - | - | - | - |
| 1987 | 6.2 | 6.1 | - | - | - | - | - | - | |
| 1988 | 6.1 | 6.4 | - | - | - | - | - | - | |
| 1989 | 6.3 | 6.7 | - | - | - | - | - | - | |
| 1990 | 6.5 | 6.9 | - | - | - | - | - | - | |
| 1991 | 7.1 | 7.2 | - | - | - | - | - | - | |
| 1992 | 7.8 | 7.5 | - | - | - | - | - | - | |
| 1993 | 8.2 | 7.8 | - | - | - | - | - | - | |
| 1994 | 8.8 | 8.2 | - | - | - | - | - | - | |
| 1995 | 8.6 | 8.5 | - | - | - | - | - | - | |
| 1996 | 8.7 | 8.9 | - | - | - | - | - | - | |
| 1997 | 9 | 9.2 | - | - | - | - | - | - | |
| 1998 | 8.9 | 9.6 | - | - | - | - | - | - | |
| 1999 | 10.5 | 10.6 | - | - | - | - | - | - | |
| 2000 | 11.6 | 11.6 | - | - | - | - | - | - | |
| 2001 | 12.6 | 12.8 | - | - | - | - | - | - | |
| 2002 | 15.2 | 14 | - | - | - | - | - | - | |
| 2003 | 15.5 | 15.4 | - | - | - | - | - | - | |
| 2004 | 16.7 | 17 | - | - | - | - | - | - | |
| 2005 | 18.7 | 18.7 | - | - | - | - | - | - | |
| 2006 | 18.8 | 19.4 | - | - | - | - | - | - | |
| 2007 | 20 | 20.2 | - | - | - | - | - | - | |
| 2008 | 21.3 | 20.9 | - | - | - | - | - | - | |
| 2009 | 21.7 | 21.7 | - | - | - | - | - | - | |
| 2010 | 22.5 | 22.6 | - | - | - | - | - | - | |
| 2011 | 25.6 | - | 24.5 | 23.5 | 24.1 | 24 | 15.4 | 20.6 | |
| 2012 | 26.8 | - | 25.6 | 24.4 | 25.5 | 25.3 | 13.1 | 20.6 | |
| 2013 | 26.4 | - | 26.8 | 25.3 | 26.9 | 26.7 | 13.1 | 20.6 | |
| 2014 | 26.1 | - | 27.8 | 26.4 | 28.5 | 28.2 | 13.1 | 20.6 |
Figure 3. Actual age-standardized incidence rates (1986–2010) and projected age-standardized rates (2011–2014) obtained with Canproj projection models by sex and cancer site, Canada (Section 6 of 7)
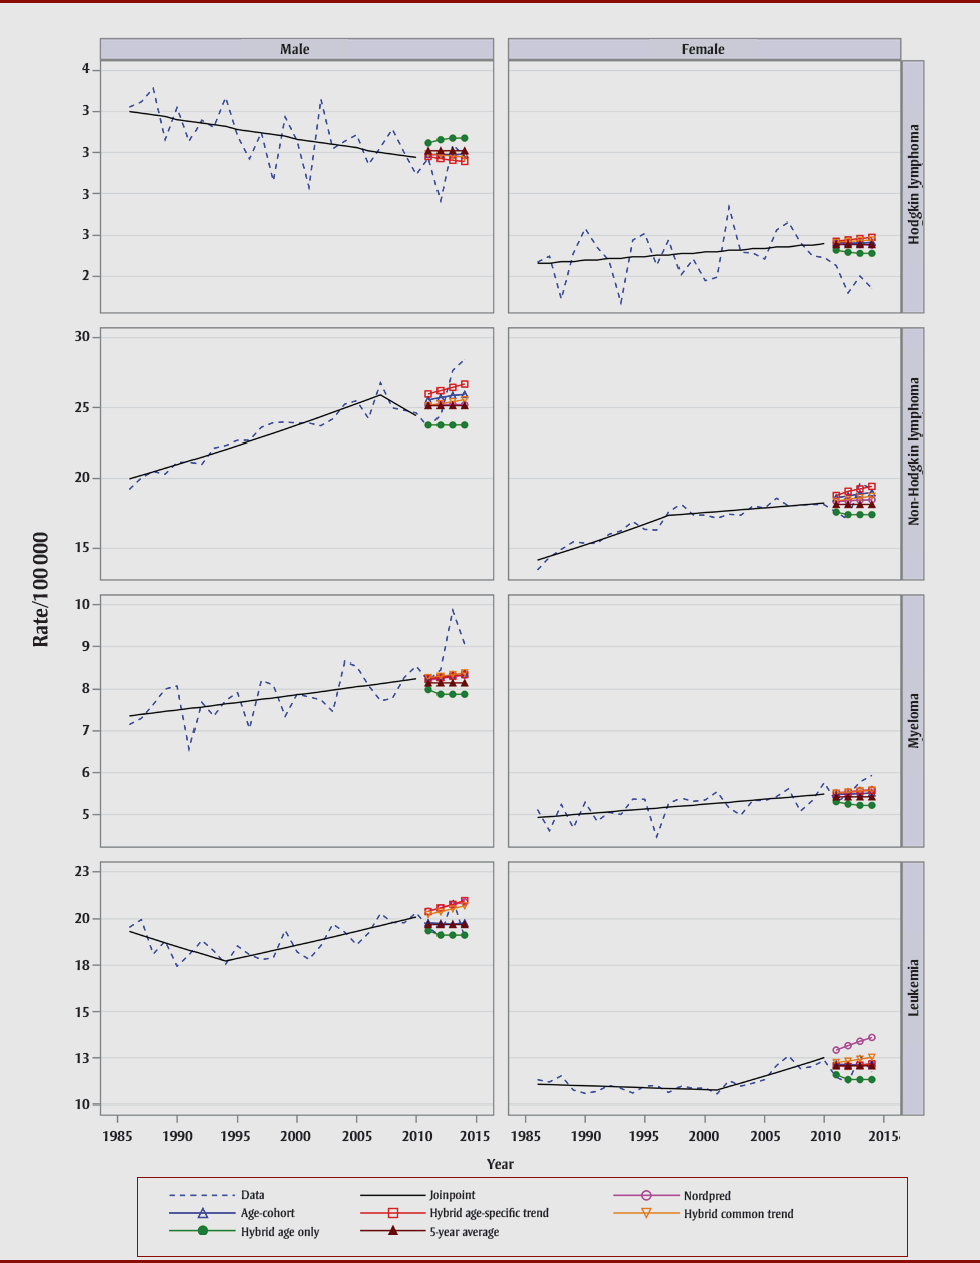
Text description: Figure 3 (Section 6 of 7)
Figure 3. Actual age-standardized incidence rates (1986–2010) and projected age-standardized rates (2011–2014) obtained with Canproj projection models by sex and cancer site, Canada (Section 6 of 7)
Hodgkin lymphoma
| Sex | Year | Observed data | Joinpoint | Nordpred | Age-cohort | Hybrid age-specific trend | Hybrid age-common trend | Hybrid age-only | 5-Year average |
|---|---|---|---|---|---|---|---|---|---|
| Male | 1986 | 3.3 | 3.3 | - | - | - | - | - | - |
| 1987 | 3.3 | 3.2 | - | - | - | - | - | - | |
| 1988 | 3.4 | 3.2 | - | - | - | - | - | - | |
| 1989 | 3.1 | 3.2 | - | - | - | - | - | - | |
| 1990 | 3.3 | 3.2 | - | - | - | - | - | - | |
| 1991 | 3.1 | 3.2 | - | - | - | - | - | - | |
| 1992 | 3.2 | 3.2 | - | - | - | - | - | - | |
| 1993 | 3.2 | 3.2 | - | - | - | - | - | - | |
| 1994 | 3.3 | 3.2 | - | - | - | - | - | - | |
| 1995 | 3.1 | 3.1 | - | - | - | - | - | - | |
| 1996 | 3 | 3.1 | - | - | - | - | - | - | |
| 1997 | 3.1 | 3.1 | - | - | - | - | - | - | |
| 1998 | 2.8 | 3.1 | - | - | - | - | - | - | |
| 1999 | 3.2 | 3.1 | - | - | - | - | - | - | |
| 2000 | 3.1 | 3.1 | - | - | - | - | - | - | |
| 2001 | 2.8 | 3.1 | - | - | - | - | - | - | |
| 2002 | 3.3 | 3.1 | - | - | - | - | - | - | |
| 2003 | 3 | 3.1 | - | - | - | - | - | - | |
| 2004 | 3.1 | 3 | - | - | - | - | - | - | |
| 2005 | 3.1 | 3 | - | - | - | - | - | - | |
| 2006 | 2.9 | 3 | - | - | - | - | - | - | |
| 2007 | 3 | 3 | - | - | - | - | - | - | |
| 2008 | 3.1 | 3 | - | - | - | - | - | - | |
| 2009 | 3 | 3 | - | - | - | - | - | - | |
| 2010 | 2.9 | 3 | - | - | - | - | - | - | |
| 2011 | 3 | - | 3 | 3 | 3 | 3 | 3.1 | 3 | |
| 2012 | 2.7 | - | 3 | 3 | 3 | 3 | 3.1 | 3 | |
| 2013 | 3 | - | 3 | 3 | 3 | 3 | 3.1 | 3 | |
| 2014 | 3 | - | 3 | 3 | 2.9 | 3 | 3.1 | 3 | |
| Female | 1986 | 2.3 | 2.3 | - | - | - | - | - | - |
| 1987 | 2.4 | 2.3 | - | - | - | - | - | - | |
| 1988 | 2.1 | 2.3 | - | - | - | - | - | - | |
| 1989 | 2.4 | 2.3 | - | - | - | - | - | - | |
| 1990 | 2.5 | 2.4 | - | - | - | - | - | - | |
| 1991 | 2.4 | 2.4 | - | - | - | - | - | - | |
| 1992 | 2.3 | 2.4 | - | - | - | - | - | - | |
| 1993 | 2.1 | 2.4 | - | - | - | - | - | - | |
| 1994 | 2.5 | 2.4 | - | - | - | - | - | - | |
| 1995 | 2.5 | 2.4 | - | - | - | - | - | - | |
| 1996 | 2.3 | 2.4 | - | - | - | - | - | - | |
| 1997 | 2.5 | 2.4 | - | - | - | - | - | - | |
| 1998 | 2.3 | 2.4 | - | - | - | - | - | - | |
| 1999 | 2.4 | 2.4 | - | - | - | - | - | - | |
| 2000 | 2.2 | 2.4 | - | - | - | - | - | - | |
| 2001 | 2.2 | 2.4 | - | - | - | - | - | - | |
| 2002 | 2.7 | 2.4 | - | - | - | - | - | - | |
| 2003 | 2.4 | 2.4 | - | - | - | - | - | - | |
| 2004 | 2.4 | 2.4 | - | - | - | - | - | - | |
| 2005 | 2.4 | 2.4 | - | - | - | - | - | - | |
| 2006 | 2.5 | 2.4 | - | - | - | - | - | - | |
| 2007 | 2.6 | 2.4 | - | - | - | - | - | - | |
| 2008 | 2.5 | 2.4 | - | - | - | - | - | - | |
| 2009 | 2.4 | 2.4 | - | - | - | - | - | - | |
| 2010 | 2.4 | 2.5 | - | - | - | - | - | - | |
| 2011 | 2.3 | - | 2.5 | 2.5 | 2.5 | 2.5 | 2.4 | 2.4 | |
| 2012 | 2.1 | - | 2.4 | 2.5 | 2.5 | 2.5 | 2.4 | 2.4 | |
| 2013 | 2.3 | - | 2.4 | 2.5 | 2.5 | 2.5 | 2.4 | 2.4 | |
| 2014 | 2.2 | - | 2.4 | 2.5 | 2.5 | 2.5 | 2.4 | 2.4 |
Non-Hodgkin lymphoma
| Sex | Year | Observed data | Joinpoint | Nordpred | Age-cohort | Hybrid age-specific trend | Hybrid age-common trend | Hybrid age-only | 5-Year average |
|---|---|---|---|---|---|---|---|---|---|
| Male | 1986 | 19.2 | 20 | - | - | - | - | - | - |
| 1987 | 20 | 20.2 | - | - | - | - | - | - | |
| 1988 | 20.5 | 20.5 | - | - | - | - | - | - | |
| 1989 | 20.3 | 20.7 | - | - | - | - | - | - | |
| 1990 | 21.1 | 21 | - | - | - | - | - | - | |
| 1991 | 21.2 | 21.3 | - | - | - | - | - | - | |
| 1992 | 21 | 21.5 | - | - | - | - | - | - | |
| 1993 | 22.2 | 21.8 | - | - | - | - | - | - | |
| 1994 | 22.3 | 22.1 | - | - | - | - | - | - | |
| 1995 | 22.7 | 22.3 | - | - | - | - | - | - | |
| 1996 | 22.7 | 22.6 | - | - | - | - | - | - | |
| 1997 | 23.6 | 22.9 | - | - | - | - | - | - | |
| 1998 | 23.9 | 23.2 | - | - | - | - | - | - | |
| 1999 | 24 | 23.5 | - | - | - | - | - | - | |
| 2000 | 23.9 | 23.8 | - | - | - | - | - | - | |
| 2001 | 23.9 | 24.1 | - | - | - | - | - | - | |
| 2002 | 23.7 | 24.4 | - | - | - | - | - | - | |
| 2003 | 24.2 | 24.7 | - | - | - | - | - | - | |
| 2004 | 25.3 | 25 | - | - | - | - | - | - | |
| 2005 | 25.5 | 25.3 | - | - | - | - | - | - | |
| 2006 | 24.2 | 25.6 | - | - | - | - | - | - | |
| 2007 | 26.8 | 25.9 | - | - | - | - | - | - | |
| 2008 | 25 | 25.4 | - | - | - | - | - | - | |
| 2009 | 24.8 | 24.9 | - | - | - | - | - | - | |
| 2010 | 24.6 | 24.4 | - | - | - | - | - | - | |
| 2011 | 23.6 | - | 25.2 | 25.6 | 26 | 25.2 | 23.8 | 25.1 | |
| 2012 | 24.5 | - | 25.2 | 25.7 | 26.2 | 25.3 | 23.8 | 25.1 | |
| 2013 | 27.7 | - | 25.2 | 25.9 | 26.4 | 25.4 | 23.8 | 25.1 | |
| 2014 | 28.4 | - | 25.2 | 25.9 | 26.7 | 25.6 | 23.8 | 25.1 | |
| Female | 1986 | 13.5 | 14.2 | - | - | - | - | - | - |
| 1987 | 14.4 | 14.4 | - | - | - | - | - | - | |
| 1988 | 14.9 | 14.7 | - | - | - | - | - | - | |
| 1989 | 15.5 | 15 | - | - | - | - | - | - | |
| 1990 | 15.4 | 15.3 | - | - | - | - | - | - | |
| 1991 | 15.4 | 15.5 | - | - | - | - | - | - | |
| 1992 | 16 | 15.8 | - | - | - | - | - | - | |
| 1993 | 16.2 | 16.1 | - | - | - | - | - | - | |
| 1994 | 16.9 | 16.4 | - | - | - | - | - | - | |
| 1995 | 16.4 | 16.7 | - | - | - | - | - | - | |
| 1996 | 16.3 | 17 | - | - | - | - | - | - | |
| 1997 | 17.6 | 17.4 | - | - | - | - | - | - | |
| 1998 | 18.2 | 17.4 | - | - | - | - | - | - | |
| 1999 | 17.4 | 17.5 | - | - | - | - | - | - | |
| 2000 | 17.4 | 17.6 | - | - | - | - | - | - | |
| 2001 | 17.2 | 17.6 | - | - | - | - | - | - | |
| 2002 | 17.4 | 17.7 | - | - | - | - | - | - | |
| 2003 | 17.4 | 17.8 | - | - | - | - | - | - | |
| 2004 | 18 | 17.8 | - | - | - | - | - | - | |
| 2005 | 17.9 | 17.9 | - | - | - | - | - | - | |
| 2006 | 18.6 | 18 | - | - | - | - | - | - | |
| 2007 | 18 | 18 | - | - | - | - | - | - | |
| 2008 | 18.1 | 18.1 | - | - | - | - | - | - | |
| 2009 | 18.1 | 18.2 | - | - | - | - | - | - | |
| 2010 | 18.1 | 18.2 | - | - | - | - | - | - | |
| 2011 | 17.6 | - | 18.3 | 18.6 | 18.8 | 18.4 | 17.6 | 18.1 | |
| 2012 | 17.1 | - | 18.4 | 18.8 | 19.1 | 18.5 | 17.4 | 18.1 | |
| 2013 | 19.7 | - | 18.5 | 18.9 | 19.3 | 18.6 | 17.4 | 18.1 | |
| 2014 | 19.2 | - | 18.5 | 19 | 19.4 | 18.7 | 17.4 | 18.1 |
Myeloma
| Sex | Year | Observed data | Joinpoint | Nordpred | Age-cohort | Hybrid age-specific trend | Hybrid age-common trend | Hybrid age-only | 5-Year average |
|---|---|---|---|---|---|---|---|---|---|
| Male | 1986 | 7.2 | 7.4 | - | - | - | - | - | - |
| 1987 | 7.3 | 7.4 | - | - | - | - | - | - | |
| 1988 | 7.6 | 7.4 | - | - | - | - | - | - | |
| 1989 | 8 | 7.5 | - | - | - | - | - | - | |
| 1990 | 8.1 | 7.5 | - | - | - | - | - | - | |
| 1991 | 6.6 | 7.5 | - | - | - | - | - | - | |
| 1992 | 7.7 | 7.6 | - | - | - | - | - | - | |
| 1993 | 7.4 | 7.6 | - | - | - | - | - | - | |
| 1994 | 7.7 | 7.7 | - | - | - | - | - | - | |
| 1995 | 7.9 | 7.7 | - | - | - | - | - | - | |
| 1996 | 7.1 | 7.7 | - | - | - | - | - | - | |
| 1997 | 8.2 | 7.8 | - | - | - | - | - | - | |
| 1998 | 8.1 | 7.8 | - | - | - | - | - | - | |
| 1999 | 7.4 | 7.8 | - | - | - | - | - | - | |
| 2000 | 7.9 | 7.9 | - | - | - | - | - | - | |
| 2001 | 7.8 | 7.9 | - | - | - | - | - | - | |
| 2002 | 7.7 | 7.9 | - | - | - | - | - | - | |
| 2003 | 7.5 | 8 | - | - | - | - | - | - | |
| 2004 | 8.7 | 8 | - | - | - | - | - | - | |
| 2005 | 8.5 | 8.1 | - | - | - | - | - | - | |
| 2006 | 8.1 | 8.1 | - | - | - | - | - | - | |
| 2007 | 7.7 | 8.1 | - | - | - | - | - | - | |
| 2008 | 7.8 | 8.2 | - | - | - | - | - | - | |
| 2009 | 8.3 | 8.2 | - | - | - | - | - | - | |
| 2010 | 8.6 | 8.3 | - | - | - | - | - | - | |
| 2011 | 8.2 | - | 8.2 | 8.2 | 8.3 | 8.3 | 8 | 8.2 | |
| 2012 | 8.5 | - | 8.3 | 8.3 | 8.3 | 8.3 | 7.9 | 8.2 | |
| 2013 | 9.9 | - | 8.3 | 8.3 | 8.3 | 8.4 | 7.9 | 8.2 | |
| 2014 | 9.1 | - | 8.3 | 8.4 | 8.3 | 8.4 | 7.9 | 8.2 | |
| Female | 1986 | 5.1 | 4.9 | - | - | - | - | - | - |
| 1987 | 4.6 | 5 | - | - | - | - | - | - | |
| 1988 | 5.2 | 5 | - | - | - | - | - | - | |
| 1989 | 4.7 | 5 | - | - | - | - | - | - | |
| 1990 | 5.3 | 5 | - | - | - | - | - | - | |
| 1991 | 4.8 | 5 | - | - | - | - | - | - | |
| 1992 | 5.1 | 5.1 | - | - | - | - | - | - | |
| 1993 | 5 | 5.1 | - | - | - | - | - | - | |
| 1994 | 5.4 | 5.1 | - | - | - | - | - | - | |
| 1995 | 5.4 | 5.1 | - | - | - | - | - | - | |
| 1996 | 4.5 | 5.2 | - | - | - | - | - | - | |
| 1997 | 5.3 | 5.2 | - | - | - | - | - | - | |
| 1998 | 5.4 | 5.2 | - | - | - | - | - | - | |
| 1999 | 5.3 | 5.2 | - | - | - | - | - | - | |
| 2000 | 5.3 | 5.3 | - | - | - | - | - | - | |
| 2001 | 5.5 | 5.3 | - | - | - | - | - | - | |
| 2002 | 5.2 | 5.3 | - | - | - | - | - | - | |
| 2003 | 5 | 5.3 | - | - | - | - | - | - | |
| 2004 | 5.3 | 5.3 | - | - | - | - | - | - | |
| 2005 | 5.3 | 5.4 | - | - | - | - | - | - | |
| 2006 | 5.4 | 5.4 | - | - | - | - | - | - | |
| 2007 | 5.6 | 5.4 | - | - | - | - | - | - | |
| 2008 | 5.1 | 5.4 | - | - | - | - | - | - | |
| 2009 | 5.3 | 5.5 | - | - | - | - | - | - | |
| 2010 | 5.8 | 5.5 | - | - | - | - | - | - | |
| 2011 | 5.3 | - | 5.5 | 5.5 | 5.5 | 5.5 | 5.3 | 5.4 | |
| 2012 | 5.5 | - | 5.5 | 5.5 | 5.5 | 5.5 | 5.2 | 5.4 | |
| 2013 | 5.8 | - | 5.6 | 5.5 | 5.6 | 5.6 | 5.2 | 5.4 | |
| 2014 | 5.9 | - | 5.6 | 5.5 | 5.6 | 5.6 | 5.2 | 5.4 |
Leukemia
| Sex | Year | Observed data | Joinpoint | Nordpred | Age-cohort | Hybrid age-specific trend | Hybrid age-common trend | Hybrid age-only | 5-Year average |
|---|---|---|---|---|---|---|---|---|---|
| Male | 1986 | 19.6 | 19.3 | - | - | - | - | - | - |
| 1987 | 20 | 19.1 | - | - | - | - | - | - | |
| 1988 | 18.1 | 18.9 | - | - | - | - | - | - | |
| 1989 | 18.8 | 18.7 | - | - | - | - | - | - | |
| 1990 | 17.5 | 18.5 | - | - | - | - | - | - | |
| 1991 | 18.1 | 18.3 | - | - | - | - | - | - | |
| 1992 | 18.8 | 18.1 | - | - | - | - | - | - | |
| 1993 | 18.3 | 17.9 | - | - | - | - | - | - | |
| 1994 | 17.6 | 17.7 | - | - | - | - | - | - | |
| 1995 | 18.5 | 17.9 | - | - | - | - | - | - | |
| 1996 | 18.1 | 18 | - | - | - | - | - | - | |
| 1997 | 17.8 | 18.2 | - | - | - | - | - | - | |
| 1998 | 17.9 | 18.3 | - | - | - | - | - | - | |
| 1999 | 19.4 | 18.4 | - | - | - | - | - | - | |
| 2000 | 18.2 | 18.6 | - | - | - | - | - | - | |
| 2001 | 17.8 | 18.7 | - | - | - | - | - | - | |
| 2002 | 18.6 | 18.9 | - | - | - | - | - | - | |
| 2003 | 19.7 | 19 | - | - | - | - | - | - | |
| 2004 | 19.3 | 19.2 | - | - | - | - | - | - | |
| 2005 | 18.6 | 19.3 | - | - | - | - | - | - | |
| 2006 | 19.2 | 19.5 | - | - | - | - | - | - | |
| 2007 | 20.3 | 19.6 | - | - | - | - | - | - | |
| 2008 | 19.8 | 19.8 | - | - | - | - | - | - | |
| 2009 | 19.8 | 20 | - | - | - | - | - | - | |
| 2010 | 20.3 | 20.1 | - | - | - | - | - | - | |
| 2011 | 19.6 | - | 20.4 | 19.8 | 20.4 | 20.2 | 19.4 | 19.7 | |
| 2012 | 19.1 | - | 20.6 | 19.8 | 20.6 | 20.4 | 19.1 | 19.7 | |
| 2013 | 21.1 | - | 20.8 | 19.7 | 20.8 | 20.6 | 19.1 | 19.7 | |
| 2014 | 19 | - | 20.9 | 19.8 | 21 | 20.7 | 19.1 | 19.7 | |
| Female | 1986 | 11.3 | 11.1 | - | - | - | - | - | - |
| 1987 | 11.2 | 11.1 | - | - | - | - | - | - | |
| 1988 | 11.5 | 11 | - | - | - | - | - | - | |
| 1989 | 10.8 | 11 | - | - | - | - | - | - | |
| 1990 | 10.6 | 11 | - | - | - | - | - | - | |
| 1991 | 10.7 | 11 | - | - | - | - | - | - | |
| 1992 | 11 | 11 | - | - | - | - | - | - | |
| 1993 | 10.8 | 10.9 | - | - | - | - | - | - | |
| 1994 | 10.6 | 10.9 | - | - | - | - | - | - | |
| 1995 | 11 | 10.9 | - | - | - | - | - | - | |
| 1996 | 11 | 10.9 | - | - | - | - | - | - | |
| 1997 | 10.6 | 10.8 | - | - | - | - | - | - | |
| 1998 | 11 | 10.8 | - | - | - | - | - | - | |
| 1999 | 10.9 | 10.8 | - | - | - | - | - | - | |
| 2000 | 10.9 | 10.8 | - | - | - | - | - | - | |
| 2001 | 10.5 | 10.8 | - | - | - | - | - | - | |
| 2002 | 11.3 | 11 | - | - | - | - | - | - | |
| 2003 | 11 | 11.1 | - | - | - | - | - | - | |
| 2004 | 11.1 | 11.3 | - | - | - | - | - | - | |
| 2005 | 11.3 | 11.5 | - | - | - | - | - | - | |
| 2006 | 12.1 | 11.7 | - | - | - | - | - | - | |
| 2007 | 12.6 | 11.9 | - | - | - | - | - | - | |
| 2008 | 11.9 | 12.1 | - | - | - | - | - | - | |
| 2009 | 12 | 12.3 | - | - | - | - | - | - | |
| 2010 | 12.4 | 12.5 | - | - | - | - | - | - | |
| 2011 | 11.5 | - | 12.9 | 12.1 | 12.1 | 12.2 | 11.6 | 12.1 | |
| 2012 | 11.2 | - | 13.2 | 12.1 | 12 | 12.3 | 11.3 | 12.1 | |
| 2013 | 12.6 | - | 13.4 | 12.1 | 12.1 | 12.4 | 11.3 | 12.1 | |
| 2014 | 11.7 | - | 13.6 | 12.2 | 12.2 | 12.5 | 11.3 | 12.1 |
Figure 3. Actual age-standardized incidence rates (1986–2010) and projected age-standardized rates (2011–2014) obtained with Canproj projection models by sex and cancer site, Canada (Section 7 of 7)
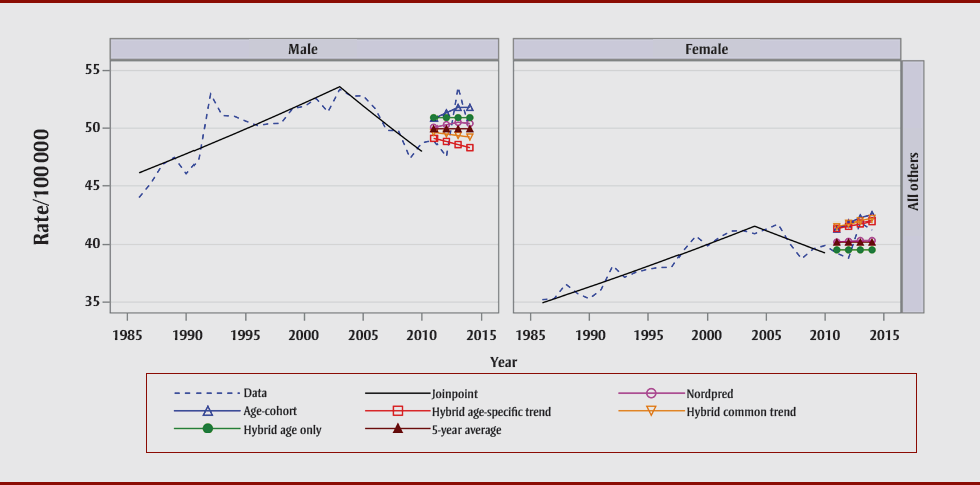
Text description: Figure 3 (Section 7 of 7)
Figure 3. Actual age-standardized incidence rates (1986–2010) and projected age-standardized rates (2011–2014) obtained with Canproj projection models by sex and cancer site, Canada (Section 7 of 7)
All Others
| Sex | Year | Observed data | Joinpoint | Nordpred | Age-cohort | Hybrid age-specific trend | Hybrid age-common trend | Hybrid age-only | 5-Year average |
|---|---|---|---|---|---|---|---|---|---|
| Male | 1986 | 44 | 46.1 | - | - | - | - | - | - |
| 1987 | 45.2 | 46.5 | - | - | - | - | - | - | |
| 1988 | 46.9 | 47 | - | - | - | - | - | - | |
| 1989 | 47.5 | 47.4 | - | - | - | - | - | - | |
| 1990 | 46.1 | 47.8 | - | - | - | - | - | - | |
| 1991 | 47.2 | 48.2 | - | - | - | - | - | - | |
| 1992 | 53 | 48.6 | - | - | - | - | - | - | |
| 1993 | 51.1 | 49.1 | - | - | - | - | - | - | |
| 1994 | 51 | 49.5 | - | - | - | - | - | - | |
| 1995 | 50.6 | 49.9 | - | - | - | - | - | - | |
| 1996 | 50.2 | 50.4 | - | - | - | - | - | - | |
| 1997 | 50.4 | 50.8 | - | - | - | - | - | - | |
| 1998 | 50.4 | 51.3 | - | - | - | - | - | - | |
| 1999 | 51.7 | 51.7 | - | - | - | - | - | - | |
| 2000 | 51.9 | 52.2 | - | - | - | - | - | - | |
| 2001 | 52.6 | 52.7 | - | - | - | - | - | - | |
| 2002 | 51.4 | 53.1 | - | - | - | - | - | - | |
| 2003 | 53.4 | 53.6 | - | - | - | - | - | - | |
| 2004 | 52.8 | 52.8 | - | - | - | - | - | - | |
| 2005 | 52.8 | 51.9 | - | - | - | - | - | - | |
| 2006 | 51.7 | 51.1 | - | - | - | - | - | - | |
| 2007 | 49.8 | 50.3 | - | - | - | - | - | - | |
| 2008 | 49.8 | 49.5 | - | - | - | - | - | - | |
| 2009 | 47.4 | 48.8 | - | - | - | - | - | - | |
| 2010 | 48.7 | 48 | - | - | - | - | - | - | |
| 2011 | 48.9 | - | 50.1 | 50.9 | 49.1 | 49.6 | 50.9 | 50 | |
| 2012 | 47.5 | - | 50.3 | 51.3 | 48.8 | 49.5 | 50.9 | 50 | |
| 2013 | 53.6 | - | 50.5 | 51.8 | 48.6 | 49.4 | 50.9 | 50 | |
| 2014 | 49.7 | - | 50.4 | 51.8 | 48.3 | 49.2 | 50.9 | 50 | |
| Female | 1986 | 35.2 | 34.9 | - | - | - | - | - | - |
| 1987 | 35.3 | 35.3 | - | - | - | - | - | - | |
| 1988 | 36.6 | 35.6 | - | - | - | - | - | - | |
| 1989 | 35.7 | 36 | - | - | - | - | - | - | |
| 1990 | 35.3 | 36.3 | - | - | - | - | - | - | |
| 1991 | 36.1 | 36.7 | - | - | - | - | - | - | |
| 1992 | 38.2 | 37 | - | - | - | - | - | - | |
| 1993 | 37.2 | 37.4 | - | - | - | - | - | - | |
| 1994 | 37.6 | 37.8 | - | - | - | - | - | - | |
| 1995 | 37.9 | 38.1 | - | - | - | - | - | - | |
| 1996 | 38 | 38.5 | - | - | - | - | - | - | |
| 1997 | 38 | 38.9 | - | - | - | - | - | - | |
| 1998 | 39.5 | 39.2 | - | - | - | - | - | - | |
| 1999 | 40.7 | 39.6 | - | - | - | - | - | - | |
| 2000 | 39.9 | 40 | - | - | - | - | - | - | |
| 2001 | 40.6 | 40.4 | - | - | - | - | - | - | |
| 2002 | 41.2 | 40.8 | - | - | - | - | - | - | |
| 2003 | 41.2 | 41.2 | - | - | - | - | - | - | |
| 2004 | 40.9 | 41.6 | - | - | - | - | - | - | |
| 2005 | 41.3 | 41.2 | - | - | - | - | - | - | |
| 2006 | 41.8 | 40.8 | - | - | - | - | - | - | |
| 2007 | 40.1 | 40.4 | - | - | - | - | - | - | |
| 2008 | 38.8 | 40 | - | - | - | - | - | - | |
| 2009 | 39.6 | 39.6 | - | - | - | - | - | - | |
| 2010 | 39.9 | 39.3 | - | - | - | - | - | - | |
| 2011 | 39.2 | - | 40.2 | 41.3 | 41.4 | 41.5 | 39.5 | 40.2 | |
| 2012 | 38.8 | - | 40.3 | 41.8 | 41.6 | 41.8 | 39.5 | 40.2 | |
| 2013 | 41.9 | - | 40.3 | 42.2 | 41.8 | 42 | 39.5 | 40.2 | |
| 2014 | 41.3 | - | 40.3 | 42.5 | 42 | 42.2 | 39.5 | 40.2 |
Cancer sites that showed recent change in trend for which projections could potentially be improved by changing the length of the data included male all cancers, male and female colorectal cancer and prostate cancer. We ran separate hybrid models on these cancers sites using the last 7 years of data only. It was possible to increase the fit of the projections substantially for all four cancer sites. For colorectal cancer, it was possible to bring the RB ratio from 16.0 to 2.6 for males and from 5.5 to 1.9 for females. We were also able to bring the RB ratio from 5.7 to 5.4 for male all cancers combined and from 11.2 to 7.7 for prostate cancer.
Canproj model decision trees
As shown in Table 3, the cohort effect and the drift parameter were significant 79% of the time (34 out of 43 models), which makes Nordpred the model most often selected by Canproj. However, Nordpred was the model with the smallest RB only 24% of the time. Nevertheless, the mean RB was between 0 and 5% for at least one of the six models 76% of the time and between 6% and 10% for at least one model 20% of the time.
Table 3. Canproj decision tree: average relative bias by model, sex and cancer site
| Sex | Cancer type | Model | |||||
|---|---|---|---|---|---|---|---|
| Nordpred | Age–cohort | Hybrid | 5-Year average | ||||
| Age-specific trend | Age-common trend | Age only | |||||
| Male | All cancers | 10.9Footnote a of Table 3 | 10.1 | 5.9 | 5.7Footnote b of Table 3 | 7.8 | 7.5 |
| Oral | 8.6Footnote a of Table 3 | 13.2 | 14.8 | 12.6 | 1.6Footnote b of Table 3 | 5.9 | |
| Esophagus | 3.9 | 2.6Footnote b of Table 3 | 4.2Footnote a of Table 3 | 3.2 | 6.8 | 3.0 | |
| Stomach | 3.4Footnote c of Table 3 | 3.7 | 4.1 | 3.7 | 26.1 | 9.5 | |
| Colorectal | 7.9Footnote a of Table 3 | 8.2 | 6.9Footnote b of Table 3 | 8.6 | 10.7 | 8.3 | |
| Liver | 6.8Footnote a of Table 3 | 6.5 | 7.6 | 6.2Footnote b of Table 3 | 26.0 | 8.6 | |
| Pancreas | 3.2 | 7.0 | 6.2Footnote a of Table 3 | 5.0 | 3.2Footnote b of Table 3 | 3.8 | |
| Larynx | 2.1Footnote c of Table 3 | 3.6 | 2.5 | 2.2 | 39.4 | 16.2 | |
| Lung and bronchus | 3.2Footnote a of Table 3 | 1.7 | 2.6 | 1.6Footnote b of Table 3 | 32.4 | 12.9 | |
| Melanoma | 2.1Footnote c of Table 3 | 5.5 | 2.8 | 3.9 | 17.6 | 7.8 | |
| Breast | 6.2Footnote b of Table 3 | 6.8 | 8.6 | 8.3Footnote a of Table 3 | 6.4 | 6.2 | |
| Prostate | 45.9Footnote a of Table 3 | 86.4 | 38.9 | 41.8 | 31.3 | 30.6Footnote b of Table 3 | |
| Testis | 2.4 | 2.4Footnote a of Table 3 | 2.2 | 2.1Footnote b of Table 3 | 14.3 | 7.1 | |
| Urinary bladder | 12.3Footnote a of Table 3 | 17.3 | 13.7 | 15.9 | 11.2Footnote b of Table 3 | 11.6 | |
| Kidney and renal pelvis | 5.5Footnote a of Table 3 | 3.0 | 2.4 | 2.3Footnote b of Table 3 | 9.4 | 5.3 | |
| Brain/CNS | 6.7Footnote a of Table 3 | 6.0Footnote b of Table 3 | 7.0 | 6.3 | 10.0 | 8.0 | |
| Thyroid | 3.3Footnote c of Table 3 | 16.8 | 13.4 | 13.5 | 46.8 | 26.9 | |
| Hodgkin lymphoma | 3.4Footnote b of Table 3 | 3.4 | 3.5 | 3.4 | 5.5Footnote a of Table 3 | 3.8 | |
| Non-Hodgkin lymphoma | 7.5Footnote a of Table 3 | 7.2 | 6.9Footnote b of Table 3 | 7.0 | 8.5 | 7.5 | |
| Myeloma | 6.6 | 6.3Footnote b of Table 3 | 6.6Footnote a of Table 3 | 6.4 | 10.7 | 7.9 | |
| Leukemia | 6.0 | 3.9 | 6.0Footnote a of Table 3 | 5.5 | 2.8Footnote b of Table 3 | 3.6 | |
| All others | 3.8Footnote a of Table 3 | 4.8 | 3.8 | 3.6 | 4.6 | 3.6Footnote b of Table 3 | |
| Female | All cancers | 1.3Footnote a of Table 3 | 1.1 | 1.0Footnote b of Table 3 | 1.1 | 3.4 | 1.1 |
| Oral | 3.4 | 4.1Footnote a of Table 3 | 4.4 | 3.9 | 2.9Footnote b of Table 3 | 3.3 | |
| Esophagus | 3.6 | 3.5 | 3.2 | 3.0Footnote c of Table 3 | 8.8 | 3.9 | |
| Stomach | 2.7Footnote c of Table 3 | 2.9 | 7.2 | 4.1 | 20.7 | 4.9 | |
| Colorectal | 5.2Footnote a of Table 3 | 4.9 | 3.7Footnote b of Table 3 | 5.4 | 9.5 | 6.1 | |
| Liver | 5.4Footnote a of Table 3 | 4.9Footnote b of Table 3 | 5.2 | 5.5 | 21.8 | 9.0 | |
| Pancreas | 4.9 | 5.1 | 5.2 | 5.0 | 4.9Footnote a of Table 3 | 4.7Footnote b of Table 3 | |
| Larynx | 10.2Footnote c of Table 3 | 14.5 | 16.7 | 15.3 | 53.4 | 24.0 | |
| Lung and bronchus | 1.6Footnote c of Table 3 | 1.6 | 10.3 | 5.8 | 3.5 | 2.4 | |
| Melanoma | 3.0Footnote c of Table 3 | 8.4 | 4.2 | 4.1 | 16.9 | 9.1 | |
| Breast | 2.3Footnote a of Table 3 | 2.9 | 1.2Footnote b of Table 3 | 1.5 | 1.8 | 1.7 | |
| Cervix uteri | 3.4Footnote a of Table 3 | 4.6 | 1.5 | 1.5Footnote b of Table 3 | 20.9 | 8.3 | |
| Uterus | 2.8Footnote c of Table 3 | 7.9 | 3.0 | 3.6 | 10.1 | 10.1 | |
| Ovary | 1.9Footnote a of Table 3 | 1.8Footnote b of Table 3 | 1.8 | 1.8 | 9.7 | 4.0 | |
| Urinary bladder | 14.6Footnote a of Table 3 | 14.7 | 13.7 | 15.0 | 10.7Footnote b of Table 3 | 10.7 | |
| Kidney and renal pelvis | 12.0Footnote a of Table 3 | 5.4 | 6.0 | 5.8 | 7.7 | 4.1Footnote b of Table 3 | |
| Brain/CNS | 7.8Footnote a of Table 3 | 7.1Footnote b of Table 3 | 8.2 | 7.7 | 10.8 | 9.1 | |
| Thyroid | 4.3Footnote c of Table 3 | 5.7 | 5.5 | 5.3 | 47.9 | 21.6 | |
| Hodgkin lymphoma | 10.1 | 10.5Footnote a of Table 3 | 11.5 | 11.0 | 7.9Footnote b of Table 3 | 10.0 | |
| Non-Hodgkin lymphoma | 5.6Footnote a of Table 3 | 5.3 | 5.4 | 5.3Footnote b of Table 3 | 5.8 | 5.7 | |
| Myeloma | 3.7Footnote b of Table 3 | 3.9 | 3.8Footnote a of Table 3 | 3.8 | 6.4 | 4.4 | |
| Leukemia | 13.2Footnote a of Table 3 | 5.6 | 5.2 | 6.4 | 4.1Footnote b of Table 3 | 5.1 | |
| All others | 3.0Footnote c of Table 3 | 4.2 | 3.7 | 4.0 | 3.1 | 3.2 | |
Discussion
Our aim was to validate short-term projections generated by Canproj using Canadian cancer incidence data. The results show that the range of models Canproj offers supports making reliable projections for most of the cancer sites investigated. When variations in rates were identified within the last 10 years of training data, it was possible to use the recent, shorter time period as the projection base for the hybrid models to improve the accuracy of the projected rates.
The large jump in bladder cancer rates in 2013/2014 is due to changes in reporting rules in Ontario;Footnote 20 starting in 2013, Ontario added in situ bladder to malignant bladder cancer in their registry.
Brain/CNS, colorectal cancer, female Hodgkin lymphoma, prostate and male all cancer combined rates are declining faster than the models predicted, while male myeloma is increasing faster than the models predict. The poor performance at predicting these cancer rates is related to the recent and rapid changes in their rates that were not part of the training dataset or happened in the last few years of the training dataset.
We evaluated the automatic model selection feature of Canproj (decision trees) to assess the capacity of these functions to select the best model. For the national dataset, Nordpred was the model most often selected by Canproj decision tree although it was the one with the smallest RB only 24% of the time. Other models can outperform Nordpred when analyzing data from smaller populations.Footnote 21 Personal and others’ experiences with Canproj suggest that the decision tree selection should be used in combination with individual outputs of each model and expert advice to select the best projection model.Footnote 22
The results of this project build on prior Canadian studies that examined different cancer projection methods. Lee et al. (2011) compared the accuracy of 16 models and model variations for projecting short-term cancer mortality rates.Footnote 23 They found that no single method was able to consistently provide accurate forecasts for a wide range of cancer sites and that a choice of models is preferable. Qiu et al. (2010) compared the Nordpred model, the generalized additive model and the Bayesian model.Footnote 8 They concluded that when the age, drift and cohort effects are present, the Nordpred method is the preferred approach; when the age and cohort effects are present, an age–cohort model is the best approach; and when the cohort effect is not present, a hybrid method should be used. They also found that for small cancer sites, data aggregation is required to apply the hybrid method. In 2010, the Canadian Cancer Projections Network (C-Proj) released a report in which they evaluated Nordpred, hybrid, age–cohort and Bayesian models using Markov chain Monte Carlo cancer incidence projection methods with data from the Nova Scotia Cancer Registry.Footnote 21 They suggested that the age–cohort method should be used for cancer projections for provinces with small and stable populations.
Although cancer incidence projections are routinely performed, only a few studies describe the evaluation of alternative methods; the recommendations depend on the population included and projection time frame. Stock et al. (2018) used a Bayesian approach to project cancer incidence rates to 2030 using data from the German cancer registry.Footnote 24 They found that this method offered advantages in terms of flexibility, interpretability, transparency and level of detail, but they did not recommend using it for short-term data. Pesola et al. (2017) compared a number of models (null, age–drift, age–period, age–cohort and APC) to predict pediatric and adolescent cancer incidence in England to 2030.Footnote 25 The model fit results showed that the age–drift model offered as good a fit to the data as more complex models for all cancers in children. An APC model with natural cubic splines was evaluated when predicting cancer incidence and mortality in the United Kingdom until 2035.Footnote 26 The basis of the APC model is that past trends will continue into the future. If vaccines or new treatments that change cancer incidence and mortality are developed, the model will not anticipate these changes, reinforcing the importance of using recent data and completing projections at regular intervals.Footnote 27 Katanoda et al. (2014) examined three projection models’ ability to project short-term cancer incidence in Japan: generalized linear model with age and period as independent variables (A+P linear); generalized linear model with age, period and their interactions (A*P linear); and generalized additive model with age, period and their interactions smoothed by spline (A*P spline).Footnote 28 They used Nordpred in their preliminary analysis and it failed to predict the peak in liver cancer in the mid-1990s.
Strengths and limitations
This project has several limitations. In all the models Canproj uses, the variables age, period and cohort encompass all the changes and improvements in risk factors, demography and ethnic profile of the population, prevention, early detection and treatment. More details on these cancer rate determinants would improve the capacity for making more reliable projections. However, the level of information needed may be hard to obtain in some jurisdictions and, for most of the cancer sites investigated in the project, the age, period and cohort information has proven sufficient for making reliable projections.
We did not conduct a detailed Canadian provincial data analysis in the present exercise, but we expect that as provincial populations get smaller, models other than Nordpred would become the most frequently selected through the decision tree.
The data used in the models did not include data from the province of Quebec and consequently does not represent the entire country.
Finally, as with all methods, projections rely on the assumption that past trends will continue into the future, which may not always be the case.
Conclusions
Health care planners and policy makers need to know about the future burden of cancer to help them prioritize cancer control strategies, allocate resources and evaluate treatments and interventions. The Canproj package can provide reliable cancer projections to help them support their task.
Conflicts of interest
The authors have no conflicts of interest to declare.
Authors’ contributions and statement
AD, ZQ and AS were involved in the design and conceptualization of the work.
AD and ZQ were in involved in the analysis of the data.
AD drafted the paper.
All authors provided input for the interpretation of the results and revision of the paper.
The content and views expressed in this article are those of the authors and do not necessarily reflect those of the Government of Canada.