
Original quantitative research – Are closed campus policies associated with adolescent eating behaviours?
Health Promotion and Chronic Disease Prevention in Canada
Karen A. Patte, PhDAuthor reference footnote 1; Adam G. Cole, PhDAuthor reference footnote 2; Wei Qian, PhDAuthor reference footnote 3; Megan Magier, MScAuthor reference footnote 1; Michelle Vine, PhDAuthor reference footnote 3; Scott T. Leatherdale, PhDAuthor reference footnote 3
https://doi.org/10.24095/hpcdp.41.3.02
This article has been peer reviewed.
Correspondence: Karen A. Patte, Faculty of Applied Health Sciences, Brock University, Niagara Region, 1812 Sir Isaac Brock Way, St. Catharines, ON L2S 3A1; Email: kpatte@brocku.ca
Abstract
Introduction: The effectiveness of school nutrition regulations may be undermined by food environments surrounding schools. Given challenges in regulating external retail, some have recommended policies that ensure students are unable to leave school property during the day (closed campus policies; CCP). We aimed to examine whether CCP are associated with student eating behaviours.
Methods: We used student and school-administrator survey data from the 60 610 Grades 9 to 12 students and 134 Canadian secondary schools that participated in Year 7 (2018/19) of the COMPASS study. Multiple ordinal regression models tested school CCP as a predictor of weekday dietary behaviours (0–5 days), controlling for student-level (grade, sex, spending money, ethnicity) and school-level (urbanicity, province, area median household income, vending machines) covariates.
Results: CCP were reported by 16 schools. Students who attended CCP schools reported eating lunch purchased from fast food outlets or other restaurants and drinking sugar-sweetened beverages (SSBs; soft drinks and sports drinks; sweetened coffee or tea drinks) on fewer weekdays, but consumed snacks from school vending machines on more weekdays, relative to students at open campus schools. No significant differences were observed in student reports of eating home-packed or school cafeteria lunches or snacks purchased off-campus.
Conclusion: CCP may help improve adolescent diets by reducing SSB and lunchtime fast food consumption on weekdays; however, students already purchasing food may shift from off-campus to within-school options, highlighting the importance of ensuring healthy school food environments and encouraging students to bring home-prepared lunches. Future studies using experimental longitudinal designs are needed to determine the effect of CCP on various health behaviours and outcomes.
Keywords: school, nutrition policies, open campus policies, adolescents, students, closed campus policies, diet
Highlights
- This study is the first to explore adolescent dietary behaviours in relation to open and closed campus policies in Canadian schools.
- 16 of 134 participating Canadian secondary schools reported policies prohibiting students from leaving school property during school hours.
- Closed campus policies may improve adolescent diet quality through reduced weekday consumption of sugar-sweetened cold or hot beverages and lunches purchased from fast food or other off-campus restaurant outlets.
- The impact of CCP likely depends on the healthfulness of food available for sale within schools, as students at closed campus schools may shift to purchasing snacks from school vending machines on weekdays.
Introduction
Adolescents represent a key target for population nutrition initiatives. Lifelong health habits become more established over adolescence, a period of increasing autonomy. Relatedly, declines in diet quality occur with age and transitions to secondary school.Footnote 1 Few Canadian adolescents meet nutritional guidelines.Footnote 2Footnote 3 Based on national dietary intake surveys, adolescents aged 14 to 17 years report the poorest nutritional profiles across all age groups.Footnote 2Footnote 3 Adolescent diets are commonly characterized by fewer servings of fruit, vegetables and whole grains, while “other” foods (i.e. low nutrient, high energy foods) comprise a higher proportion of their total daily caloric intake.Footnote 4Footnote 5 The primary nutritional concerns for adolescents — including inadequate calcium and fibre, and excess sodium and sugarFootnote 5Footnote 6— place them at increased risk of multiple chronic health conditions including diabetes, cardiovascular disease, osteoporosis, dental caries, fatty liver disease and various types of cancer.Footnote 5
If a socioecological model is applied, factors at multiple levels interact to shape adolescent dietary behaviours, from proximal (e.g. food preferences, family meals, parental role models) to more distal influences (e.g. social norms, family socioeconomic level).Footnote 7Footnote 8 Determined across levels, the availability and accessibility of food are among the strongest correlates of food choices among adolescents.Footnote 9Footnote 10Footnote 11 Accordingly, environmental measures (i.e. policies and regulations) appear most effective for promoting population-level change in dietary patterns.Footnote 12 School nutrition policies primarily focus on restricting minimally nutritious items and increasing the availability of healthy options for sale in the school environment. Schools are widely recognized as a key context for equitable delivery of interventions, since they are the location where most children and adolescents spend the majority of their waking weekday hours and consume at least one meal per day. In Canada, school nutritional policies are the responsibility of provincial/territorial governments.Footnote 4 All 10 Canadian provinces have issued school nutrition policies, but wide variation exists across them (e.g. whether they are voluntary or mandatory in nature).Footnote 13
School nutrition policies are limited to food sold within schools, yet most Canadian secondary schools have an open campus policy, according to which some or all students are permitted to leave the campus during lunchtime. Schools are often within walking distance of food retailers,Footnote 14 primarily selling the foods that policies intend to restrict (i.e. low in nutrients, and high in sugar, fat, salt and calories). There tends to be a greater density of fast food restaurants and convenience stores compared to healthier retail food establishments around schools.Footnote 15Footnote 16 Easy access to fast food restaurants in school areas has been linked with poor dietary intake among adolescents,Footnote 17 including increased intake of sugar sweetened beverages (SSB)Footnote 18 and fast food,Footnote 19Footnote 20 although evidence is mixed.Footnote 21 Therefore, the effectiveness of school nutrition regulations may be undermined by the surrounding food environment.Footnote 20Footnote 22
The off-campus environment is particularly relevant to adolescents, as they are less likely to eat lunch at school.Footnote 20Footnote 22 A recent study found over one-third of Ontario secondary school students ate meals prepared by fast food restaurants at least once per week.Footnote 22 Similarly, in an online survey of youth from seven Canadian provinces, 27.4% reported buying lunch out three or more days a week and another 56.7% on one or two days, while 36.5% bought lunch at school at least once a week.Footnote 23 Only 15.9% of students did not buy lunch from a fast food restaurant, convenience store or other off-campus option at all in the previous school week.Footnote 23
Home-prepared lunches are generally the most nutritious option, relative to meals purchased from fast food restaurants and convenience store outlets.Footnote 22Footnote 23 Among Canadian secondary school students those who bring a home-packed lunch report better total diet quality, and consume fewer SSBsFootnote 24 and more fruit and vegetablesFootnote 25 and whole grain servings, compared to their peers who purchase lunch from school or off campus.Footnote 23Footnote 26 For purchased lunches, most studies support school cafeteria food as the healthier alternative to food purchased at fast food or other restaurant or retail options.Footnote 22Footnote 23Footnote 27 Students who eat lunch or snacks purchased at fast food outlets or restaurants report higher consumption of SSBsFootnote 24Footnote 25Footnote 27 and fried foods and greater sodium, sugar and total caloric intakes, than their peers who eat home-packed or school cafeteria lunches.Footnote 22Footnote 23Footnote 27 However, some evidence suggests school-obtained lunches are generally equivalent to food purchased off of school property.Footnote 23Footnote 26
Concerns about the external food environment have led to new calls for nutrition regulations to be extended to retail settings in the communities surrounding schools.Footnote 20Footnote 22 Given the barriers to implementing healthy eating zones around schools, CCP that restrict students from leaving school property during the day have been proposed. While such a policy does not prevent students from purchasing food at nearby food retailers before or after school, adolescents consume approximately one-third of their total energy intake during school hours,Footnote 26Footnote 27Footnote 28 providing considerable potential to improve student nutrition.
To our knowledge, only one study has examined CCP in association with food purchasing and consumption patterns. In a randomly selected sample of 1088 students from 20 suburban high schools in Minnesota, students at schools with CCP during lunchtime were found to be less likely to eat lunch at a fast food restaurant and consume food purchased at convenience stores than students at schools with open campus policies.Footnote 29 Otherwise, the limited number of studies comparing open and closed campus policies have focussed on factors unrelated to diet, including using conditional incentives for academic performanceFootnote 30 and motor vehicle accident prevention.Footnote 31
Given significant cross-national differences in school and surrounding food environments, further evaluation in the Canadian context is necessary. This study explored student lunch, snack and beverage purchase and consumption patterns on weekdays among a large cohort of Canadian adolescents based on whether they attended secondary schools with open or closed campus policies. We hypothesized that students attending CCP schools would report lower consumption of SSBs and food purchased from off-campus retail outlets, as well as higher purchasing of food from school cafeterias and vending machines (VMs), or, ideally, bringing home-packed lunches more often.
Methods
Design
This study used cross-sectional student- and school-level data from Year 7 (2018/19 school year) of the Cannabis, Obesity, Mental health, Physical activity, Alcohol, Smoking, Sedentary behaviour (COMPASS) study. COMPASS collects hierarchical prospective health data once annually from students in Grades 9 to 12 and the Canadian secondary schools they attend.Footnote 32 School boards were purposefully selected based on whether they permitted active-information passive-consent parental permission protocols,Footnote 32 which reduce school burden and collect more robust adolescent data.Footnote 33 All Grades 9 to 12 students attending participating schools were eligible and could decline at any time. Student-level data were collected using a paper-based survey completed during one classroom period by whole school samples. School-level data were collected via an online survey (COMPASS School Program and Policy Scan [SPP]) at the same time as student data collections. The SPP was designed to assess the presence or absence of policies, practices and resources relevant to student health behaviours in the school environment.Footnote 32 The school administrators most knowledgeable about the school program and policy environment were emailed a link to the survey, and encouraged to consult with other staff members and have a small group complete the SPP to support accuracy of reports. COMPASS staff followed up by phone or email if any data were missing or unclear.
COMPASS received ethics approval from the University of Waterloo, Brock University and participating school boards. Additional details regarding COMPASS recruitment methodsFootnote 34 and study methods can be found online or in print.Footnote 32
Weekday dietary behaviours
Students were asked, “In a usual school week (Monday to Friday), on how many days do you do the following? (i) Eat lunch purchased at a fast food place or restaurant; (ii) Eat lunch at school—lunch packed and brought home; (iii) Eat lunch at school—lunch purchased in the cafeteria; (iv) Eat snacks purchased from a VM, corner store, snack bar, or canteen off school property; (v) Eat snacks purchased from a VM in your school; (vi) Drink sugar-sweetened beverages (soda pop, Kool-Aid, Gatorade, etc.) (do not include diet/sugar-free drinks); and (vii) Drink coffee or tea with sugar (include cappuccino, Frappuccino, iced-tea, iced-coffees, etc.).” Response options “None” to “5 days” were coded 0 to 5 as an ordinal outcome.
School-level measures
To classify schools as either open or closed campuses, the SPP included the following item: “Does your school have a CCP whereby students are generally not allowed to leave school property during breaks in the day (except for school-related activities/events, or personal appointments)?” Schools responding “yes” were classified as having CCP. Schools responding “no” were assumed to have an open campus.
Covariates
Student-level covariates included sex (male, female, no response), grade (9, 10, 11, 12, no response), ethnicity (White, Black, Asian, Latinx, other/mixed/missing) and money available weekly for spending or saving from allowance or part-time employment (zero; $1–$20; $21–$100; $100+; I do not know).
School-level covariates included province (Alberta, British Columbia, Ontario, Quebec), urbanicity and school-area median household income. School postal codes were cross-referenced with data from Statistics Canada to determine median average household income (≤ CAD 50 000; 50 001–75 000; 75 001–100 000; > 100 000) and urbanicity of the school location. Schools were classified as located in rural (with a population < 1000 or a density < 400 people per square kilometre), small urban (with a population from 1000–29 999), medium urban (30 000–99 999) or large urban (100 000+) areas. Given that the number of fast food retailers differs according to population size and density, with more retailers with increasing levels of urbanicity,Footnote 19Footnote 35Footnote 36 urbanicity was included as a proxy of the food retail environment surrounding schools. Models for SSB intake (including soft drinks and sports drinks, and sugar-sweetened coffee and tea drinks) and snack purchasing outcomes also controlled for the number of snack and beverage VMs available to students and located within schools, which were assessed by trained research staff during school data collections.
Statistical analysis
All analyses were implemented in SAS version 9.4 (SAS Institute Inc., Cary, NC, USA). Descriptive statistics were calculated for students attending schools with and without CCP by using procedures PROC FREQ and PROC TTEST. Regression models were used to test whether attending schools with CCP predicted student weekday eating behaviours, controlling for student-level (i.e. sex, grade, ethnicity, weekly spending money) and school-level (i.e. urbanicity, median household income, province) covariates.
Outcomes were treated as ordinal, since the provided response options were naturally ordered, and smaller Akaike Information Criterion (AIC) values indicated that multiple ordinal regression models were more appropriate than multiple linear regression models. Also, using PROC GLM to analyze data as continuous, the residual plots failed to meet the normality assumption. To test the proportional odds assumption, we assumed different slopes by specifying the UNEQUALSLOPES option and tested whether those slopes were the same in PROC LOGISTIC. The results for five of eight models indicated that this assumption was upheld, but it was violated for the lunch brought from home, school cafeteria lunch and snacks from school vending machine outcomes. However, the estimates under EQUALSLOPES and UNEQUALSLOPES were found to be comparable for these three outcomes. Ordinal models were chosen for ease of interpretation, using the same model for the eight separate outcomes.
Intraclass correlation coefficients (ICCs) were estimated by treating the outcomes as continuous to indicate the variance explained by school clustering. The school-level ICCs were as follows: 0.105 for lunch brought from home, 0.136 for school cafeteria lunch, 0.102 for fast food/restaurant lunch, 0.061 for school VM snack, 0.028 for snacks purchased off of school property, 0.018 for sugar-sweetened soft drinks and sports drinks and 0.049 for coffee or tea with sugar. PROC GENMOD was used for regression analyses, with school ID identified as the clustering variable and specifying independent working correlation structure to account for within-school correlations.
Adjusted results are reported for all models. No interactions by grade and urbanicity were found when tested (results not shown).
Results
Sample
Sample descriptives are presented in Table 1. A total of 74 501 students at 134 secondary schools (15 British Columbia [BC], 8 Alberta, 61 Ontario, 52 Quebec) participated in Year 7 (2018/19) of the COMPASS study (84.2% response rate). Quebec students in Secondary I/II (equivalent to Grades 7/8) were removed (n = 13 891), leaving 60 610 students. Quebec students in Secondary III, IV and V were classified as Grades 9, 10 and 11, respectively. Students with missing outcome data were removed from the relevant model, thus the number of missing students removed from models varied by the outcome (3049 were missing data on home-packed lunches; 2646 for cafeteria lunches; 2479 for fast food or other restaurant lunches; 2319 for school VM snacks; 2483 for snacks purchased off of school property; 2504 for sugar-sweetened soft drinks and sports drinks; 2462 for sugar-sweetened coffee or tea). Students with missing covariates (n = 1175) were retained in the analysis and their missing responses were coded as missing/nonresponse.
| Sociodemographic variables | Campus policies | p-value | ||
|---|---|---|---|---|
| Open | Closed | |||
| % (N) | % (N) | |||
| Sex | Female | 49.1 (26 495) | 49.1 (3241) | 0.6952 |
| Male | 49.6 (26 804) | 49.8 (3287) | ||
| No response | 1.3 (705) | 1.2 (78) | ||
| Grade | 9 | 28.4 (15 323) | 29.8 (1971) | 0.002 |
| 10 | 28.5 (15 369) | 27.7 (1832) | ||
| 11 | 26.2 (14 149) | 27.1 (1791) | ||
| 12 | 15.6 (8427) | 14.1 (930) | ||
| No response | 1.4 (736) | 1.2 (82) | ||
| Ethnicity | White | 65.1 (35 154) | 64.2 (4242) | < 0.0001 |
| Black | 3.9 (2120) | 5.8 (384) | ||
| Asian | 12.2 (6615) | 10.0 (662) | ||
| Latinx | 2.8 (1535) | 2.7 (177) | ||
| Other/mixed/missing | 15.9 (8580) | 17.3 (1141) | ||
| Weekly money available for spending/saving | None | 15.2 (8104) | 16.6 (1082) | < 0.0001 |
| $1–$20 | 22.4 (11 954) | 22.4 (1459) | ||
| $21–$100 | 24.5 (13 062) | 23.9 (1555) | ||
| > $100 | 22.8 (12 121) | 19.2 (1250) | ||
| I don’t know | 15.1 (8029) | 17.9 (1168) | ||
| Province | Alberta | 3.7 (244) | 5.7 (3057) | < 0.0001 |
| British Columbia | 3.8 (250) | 18.8 (10 152) | ||
| Ontario | 63.6 (4204) | 49.0 (26 471) | ||
| Quebec | 28.9 (1908) | 26.5 (14 324) | ||
| Urbanicity | Large urban | 57.3 (30 920) | 42.5 (2806) | < 0.0001 |
| Medium urban | 12.0 (6502) | 16.2 (1071) | ||
| Rural | 1.1 (603) | 17.6 (1164) | ||
| Small urban | 29.6 (15 979) | 23.7 (1565) | ||
| School area median household income (CAD) | $25 000–$50 000 | 14.0 (7537) | 0.0 (2) | < 0.0001 |
| $50 001–$75 000 | 57.6 (31 126) | 59.4 (3922) | ||
| $75 001–$100 000 | 23.9 (12 890) | 14.7 (973) | ||
| > $100 000 | 4.5 (2451) | 25.9 (1709) | ||
| Number of school snack vending machines | 0 | 25.4 (13 719) | 19.2 (1268) | < 0.0001 |
| 1 | 35.5 (19 165) | 48.5 (3201) | ||
| 2 | 32.6 (17 588) | 20.5 (1357) | ||
| 3 | 6.5 (3532) | 0 (0) | ||
| 4 | 0 (0) | 11.8 (780) | ||
| Number of school beverage vending machines | 0 | 9.9 (5336) | 6.2 (409) | < 0.0001 |
| 1 | 23.5 (12 713) | 38.1 (2520) | ||
| 2 | 30.5 (16 464) | 17.9 (1181) | ||
| 3 | 18.4 (9940) | 9.8 (645) | ||
| 4 | 10.9 (5905) | 0 (0) | ||
| 5 | 4.5 (2429) | 28.0 (1851) | ||
| 6 | 2.3 (1217) | 0 (0) | ||
Note: Data are from Year 7 (2018/19) of the COMPASS Study.Footnote 32 |
||||
CCP were reported by 16 secondary schools, including 8 in Ontario (2 private, 6 public), a private school in BC, a public school in Alberta and six Quebec schools (3 private, 3 public). The 16 secondary schools were located in rural (n = 3) and small (n = 4), medium (n = 3) and large (n = 6) urban areas.
Ordinal regression models
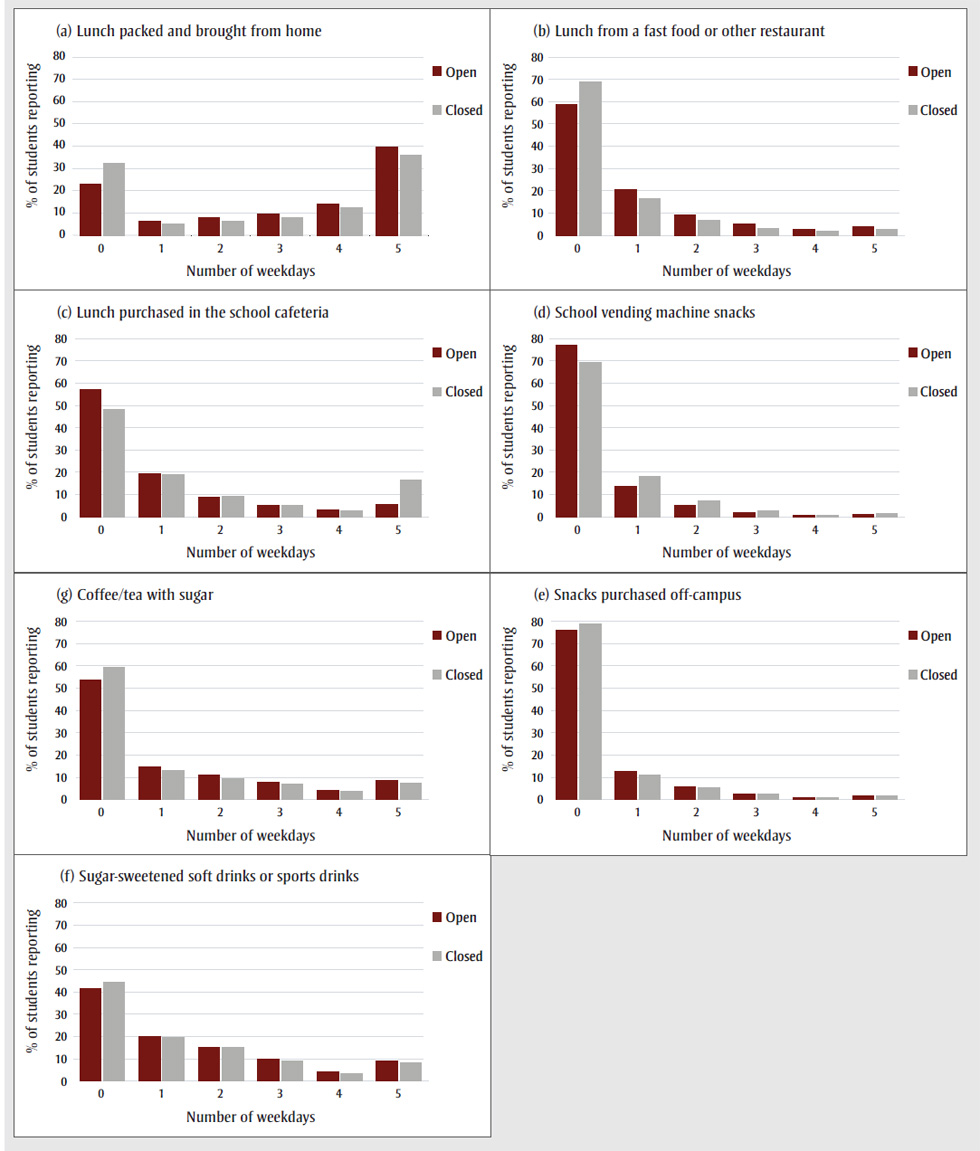
Figure 1 shows student-reported dietary measures by presence or absence of CCP. Tables 2 to 4 show adjusted regression model results with student- and school-level covariates.
Note: Data are from Year 7 (2018/19) of the COMPASS Study.Footnote 32
Figure 1 - Text description
| Type of meal | Number of weekdays | % of students reporting | |
|---|---|---|---|
| Open campus schools | Closed campus schools | ||
| Lunch packed and brought from home | 0 | 23 | 32.4 |
| 1 | 6.2 | 5.1 | |
| 2 | 7.8 | 6.3 | |
| 3 | 9.6 | 7.9 | |
| 4 | 14 | 12.5 | |
| 5 | 39.5 | 35.8 | |
| Lunch from a fast food or other restaurant | 0 | 58.7 | 69 |
| 1 | 20.7 | 16.4 | |
| 2 | 9.2 | 6.8 | |
| 3 | 5 | 3.2 | |
| 4 | 2.5 | 1.8 | |
| 5 | 3.8 | 2.7 | |
| Lunch purchased in the school cafeteria | 0 | 57.7 | 48.1 |
| 1 | 19.5 | 18.8 | |
| 2 | 9.1 | 9.2 | |
| 3 | 5.3 | 5.3 | |
| 4 | 2.9 | 2.8 | |
| 5 | 5.6 | 15.7 | |
| School vending machine snacks | 0 | 77 | 69.4 |
| 1 | 13.6 | 18.3 | |
| 2 | 5.3 | 7.4 | |
| 3 | 2.1 | 2.8 | |
| 4 | 0.7 | 0.9 | |
| 5 | 1.3 | 1.4 | |
| Coffee/tea with sugar | 0 | 53.6 | 59.4 |
| 1 | 14.5 | 13 | |
| 2 | 11.2 | 9.3 | |
| 3 | 7.9 | 7.1 | |
| 4 | 4.1 | 3.6 | |
| 5 | 8.7 | 7.5 | |
| Snacks purchased off campus | 0 | 76.1 | 78.7 |
| 1 | 12.8 | 11.2 | |
| 2 | 5.9 | 5.2 | |
| 3 | 2.5 | 2.4 | |
| 4 | 0.9 | 0.8 | |
| 5 | 1.8 | 1.7 | |
| Sugar-sweetened soft drinks or sports drinks | 0 | 41.5 | 44.3 |
| 1 | 20.2 | 19.7 | |
| 2 | 15.3 | 15.3 | |
| 3 | 9.9 | 8.9 | |
| 4 | 4.1 | 3.4 | |
| 5 | 9 | 8.4 | |
| Sociodemographic variables | Ate home-packed lunch at school | Purchased lunch in school cafeteria | Purchased lunch in a fast food or other restaurant | |||
|---|---|---|---|---|---|---|
| Est. | 95% CI | Est. | 95% CI | Est. | 95% CI | |
| Sex (ref: Female) | ||||||
| Male | −0.12Footnote *** | −0.17, −0.07 | −0.01 | −0.08, 0.07 | 0.40Footnote *** | 0.35, 0.46 |
| No response | −0.33Footnote ** | −0.55, −0.11 | −0.02 | −0.23, 0.19 | 0.29 | 0.04, 0.55 |
| Grade (ref: 9) | ||||||
| 10 | −0.02 | −0.07, 0.03 | −0.09Footnote ** | −0.16, −0.02 | 0.05 | −0.03, 0.12 |
| 11 | −0.07Footnote * | −0.12, −0.02 | −0.14Footnote *** | −0.22, −0.07 | 0.11Footnote * | 0.02, 0.20 |
| 12 | −0.25Footnote *** | −0.33, −0.17 | −0.42Footnote *** | −0.54, −0.31 | 0.35Footnote *** | 0.23, 0.46 |
| No response | −0.22 | −0.44, 0.00 | −0.06 | −0.26, 0.15 | 0.43Footnote *** | 0.19, 0.67 |
| Ethnicity (ref: White) | ||||||
| Black | −0.63Footnote *** | −0.75, −0.50 | 0.65Footnote *** | 0.51, 0.79 | 0.82Footnote *** | 0.68, 0.96 |
| Asian | −0.08 | −0.22, 0.05 | 0.55Footnote *** | 0.39, 0.71 | −0.01 | −0.18, 0.16 |
| Latinx | −0.22Footnote *** | −0.33, −0.12 | 0.31Footnote *** | 0.19, 0.43 | 0.33Footnote *** | 0.20, 0.47 |
| Other/mixed/missing | −0.34Footnote *** | −0.40, −0.27 | 0.25Footnote *** | 0.14, 0.35 | 0.32Footnote *** | 0.24, 0.41 |
| Weekly spending money (CAD) (ref: $0) | ||||||
| $1–$20 | −0.31Footnote *** | −0.37, −0.25 | 0.63Footnote *** | 0.55, 0.71 | 0.79Footnote *** | 0.71, 0.87 |
| $21–$100 | −0.62Footnote *** | −0.70, −0.53 | 0.87Footnote *** | 0.78, 0.96 | 1.19Footnote *** | 1.11, 1.28 |
| > $100 | −0.71Footnote *** | −0.80, −0.63 | 0.80Footnote *** | 0.69, 0.90 | 1.39Footnote *** | 1.32, 1.47 |
| I don’t know | −0.16Footnote *** | −0.22, −0.10 | 0.45Footnote *** | 0.36, 0.53 | 0.64Footnote *** | 0.56, 0.72 |
| School-area median household income (CAD) (ref: $25 000–$50 000) | ||||||
| $50 001–$75 000 | −0.35Footnote ** | −0.59, −0.10 | 0.47Footnote *** | 0.23, 0.72 | −0.07 | −0.48, 0.33 |
| $75 001–$100 000 | −0.15 | −0.42, 0.13 | 0.33Footnote * | 0.02, 0.64 | −0.14 | −0.63, 0.36 |
| > $100 000 | −0.28 | −0.58, 0.02 | 0.25 | −0.19, 0.69 | −0.22 | −0.76, 0.32 |
| Province (ref: Ontario) | ||||||
| Alberta | −0.05 | −0.29, 0.18 | −0.02 | −0.40, 0.37 | 0.24 | −0.10, 0.58 |
| British Columbia | 0.34Footnote *** | 0.14, 0.54 | −0.25 | −0.52, 0.01 | −0.37Footnote ** | −0.64, −0.10 |
| Quebec | 0.62Footnote *** | 0.39, 0.85 | −0.16 | −0.43, 0.11 | −0.95Footnote *** | −1.27, −0.64 |
| Urbanicity (ref: Large urban) | ||||||
| Medium urban | −0.03 | −0.28, 0.21 | −0.08 | −0.46, 0.31 | 0.20 | −0.13, 0.52 |
| Rural | −0.01 | −0.42, 0.39 | 0.04 | −0.66, 0.75 | −0.16 | −0.94, 0.63 |
| Small urban | −0.35Footnote ** | −0.56, −0.13 | 0.36Footnote ** | 0.11, 0.61 | 0.27 | 0.00, 0.55 |
| Closed campus policy (ref: No) | ||||||
| Yes | −0.23 | −0.62, 0.16 | 0.46 | −0.04, 0.97 | −0.45Footnote ** | −0.75, −0.14 |
|
Abbreviations: CAD, Canadian dollars; CI, confidence interval; Est., estimate.
|
||||||
| Sociodemographic variables | Purchased snacks from school vending machines | Purchased snacks from off-campus retail | ||
|---|---|---|---|---|
| Est. | 95% CI | Est. | 95% CI | |
| Sex (ref: Female) | ||||
| Male | 0.11Footnote ** | 0.04, 0.18 | 0.38Footnote *** | 0.31, 0.44 |
| No response | 0.29Footnote * | 0.04, 0.55 | 0.51Footnote *** | 0.24, 0.79 |
| Grade (ref: 9) | ||||
| 10 | −0.20Footnote *** | −0.27, −0.12 | −0.06 | −0.13, 0.00 |
| 11 | −0.39Footnote *** | −0.48, −0.30 | −0.22Footnote *** | −0.29, −0.15 |
| 12 | −0.70Footnote *** | −0.84, −0.56 | −0.38Footnote *** | −0.48, −0.29 |
| No response | 0.28Footnote * | 0.03, 0.53 | 0.27Footnote ** | 0.07, 0.48 |
| Ethnicity (ref: White) | ||||
| Black | 0.63Footnote *** | 0.51, 0.75 | 0.64Footnote *** | 0.53, 0.75 |
| Asian | 0.06 | −0.12, 0.25 | 0.03 | −0.10, 0.16 |
| Latinx | 0.27Footnote *** | 0.13, 0.40 | 0.12Footnote * | 0.00, 0.25 |
| Other/mixed/missing | 0.22Footnote *** | 0.11, 0.33 | 0.24Footnote *** | 0.16, 0.32 |
| Weekly spending money (CAD) (ref: $0) | ||||
| $1–$20 | 0.61Footnote *** | 0.52, 0.69 | 0.65Footnote *** | 0.58, 0.73 |
| $21–$100 | 0.75Footnote *** | 0.66, 0.84 | 0.80Footnote *** | 0.72, 0.88 |
| > $100 | 0.70Footnote *** | 0.61, 0.78 | 0.87Footnote *** | 0.87, 0.79 |
| I don’t know | 0.43Footnote *** | 0.34, 0.52 | 0.47Footnote *** | 0.39, 0.55 |
| School-area median household income (CAD) (ref: $25 000–$50 000) | ||||
| $50 001–$75 000 | 0.32Footnote * | 0.02, 0.61 | −0.06 | −0.30, 0.17 |
| $75 001–$100 000 | 0.34 | −0.07, 0.75 | −0.29 | −0.61, 0.03 |
| > $100 000 | 0.17 | −0.30, 0.63 | −0.39 | −0.77, 0.00 |
| Province (ref: Ontario) | ||||
| Alberta | 0.97Footnote *** | 0.53, 1.41 | 0.62Footnote *** | 0.35, 0.89 |
| British Columbia | 0.64Footnote ** | 0.21, 1.06 | 0.42Footnote ** | 0.16, 0.67 |
| Quebec | 0.50Footnote *** | 0.25, 0.74 | 0.08 | −0.13, 0.29 |
| Urbanicity (ref: Large urban) | ||||
| Medium urban | −0.08 | −0.43, 0.26 | −0.05 | −0.29, 0.20 |
| Rural | 0.10 | −0.39, 0.59 | 0.00 | −0.76, 0.75 |
| Small urban | 0.19 | −0.04, 0.43 | 0.00 | −0.20, 0.21 |
| Number of school VMs | ||||
| Snack VMs (0–4) | 0.34Footnote *** | 0.20, 0.48 | 0.01 | −0.10, 0.12 |
| Beverage VMs (0–6) | 0.03 | −0.08, 0.13 | −0.02 | −0.08, 0.04 |
| Closed campus policy (ref: No) | ||||
| Yes | 0.42Footnote ** | 0.11, 0.74 | 0.00 | −0.37, 0.37 |
|
Abbreviations: CAD, Canadian dollars; CI, confidence interval; Est., estimate; VMs, vending machines.
|
||||
| Sociodemographic variables | Sugar-sweetened soft drinks or sports drinks | Sugar-sweetened coffee/tea drinks | ||
|---|---|---|---|---|
| Est. | 95% CI | Est. | 95% CI | |
| Sex (ref: Female) | ||||
| Male | 0.60Footnote *** | 0.56, 0.64 | −0.63Footnote *** | −0.67, −0.58 |
| No response | 0.60Footnote *** | 0.39, 0.81 | −0.36Footnote ** | −0.60, −0.13 |
| Grade (ref: 9) | ||||
| 10 | −0.12Footnote *** | −0.16, −0.08 | 0.09Footnote *** | 0.04, 0.14 |
| 11 | −0.22Footnote *** | −0.27, −0.17 | 0.19Footnote *** | 0.14, 0.25 |
| 12 | −0.33Footnote *** | −0.38, −0.27 | 0.32Footnote *** | 0.25, 0.39 |
| No response | 0.00 | −0.19, 0.19 | 0.46Footnote *** | 0.25, 0.67 |
| Ethnicity (ref: White) | ||||
| Black | 0.58Footnote *** | 0.47, 0.68 | 0.06 | −0.05, 0.18 |
| Asian | −0.07 | −0.16, 0.01 | −0.05 | −0.14, 0.03 |
| Latinx | 0.06 | −0.04, 0.17 | 0.12 | −0.01, 0.25 |
| Other/mixed/missing | 0.16Footnote *** | 0.10, 0.23 | 0.25Footnote *** | 0.19, 0.31 |
| Weekly spending (CAD) money (ref: $0) | ||||
| $1–$20 | 0.36Footnote *** | 0.31, 0.41 | 0.35Footnote *** | 0.29, 0.41 |
| $21–$100 | 0.48Footnote *** | 0.42, 0.54 | 0.59Footnote *** | 0.53, 0.66 |
| > $100 | 0.52Footnote *** | 0.46, 0.59 | 0.74Footnote *** | 0.67, 0.80 |
| I don’t know | 0.31Footnote *** | 0.25, 0.37 | 0.31Footnote *** | 0.24, 0.37 |
| School-area median household income (CAD) (ref: $25 000–$50 000) | ||||
| $50 001–$75 000 | 0.08Footnote * | 0.00, 0.16 | 0.05 | −0.08, 0.17 |
| $75 001–$100 000 | 0.03 | −0.06, 0.12 | 0.00 | −0.14, 0.13 |
| > $100 000 | 0.05 | −0.11, 0.20 | −0.01 | −0.19, 0.16 |
| Province (ref: Ontario) | ||||
| Alberta | 0.23Footnote * | 0.03, 0.43 | 0.24Footnote ** | 0.09, 0.39 |
| British Columbia | −0.27Footnote *** | −0.37, −0.16 | −0.05 | −0.18, 0.08 |
| Quebec | −0.24Footnote *** | −0.32, −0.16 | −0.90Footnote *** | −1.00, −0.80 |
| Urbanicity (ref: Large urban) | ||||
| Medium urban | 0.11Footnote * | 0.01, 0.21 | 0.06 | −0.06, 0.18 |
| Rural | 0.18 | −0.02, 0.37 | −0.14 | −0.35, 0.08 |
| Small urban | 0.17Footnote *** | 0.09, 0.26 | 0.08 | 0.00, 0.17 |
| Number of school VMs | ||||
| Beverage VMs (0–6) | −0.02 | −0.04, 0.00 | −0.01 | −0.04, 0.02 |
| Closed campus policy (ref: No) | ||||
| Yes | −0.18Footnote *** | −0.29, −0.07 | −0.17Footnote *** | −0.28, −0.07 |
|
Abbreviations: CAD, Canadian dollars; CI, confidence interval; Est., estimate; VMs, vending machines.
|
||||
Differences by student- and school-level covariates
Students in Grades 11 and 12 were more likely to purchase lunch from external sources, and less likely to eat home-packed or cafeteria lunches and to purchase snacks from retailers off of school property, on more weekdays than Grade 9 students. Students in Grade 10 were less likely to eat cafeteria lunches than Grade 9 students. In terms of SSB, students in Grades 10 to 12 were more likely to consume sweetened tea or coffee drinks, but less likely to consume soft drinks or sports drinks, on more weekdays than Grade 9 students.
Students identifying as Black, Latinx or other/mixed ethnicity were less likely than White students to eat a home-packed lunch and more likely to eat lunch from fast food restaurants and snacks from school VMs. Students of Black or other/mixed ethnicity were also more likely to consume SSB and snacks from off-campus retail locations on more weekdays than White students.
Males were less likely to bring a home-packed lunch and more likely to consume fast food lunches, school VM snacks and soft drinks or sports drinks, while females consumed sweetened coffee or tea drinks on more weekdays.
Students with any amount of spending money were less likely to bring a home-packed lunch, and more likely to purchase lunch and snacks within school or off-campus and to consume SSBs on more weekdays than their peers without spending money.
At the school level, the number of snack VMs was positively associated with students purchasing snacks from school VMs on more days, but not with snacks purchased from off-campus options. Conversely, school drink VMs were not associated with weekday SSB consumption.
Geographically, frequently eating a home-prepared lunch was more common in BC and Quebec schools than in Ontario, while purchasing lunch at a fast food outlet or other restaurant was less frequent. Relative to Ontario, at Quebec, BC and Alberta schools, students purchased snacks from school VMs on more weekdays, and students in Alberta and BC schools also purchased off-campus snacks more often. Students in Alberta schools were more likely than Ontario students to report soft drink or sports drink consumption, while students in BC and Quebec schools were less likely. Similarly, consumption of sugar-sweetened coffee or tea was more often reported by Alberta students and less often by Quebec students, relative to students in Ontario schools. No provincial differences resulted in the likelihood of students eating a cafeteria-prepared lunch.
Students in small urban areas were less likely to bring a home-packed lunch and more likely to consume cafeteria-purchased lunches and soft drinks or sports drinks on more weekdays than those attending schools in larger urban areas. Urbanicity had no impact on snack purchases, fast food or other restaurant lunches or sweetened coffee or tea drinks.
Finally, students attending schools in areas with median household incomes of $50 001 to $75 000 were less likely to bring home-packed lunches and more likely to buy cafeteria lunches on more weekdays than those attending schools in lower-income areas.
Closed versus open campus policies
There was no difference in the number of weekdays on which students would be likely to eat home-packed lunches (estimate [est.] −0.23, 95% CI: −0.62 to 0.16) or snacks purchased off of school property (est. 0.00, 95% CI: −0.37 to 0.37), based on whether they attended a school with open or closed campus policies. Attending a CCP school was associated with a higher likelihood of eating snacks purchased from school VMs on more days (est. 0.42, 95% CI: 0.11 to 0.74), and a lower likelihood of eating lunch purchased from a fast food place or other restaurant off of school property (est. −0.45, 95% CI: −0.75 to −0.14). Finally, students attending CCP schools were less likely to consume SSBs, including soft drinks and sports drinks (est. −0.18, 95% CI: −0.29 to −0.07) and coffee or tea drinks with sugar (est. −0.17, 95% CI: −0.28 to −0.07]) on more weekdays than their peers at open campus schools.
Discussion
Only 16 of the 134 Ontario, Alberta, Quebec and BC participating secondary schools reported CCP, under which students were not allowed to leave school property during breaks in the day. Consistent with our hypotheses, students at CCP schools were more likely to eat snacks from school VMs, and less likely to drink SSBs (soft drinks, sports drinks or sweetened coffee/tea drinks) and purchase lunch from fast food or other restaurants on weekdays, than their peers attending schools with open campuses. However, the likelihood of bringing a home-packed lunch to school, purchasing lunch in the school cafeteria or eating snacks from convenience stores or similar off-campus retailers did not differ significantly based on attendance at open or closed campus schools. Therefore, while prospective studies are needed to examine within-student changes after policy implementation, cross-sectional results align with evidence from the United StatesFootnote 29 suggesting CCP may help improve adolescent diets by preventing the external food retail environment from compromising school nutrition policies.
Given the increased likelihood of purchasing snacks from school VMs, but no association with the frequency of home-prepared lunches, CCP may lead only those students already purchasing food to shift from buying lunch at off-campus sources to options available for sale in schools. Consequently, the influence of the school food environment on student diets is likely heightened in CCP schools. However, existing research indicates many schools are not compliant with nutrition policies on the food and beverages for sale in cafeterias or VMs.Footnote 3Footnote 37Footnote 38Footnote 39Footnote 40 In Canada, with school food regulation purely market-based in school cafeterias and restricted to within-school sales, student access to external retail is recognized as a key barrier to healthful school nutrition environments;Footnote 41 hence, CCP may serve to support policy adherence by reducing competitive sources that undermine financial viability of school cafeterias. Moreover, CCP represent a cost-effective intervention for schools, with potential revenue gains for school cafeterias (but also potential losses for surrounding businesses).
Results also suggest that spending money is the largest determinant of adolescent dietary behaviours on school days among the variables considered. Students with any amount of spending money were less likely to bring a home-packed lunch and more likely to consume SSBs and purchase lunch or snacks from in-school or off-campus sources on more weekdays than their peers without spending money. Results support the importance of considering students’ purchasing power, in addition to household or area-level socioeconomic status, as lower family socioeconomic status has typically been associated with poorer adolescent diet quality (e.g. greater fast foodFootnote 19 and SSBFootnote 42 intake). Canada remains one of the few industrialized countries without a national universal school food program, which would give all students access to healthy food during the school day at no cost to them.
Consistent with previous research,Footnote 29 VM availability within schools was positively associated with students purchasing snacks from school VMs. Conversely, school drink VMs were not associated with weekday SSB consumption, which may be expected given the regulation of school SSB sales, yet issues with compliance appear common.Footnote 39 Previous studies have found greater SSB consumption in association with availability in schools.Footnote 18Footnote 43
As expected, with increased autonomy, students in Grades 10 to 12 were more likely to purchase lunch from outside sources on more days, and less likely to eat a home-packed or cafeteria lunch; however, contrary to expectation, they purchased snacks from convenience stores and external retail options less often than Grade 9 students. Unlike lunch, it is plausible that weekday snacks may have been purchased before or after school. Purchasing behaviours outside of school hours may also explain the lack of association between CCP and snack purchases from off-campus retail. In contrast, Neumark-Sztainer et al. found students at suburban US schools with CCP during lunchtime were less likely to eat food purchased at convenience stores than students at open campus schools.Footnote 29 Other researchers have noted that CCP would not be effective in preventing students from purchasing food at nearby food retailers before or after school.Footnote 20 While this may be the case, particularly for snacks, these preliminary cross-sectional results suggest an overall reduction in SSB consumption and fast food or other restaurant lunches during the school week; and given that at least one-third of students’ total caloric consumption occurs during school hours,Footnote 27Footnote 44Footnote 45 improving their lunchtime meal has considerable potential to advance population nutrition.
Home-prepared lunches are generally associated with healthier diets than purchased options from either school cafeterias or fast food or other restaurants;Footnote 25 however, prohibiting students from leaving campus does not appear to encourage more students to bring their lunch from home. In a photovoice study, high school students who brought a home-packed lunch perceived it to be a healthier, affordable and convenient option that permitted autonomy, while students who went off campus to purchase food reported the proximity, low cost, space for social interaction and perceived higher food quality as reasons.Footnote 46 Youth voice a desire for healthier options at schools and to be involved in the decision making about what foods are offered for sale in schools,Footnote 46 which could be a critical consideration for policy implementation. Schools considering CCP should explore how they can engage students in the process.
Beyond food, students emphasize the importance of the places and spaces available to eat and socialize safely and comfortably during lunch.Footnote 46 School cafeterias are considered loud and chaotic,Footnote 46 with long lines to purchase food or use microwaves deterring students from staying at school for lunch.Footnote 47 In response, some researchers have suggested changing staggered lunch hours and creating more youth-friendly spaces outside.Footnote 47 In fact, one reason for open campus polices is to reduce cafeteria congestion during lunch.Footnote 31 Schools with walkable neighbourhoods and food retailers in close proximity are more likely to have open campuses.Footnote 48 Another motive is to support adolescents’ autonomy and independence. In US schools that switched from closed to open campus environments, Grade 11 and 12 students felt more control over their environment than their peers at closed campuses; however, some students also reported disciplinary problems, poorer grades, less school spirit and reductions in their social life both in and out of school.Footnote 49 Future research is needed to compare positive and negative effects of open and closed campus policies on various behavioural, social and mental outcomes.
Strengths and limitations
This study is the first to evaluate adolescent dietary behaviours in relation to open or closed campus policies in Canadian schools. A key strength of this study is the data at student- and school-levels in varied contexts in four Canadian provinces. However, several limitations require consideration.
First, while the large sample and favourable response rate support generalizability, COMPASS was not designed to be representative.
Second, missing data for the outcomes may have biased the results. Given the large sample size, minimal amount of missing data, and the non-sensitive nature of the eating behaviour questions, however, we believe that the impact of these missing data was minimal. We were also able to retain many students in the analysis by including missing covariate data (sex, grade, ethnicity) as valid response options.
Third, additional confounders that were not controlled for may have contributed to the differences found in this study. For instance, while area urbanicity, province, median household income and the number of within-school VMs were controlled for, the study does not account for differences in the surrounding food environment. Urbanicity may not perfectly represent the variation in food retail environments surrounding schools.
Fourth, the primary limitations of this study are the use of cross-sectional data and self-reported dietary measures. Future studies should use prospective and quasi-experimental designs to test whether students transition from purchasing food off-campus to within the school after a closed campus policy is implemented. Student-reported behaviours and school administrator–reported policies introduce possible recall and social desirability biases. Also, the dietary measures are limited to assessing the number of days that students engaged in the behaviour indicated, and do not account for frequency per day.
Fifth, the SSB and snack measures assess weekday consumption and purchasing, but do not indicate when during the day the purchase was made (i.e. during school hours or before or after school); however, knowing overall weekday consumption is more important to determine nutritional impact.
Conclusion
In Canada, the food environments surrounding schools are key barriers to successful implementation of school nutrition policies, as these spaces fall outside the jurisdiction of provincial/territorial regulations.Footnote 14Footnote 41 CCP have the potential to protect adolescents from food environments in close proximity to schools and improve their diet quality, including reduced weekday consumption of SSB and lunches from fast food or other restaurants, but otherwise, the impact on diet quality may depend on the food available for sale within schools. Students already purchasing food may shift from off-campus retail choices to within-school options, highlighting the importance of ensuring healthy school food environments and/or encouraging students to bring home-prepared lunches. Future studies using experimental longitudinal designs are needed to determine the effect of school CCP on student nutrition, various other health behaviours and social, mental and academic outcomes.
Acknowledgements
The authors would like to thank the schools, school boards and students that have participated in the COMPASS study, and all COMPASS staff and team members.
Funding
The COMPASS study has been supported by a bridge grant from the Canadian Institutes of Health Research (CIHR) Institute of Nutrition, Metabolism and Diabetes through the “Obesity – Interventions to Prevent or Treat” priority funding awards (OOP-110788; awarded to SL); an operating grant from the CIHR Institute of Population and Public Health (MOP-114875; awarded to SL); a CIHR Project Grant (PJT-148562; awarded to SL); a CIHR Project Grant (PJT-159693; awarded to KP); and by a research funding arrangement with Health Canada (#1617-HQ-000012; awarded to SL). The COMPASS-Quebec data benefit from funding from the Ministère de la Santé et des Services sociaux of the province of Quebec, and the Direction régionale de santé publique du CIUSSS de la Capitale-Nationale.
Conflicts of interest
The authors declare that they have no conflicts of interest.
Authors’ contributions and statement
KAP and AGC conceptualized the manuscript. KAP led the writing and wrote the first draft. MM assisted with the literature review. WQ conducted the statistical analysis. STL is the lead of the COMPASS study. All authors (KAP, AGC, WQ, MM, MV, STL) informed the design of the study, contributed to the interpretation of results, provided feedback on drafts and approved the final version of the manuscript.
The content and views expressed in this article are those of the authors and do not necessarily reflect those of the Government of Canada.