
Original quantitative research – Stepping up to the Canadian opioid crisis: a longitudinal analysis of the correlation between socioeconomic status and population rates of opioid-related mortality, hospitalization and emergency department visits (2000–2017)

HPCDP Journal Home
Published by: The Public Health Agency of Canada
Date published: June 2022
ISSN: 2368-738X
Submit a manuscript
About HPCDP
Browse
Mhd. Wasem Alsabbagh, PhDAuthor reference footnote 1; Martin Cooke, PhDAuthor reference footnote 1Author reference footnote 2; Susan J. Elliott, PhDAuthor reference footnote 3; Feng Chang, PharmDAuthor reference footnote 1; Noor-Ul-Huda Shah, MScAuthor reference footnote 1; Marco Ghobrial, PharmDAuthor reference footnote 1
https://doi.org/10.24095/hpcdp.42.6.01
This article has been peer reviewed.
Author references
Correspondence
Mhd. Wasem Alsabbagh, University of Waterloo, Faculty of Science, School of Pharmacy, 10A Victoria St. S., Kitchener, ON N2G 1C5; Tel: (519) 888-4567 ext. 21382; Email: wasem.alsabbagh@uwaterloo.ca
Suggested citation
Alsabbagh MW, Cooke M, Elliott SJ, Chang F, Shah N, Ghobrial M. Stepping up to the Canadian opioid crisis: a longitudinal analysis of the correlation between socioeconomic status and population rates of opioid-related mortality, hospitalization and emergency department visits (2000–2017). Health Promot Chronic Dis Prev Can. 2022;42(6):229-237. https://doi.org/10.24095/hpcdp.42.6.01
Abstract
Introduction: High levels of income inequality and increased opioid-related harm across Canada bring into question the role of socioeconomic status (SES) in the opioid epidemic. Only a few studies have examined this association, and most of those have analyzed this issue on a provincial level. This study examined the association between opioid-related health outcomes and SES, and investigated rate ratios over time.
Methods: Administrative databases were used to identify opioid-related mortality, hospitalization and emergency department visits between 2000 and 2017. Patient’s postal code was linked to the quintile of median household income at the forward sortation area level. Crude rates and age- and sex-adjusted rates in each quintile were calculated, as well as the adjusted rate ratio of average annual rates between the lowest and highest quintiles. The significance of the time trend of rate ratios for all outcomes was examined using linear regression.
Results: A stepped gradient of opioid-related outcomes across all income quintiles emerged from these data. For mortality, hospitalization and emergency department visits, the average annual rate ratio between lowest quintile and highest quintile was 3.8, 4.3 and 4.9, respectively. These ratios were generally stable and consistent over the study period, albeit the opioid-related mortality SES gap decreased gradually (p < 0.01).
Conclusion: Area income quintile was found to be highly associated with opioid outcomes. Psychosocial factors (stress, unemployment, housing insecurity) that are typically concentrated in low SES areas may play a significant role in the opioid epidemic. Health policies should address these factors in order to provide effective solutions.
Keywords: analgesics, opioid, mortality, hospitalization, emergency service, hospital, social class, opiate addiction, income, time
Highlights
- Socioeconomic status (SES) may be an important factor in determining opioid outcomes.
- Only a few research studies to date have investigated this relationship.
- We used administrative databases to examine the associations between SES (measured by area’s income quintile) and opioid mortality, hospitalization and emergency department (ED) visits.
- We found evidence of a socioeconomic gradient in all opioid-related outcomes. The rate ratio between lowest income and highest income quintiles was approximately 4 for mortality and hospitalizations and approximately 5 for ED visits.
- The rate ratio between lowest income and highest income quintiles was generally stable and consistent over time. However, the mortality rate ratio showed a decreasing trend.
Introduction
Canada has seen a significant increase in opioid-related mortality and morbidity,Footnote 1 rendering the opioid epidemic a challenging public health priority.Footnote 2Footnote 3 The incidence of opioid-related harms continues to grow;Footnote 4Footnote 5 for example, the rate of opioid-poisoning hospitalizations in Canada increased by more than 50% over a 10-year period (2007–2017),Footnote 6 while the rate of opioid-related emergency department (ED) visits increased by more than 100% in Alberta and Ontario from 2012 to 2017.Footnote 6 Many factors influence adverse outcomes of opioid use and can affect patients in a multitude of ways.Footnote 7
A potentially important issue in understanding opioid-related harms is socioeconomic position. Whether conceptualized as socioeconomic status (SES), social class or simply as income or wealth, one’s location in social hierarchies might play a major role in opioid-related harms.Footnote 8Footnote 9 Since the mid-1990s, health sciences have shifted from a predominantly biomedical and clinical focus to a growing emphasis on population health (i.e. “health as a social science”).Footnote 10 Using this lens, adverse opioid outcomes should be considered in light of the relationship between social position and individual behaviours.Footnote 1Footnote 7Footnote 11
SES is a complex construct, signifying one’s position within a social hierarchy, and often measured by income, education and occupational status.Footnote 12Footnote 13 SES typically captures both material and social conditions and reflects both current social and economic resources and past conditions.Footnote 14 In this regard, lifestyle “choices” such as substance use can be seen as not simply the result of an individual’s decisions and agency. Rather, they are structured by aspects of past experience (including families, neighbourhoods, education and other earlier life events) in addition to current access to material and social resources that might help in coping with challenges. SES is often spatially concentrated, with individuals and families with lower SES tending to live in areas with poorer access to resources.Footnote 15Footnote 16
Research linking SES and opioid-related harms is emerging.Footnote 7 Several studies have examined this association in the US,Footnote 17Footnote 18Footnote 19 though there have been few studies in Canada at the national level. Carrière et al. examined opioid-poisoning hospitalizations in Canada (excluding Quebec) between 2011 and 2016, using the 2011 National Household Survey (NHS) linked to hospitalizations.Footnote 20 Lower income, lower education, unemployment and Indigenous identity were found to be associated with higher rates of opioid-related hospitalizations (rate ratio = 3.9 between the highest and lowest income quintiles; 95% confidence interval [CI]: 3.4–4.6.Footnote 20). Regardless of questions of the validity of NHS income data due to the changes in census methodology in 2011,Footnote 21 this study was restricted to opioid-poisoning hospitalizations at one point in time. Importantly, it did not assess opioid use disorder (OUD), defined by the American Psychiatric Association as “a problematic pattern of opioid use (both prescribed and illicit) leading to problems or distress”Footnote 22, p.541 with several criteria pertaining to dose, craving, effects on work or school, use in dangerous situations and withdrawal in the 12-month period.Footnote 23Footnote 24
Canadian studies have examined the association between SES and opioid outcomes using provincial databases.Footnote 25 Researchers found in British Columbia that low SES (measured by the highest deprivation quintile) is associated with a greater reduction in life expectancy at birth due to overdose-related causes.Footnote 26Footnote 27 A study in Ontario found that the prevalence ratios of opioid morbidity were two to three times higher in the lowest quintile areas compared to the highest,Footnote 28 probably due to higher opioid prescribing rates and lower levels of care-seeking behaviour.
Although such studies can enlighten us about provincial patterns, they are of limited use in painting a national picture. All Canadian provinces are facing the opioid epidemic,Footnote 29 and understanding its relationship to SES will be essential to develop policies for prevention, harm reduction and treatment at a national level. It is also important to understand how these relationships might have changed over time, as the epidemic has progressed.Footnote 30
The objective of this study was therefore to examine how rates of opioid-related outcomes are related to area SES, and how these trends have unfolded over time at the national level.
Methods
This retrospective observational study analyzed data from Canada from 2000 to 2017. The methodology of this study has been described previously.Footnote 29 National administrative databases were employed to provide a complete depiction of all vital statistics and all encounters with the universal health care system in Canada.Footnote 31 We accessed the most comprehensive data available in Canadian jurisdictions including mortality (from all of Canada, 2000–2012 and Canada except Quebec, 2013–2017), hospitalization (Canada except Quebec, 2000–2012) and ED visits (Ontario, 2002–2008 and Ontario/Alberta combined, 2009–2012) (Appendix 1).
Data sources
Opioid mortality
We used the Canadian Vital Statistics Death (CVSD) database from 1 January 2000 until 31 December 2017 to identify opioid-related mortality. CVSD is an administrative database capturing all death cases in Canada, with demographic attributes (age, sex and postal code of the deceased’s residence) as well as medical attributes. The main and additional causes of death are coded using the International Classification of Disease Tenth Revision (ICD-10). Due to a technical limitation, opioid mortality data from Quebec were not available after 2012 and were not included in the average or in the annual rate calculation.Footnote 29 However, we included Quebec data in additional analysis of the annual rate from 2000 to 2012.
Opioid hospitalization
The Discharge Abstract Database (DAD) contains specific information about each hospitalization episode in Canada, outside of Quebec. It contains patient demographics (age, sex and first three characters of the postal code of area of residence) as well as clinical information. Diagnoses are coded according to the ICD Ninth Revision (ICD-9) and ICD-10, with up to 25 diagnoses listed. The first is the “main” diagnosis, and others are comorbidities.Footnote 32 Hospitalizations are recorded by fiscal year, from 1 April to 31 March. For this study, data were available from 2000/01 until 2012/13.
Opioid ED visits
The National Ambulatory Care Reporting System (NACRS) contains specific information about each ED visit in all facilities in Ontario (from 2002/03) and Alberta (starting from 2010/11); it also contains demographic and clinical information. Although some facilities in other provinces contribute to NACRS data, only Ontario and Alberta contribute from 100% of facilities.Footnote 33 For this study, data were available from 2002/03 to 2012/13. We included all cases from Ontario in annual rates as well as annual average rates. We also combined Ontario and Alberta in the annual rates starting from 2010/11.
Population and SES estimates
Estimates of population and SES were generated using census data. Each year of the study period was linked to population estimates of the individual’s area of residence at the forward sortation area (FSA) level (Appendix 2). FSAs are relatively small geographic units identified by the first three characters of the postal code. In urban areas, FSAs typically cover roughly 200 city blocks of major metropolitan areas, or entire medium-sized cities. In rural areas, FSAs usually include larger regions.Footnote 34
SES was estimated by FSA median annual total gross household income. Aggregate-level indicators are the most-used measures of SES in health researchFootnote 35 and the use of FSAs enabled identification of local differences in opioid-related mortality with a high level of granularity while protecting individual confidentiality. FSAs were arranged into median household income quintiles within provinces. Because of changes to the 2011 census,Footnote 21 income data for this year might not be reliable for small areas. We therefore used income from the 2006 census (Appendix 2). To calculate average annual mortality rates over the whole study period, we used population and income estimates from the 2016 census. For average annual hospitalization and ED visit rates, we used population estimates from 2016 and income estimates from 2006.
Measurements
Opioid mortality
To identify opioid death cases, we utilized the modified algorithm of the Centers for Disease Control and Prevention, and added heroin to captured entities.Footnote 29 In this algorithm, underlying cause of death should be drug poisoning, while an opioid or opioid-related entity should be listed in the multiple cause of death codes.Footnote 36 Appendix 3 contains the ICD codes for identifying opioid-related mortality. A sensitivity of 75% and a positive predictive value of 90% were estimated for this algorithm.Footnote 36
Opioid hospitalization and ED visits
A Canadian Institute for Health Information (CIHI) algorithm was used to identify opioid-related hospitalizations and ED visits—including both opioid poisonings and opioid use disorders.Footnote 37 To capture hospitalizations before the full implementation of ICD-10 in Canada, we also used ICD-9 codes (Appendix 4).Footnote 17 A sensitivity of 75% and positive predictive value of about 80% were reported for this algorithm.Footnote 38 We considered all fields of diagnosis if they contributed significantly to the duration of hospitalization or ED visit.Footnote 37
Data analysis
For deaths, hospitalizations and ED visits, we linked cases to the FSA population estimate and income quintile of the respective year of the census. We excluded cases missing postal codes, as well as cases in FSAs that could not be assigned income quintiles or for which median income was suppressed by Statistics Canada for confidentiality reasons. We calculated crude annual rates of opioid mortality, hospitalization and ED visits within each income quintile by summing all cases per annum and dividing them by the estimated population. For average annual rates, the numerator was all cases over the study period, while the denominator (population estimate from 2016 census year) was multiplied by the number of follow-up years. We adjusted all rates for age and sex differences between income quintiles using direct standardization.Footnote 39 Consistent with the CIHI method,Footnote 37 the Canadian population from the 2011 census was used as the standard population,Footnote 40 with age in 5-year intervals.
Rate ratios of the average annual age- and sex-standardized mortality, hospitalization and ED visits rates were computed by dividing the rate in each income quintile by that of the highest quintile. The 95% CIs for rate ratios were computed using the method suggested by Newman.Footnote 41 We used the lowest and highest income quintiles for the annual rate ratio calculation. We plotted the rate ratios of the mortality, hospitalization and ED visits over the study years. The significance of the slope was examined by estimating a linear regression between the year and rate ratio. A significance level of 5% was used for all statistical tests.
Ethics approval was obtained from the University of Waterloo Office of Research Ethics (ORE#41558). Data were accessed through the South-Western Ontario Research Data Centre (SWORDC), and analyses were performed using SAS version 9.4 (SAS Institute Inc., Cary, NC, USA). The numbers of cases and crude rates were rounded, according to Statistics Canada’s confidentiality rules, while adjusted rates and rate ratios were produced using unrounded numbers.
Results
Average annual rates were based on the realized 19 560 death cases, 82 125 hospitalizations and 71 055 ED visits. Of these, 96.4%, 94.5% and 100% were linked to an FSA with an estimated income quintile, respectively. Linkage success was higher for the annual crude rates, with 99.4%, 98.9% and 100% for death cases, hospitalizations and ED visits, respectively.
The crude average annual opioid-related mortality rate ranged from 17.9 cases per million in the highest income quintile to 69.0 cases per million in the lowest income quintile. Adjusted rates ranged from 18.6 to 72.1 cases per million between the highest and lowest income quintiles, respectively (Table 1). Therefore, the rate ratio between the lowest and highest income quintiles was 3.8 (95% CI: 3.6–4.0).
| FSA income quintile | Death cases | PopulationFootnote b | Average annual crude rate | Average age- and sex-adjusted rate | Adjusted rate ratioFootnote c | 95% CI |
|---|---|---|---|---|---|---|
| 1 (highest) | 1585 | 4 923 280 | 17.9 | 18.9 | 1.0 (reference) | N/A |
| 2 | 2325 | 5 115 515 | 25.3 | 26.4 | 1.4 | 1.3–1.5 |
| 3 | 4035 | 6 070 270 | 36.9 | 38.5 | 2.0 | 1.9–2.2 |
| 4 | 4960 | 6 086 520 | 45.3 | 48.2 | 2.6 | 2.4–2.7 |
| 5 (lowest) | 5955 | 4 792 290 | 69.0 | 72.1 | 3.8 | 3.6–4.0 |
Abbreviations: CI, confidence interval; FSA, forward sortation area; N/A, not applicable.
|
||||||
Crude average annual rates of opioid-related hospitalization ranged from 91.2 hospitalizations per million in the highest quintile to 402.8 hospitalizations per million in the lowest quintile (Table 2). The adjusted rates also ranged from 96.5 to 413.2 cases per million between the highest and lowest income quintiles, and the rate ratio between the lowest and highest income quintiles was 4.3 (4.2–4.4). The crude and adjusted average annual rate of ED visits ranged from 165.8 and 175.4 in the highest quintile to 842.1 and 861.6 per million, respectively (Table 3). Thus, a more pronounced rate ratio of 4.9 (4.8–5.1) for the average annual rate of ED visits was seen over the study period.
| FSA income quintile | Hospitalization cases | PopulationFootnote c | Average annual crude rate | Average age- and sex-adjusted rate | Adjusted rate ratioFootnote d | 95% CI |
|---|---|---|---|---|---|---|
| 1 (highest) | 4 520 | 4 923 280 | 91.2 | 96.5 | 1.0 (reference) | N/A |
| 2 | 5 835 | 5 115 515 | 135.6 | 138.9 | 1.4 | 1.4–1.5 |
| 3 | 9 020 | 6 070 270 | 200.0 | 203.8 | 2.1 | 2.1–2.2 |
| 4 | 15 785 | 6 086 520 | 276.2 | 284.7 | 3.0 | 2.9–3.0 |
| 5 (lowest) | 21 855 | 4 792 290 | 402.8 | 413.2 | 4.3 | 4.2–4.4 |
Abbreviations: CI, confidence interval; FSA, forward sortation area; N/A, not applicable.
|
||||||
| FSA income quintile | ED visit cases | PopulationFootnote c | Average annual crude rate | Average age- and sex-adjusted rate | Adjusted rate ratioFootnote d | 95% CI |
|---|---|---|---|---|---|---|
| 1 (highest) | 5 015 | 2 749 745 | 165.8 | 175.4 | 1.0 (reference) | N/A |
| 2 | 8 205 | 2 601 525 | 286.7 | 301.6 | 1.7 | 1.7–1.8 |
| 3 | 15 190 | 2 912 585 | 474.1 | 499.0 | 2.8 | 2.8–2.9 |
| 4 | 20 625 | 2 808 070 | 667.7 | 710.1 | 4.1 | 3.9–4.2 |
| 5 (lowest) | 22 020 | 2 377 180 | 842.1 | 861.6 | 4.9 | 4.8–5.1 |
Abbreviations: CI, confidence interval; ED, emergency department; FSA, forward sortation area; N/A, not applicable.
|
||||||
The time trend of the rate ratio between the lowest and highest income quintiles showed that the lowest quintile consistently had higher rates of opioid-related mortality, hospitalizations and ED visits (Appendices 5–9). Income-related inequality in opioid-related mortality rates decreased from 2000 to 2017 (Figure 1A). We estimated the slope of the linear time trend to be −0.13 (p < 0.01). When we restricted the analysis to 2000 to 2012 from all of Canada (Figure 1B), the slope was less pronounced (−0.10) but was still significant (p = 0.01).
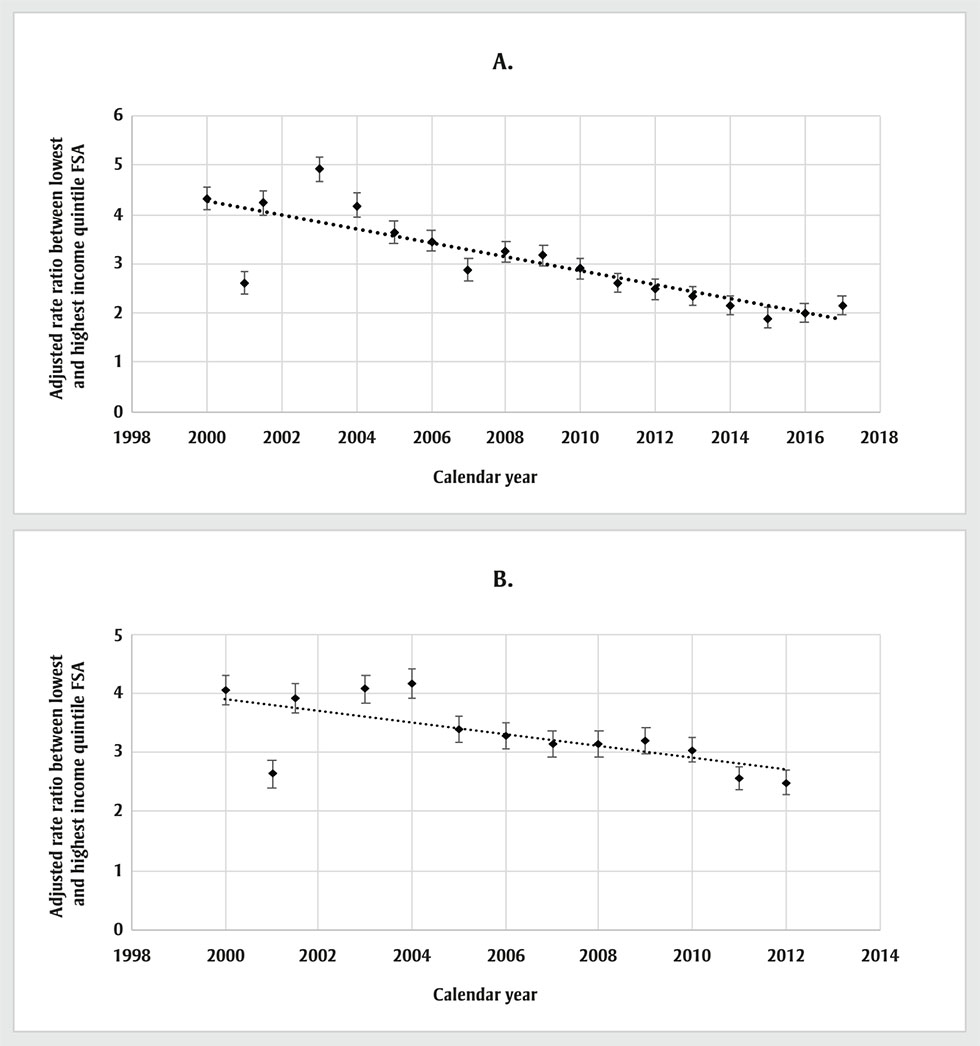
Figure 1 - Text description
| Year | Rate ratio (Canada except Quebec) |
|---|---|
| 2000 | 4.33 |
| 2001 | 2.62 |
| 2002 | 4.24 |
| 2003 | 4.93 |
| 2004 | 4.18 |
| 2005 | 3.65 |
| 2006 | 3.47 |
| 2007 | 2.88 |
| 2008 | 3.25 |
| 2009 | 3.18 |
| 2010 | 2.91 |
| 2011 | 2.62 |
| 2012 | 2.49 |
| 2013 | 2.34 |
| 2014 | 2.17 |
| 2015 | 1.91 |
| 2016 | 1.99 |
| 2017 | 2.15 |
| Year | Rate ratio (Canada except Quebec) |
|---|---|
| 2000 | 4.06 |
| 2001 | 2.63 |
| 2002 | 3.91 |
| 2003 | 4.07 |
| 2004 | 4.15 |
| 2005 | 3.39 |
| 2006 | 3.28 |
| 2007 | 3.13 |
| 2008 | 3.13 |
| 2009 | 3.19 |
| 2010 | 3.04 |
| 2011 | 2.56 |
| 2012 | 2.49 |
Abbreviation: FSA, forward sortation area.
- Footnote a
-
Data from the Canadian Vital Statistics Death (CVSD) database.
Conversely, income-related inequality in opioid-related hospitalizations from 2000/01 to 2012/13 did not change significantly, with an estimated slope of 0.01 (p = 0.08) (Figure 2). The inequality in opioid-related ED visits also did not show a significant change from 2002/03 to 2012/13; the slope of this trend was 0.03 (p = 0.50) (Figure 3).
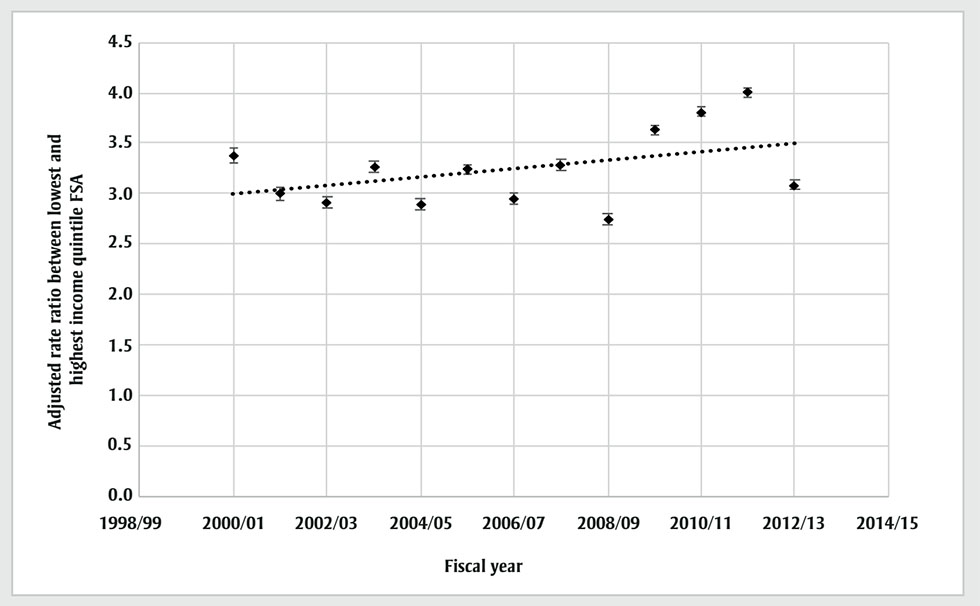
Figure 2 - Text description
| Year | Rate ratio (Canada except Quebec) |
|---|---|
| 2000 | 3.38 |
| 2001 | 3 |
| 2002 | 2.91 |
| 2003 | 3.27 |
| 2004 | 2.89 |
| 2005 | 3.24 |
| 2006 | 2.95 |
| 2007 | 3.28 |
| 2008 | 2.74 |
| 2009 | 3.63 |
| 2010 | 3.81 |
| 2011 | 4.01 |
| 2012 | 3.09 |
Abbreviation: FSA, forward sortation area.
- Footnote a
-
Data from the Canadian Vital Statistics Death (CVSD) database.
- Footnote b
-
Fiscal years.
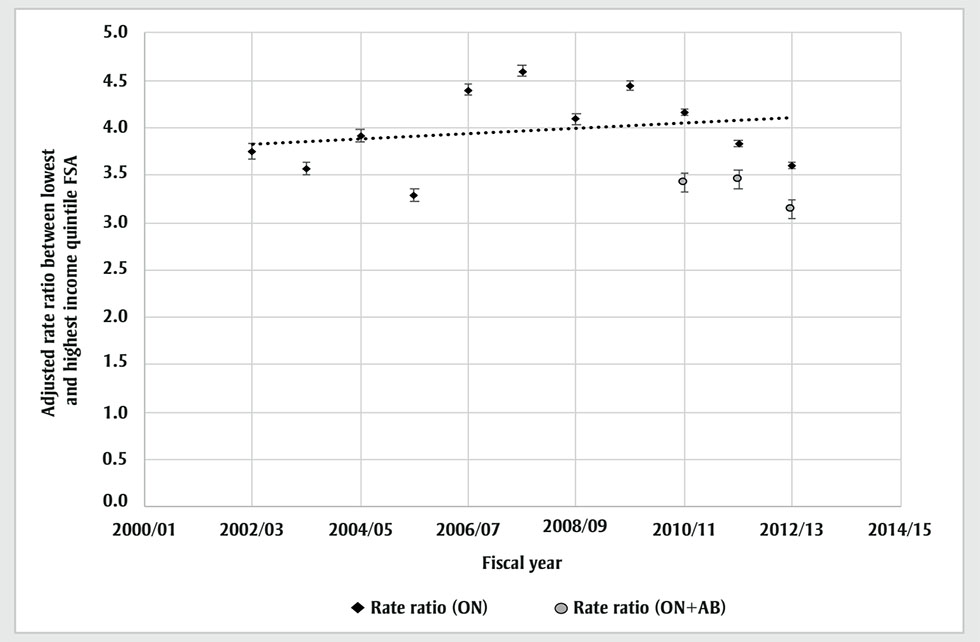
Figure 3 - Text description
| Year | Rate ratio (Ontario) | Rate ratio (Ontario and Alberta) |
|---|---|---|
| 2002 | 3.75 | N/A |
| 2003 | 3.57 | N/A |
| 2004 | 3.92 | N/A |
| 2005 | 3.29 | N/A |
| 2006 | 4.4 | N/A |
| 2007 | 4.6 | N/A |
| 2008 | 4.09 | N/A |
| 2009 | 4.44 | N/A |
| 2010 | 4.17 | 3.42 |
| 2011 | 3.84 | 3.45 |
| 2012 | 3.6 | 3.14 |
Abbreviations: AB, Alberta; FSA, forward sortation area; ON, Ontario.
- Footnote a
-
Fiscal years.
- Footnote b
-
Data from National Ambulatory Care Reporting System metadata (NACRS).
Discussion
This study explored the relationships between SES, as represented by the income quintile of the area of residence, and adverse outcomes from opioid use in Canada from 2000 to 2017 for mortality, from 2000/01 to 2012/13 for hospitalizations and from 2002/03 to 2012/13 for ED visits. Results indicate a stepped gradient in all opioid-related outcomes from the highest income quintile to the lowest quintile. The rate ratios of the average annual rate between the lowest quintile and highest quintile were 3.8, 4.3 and 4.9 for mortality, hospitalization and ED visits, respectively. This gradient was generally stable and consistent over the study period. However, mortality inequity seemed to be gradually reducing from 2000 to 2017.
These results are similar to those of a previous study of opioid-related hospitalizations (rate ratio of 3.9).Footnote 42 However, our study found that the same SES inequities found in hospitalization risk extended to opioid-related mortality and ED visits. This is also similar to patterns found in mortality due to other causes associated with high-risk behaviours, such as HIV infections and alcohol-related diseases.Footnote 43 In terms of the time trend, this inequity was, for the most part, stable over time in Canada. However, inequity in mortality is decreasing.
Population health research examining inequalities in health spans several decades. While Canadians have played a leading role in developing the population health perspective,Footnote 44 there is no question that a catalyst for this thinking arose from the classic Black Report published in 1980.Footnote 45 The report demonstrated that, even after 40 years of universal health care, not much had changed in terms of income inequality and health. Another key message was that the patterns of health seen in the population—regardless of the specific health outcome—had a stepped gradient relationship with income. Similar patterns have also been found in CanadaFootnote 43Footnote 46 and in the United States.Footnote 47 Our results are consistent with this gradient phenomenon. That is, there was no apparent threshold above or below which everyone shared the same, or even similar, risk. Rather, at each level in the income gradient there was lower opioid mortality, hospitalization and ED visits than in the quintile below it.
To this day, there is no definitive explanation for the existence of income gradients in so many health outcomes. Despite the unequal distribution we observed, the harms of the opioid epidemic are clearly not restricted to people with low income. This observation is somewhat different from the conventional wisdom that asserts poverty and homelessness as the main culprits in the opioid epidemic.Footnote 48 The higher risk in quintile 2 compared to quintile 1 (i.e. the highest income quintile) is not likely due to higher risk of poverty or homelessness. Moreover, the clear and consistent gradient suggests that it is not material conditions (access to goods, services, neighbourhood quality) that matter the most. People living in areas in the second-highest income quintile in Canada are not likely experiencing poverty, nor are they tremendously different from those in the highest quintile in terms of their material well-being. Instead, it suggests that psychosocial factors play a key role in this gradient.
In addition to a clear gradient, these data allow us to see the progression of the epidemic over time, with its effects moving from less to more privileged areas. Those living in low-income areas were the most impacted by various factors that tend to be most intense in areas where marginalized people are clustered, and therefore felt the effects early. Social marginalization has likely intensified psychosocial factors that make certain strata of our society more vulnerable to this epidemic.Footnote 49 However, opioid mortality rates seen in the lowest-income areas in 2005 were reached by the highest-income areas 8 to 10 years later. Hence, the closing gap in mortality might indicate that the opioid epidemic will eventually be felt throughout Canadian society, and that high SES merely delays its effects and cannot prevent it.
There is no one psychosocial factor that can be singled out as the main reason people use substances such as opioids. We may speculate that feeling marginalized, suffering from discrimination, experiencing trauma, living in social isolation or having limited social support drives opioid use among people in deprived areas. Social capital, which can be conceptualized as an individual or as an area-level attribute, broadly refers to relationships that allow people or communities to access various resources, including material, social and psychological supports.Footnote 50Footnote 51 Socially disadvantaged people or communities might be less able to mobilize resources from others, including family or other networks, that could buffer psychosocial stress.Footnote 51 Residents of lower-SES areas might have higher risk of the sorts of both social stressors and adverse events that can lead to opioid misuse and poorer access to alternative supports.
Beyond social capital, psychosocial factors pertaining to culture and support within the community (or the social contagion)Footnote 52 play a major role in individual behaviours.Footnote 53 According to social learning theory, people will adapt to and model behaviours observed in their social circles through attention, memory and motivation.Footnote 54 This network effect has been found to be a major determinant in many health behaviours. For example, having a friend who had successfully completed smoking cessation was found to decrease the likelihood of smoking by almost one-third.Footnote 55 Having a friend with depression was highly correlated with the likelihood of being diagnosed with depression oneself.Footnote 56 Similar results have been reported for sleep lossFootnote 57 and obesity.Footnote 58 Therefore, opioid social contagion (within families, social circles or neighbourhoods) could be a major factor driving the opioid gradient.Footnote 59Footnote 60 This effect might be augmented when the intersectionality of several socioeconomic factors is accounted for.Footnote 61
Providing meaningful economic opportunities, delivering high-quality and equitable health care and education and reviving social capital in marginalized areas may be among our highest public health priorities in Canada, if we want to get the opioid epidemic under control. Although it may not be clear which specific policies and programs are required, it is clear that ignoring equity issues will dilute the efficacy of interventions.Footnote 62
Distributing an opioid overdose medication (naloxone) in areas with high need is an effective intervention that will save lives, but it may not treat the root cause. Naloxone programs might partially explain the slight decrease in opioid mortality inequity we found in recent years. Nevertheless, they do not prevent hospitalization and emergency department visits; hence, inequity in these outcomes remained constant—in fact it increased, albeit insignificantly. Our results point to the need to consider the psychosocial conditions that underly the continuing epidemic, as well as to provide equitable health care services and reduce the various stigmas associated with opioid use and treatment.Footnote 63
Strengths and limitations
This study showed the association between SES and opioid-related mortality, hospitalization and emergency department visits using comprehensive databases over an extended period. However, several limitations must be noted. First, some cases could have been missed using administrative databases.Footnote 64 With a sensitivity of 75%,Footnote 36Footnote 38 for example, it is possible that we may have missed some opioid-related mortality. However, such misclassification is probably not differential. It is not plausible that the coding of opioid outcome would be different for individuals living in different income quintile areas. Even with this potential misclassification that may have caused us to underestimate individual opioid outcomes rates, the rate ratio would still be unchanged. In addition, although the identified outcomes included both prescribed and illicit opioids, this distinction would not have changed the rate ratio. Second, we used the 2006 income quintiles for about 10 years of assessment, which could have resulted in misclassification of areas into quintiles. However, areas are not expected to make major shifts in relative position over five years, for example, from quintile 5 to quintile 1. Since we focussed our analysis for the rate ratio on the highest and lowest quintiles, this misclassification’s effect should be negligible. Third, not all databases captured all opioid outcomes nationally. For example, the ED visits database was only available for Ontario and Alberta. However, these are currently the most comprehensive databases available for research.
Conclusion
While adverse opioid-related mortality, hospitalization and emergency department visits affect every stratum of SES in Canada, they are associated with SES in a stepped gradient fashion, and this pattern has persisted over the past two decades. Material factors cannot be the only explanation; psychosocial factors pertaining to support within the family and community may make individuals significantly prone to adverse opioid outcomes. The results of this study illustrate that targeted policy frameworks that take into consideration psychosocial aspects of SES should be adopted. Psychosocial factors should be considered in service design and the delivery of health care interventions, such as opioid stewardship, as well as public policies that address the opioid epidemic from an equity perspective.
Acknowledgements
The analysis presented in this paper was conducted at the South-Western Ontario Research Data Centre (SWORDC), which is part of the Canadian Research Data Centre Network (CRDCN). The services and activities provided by the SWORDC are made possible by the financial or in-kind support of the SSHRC, the Canadian Institutes of Health Research, the Canada Foundation for Innovation, Statistics Canada and the University of Waterloo.
Funding
Part of this study was funded by Health Canada’s Substance Use and Addictions Program (SUAP) (Agreement # 1920-HQ-000028).
Conflicts of interest
The authors declare no conflicts of interest.
Authors’ contributions and statement
WA: conceptualization, methodology, data acquisition, data analysis, writing—original draft, writing—review and editing. MC: conceptualization, methodology, writing—review and editing. SE: conceptualization, methodology, writing—review and editing. FC: conceptualization, methodology, funding acquisition, writing—review and editing. HS: data analysis, writing—review and editing. MG: data analysis, writing—review and editing.
The content and views expressed in this article are those of the authors and do not necessarily reflect those of the CRDCN or its partners, Health Canada, or the Government of Canada.