
At-a-glance – Update on cancer incidence trends in Canada, 1984 to 2017

HPCDP Journal Home
Published by: The Public Health Agency of Canada
Date published: July 2022
ISSN: 2368-738X
Submit a manuscript
About HPCDP
Browse
Previous | Table of Contents | Next
Alain A. Demers, PhDAuthor reference footnote 1Author reference footnote 2; Nathalie Saint-Jacques, PhDAuthor reference footnote 3; Larry Ellison, MScAuthor reference footnote 4; Darren Brenner, PhDAuthor reference footnote 5; Natalie Fitzgerald, MScAuthor reference footnote 6; Samina Aziz, MScAuthor reference footnote 1; Donna Turner, PhDAuthor reference footnote 2Author reference footnote 7
https://doi.org/10.24095/hpcdp.42.7.04
Author references
Correspondence
Alain Demers, Centre for Surveillance and Applied Research, Public Health Agency of Canada, 785 Carling Avenue, Room 611B2, Ottawa, ON K1A 0K9; Tel: 613-797-2129; Email: alain.demers@phac-aspc.gc.ca
Suggested citation
Demers AA, Sainte-Jacques N, Ellison J, Brenner D, Fitzgerald N, Aziz S, Turner D. Update on cancer incidence trends in Canada, 1984 to 2017. Health Promot Chronic Dis Prev Can. 2022;42(7):301-5. https://doi.org/10.24095/hpcdp.42.7.04
Abstract
This paper highlights findings on cancer trends from the Canadian Cancer Statistics 2021 report. Trends were measured using annual percent change (APC) of age-standardized incidence rates. Overall, cancer incidence rates are declining (−1.1%) but the findings are specific to the type of cancer and patient sex. For example, in males, the largest decreases per year were for prostate (−4.4%), colorectal (−4.3%), lung (−3.8%), leukemia (−2.6%) and thyroid (−2.4%) cancers. In females, the largest decreases were for thyroid (−5.4%), colorectal (−3.4%) and ovarian (−3.1%) cancers.
Highlights
- Overall, cancer incidence is declining at a rate of −1.1% per year. In males, the two largest decreases were for prostate (−4.4% per year) and colorectal (−4.3% per year) cancer. In females, they were for thyroid (−5.4% per year) and colorectal (−3.4% per year) cancer.
- Melanoma (males: 2.2% per year; females: 2.0% per year) and multiple myeloma (males: 2.5% per year; females: 1.6% per year) rates are increasing.
- Cancer trends in Canada are dynamic and type-specific. The decreases for prostate and thyroid cancer underscore the importance of updating testing practices based on best evidence.
Keywords: neoplasms, data analysis, trend, cancer surveillance
Introduction
This paper highlights findings on cancer trends from the Canadian Cancer Statistics 2021 (CCS 2021) report,Footnote 1 which was developed by the Canadian Cancer Statistics Advisory Committee in collaboration with the Canadian Cancer Society, Statistics Canada and the Public Health Agency of Canada with data provided by the provincial and territorial cancer registries.
The number and rate of new cases of cancer diagnosed each year and over time are important measures of the cancer burden on the Canadian population and health care system. This information is essential for stakeholders planning for screening, diagnosis, treatment and support services. Although they have been fairly stable between 1984 and 2012, overall cancer incidence rates have declined at a pace of −1.1% per year since 2012.Footnote 1 This decline is likely due to success in screening for cervical and colorectal cancer, but also to the change in testing practices for prostate and thyroid cancer and decline in smoking prevalence. Monitoring incidence of individual cancers over time can help identify emerging trends, highlight progress and suggest where to prioritize research and resources. The purpose of this report is to feature findings from the CCS 2021 report relating to time trends in the incidence of cancers in Canada. We report on 22 cancer types but highlight those that have shown the most significant changes in recent years.
Methods
Results are drawn from the incidence chapter of the 2021 CCS report,Footnote 1 covering the period from 1984 to 2017. Quebec was not included because data were only available up to 2010. The source of cancer incidence data from 1992 to 2017 was the Canadian Cancer Registry (CCR),Footnote 2 and for data prior to 1992, the National Cancer Incidence Reporting System (NCIRS).
Age-standardized incidence rates (ASIR, “the rates”) were determined using direct standardization and the 2011 Canadian standard population.Footnote 3 JoinpointFootnote 4 analysis software (version 4.7.0.0) was used to calculate the rates’ annual percent change (APC) for each cancer type from 1984 to 2017, and to determine any inflection years in the APCs. The minimum time span to report a trend was set at five years, with 2013 to 2017 as the most recent trend period possible. Otherwise, default Joinpoint parameters were used. We investigated 22 types of cancer, categorized according to their most recent trend. Specifically, we looked at those whose trend changed significantly (p-value < 0.05 or p-value < 0.001) and those for which no significant change was detected (p-value ≥ 0.05). For more detail, see Appendix II, “Data Sources and Methods,” of the 2021 CCS report.Footnote 1
Results and discussion
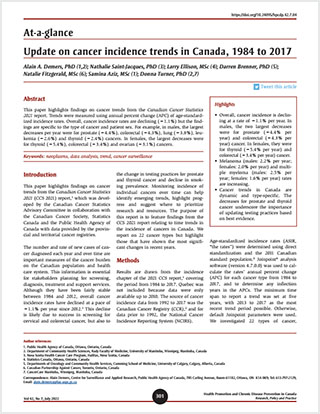
Table 1 shows trends identified by Joinpoint analyses between 1984 and 2017 for 22 cancer types. Figure 1 displays the most recent trend categorized in three groups according to the significance of the change in trend. The following highlights the most significant results.
| Cancer type | Males | Females | ||||
|---|---|---|---|---|---|---|
| Year range | APC | p-value | Year range | APC | p-value | |
| Head and neck | 1984–2004 | −2.4 | < 0.001 | 1984–2004 | −1.1 | < 0.001 |
| 2004–2017 | 0.6 | 0.003 | 2004–2017 | 0.3 | 0.099 | |
| Esophagus | 1984–2005 | 0.3 | 0.034 | 1984–2017 | −0.4 | < 0.001 |
| 2005–2011 | 2.8 | 0.008 | ||||
| 2011–2017 | −1.8 | 0.009 | ||||
| Stomach | 1984–2002 | −2.6 | < 0.001 | 1984–2001 | −2.8 | < 0.001 |
| 2002–2017 | −1.0 | < 0.001 | 2001–2017 | −0.5 | 0.009 | |
| Colorectal | 1984–2013 | −0.3 | < 0.001 | 1984–1994 | −1.7 | < 0.001 |
| 2013–2017 | −4.3 | < 0.001 | 1994–2000 | 0.4 | 0.41 | |
| 2000–2013 | −0.5 | < 0.001 | ||||
| 2013–2017 | −3.4 | < 0.001 | ||||
| Liver | 1984–2013 | 3.8 | < 0.001 | 1984–2005 | 1.9 | < 0.001 |
| 2013–2017 | −0.3 | 0.86 | 2005–2013 | 5.8 | < 0.001 | |
| 2013–2017 | −3.2 | 0.16 | ||||
| Pancreas | 1984–2002 | −1.4 | < 0.001 | 1984–2006 | −0.3 | 0.023 |
| 2002–2017 | 1.4 | < 0.001 | 2006–2013 | 2.2 | 0.004 | |
| 2013–2017 | −2.2 | 0.074 | ||||
| Lung and bronchus | 1984–1990 | −0.7 | 0.077 | 1984–1993 | 2.9 | < 0.001 |
| 1990–2003 | −2.2 | < 0.001 | 1993–2013 | 0.9 | < 0.001 | |
| 2003–2013 | −1.0 | < 0.001 | 2013–2017 | −2.0 | < 0.001 | |
| 2013–2017 | −3.8 | < 0.001 | ||||
| Melanoma | 1984–2017 | 2.2 | < 0.001 | 1984–1994 | 0.2 | 0.74 |
| 1994–2017 | 2.0 | < 0.001 | ||||
| Breast | 1984–2017 | 0.5 | 0.019 | 1984–1991 | 2.0 | < 0.001 |
| 1991–2017 | −0.2 | 0.008 | ||||
| Cervix | N/A | 1984–2005 | −2.0 | < 0.001 | ||
| 2005–2017 | −0.6 | 0.019 | ||||
| Uterus | N/A | 1984–1990 | −1.5 | 0.08 | ||
| 1990–2005 | 0.4 | 0.055 | ||||
| 2005–2011 | 3.1 | < 0.001 | ||||
| 2011–2017 | 1.0 | 0.054 | ||||
| Ovary | N/A | 1984–1997 | −1.5 | < 0.001 | ||
| 1997–2013 | −0.1 | 0.42 | ||||
| 2013–2017 | −3.1 | 0.01 | ||||
| Prostate | 1984–1993 | 5.6 | < 0.001 | N/A | ||
| 1993–2007 | 0.2 | 0.61 | ||||
| 2007–2017 | −4.4 | < 0.001 | ||||
| Testis | 1984–2017 | 1.3 | < 0.001 | N/A | ||
| Bladder | 1984–2007 | −1.2 | < 0.001 | 1984–2008 | −0.9 | < 0.001 |
| 2007–2011 | 7.8 | 0.005 | 2008–2012 | 7.2 | 0.053 | |
| 2011–2017 | −0.5 | 0.49 | 2012–2017 | −1.2 | 0.38 | |
| Kidney and renal pelvis | 1984–1989 | 4.0 | 0.005 | 1984–2017 | 1.1 | < 0.001 |
| 1989–2003 | 0.1 | 0.61 | ||||
| 2003–2012 | 2.7 | < 0.001 | ||||
| 2012–2017 | 0.4 | 0.63 | ||||
| Brain and CNS | 1984–2017 | −0.4 | < 0.001 | 1984–2017 | −0.5 | < 0.001 |
| Thyroid | 1984–1998 | 2.8 | < 0.001 | 1984–1998 | 4.0 | < 0.001 |
| 1998–2013 | 7.0 | < 0.001 | 1998–2004 | 10.4 | < 0.001 | |
| 2013–2017 | −2.4 | 0.17 | 2004–2013 | 5.5 | < 0.001 | |
| 2013–2017 | −5.4 | < 0.001 | ||||
| Hodgkin lymphoma | 1984–2017 | −0.4 | < 0.001 | 1984–2017 | 0.1 | 0.54 |
| Non-Hodgkin lymphoma | 1984–2017 | 1.3 | < 0.001 | 1984–1993 | 2.1 | < 0.001 |
| 1993–2017 | 0.9 | < 0.001 | ||||
| Multiple myeloma | 1984–2007 | 0.3 | 0.064 | 1984–2005 | 0.2 | 0.26 |
| 2007–2017 | 2.5 | < 0.001 | 2005–2017 | 1.6 | < 0.001 | |
| Leukemia | 1984–1994 | −1.1 | 0.022 | 1984–2001 | −0.3 | 0.15 |
| 1994–2013 | 0.9 | < 0.001 | 2001–2010 | 1.9 | < 0.001 | |
| 2013–2017 | −2.6 | 0.038 | 2010–2017 | −1.6 | 0.004 | |
Data source: Canadian Cancer Statistics Advisory Committee in collaboration with the Canadian Cancer Society, Statistics Canada and the Public Health Agency of Canada. Canadian cancer statistics 2021. Toronto (ON): Canadian Cancer Society; 2021. |
||||||
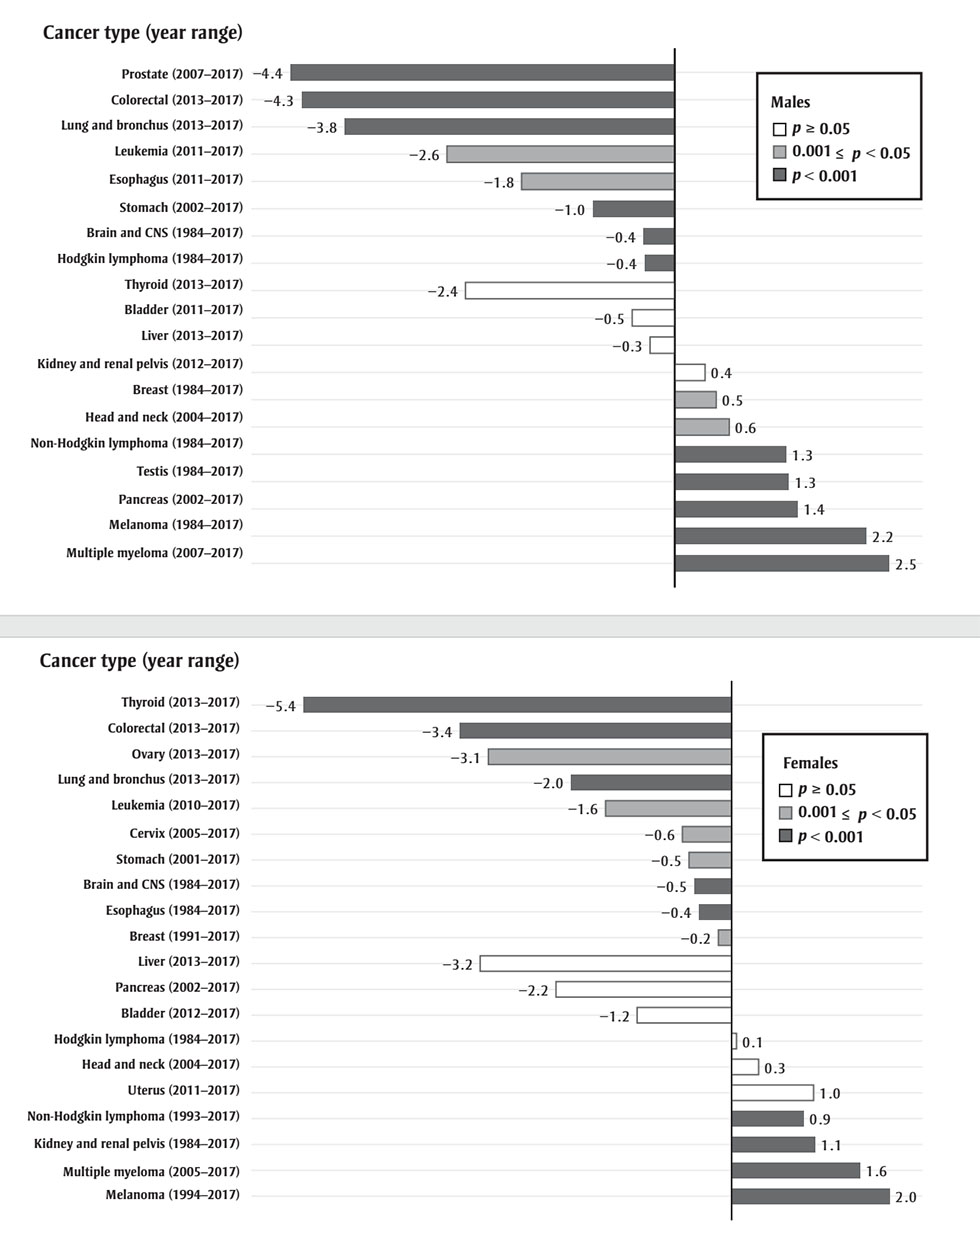
Figure 1 - Text description
| Cancer type (year range) | Annual percentage change | p |
|---|---|---|
| Prostate (2007-2017) | −4.4 | < 0.001 |
| Colorectal (2013-2017) | −4.3 | < 0.001 |
| Lung and bronchus (2013-2017) | −3.8 | < 0.001 |
| Leukemia ( 2013-2017) | −2.6 | < 0.05 |
| Esophagus (2011-2017) | −1.8 | < 0.05 |
| Stomach (2002-2017) | −1.0 | < 0.001 |
| Brain and CNS (1984-2017) | −0.4 | < 0.001 |
| Hodgkin and CNS (1984-2017) | −0.4 | < 0.001 |
| Thyroid (2013-2017) | −2.4 | ≥ 0.05 |
| Bladder (2011-2017) | −0.5 | ≥ 0.05 |
| Liver (2013-2017) | −0.3 | ≥ 0.05 |
| Kidney and renal pelvis (2012-2017) | 0.4 | ≥ 0.05 |
| Breast (1984-2017) | 0.5 | < 0.05 |
| Head and neck (2004-2017) | 0.6 | < 0.05 |
| Non-Hodgkin lymphoma (1984-2017) | 1.3 | < 0.001 |
| Testis (1984-2017) | 1.3 | < 0.001 |
| Pancreas (2002-2017) | 1.4 | < 0.001 |
| Melanoma (1984-2017) | 2.2 | < 0.001 |
| Multiple myeloma (2007-2017) | 2.5 | < 0.001 |
| Cancer type (year range) | Annual percentage change | p |
|---|---|---|
| Thyroid (2013-2017) | −5.4 | < 0.001 |
| Colorectal (2013-2017) | −3.4 | < 0.001 |
| Ovary (2013-2017) | −3.1 | < 0.05 |
| Lung and bronchus (2013-2017) | −2.0 | < 0.001 |
| Leukemia ( 2010-2017) | −1.6 | < 0.05 |
| Cervix (2005-2017) | −0.6 | < 0.05 |
| Stomach (2001-2017) | −0.5 | < 0.05 |
| Brain and CNS (1984-2017) | −0.5 | < 0.001 |
| Esophagus (1984-2017) | −0.4 | < 0.001 |
| Breast (1991-2017) | −0.2 | < 0.05 |
| Liver (2013-2017) | −3.2 | ≥ 0.05 |
| Pancreas (2013-2017) | −2.2 | ≥ 0.05 |
| Bladder (2012-2017) | −1.2 | ≥ 0.05 |
| Hodgkin lymphoma (1984-2017) | 0.1 | ≥ 0.05 |
| Head and neck (2004-2017) | 0.3 | ≥ 0.05 |
| Uterus (2011-2017) | 1.0 | ≥ 0.05 |
| Non-Hodgkin lymphoma (1993-2017) | 0.9 | < 0.001 |
| Kidney and renal pelvis (1984-2017) | 1.1 | < 0.001 |
| Multiple myeloma (2005-2017) | 1.6 | < 0.001 |
| Melanoma (1994-2017) | 2.0 | < 0.001 |
Data source: Canadian Cancer Statistics Advisory
Committee in collaboration with the Canadian Cancer Society, Statistics Canada
and the Public Health Agency of Canada. Canadian cancer statistics 2021.
Toronto (ON): Canadian Cancer Society; 2021.
Abbreviation: CNS, central nervous system.
- Footnote a
-
The APCs were calculated from 1984 to 2017. If one or more significant changes were detected in the trends, the most recent APC was used. If no significant change was detected, the APC reflects the trend over the entire period.
Decreasing trends
Thyroid cancer rates have declined in males and females since 2013 (APC males: −2.4%, not significant; APC females: −5.4%). The rate increase that happened before 2013 was likely due to overdiagnosis.Footnote 5 A recent Canadian study found evidence to support the overdiagnosis hypothesis, including the confirmation of the central role played by papillary thyroid cancer in past trends.Footnote 6 Prostate cancer rates declined steeply from 2007 to 2017 (APC: −4.4%). The incidence rate peaked in 1993 and 2001, which mirrored intensified use of prostate-specific antigen (PSA) testing in Canada.Footnote 7 The Canadian Task Force advised against PSA screening in 2014.Footnote 8 A similar decline due to guidelines update has been documented in the USA.Footnote 9 Colorectal cancer rates have declined steeply in both sexes since 2013 (APC males: −4.3%; APC females: −3.4%). The recent decline is likely due in part to increased screening, which can identify treatable precancerous polyps and reduce cancer incidence. Between 2007 and 2017, most provinces and territories have implemented organized colorectal cancer screening programs; they are in planning stage in Quebec and the Northwest Territories.Footnote 10 Lung cancer rates have decreased since the 1990s in males (APC: −1.0% to −3.8%) and since 2013 in females (APC: −2.0%). The differences in trends reflect past cigarette smoking habits. In males, a decrease in the prevalence of daily smokers began in the mid-1960s in Canada, while in females, the drop did not happen until the mid-1980s.Footnote 11 The incidence rate of ovarian cancer has declined rapidly (APC: −3.1%) since 2013. Several factors could be contributing to the favourable trend, including increased use of oral contraceptives, changes in reproductive and protective risk factors (e.g. older age at childbirth), decreased prevalence of smoking and changes in disease classifications; since 2000, ovarian neoplasms with borderline or low malignant potential are no longer considered malignant tumours.Footnote 12Footnote 13Footnote 14 Leukemia rates have declined rapidly since 2013 in males (APC: −2.6%) and since 2010 in females (APC: −1.6%). Similar trends have been reported globally between 1990 and 2017, though the rate of decline varies between countries and leukemia subtypes.Footnote 15Footnote 16 Factors driving these trends are not well understood, though some suggest that changes in environmental exposures (e.g. benzene), lifestyle (e.g. smoking) and parental behaviours (e.g. increased intake of folate during the preconception period and pregnancy) may be at play.Footnote 15Footnote 17 Esophageal cancer incidence rates are decreasing more rapidly in males (APC: −1.8%; 2011 to 2017) than females (APC: −0.4%; 1984 to 2017). Risk factors for this cancer include obesity, alcohol consumption and tobacco consumption.Footnote 18 Whereas obesityFootnote 19 and sales of alcoholic drinksFootnote 20 have been increasing in Canada, past decreases in tobacco consumptionFootnote 11 may account for the observed decrease. Since 2013, female liver cancer rates have declined, but not statistically significantly (APC: 3.2%). The most common type of liver cancer, hepatocellular carcinoma, is generally driven by chronic hepatitis B and C infection, as well as excessive alcohol consumption and diabetes.Footnote 21 It is not clear why this recent shift exists for females, but it may relate to changes in risk factor prevalence and early detection. Cervical cancer rates are decreasing (APC: −0.6%) largely due to routine screening with Pap tests. Every province in Canada (except Quebec) has an organized cervical cancer screening program. Current guidelines recommend screening every two to three years starting at age 21 or 25 until age 65 or 70.Footnote 22 In the coming years, human papillomavirus (HPV) vaccination and the adoption of primary HPV testing as part of screening are expected to result in further reductions in cervical cancer incidence.Footnote 23
Increasing trends
The incidence of multiple myeloma increased 2.5% per year in males from 2007 to 2017 and 1.6% in females since 2005. Improved detection and case ascertainment has been reported to contribute to some of the increase in multiple myeloma cases in other countries.Footnote 24 The increased prevalence of obesity, a known risk factor for multiple myeloma, could be contributing to the recent upward trend in the incidence rate.Footnote 19Footnote 25 Elevated risk of multiple myeloma has also been linked with pesticide use and proximity to contaminated bodies of water and rivers.Footnote 26Footnote 27 The incidence rate for skin melanoma increased an average of 2.2% per year between 1984 and 2017 in males and 2.0% per year between 1994 and 2017 in females. Exposure to ultraviolet (UV) radiationFootnote 28 through sunlight, tanning beds and sun lamps is a well-established risk factor for melanoma.Footnote 29
Conclusion
Results show that cancer incidence trends in Canada are dynamic and site-specific. The most recent trends show rapidly increasing rates of melanoma and myeloma. Conversely, rates of other cancers have recently decreased, most notably thyroid, prostate, lung and colorectal. The decreases for prostate and thyroid cancer underscore the importance of updating testing practices based on best evidence.
Conflicts of interest
The authors have no conflicts of interest to declare.
Authors’ contributions and statement
All authors contributed to the design, conceptualization, data interpretation and revision. The Public Health Agency of Canada performed the data analysis.
The content and views expressed in this article are those of the authors and do not necessarily reflect those of the Government of Canada.