
Original quantitative research – Do school characteristics, based on the Comprehensive School Health framework, contribute to youth meeting national physical activity recommendations over time?

HPCDP Journal Home
Published by: The Public Health Agency of Canada
Date published: September 2022
ISSN: 2368-738X
Submit a manuscript
About HPCDP
Browse
Previous | Table of Contents | Next
Melissa Pirrie, PhDAuthor reference footnote 1; Valerie Carson, PhDAuthor reference footnote 2; Joel A. Dubin, PhDAuthor reference footnote 1Author reference footnote 3; Scott T. Leatherdale, PhDAuthor reference footnote 1
https://doi.org/10.24095/hpcdp.42.9.04
This article has been peer reviewed.
Author references
Correspondence
Melissa Pirrie, School of Public Health Sciences, University of Waterloo, 200 University Ave. West, Waterloo, ON N2L 3G1; Tel: 519-580-6489; Email: melissa.pirrie@uwaterloo.ca
Suggested citation
Pirrie M, Carson V, Dubin JA, Leatherdale ST. Do school characteristics, based on the Comprehensive School Health Framework, contribute to youth meeting national physical activity recommendations over time? Health Promot Chronic Dis Prev Can. 2022;42(9):408-19. https://doi.org/10.24095/hpcdp.42.9.04
Abstract
Introduction: Canadian youth are insufficiently active, and schools may play a role in promoting student physical activity (PA). Based on the Comprehensive School Health (CSH) framework, this study examined whether school characteristics are associated with secondary school students meeting national PA recommendations over time.
Methods: We used COMPASS survey data from 78 schools in Ontario and Alberta and 9870 Grade 9 and 10 students attending those schools. Students who provided two years of linked PA data (2013/14 and 2015/16) and gender were included. Multilevel analysis was conducted by gender, evaluating the relationship of school-level characteristics (guided by CSH) with students achieving all three PA recommendations after two years (≥ 60 min/day of moderate-to-vigorous PA, vigorous PA ≥ 3 days/week, strengthening activities ≥ 3 days/week).
Results: More than half (56.9%) of students achieving the PA recommendations at baseline were no longer achieving them after two years, and just a quarter (25.6%) of students not achieving the recommendations at baseline achieved them after two years. School-level factors were significantly associated with students achieving the recommendations, but these factors differed by student strata (i.e. by gender and baseline PA status). Generally, student access to equipment, public health partnerships and staff time for health were associated with increased odds of achieving the PA recommendations for certain students.
Conclusion: Modifications to school characteristics within CSH may play a role in supporting students in achieving or continuing to achieve the PA recommendations after two years. Further research is needed to better understand the underlying dynamics of the observed relationships.
Keywords: youth, schools, multilevel regression modelling, gender, guidelines
Highlights
- Approximately half of Grade 9 and 10 students were not meeting the national physical activity recommendations at baseline.
- There is evidence that inactive male and female students can transition to being active two years later, although this was observed in only a quarter of inactive students.
- School characteristics within the Comprehensive School Health framework may support both male and female students in becoming active or staying active.
- School-level factors associated with students achieving the physical activity recommendations were: partnering with public health, providing access to equipment during non-instructional time and receiving staff time for student health from the school board.
Introduction
The Canadian 24-hour Movement Guidelines for Children and Youth, released in 2016, recommend that youth accumulate an average of 60 minutes per day of moderate-to-vigorous physical activity (MVPA), participate in vigorous physical activity (VPA) at least three days per week and participate in muscle-and-bone-strengthening activities at least three days per week.Footnote 1Footnote 2 In 2017, objective data from the Canadian Health Measures SurveyFootnote 3 suggested that only 31% of Canadian youth were achieving the recommended average of 60 minutes per day of MVPA. The proportion of youth not achieving national physical activity (PA) recommendations is a major public health concern, as PA is a modifiable health behaviour that has many immediate health benefits (e.g. improved cardiovascular health, decreased anxiety) and is associated with long-term prevention of chronic disease and some cancers.Footnote 4Footnote 5Footnote 6
For secondary school students, an additional concern is that those meeting the PA recommendations in Grades 9 and 10 may not continue achieving them a few years later. Evidence consistently shows that PA declines throughout adolescence, especially in girls,Footnote 3Footnote 7 with lower PA observed in Canadian youth (aged 12–17 years) compared to children (aged 6–11 years).Footnote 3 Since PA during youth significantly predicts PA behaviours during adulthood,Footnote 6Footnote 8 preventing a drop-off during this critical developmental period is important. Similarly, providing an environment that encourages students who are not already meeting the PA recommendations in Grades 9 and 10 to improve their PA behaviours may help put them on a healthier behavioural trajectory before entering early adulthood.
Ecological theory suggests that the individual's context (e.g. family, school, neighbourhood) can impact health behaviours.Footnote 9 As schools are an integral part of the students' PA environment,Footnote 10Footnote 11Footnote 12 this is a context frequently targeted to improve youth PA behaviour.Footnote 13 However, many investigator-initiated PA interventions in schools struggle to be sustained post-research due to a lack of capacity and resources.Footnote 13 Taking a different approach, the evaluation of natural experiments through longitudinal data systems can be used to identify which programs, policies and resources may have been successful in achieving higher PA in some schools to inform what may be feasible in other schools.Footnote 14
The Comprehensive School Health (CSH) framework provides guidance on four inter-related components that schools can target to improve health behaviours, such as PA.Footnote 15Footnote 16 The CSH components are: (1) social and physical environment; (2) teaching and learning; (3) partnerships and services; and (4) policies.Footnote 15Footnote 16 Many cross-sectional studies have examined the associations between school characteristics found within CSH and PA behaviours, finding students are more physically active if they attend schools with higher social support,Footnote 17Footnote 18 established partnerships,Footnote 19 extracurricular PA opportunities,Footnote 20 PA facilities available,Footnote 21 student access to facilities and equipment outside of instructional timeFootnote 21 and funding for PA-related resources.Footnote 22 However, there has been no longitudinal study examining how multiple school characteristics representing each component of the CSH framework are associated with students achieving the national PA recommendations over time.
The objective of this exploratory study was to fill an existing evidence gap by using longitudinal data to determine (1) the proportion of students achieving all three PA recommendations at baseline who were still achieving them two years later; (2) the proportion of students not achieving all three PA recommendations at baseline who were achieving them two years later; and (3) the school characteristics associated with achieving all three recommendations two years later for these two groups of students. Since gender has been identified as a modifier of the association between school characters and student PA,Footnote 23 these relationships were evaluated for each gender separately.
Methods
Ethics approval
Ethics approval was received by the University of Waterloo Office of Research Ethics (Project: 30188), the University of Alberta Research Ethics Board (Project: 00040729) and each school board and/or school as required.
Design
COMPASS is a prospective cohort study (2012–2021) following a large sample of Canadian students in Grades 9 to 12 and the schools they attend. COMPASS was designed as a platform to conduct natural experiments to evaluate the impact of school-level prevention program and policy changes on student health behaviours.Footnote 24
The current study examined data from 78 schools in Ontario (n = 69) and Alberta (n = 9) that provided data in both Year 2 (Y2; 2013/14) and Year 4 (Y4; 2015/16); this is the period in which COMPASS had the largest initial intake of schools to its cohort and the schools completed their baseline COMPASS School Policies and Practices Questionnaire (2012/13 or 2013/14). Of the 78 schools, 72 were public and 6 were private schools with a traditional education setting; all private schools were located in Ontario.Footnote 25Footnote 26Footnote 27 Although COMPASS is a rolling cohort that includes all grades of secondary school students, the current study only included students in Grade 9 or 10 as of Y2 since students in Grades 11 and 12 would have graduated and left the cohort by Y4. The current study included 9870 students (9239 in Ontario and 631 in Alberta) who provided gender and PA data in both Y2 and Y4, and provided their grade for at least one of the years. There were no significant differences in students included or excluded due to missing outcome data according to chi-square tests (data available upon request).
Recruitment
Detailed school recruitment methods are available.Footnote 24Footnote 25Footnote 26Footnote 27 In short, school boards that allow active-information, passive-consent protocols were approached to participate in COMPASS. With school board approval, individual schools were recruited and information was sent to students and guardians, with multiple mechanisms to opt out. Students could also opt to not complete the survey on data collection day and could withdraw their survey at any time. Seventy-nine percent of eligible students from these 78 schools participated in Y2 and 80% of eligible students participated in Y4. Missing students were primarily due to absenteeism or classroom spares on the day of data collection; less than 1% of students opted out (themselves or their parent or guardian).
Data collection procedures
On each school's data collection day, a COMPASS staff member was onsite to ensure study fidelity and identify the most appropriate individual to complete the school-level survey. Students completed the survey during a class period and sealed it in an envelope to maintain confidentiality. Each student had a self-generated identification code derived from their birth month, name (e.g. second letter of first name) and mother's name, allowing student data to be de-identified while also being linked across multiple years. Detail on the longitudinal data linkage procedure is available in a technical report.Footnote 28
Measures
School
School-level data used in this study were collected in Y1 or Y2 (whichever year the school first participated in COMPASS) using the COMPASS School Policies and Practices Questionnaire. The COMPASS staff member also collected school handbooks and written policies. School location (urban or rural) and neighbourhood socioeconomic status (SES) were determined using the postal code and 2011 Canadian census data. School-level characteristics included in this study are listed in Table 1, in addition to the presence of indoor facilities, outdoor facilities, gymnasium, change rooms and interschool or varsity sports teams.
Student variables
Student demographics from the annual COMPASS student questionnaireFootnote 29 included in this study were gender, grade and ethnicity.
The outcome variable was student achievement of all three PA recommendations, consistent with previous research.Footnote 30 Three questions from the COMPASS questionnaire were used to determine this status: (1) "Mark how many minutes of HARD physical activities you did on each of the last 7 days"; (2) "Mark how many minutes of MODERATE physical activities you did on each of the last 7 days"; and (3) "On how many days in the last 7 days did you do exercises to strengthen or tone your muscles?" (with examples provided). The first two questions were used to determine whether the student achieved an average of 60 minutes or more of MVPA per day. Students who participated in any minutes of hard PA (i.e. greater than 0 minutes) at least three days per week were classified as achieving the VPA recommendation.
A validation study found that while these two questions individually had low validity when compared to objectively measured PA (Pearson r = 0.21 and 0.27, respectively), the validity was higher when combined (r = 0.31) and was similar to other self-report questionnaires.Footnote 31 Test-retest reliability for these two questions was moderate (r = 0.69 and 0.57, respectively, and r = 0.68 combined). There is no validity or reliability data available for the muscle and bone strengthening activity question, but since there is no intensity needed or minimum number of minutes, it is expected that students could estimate the number of days.
Students who achieved an average of 60 minutes or more per day of MVPA, VPA three or more days per week and muscle and bone strengthening activity three or more days per week were designated as achieving all three PA recommendations; all others were classified as not achieving the full recommendations (even if they achieved one or two of the recommendations).
Statistical analysis
Descriptive analysis was conducted for school- and student-level characteristics. Since missing data at the school-level were considered to be missing not at random (i.e. the likelihood of missingness is based on the unobserved data itself), the missing indicator approach was used to handle missing data.Footnote 32 For each PA recommendation and the full set of three recommendations, comparisons across genders were performed using chi-square tests. Cross-tabulations were used to determine the proportion of students meeting the recommendations in Y2 and who continued meeting them in Y4, as well as the proportion of students not meeting the recommendations in Y2 who were able to meet them in Y4.
The regression analyses were stratified by gender, and then further stratified into two groups based on whether the student was achieving all three recommendations in Y2, for a total of four strata. Due to the hierarchical nature of the data, multilevel logistic regression models (random intercept only, clustered by school) were conducted for each of the four student strata (gender and baseline PA status), with the binary outcome of achieving all three PA recommendations in Y4 or not. For each stratum, a null model was run to determine variability across schools in the outcome. To calculate the intraclass correlation (ICC), since the outcome was dichotomous, the student-level portion of the error variance was set at π2/3, which is approximately 3.29.Footnote 33
Next, full models were run for each student stratum, with all school characteristics as Level 2 variables (excluding those with a prevalence of 95% or higher due to lack of heterogeneity) and student grade and ethnicity added as Level 1 variables (potential student-level confounders). The four full models were assessed for multicollinearity (e.g. high-variance inflation factors). All analyses were conducted using RStudio version 1.3.1 (RStudio Team, Boston, MA, USA) and R version 4.0.3 (R Foundation for Statistical Computing, Vienna, Austria). The mixed_model procedure of the GLMMadaptive package was used with binomial distribution, logit link and 100 expectation-maximization iterations for each regression. As this was an exploratory study, the results and discussion are focussed primarily on the statistically significant findings.
Results
Seventy-eight schools participated in both Y2 and Y4 of COMPASS; 10 schools from Y2 had dropped out by Y4 (nine from Ontario and one from Alberta), primarily due to labour disputes in Ontario.Footnote 27 The prevalence of PA-related school characteristics within the CSH framework are provided in Table 1 and demonstrate heterogeneity across schools. In addition, 98.7% (n = 77) had a gymnasium, 97.4% (n = 76) had other indoor facilities, 94.9% (n = 74) had change rooms, 98.7% (n = 77) had outdoor facilities, and 100% (n = 78) had interschool or varsity sports.
| Demographic | N = 78 | ||
|---|---|---|---|
| n | % | ||
| Enrolment | 1–500 students | 32 | 41.0 |
| 501–1000 students | 39 | 50.0 | |
| ≥ 1001 students | 7 | 9.0 | |
| SESFootnote a (CAD) | 25 000–50 000 | 7 | 9.0 |
| 50 001–75 000 | 51 | 65.4 | |
| 75 001–100 000 | 17 | 21.8 | |
| ≥ 100 001 | 3 | 3.9 | |
| Location | Rural | 1 | 1.3 |
| Small urban | 34 | 43.6 | |
| Medium urban | 13 | 16.7 | |
| Large urban | 30 | 38.5 | |
| Social environment | |||
| School priority of PA | 1st–3rd | 17 | 21.8 |
| 4th–6th | 35 | 44.9 | |
| 7th–10th | 18 | 23.1 | |
| Missing | 8 | 10.3 | |
| Promotion of PA events | Yes | 69 | 88.5 |
| No | 8 | 10.3 | |
| Missing | 1 | 1.3 | |
| Physical environment | |||
| Curtains for changing | Both girls and boys | 21 | 26.9 |
| Girls only | 15 | 19.2 | |
| Boys only | 1 | 1.3 | |
| None | 34 | 43.6 | |
| Missing | 7 | 9.0 | |
| Secure lockers in change room | Yes | 62 | 79.5 |
| No | 15 | 19.2 | |
| Missing | 1 | 1.3 | |
| Showers | Both girls and boys | 69 | 88.5 |
| Girls only | 0 | 0.0 | |
| Boys only | 2 | 2.6 | |
| None | 4 | 5.1 | |
| Missing | 3 | 3.9 | |
| Partnerships and services | |||
| Organizations providing support (check all that apply) | Local public health | 37 | 52.6 |
| Nongovernmental organization | 47 | 60.3 | |
| Parks and recreation | 21 | 27.0 | |
| Youth organizations | 23 | 29.5 | |
| Health and fitness club | 39 | 50.0 | |
| Consultant/specialist | 27 | 34.6 | |
| Teaching and learning | |||
| Noncurricular physical activity programs | Both intramurals and non-competitive clubs |
35 | 44.9 |
| Intramural only | 15 | 19.2 | |
| Non-competitive only | 15 | 19.2 | |
| None | 13 | 16.7 | |
| Healthy school policy | |||
| Written policy | Yes | 45 | 57.7 |
| No | 24 | 30.8 | |
| Missing | 9 | 11.5 | |
| Data from student health assessment used to plan | Yes | 30 | 38.5 |
| No | 48 | 61.5 | |
| Access during non-instructional time: | |||
| Indoor facilities | Yes | 53 | 68.0 |
| No | 25 | 32.1 | |
| Outdoor facilities | Yes | 67 | 85.9 |
| No | 9 | 11.5 | |
| Missing | 2 | 2.6 | |
| Equipment | Always | 23 | 29.5 |
| Sometimes | 46 | 59.0 | |
| Never | 9 | 11.5 | |
| Access outside of school hours: | |||
| Gymnasium | Yes | 61 | 78.2 |
| No | 17 | 21.8 | |
| Indoor facilities | Yes | 60 | 76.9 |
| No | 17 | 21.8 | |
| Missing | 1 | 1.3 | |
| Outdoor facilities | Yes | 66 | 84.6 |
| No | 11 | 14.1 | |
| Missing | 1 | 1.3 | |
| Equipment | Yes | 54 | 69.2 |
| No | 23 | 29.5 | |
| Missing | 1 | 1.3 | |
| School board provided resource: | |||
| Staff time | Yes | 46 | 59.0 |
| No | 27 | 34.6 | |
| Missing | 5 | 6.4 | |
| Additional space | Yes | 25 | 32.1 |
| No | 47 | 60.3 | |
| Missing | 6 | 7.7 | |
| Budget to improve health (CAD) | ≥ 1001 | 27 | 34.6 |
| 1– 1000 | 12 | 15.4 | |
| No funding | 31 | 39.7 | |
| Missing | 8 | 10.3 | |
Y2 physical activity levels
Within these schools, 10 160 students in Grades 9 and 10 participated in COMPASS in both Y2 and Y4, and 9870 students (97.1%) reported their PA in both years. In Y2, only 47.7% (n = 4706) of students reported achieving all three PA recommendations; 84.6% (n = 8351) reported achieving the VPA recommendation, 77.8% (n = 7683) the MVPA recommendation, and 55.0% (n = 5430) the muscle and bone strengthening activity recommendation. A significantly higher proportion of male students compared to female students reported achieving each of the separate PA recommendations as well as the full set of three recommendations (p < 0.001; Table 2).
| Characteristic | Total (n = 9870) |
Female (n = 5200) |
Male (n = 4670) |
Chi-square test | ||||
|---|---|---|---|---|---|---|---|---|
| n | % | n | % | n | % | Difference in male compared to female, % (95% CI) |
p-value | |
| Grade in Y2 | ||||||||
| 9 | 5309 | 53.8 | 2722 | 52.4 | 2587 | 55.4 | — | — |
| 10 | 4561 | 46.2 | 2478 | 47.7 | 2083 | 44.6 | — | — |
| Ethnicity | ||||||||
| White only | 7579 | 76.8 | 4046 | 77.8 | 3533 | 75.7 | — | — |
| Other | 2291 | 23.2 | 1154 | 22.2 | 1137 | 24.4 | — | — |
| Physical activity in Y2 | ||||||||
| Meets MVPA recommendation | 7683 | 77.8 | 3830 | 73.7 | 3853 | 82.5 | 8.9 (7.2–10.5) | < 0.001 |
| Meets VPA recommendation | 8351 | 84.6 | 4281 | 82.3 | 4070 | 87.2 | 4.8 (3.4–6.2) | < 0.001 |
| Meets MBSA recommendation | 5430 | 55.0 | 2736 | 52.6 | 2694 | 57.7 | 5.1 (3.1–7.0) | < 0.001 |
| Achieves all three recommendations | 4706 | 47.7 | 2279 | 43.8 | 2427 | 52.0 | 8.1 (6.2–10.1) | < 0.001 |
Proportion achieving the PA recommendations over time
Of the 4706 students achieving all three recommendations in Y2, 56.9% (n = 2679) continued achieving them in Y4, and of the 5164 students not achieving all three recommendations in Y2, 25.6% (n = 1321) were able to achieve them by Y4 (Figure 1). Among the 2279 female students who were achieving all three recommendations in Y2, only 49.9% (n = 1138) continued to achieve them in Y4; of the 2921 who were not achieving the recommendations in Y2, 21.6% (n = 632) improved to achieve them in Y4. Finally, for the 2427 male students who were achieving all three recommendations in Y2, 63.5% (n = 1541) were still achieving the recommendations in Y4, and of the 2243 male students not achieving the recommendations in Y2, 30.7% (n = 689) were able to achieve them by Y4.
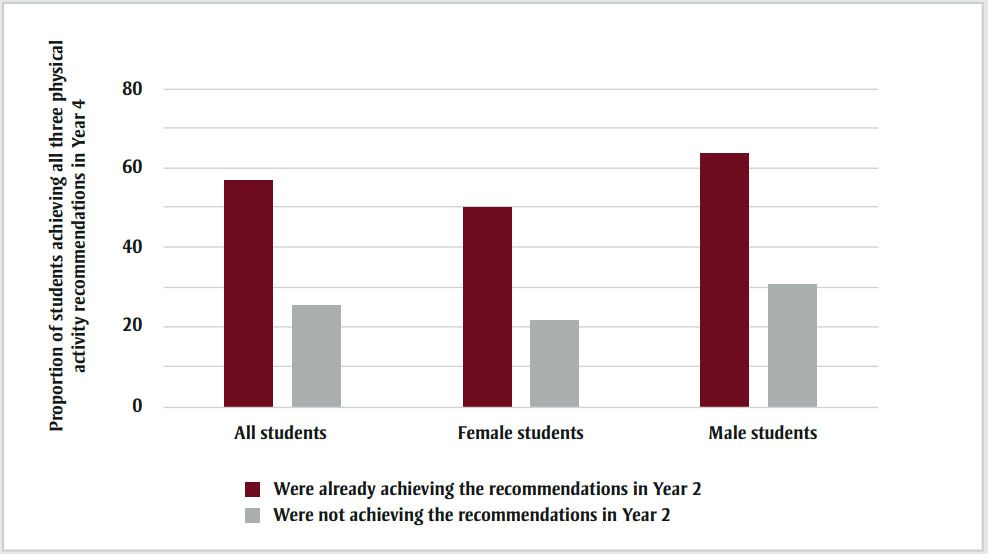
Figure 1 - Text description
| Group | Proportion of students achieving all three physical activity recommendations in Year 4 | ||
|---|---|---|---|
| All students | Female students | Male students | |
| Were already achieving the recommendations in Year 2 | 56.9 | 49.9 | 63.5 |
| Were not achieving the recommendations in Year 2 | 25.6 | 21.6 | 30.7 |
School characteristics associated with achieving the physical activity recommendations in Year 4
The ICC was very low across all four models (ICC = 0.007–0.027) but was highest among females achieving the PA recommendations in Y2 (Table 3).
| Characteristic | Adjusted odds of students achieving all 3 PA recommendationsFootnote a in Y4 for those who were already achieving them at baseline (Y2) | Adjusted odds of students achieving all 3 PA recommendations in Y4 for those who were not achieving them at baseline (Y2) | |||
|---|---|---|---|---|---|
| Females n = 2279 |
Males n = 2427 |
Females n = 2921 |
Males n = 2243 |
||
| AORFootnote b (95% CI) | AORFootnote b (95% CI) | AORFootnote b (95% CI) | AORFootnote b (95% CI) | ||
| Intraclass correlation (null model) | 0.03 | 0.01 | 0.02 | 0.02 | |
| Level 1: Student-level | |||||
| Grade in Y2 | |||||
| Grade 10 (ref = Grade 9) | 0.72 (0.61–0.85)Footnote *** | 0.92 (0.78–1.10) | 0.80 (0.67–0.96)Footnote * | 0.81 (0.67–0.97)Footnote * | |
| Ethnicity | |||||
| Other (ref = White only) | 1.17 (0.94–1.45) | 1.35 (1.10–1.64)Footnote ** | 1.06 (0.85–1.32) | 0.88 (0.71–1.10) | |
| Level 2: School-level | |||||
| Social environment | |||||
| Enrolment | |||||
| 1–500 students | 1.00 | 1.00 | 1.00 | 1.00 | |
| 501–1000 students | 0.92 (0.67–1.28) | 1.12 (0.82–1.55) | 1.12 (0.79–1.57) | 1.03 (0.72–1.46) | |
| ≥ 1001 students | 0.69 (0.36–1.41) | 1.40 (0.71–2.76) | 1.30 (0.62–2.73) | 0.97 (0.47–2.04) | |
| SESFootnote c (CAD) | |||||
| 25 000–50 000 | 1.00 | 1.00 | 1.00 | 1.00 | |
| 50 001–75 000 | 1.21 (0.77–1.91) | 0.81 (0.52–1.26) | 0.96 (0.60–1.55) | 1.36 (0.83–2.22) | |
| 75 001–100 000 | 0.95 (0.55–1.63) | 0.70 (0.42–1.18) | 0.96 (0.56–1.74) | 0.99 (0.56–1.75) | |
| ≥ 100 001 | 1.87 (0.89–3.97) | 1.06 (0.50–2.23) | 1.25 (0.55–2.84) | 2.06 (0.85–4.96) | |
| School priority of PA | |||||
| 1st–3rd | 1.00 | 1.00 | 1.00 | 1.00 | |
| 4th–6th | 0.95 (0.67–1.35) | 0.84 (0.59–1.18) | 0.74 (0.52–1.05) | 1.30 (0.89–1.89) | |
| 7th–10th | 0.88 (0.53–1.46) | 1.04 (0.62–1.73) | 0.56 (0.32–0.97)Footnote * | 1.85 (1.09–3.14)Footnote * | |
| Missing | 1.25 (0.66–2.38) | 0.63 (0.35–1.15) | 0.72 (0.38–1.39) | 1.73 (0.91–3.29) | |
| Promotes PA events | 0.97 (0.64–1.45) | 1.01 (0.68–1.49) | 0.62 (0.40–0.94)Footnote * | 1.53 (1.00–2.33)Footnote * | |
| Physical environment | |||||
| Location | |||||
| Rural/small urban | 1.00 | 1.00 | 1.00 | 1.00 | |
| Medium urban | 1.01 (0.68–1.50) | 1.26 (0.84–1.89) | 0.79 (0.52–1.18) | 0.97 (0.62–1.52) | |
| Large urban | 1.21 (0.78–1.88) | 1.23 (0.80–1.88) | 0.67 (0.41–1.07) | 0.96 (0.59–1.54) | |
| Curtains available | 0.99 (0.73–1.33) | 0.67 (0.50–0.89)Footnote ** | 1.13 (0.83–1.54) | 1.12 (0.83–1.50) | |
| Secure lockers available | 0.86 (0.54–1.36) | 1.24 (0.80–1.94) | 1.37 (0.84–2.24) | 0.88 (0.53–1.44) | |
| Showers available | 0.62 (0.38–0.99)Footnote * | 1.09 (0.69–1.73) | 0.63 (0.39–1.03) | 0.62 (0.38–1.01) | |
| Partnerships and services | |||||
| Public health | 1.13 (0.84–1.51) | 1.37 (1.05–1.79)Footnote * | 0.80 (0.59–1.10) | 1.06 (0.77–1.45) | |
| Nongovernmental organization | 0.80 (0.63–1.03) | 0.96 (0.75–1.24) | 0.92 (0.69–1.22) | 0.82 (0.63–1.08) | |
| Parks and recreation | 0.96 (0.70–1.31) | 0.88 (0.64–1.21) | 1.33 (0.96–1.85) | 0.85 (0.60–1.21) | |
| Youth organizations | 1.24 (0.89–1.72) | 1.38 (0.97–1.94) | 1.04 (0.73–1.48) | 1.07 (0.75–1.53) | |
| Health and fitness club | 1.07 (0.77–1.47) | 0.97 (0.70–1.33) | 1.22 (0.86–1.73) | 1.21 (0.86–1.70) | |
| Consultant/specialist | 0.93 (0.68–1.27) | 1.18 (0.86–1.62) | 0.99 (0.72–1.37) | 1.14 (0.82–1.58) | |
| Teaching and learning | |||||
| Noncurricular PA programs | |||||
| Intramural and non-competitive | 0.80 (0.55–1.17) | 1.07 (0.73–1.58) | 1.07 (0.72–1.58) | 1.29 (0.85–1.97) | |
| Intramural only | 0.78 (0.51–1.18) | 1.19 (0.77–1.84) | 1.30 (0.82–2.06) | 0.90 (0.56–1.47) | |
| Non-competitive only | 0.95 (0.60–1.51) | 0.84 (0.53–1.33) | 1.13 (0.70–1.83) | 1.32 (0.80–2.19) | |
| None | 1.00 | 1.00 | 1.00 | 1.00 | |
| Healthy school policy | |||||
| Has written policy | 0.82 (0.56–1.19) | 0.99 (0.71–1.38) | 0.82 (0.55–1.21) | 0.85 (0.59–1.23) | |
| Uses data to plan | 1.14 (0.85–1.53) | 1.02 (0.76–1.38) | 0.73 (0.53–1.02) | 0.97 (0.71–1.33) | |
| Access during non-instructional time: | |||||
| Indoor facility | 1.11 (0.78–1.57) | 0.83 (0.59–1.17) | 0.64 (0.45–0.93)Footnote * | 1.06 (0.72–1.57) | |
| Outdoor facility | 0.75 (0.49–1.15) | 0.77 (0.49–1.19) | 0.78 (0.51–1.20) | 0.84 (0.53–1.36) | |
| Equipment | |||||
| Always | 1.20 (0.83–1.73) | 1.56 (1.09–2.22)Footnote * | 1.40 (0.94–2.09) | 1.01 (0.68–1.51) | |
| Sometimes | 1.04 (0.65–1.66) | 1.51 (1.00–2.27)Footnote * | 1.51 (0.94–2.42) | 0.93 (0.60–1.45) | |
| Never | 1.00 | 1.00 | 1.00 | 1.00 | |
| Access after school hours: | |||||
| Gymnasium | 0.72 (0.41–1.26) | 0.90 (0.55–1.47) | 0.79 (0.44–1.45) | 0.50 (0.29–0.86)Footnote * | |
| Indoor facility | 1.26 (0.88–1.81) | 1.01 (0.71–1.45) | 1.26 (0.84–1.89) | 1.38 (0.90–2.10) | |
| Outdoor facility | 1.26 (0.87–1.83) | 1.04 (0.71–1.54) | 1.30 (0.87–1.95) | 1.01 (0.66–1.54) | |
| Equipment | 0.75 (0.49–1.15) | 1.16 (0.78–1.71) | 0.68 (0.42–1.09) | 0.95 (0.61–1.48) | |
| Resources from school board: | |||||
| Staff time | 0.82 (0.60–1.11) | 0.88 (0.66–1.18) | 1.42 (1.02–1.98)Footnote * | 1.00 (0.71–1.41) | |
| Space | 0.98 (0.64–1.51) | 1.11 (0.75–1.65) | 0.62 (0.39–0.97)Footnote * | 1.11 (0.70–1.76) | |
| Budget (CAD) | |||||
| No funding | 1.00 | 1.00 | 1.00 | 1.00 | |
| 1–1000 | 1.15 (0.80–1.64) | 1.29 (0.87–1.92) | 1.29 (0.89–1.89) | 0.84 (0.56–1.27) | |
| ≥ 1001 | 1.00 (0.75–1.33) | 0.92 (0.71–1.21) | 1.25 (0.92–1.70) | 0.81 (0.60–1.10) | |
| Missing | 0.76 (0.47–1.22) | 1.01 (0.64–1.61) | 1.17 (0.72–1.91) | 0.86 (0.52–1.42) | |
Social environment
Female students not achieving the PA recommendations in Y2 had significantly lower odds of achieving them in Y4 if their school gave PA a priority ranking of 7th to 10th in Y2 compared to a priority of 1st to 3rd (adjusted odds ratio [AOR] = 0.56; 95% CI: 0.32–0.97). This group also had lower odds of achieving the recommendations if their school promoted PA events (AOR = 0.62; 95% CI: 0.40–0.94). In contrast, male students not achieving the guidelines in Y2 had higher odds of achieving them in Y4 if their school ranked PA in the lowest priority group (AOR = 1.85; 95% CI: 1.09–3.14) and promoted PA events (AOR = 1.53; 95% CI: 1.00–2.33). For students already achieving the recommendations in Y2, no significant associations were found between the social environment factors in this study and achieving the recommendations in Y4.
Physical environment
Male students achieving the recommendations in Y2 had lower odds of achieving them in Y4 if their school provided curtains in the change room (AOR = 0.67; 95% CI: 0.50–0.89). Female students who were achieving the recommendations had lower odds of achieving them in Y4 if their school provided showers (AOR = 0.62; 95% CI: 0.38–0.99). While not significant, it is notable that both female and male students who were not achieving the recommendations in Y2 were also trending towards lower odds of achieving them in Y4 if their school provided showers (AOR = 0.63; 95% CI: 0.39–1.03 and AOR = 0.62; 95% CI: 0.38–1.01, respectively).
Partnerships and services
Male students achieving the recommendations in Y2 had greater odds of continuing to meet them in Y4 if their school was partnered with public health (AOR = 1.37; 95% CI: 1.05–1.79).
Teaching and learning
There were no significant associations observed between schools offering non-competitive or intramural PA opportunities and student odds of achieving the PA recommendations in Y4 for any of the student strata.
Policy
Looking first at policies for student access during non-instructional time within school hours, female students not achieving the recommendations in Y2 had significantly lower odds achieving them in Y4 if their school provided access to indoor facilities (AOR = 0.64; 95% CI: 0.45–0.93), whereas male students achieving the recommendations in Y2 had higher odds of continuing to meet them if their school provided access to equipment sometimes or always (AOR = 1.51; 95% CI: 1.00–2.27 and AOR = 1.56; 95% CI: 1.09–2.22, respectively). For after-school hours, male students not achieving the recommendations in Y2 had lower odds of achieving them in Y4 if their school provided access to the gymnasium (AOR = 0.50; 95% CI: 0.24–0.86). Finally, considering resources provided by the school board to improve student health, female students not achieving the recommendations in Y2 had higher odds of achieving them in Y4 if their school received staff time to support student health, but lower odds if their school was provided additional space (AOR = 1.42; 95% CI: 1.02–1.98 and AOR = 0.62; 95% CI: 0.39–0.97, respectively).
Discussion
Despite finding that the majority of students in this sample were not achieving all three PA recommendations, some school characteristics within the CSH framework were positively associated with students achieving these recommendations after two years. For students not achieving the recommendations in Y2, one-quarter achieved them two years later; this is a meaningful achievement given the evidence that PA typically declines with age.Footnote 3Footnote 7
Among students achieving the recommendations in Y2, nearly half were no longer attaining this standard after two years, demonstrating a need not only to focus on increasing PA among insufficiently active students, but also to support active students to continue being active. There was a negligible clustering effect for male students already achieving the recommendations in Y2, meaning that male students in this stratum sampled from the same school were just as similar to each other as they were to male students from other schools. While the other student strata also had low ICCs (2%–3%), at a population level, small shifts in behaviour can have a large impact,Footnote 34 and there were school characteristics associated with PA behaviours over time for all four student groups studied.
For the first component of CSH, social and physical environment, the social environment was associated with achieving the PA recommendations only for students not already achieving them at baseline in our sample. Specifically, a school's low prioritization of PA relative to other health-related issues was positively associated with male students achieving the guidelines two years later but negatively associated for female students. This contrasting finding may suggest that school administrators are prioritizing PA based on observed male engagement with PA programming and not female engagement. Another potential explanation is that the health-related issues being prioritized over PA (e.g. tobacco use, cannabis use, bullying) may indirectly increase PA among males more than females.Footnote 35Footnote 36Footnote 37 Another contrasting finding was also observed for the school's promotion of PA events, whereby males attending schools that promoted PA events had higher odds of achieving the recommendations after two years, but female students had lower odds. The consistency in these contrasting male and female results further supports that male PA levels may be driving school prioritization and the types of PA events being promoted, but additional research is needed to better understand the dynamics behind these observed results.
For the physical environment, we unexpectedly found that providing curtains and showers was negatively associated with achieving the guidelines for some student groups. In fact, the provision of showers was the only school-level factor significantly associated with achieving the guidelines for female students already achieving the recommendations in Y2, and it was a negative relationship. Although the association was borderline statistically significant (p = 0.046), the observed odds ratios and confidence intervals were nearly identical across three of the four student strata, which pragmatically suggests there may be a pattern that warrants further examination. There is insufficient information within this study to know the degree of privacy offered in the shower area, but previous research has found that social pressures and psychological discomfort in using showers at school may contribute to students shying away from PA as they progress through puberty.Footnote 38Footnote 39Footnote 40
In addition, male students achieving the recommendations at baseline had lower odds of continuing to achieve them if their school provided privacy curtains in the change room. An in-depth examination is needed into the specific features of the showers and curtains being provided (e.g. degree of privacy) and the social dynamics around their use. For example, there may be bullying or stigma attached to boys who choose to use the curtains or who avoid the showers. Previous studies have shown that boys who withdraw from physical education classes when they are no longer mandatory often make this decision based on experiencing bullying and abuse by peers, not due to a disinterest in PA.Footnote 37
For the second component of CSH, partnerships and services, the results of this study suggest that a public health partnership can be beneficial in supporting active male students in maintaining their PA over time; however, it also suggests that public health materials or other supports being provided may need to be expanded to target other student groups (i.e. female students and male students not already achieving the guidelines). This relationship between partnerships and PA had been reported in a study of middle schools,Footnote 19 but has not been explored in a secondary school sample. This is an important finding, as linking schools with local public health units is both an affordable and a feasible intervention that could be promoted as part of CSH for schools seeking to improve student PA.
For the teaching and learning component of CSH, there were no associations found between providing intramural or non-competitive PA options and students achieving the PA recommendations after two years. This was unexpected, since previous research found that female students were more likely to participate in PA when provided these options.Footnote 40Footnote 41 It may be that these PA offerings only facilitate achieving one or two of the PA recommendations and not all three. While beyond the scope of the work presented here, additional investigation with COMPASS data should explore this hypothesis.
For the policy component of CSH, male students already meeting the recommendations had approximately 50% higher odds of continuing to meet them if their school permitted access to equipment during non-instructional time. However, this relationship was not observed during the after-school period, indicating that the period in which students are permitted access is important for having the desired effect. Receiving staff time for health from the school board was significantly associated with female students transitioning from not achieving the PA recommendations to achieving them two years later. Since it is well-established that female students are significantly less active than males and tend to stop being active at a younger age,Footnote 3Footnote 7 interventions associated with increasing PA among this at-risk group are highly desirable. Further research into how this additional staff time is being used in practice could inform similar approaches for other schools.
Strengths and limitations
Two major strengths of this study were the large cohort of students with linked PA data over time and having data collected simultaneously from the schools they were attending. This unique resource available through COMPASS allowed for a longitudinal analysis of the associations between student PA and many school characteristics within the CSH framework. Another strength was that this exploratory study analyzed many school-level factors simultaneously, which allowed for the relative association of each school-level characteristic with student PA to be compared within the models. This approach has laid the foundation for future research studies. Although this initial study examined a composite outcome of achieving all three PA recommendations, future studies may examine the school characteristics associated with students achieving each type of PA independently (e.g. VPA, muscle and bone strengthening exercises). Also, it was beyond the scope of this study to examine interactions between the school-level variables, but the complexity of these relationships could be examined in future research; for example, whether the association between intramural PA opportunities and student PA is moderated by school SES. Finally, future studies may expand to include schools from other provinces and follow students over a longer period of time.
There were some limitations with this study. First, the self-reported PA data is a limitation, since there can be recall bias and it is known that students tend to underestimate their moderate PA and overestimate their VPA.Footnote 31 However, this is expected to be partially mitigated by the longitudinal nature of the study, since individuals may have a similar degree of self-report bias at both time points and were being compared against their own baseline. Second, there may have been nonresponse bias in the students who did not participate or did not provide complete data; however, there was a high participation rate in COMPASS each year (79%–80%) and missing PA data in this sample was less than 2%. Third, the follow-up period for this longitudinal study was relatively short, which could have produced some of the unexpected findings (e.g. negative association between providing indoor space and achieving the PA recommendations). Fourth, the schools studied were from Ontario and Alberta, and the generalizability to schools from other provinces may be limited due to differences in provincial-level policies (e.g. mandatory physical education credits) or grade-level divisions. Fifth, there were limitations with the school-level data available. There were missing data for some school school-level variables, which was handled using the missing indicator approach,Footnote 32 but using a combined multiple imputation and missing indicator approach may be a better strategy for data missing not at randomFootnote 42 and should be considered in future work. Also, only the baseline school characteristics were included in this study, since there were inadequate data on school-level changes over time for all factors included in the models. Future studies are needed that can incorporate these school-level changes into the longitudinal model.
Conclusion
In conclusion, schools can play a role in supporting students in both achieving the PA recommendations and maintaining them over time, countering the well-documented decline in PA behaviour during this life stage. The significant school-based factors identified in this study were generally affordable, feasible changes (e.g. public health partnership, access to equipment during school hours) that are already being implemented by other schools. The CSH framework can guide schools in providing a health promoting environment for students, but the elements that will be most effective depend on the student subgroup being targeted and the context of the schools themselves.
Acknowledgements
This work was supported by a bridge grant from the Canadian Institutes of Health Research (CIHR) Institute of Nutrition, Metabolism and Diabetes through the "Obesity—Interventions to Prevent or Treat" priority funding awards (OOP-110788; to STL) and an operating grant from the CIHR Institute of Population and Public Health (MOP-114875; to S.T.L). VC is supported by a CIHR New Investigator Salary Award and a Killam Accelerator Research Award.
Conflicts of interest
Scott Leatherdale is an Associate Scientific Editor with the HPCDP Journal, but has recused himself from the review process for this paper. The authors declare there are no other conflicts of interest.
Authors' contributions and statement
MP and SL conceptualized the work; SL and VC led the data acquisition; MP conducted the analysis and all coauthors contributed to the interpretation of the data; MP drafted the paper; all authors contributed to revisions and approved the final manuscript.
The content and views expressed in this article are those of the authors and do not necessarily reflect those of the Government of Canada.